Embed Size (px)
Citation preview
Timing Tax Evasion
Dirk Niepelt
Working Paper 04.07
This discussion paper series represents research work-in-progress and is distributed with the intention to foster discussion. The views herein solely represent those of the authors. No research paper in this series implies agreement by the Study Center Gerzensee and the Swiss National Bank, nor does it imply the policy views, nor potential policy of those institutions.

Timing Tax Evasion∗
Dirk Niepelt†
Institute for International Economic Studies, Stockholm University
andStudy Center Gerzensee
October 2004
Abstract
Standard models of tax evasion implicitly assume that evasion is either fully detected,or not detected at all. Empirically, this is not the case, casting into doubt the traditionalrationales for interior evasion choices. I propose two alternative, dynamic explanations forinterior tax evasion rates: Fines depending on the duration of an evasion spell, and differentvintages of income sources subject to aggregate risk and fixed costs when switched betweenevasion states. The dynamic approach yields a transparent representation of revenue lossesand social costs due to tax evasion, novel findings on the effect of policy on tax evasion, anda tractable framework for the analysis of tax evasion dynamics.
Keywords: Dynamic tax evasion; detection risk; duration dependent fine; inaction range;optimal taxation.JEL Code: E6, H2.
1 Introduction
Illegal, intentional underreporting of income reduces the income tax revenue for the U.S. De-partment of the Treasury by about 15 to 20 percent. In other developed economies, the revenueloss due to tax fraud appears to be of the same order of magnitude, if not larger.1 Not only isthe volume of tax evasion and semi-legal tax avoidance quantitatively important, the elasticityof evasion and avoidance is also high. In fact, evasion and avoidance may be at least as relevantfor tax policy as the labor supply or savings responses on which traditional public finance hasits focus.2
Existing theories of tax evasion emphasize risk aversion or endogenous detection probabilityin order to rationalize the observation that households evade some, but typically not all, taxes.3
∗I have benefited from comments by Emmanuel Saez, three anonymous referees, Per Krusell, Claes Trygger, andparticipants at seminars and the 2002 SED conference. Editorial assistance by Christina Lonnblad is gratefullyacknowledged.
†106 91 Stockholm, Sweden. E-mail: [email protected]; ph: +46 8 162527; fax: +46 8 161443.1For estimates of the tax gap in the U.S. and other countries, see Andreoni, Erard and Feinstein (1998) or
Slemrod and Yitzhaki (2002) and the sources cited therein. These estimates abstract from hypothetical taxrevenues from illegal sources of income; see also Cowell (1990).
2See, for example, MaCurdy (1992), Slemrod (1992), Feldstein (1995), Agell, Englund and Sodersten (1996),and Auerbach and Slemrod (1997).
3The seminal papers are Allingham and Sandmo (1972) and Yitzhaki (1974), building on Becker’s (1968) work.Andreoni et al. (1998) and Slemrod and Yitzhaki (2002) review the literature.
1

None of these factors is sufficient, however. In fact, the finding of an interior evasion rate in thestandard model crucially depends on the implicit assumption that evasion is either fully detected,triggering fines proportional to the total amount of taxes evaded, or not detected at all. Whilecentral for existing theories of tax evasion, this “all-or-nothing” assumption is often implausible(for example in the context of internationally diversified financial investments) and at odds withthe data (see below). But relaxing the assumption and replacing it with the opposite extremeof uncorrelated detection risk, results in a corner solution because risk aversion or endogenousdetection probability no longer give rise to convex costs of evasion.
This paper argues that there are other forces at work that push towards an interior evasionrate, and that these forces arise from dynamic considerations. I explore two mechanisms: Thefirst relies on fines upon detection of evasion that depend on the duration of an evasion spell.Such fines, for example as a function of the cumulative evaded tax, imply that privately optimalevasion choices are characterized by a stopping time: Income is first evaded, and later reported,in order to maximize the expected return net of taxes, fines and other costs. The secondmechanism relies on a cross-section of vintages of otherwise identical income sources that aresubject to aggregate return risk and fixed costs when switched between evasion states (i.e.,between being declared or not declared to the tax authority). These fixed costs imply that oldsources of income are only sluggishly switched between evasion states, while the status of newsources immediately responds to shocks. In equilibrium, the evasion rate is typically interior,displays hysteresis, and strongly responds to changes in various institutional parameters.
The potential importance of dynamic considerations for a household’s tax evasion strategyhas been noted before. Allingham and Sandmo (1972, section 5) discuss an extension of theirstatic argument, with detection of evasion triggering investigations on prior reporting by thetax authority. Engel and Hines (1999) document the empirical relevance of such a link betweendetection and investigations on prior reporting. They propose a model where this link operatesover one period. The settings of both Allingham and Sandmo (1972) and Engel and Hines (1999)combine dynamic and static sources of convex evasion costs. This makes it difficult to identifythe exact role played by the different assumptions, and it precludes closed form solutions. Themodel considered here carefully distinguishes between the various aspects rendering the cost oftax evasion convex. The focus on dynamic considerations generates a transparent representationof revenue losses and social costs due to tax evasion; it yields closed form solutions; and it allowsus to analyze an extension with aggregate risk, and with households rationally accounting forthat risk.
The remainder of the paper is structured as follows: Section 2 clarifies the central role playedby the “all-or-nothing” assumption in the standard model, motivates the dynamic approachadopted in the paper, and relates it to the traditional setup. Section 3 analyzes the effect ofduration dependent fines. Section 4 turns to the environment with aggregate risk, and Section5 concludes.
2 Detection Risk
Consider the tax evasion program of a household at a given point in time. The household ownsmany sources of income, indexed by i = 1, . . . , I, that pay a constant return, normalized to r/I.One way of considering the sources of income is in terms of dollars deposited to (potentiallymany different) savings accounts paying a uniform pre-tax yield, another is in terms of hoursallocated to (potentially different) jobs paying a uniform pre-tax wage.
2

For each i, the household chooses whether to declare the source of income to the tax authority.Choice of the former option is denoted by ei = 1, choice of the latter by ei = 0; e denotes thevector of evasion decisions. Declaring i to the tax authority implies that a tax, amounting tothe fraction τ of the income generated by i, must be paid. Not declaring i to the tax authorityimplies that a fine, amounting to the fraction π of the income generated by i, must be paid tothe tax authority if evasion is detected. To make the problem interesting, I assume that π > τ .Detection occurs randomly. Denote by δi = 1 the event that the tax authority scrutinizes incomesource i (triggering payment of a fine if i was evaded) and by δi = 0 the event of no scrutiny.Further, let δ denote the vector of detection events. The realization of δ does not only dependon exogenous sources of uncertainty but also, potentially, on the household’s evasion decision,e; f(δ|e) denotes the probability of a particular realization δ, conditional on the evasion choicee.
The household’s objective is to maximize expected utility of consumption, where consump-tion equals income after taxes and fines. Letting u(·) denote the utility function, this programcan be stated as
maxe
∑
δ
u
(
I∑
i=1
[1 − τ + ei(τ − δiπ)]r/I
)
f(δ|e).
In the models of Allingham and Sandmo (1972) and Yitzhaki (1974), tax evasion is eithernot detected at all, or fully detected. Under this “all-or-nothing” assumption (which imposes arestriction on the conditional probabilities f(·|e)4), expected utility of the household equals
(1 − p(e))u
(
I∑
i=1
[1 − τ + eiτ ]r/I
)
+ p(e)u
(
I∑
i=1
[1 − τ + ei(τ − π)]r/I
)
,
with p(e) denoting the probability of full detection. The cost of tax evasion is convex, andthe evasion rate is thus interior (ei 6= ej for some i, j), if either the household is risk averseor p increases in ei, i = 1, . . . , I.5 If the household is risk averse, the increased volatility ofconsumption due to a higher evasion rate renders evasion increasingly costly. If p increases in e,a higher evasion rate raises the marginal expected fine, once more rendering evasion increasinglycostly.6 If neither the first nor the second condition is satisfied, the tax evasion program yields acorner solution, since the expected net benefit of an increase in the evasion rate is independentof that rate.
Both traditional rationales for an interior evasion rate crucially depend on the “all-or-nothing” assumption. To see this more clearly, consider the opposite case with i.i.d. detectionrisk across all sources of income. Formally, the restriction on f(·|e) which is implicit in themodels of Allingham and Sandmo (1972) and Yitzhaki (1974) is replaced by the assumptionthat each δi, i = 1, . . . , I, is independent of e, as well as i.i.d. according to g(·) say, the marginaldistribution of every individual detection event. Letting z denote the fraction of non-reportedsources of income, z ≡∑i ei/I, expected consumption equals
r(1 − πzg(1) − τ(1 − z)),
4The restriction is the following: For any i, j, if ei = ej = 1 then f(δ|e) = 0 for all δ featuring δi 6= δj . Thiscondition is satisfied, for example, if the tax authority either scrutinizes all sources of income, or none.
5The second condition is satisfied, for example, if the tax authority adopts a two-step procedure to investigatetax evasion. In the first step, it randomly picks one source of income and checks whether income from thatparticular source was declared. If this was not the case, then the authority scrutinizes all other sources of incomein a second step.
6A small increase in the evasion rate only triggers a small increase in the detection risk, but detection triggersincreasingly large fines since these are proportional to total evaded income.
3

and the variance of consumption converges to zero for I → ∞, due to statistical independence.Uncorrelated detection risk across many sources of income thus implies that the household isperfectly insured—higher evasion does not increase the volatility of consumption. It also impliesthat expected consumption is linear in z—higher evasion does not increase the marginal expectedfine. As a consequence, the optimal evasion rate in the static model is not interior, even if thehousehold is risk averse, and although the probability of evasion being detected is increasing inthe evasion rate.
The crucial role of the “all-or-nothing” assumption in the static model is disturbing. For once,the assumption appears inconsistent with empirical evidence, according to which tax evasion istypically not fully detected, even conditional on a taxpayer being audited (Andreoni et al.,1998).7 Moreover, it often is not very plausible. After all, many situations are characterized byweakly rather than fully correlated detection risk. This is particularly true in situations wherehouseholds diversify their sources of income, as for example financial investments. Arguably,tax authorities push for more wide-ranging international information-sharing, exactly becauseuncorrelated detection risk removes the threat of consumption volatility, and thereby fosters taxevasion.8
This paper offers two dynamic explanations that are able to reconcile uncorrelated detectionrisk with interior evasion choices (for individual types of income). First, fines that are increas-ing in the duration of a tax evasion spell because detection triggers fines proportional to thecumulative evaded tax; in the above equation, this amounts to π increasing over time. Second, across-section of vintages of otherwise identical income sources that are subject to aggregate riskand fixed costs when switched between evasion states. These dynamic factors result in convexevasion costs when detection risk is uncorrelated, but they can also generate interior evasionrates under much more general conditions, and in combination with other sources of convexity.To keep the analysis transparent, however, I focus on the benchmark case where the results areexclusively driven by these dynamic aspects. In other words, I exclude all sources of convexitypresent in the static model. As discussed earlier, this is consistent with three alternative sets ofassumptions:
i. Risk neutrality, detection “all-or-nothing” and independent of e; or
ii. risk neutrality and uncorrelated detection risk across many sources of income; or
iii. risk aversion and uncorrelated detection risk across many sources of income.
In the setting without aggregate risk considered in Section 3, the results hold under any of thesethree sets of assumptions. In the setting with aggregate risk considered in Section 4, however,the assumption of risk aversion would introduce substantial complications. Therefore, I imposerisk neutrality in that section, consistent with either i. or ii.
7Andreoni et al. (1998, p. 850) report that conditional on an audit by the U.S. Internal Revenue Service,approximately one half of the concealed income typically remains undetected.
8See, for example, recent proposals by the European Commission (2001, Proposal 400, http://europa.eu.int/comm/ taxation customs/ proposals/ taxation/ tax prop.htm#COM2001400) that EU member states shouldprovide each other with information on interest income accrued to their residents (instead of just taxing at thesource), or the OECD (1998) proposal on information measures to counteract “harmful tax competition”.
4

3 Duration Dependent Fines
3.1 The Model
I analyze the household’s dynamic tax evasion program in continuous time. Households discountthe future at rate ρ. They face a time invariant tax system, a constant pre-tax yield r (0 < r < ρ)on their sources of income, or “capital”, and a constant detection rate λ on any unit of capital notdeclared to the tax authorities. Uncorrelated detection risk reduces the tax evasion strategy toone of maximizing the expected return after taxes and fines; as discussed earlier, risk neutrality(i. or ii.) has the same implication. The fundamental unit of analysis is therefore the unit ofcapital, not the individual household.9
A unit of capital is characterized by two properties: First, whether income from the unit isreported to the tax authority, for brevity referred to as “in state w”, or not, referred to as “instate v”; second, by the time t that has passed since the unit was last switched between statesv and w. There is a fixed cost k per unit of capital for voluntarily switching between state wand state v, capturing the cost of disguising the sudden appearance or disappearance of incomesources in the tax declaration.10 Such a cost might arise, for example, because an advisor hasto be hired who knows how to convincingly make a case vis-a-vis the tax authority. Or it mayarise because hiding capital and letting it reappear involves some transactions that temporarilyreduce the return. The statutory tax rate is τ > 0. The dividend yield thus equals r for unitsof capital neither declared nor detected, and r(1 − τ) for truthfully reported ones.
A unit of capital switched to state w remains in that state for a minimum duration of T .This assumption cuts short on a micro founded argument according to which paying taxes hassome private benefit of reducing potential future fines, for example by creating a reputationof “honesty” discouraging investigations by the tax authority in case of detection during asuccessive evasion spell (see Appendix A.1 for an exposition).
Units of capital in state v are detected at the rate λ. Upon detection, two actions aretriggered. First, the tax authority starts an audit and investigates for how long income fromthat particular source has been evaded. The fine π(t), assumed to be a smooth function, accountsfor (some of the) prior evaded tax payments, such that π′(t) > 0. Second, the unit must beswitched from state v to state w.
Denote the value of one unit of capital in state (v, t) by V (t) and the value of one unit ofcapital in state (w, t) by W (t). Upon detection, the continuation value of one unit of capital instate (v, t) is given by −π(t) +W (0). Moreover,
W (t) =
∫ T
t
e−ρ(x−t)r(1 − τ) dx+ e−ρ(T−t)W (T ) =
= e−ρ(T−t)
(
W (T ) − r(1 − τ)
ρ
)
+r(1 − τ)
ρ, (1)
W (T ) = maxy≥0
∫ y
0e−ρxr(1 − τ) dx+ e−ρy[V (0) − k]. (2)
The first condition defines the value of a unit of capital in state (w, t) as the present discountedvalue of payoffs from the unit. The second condition defines the value of a unit of capital instate (w, T ): If tax evasion is profitable, households will switch from state w to state v as soonas they can, implying y = 0 and W (T ) = V (0) − k. If households choose not to immediately
9This excludes, for example, progressive taxation or household-specific investigations by the tax authority.10The assumption that the switching cost is the same in both directions can easily be relaxed.
5

switch from state w to state v after duration T , they will never switch, y = ∞. In this case,W (T ) = W (0) = W (t) = r(1 − τ)/ρ.
To derive V (t), consider the value of a unit of capital in state (v, t) that may not be switchedto state w before the infinitesimally small time span dt has passed. Denote this value by V (t),and denote by s the time span after which switching from state v to state w is optimal. Clearly,V (t) = V (t) for t < s. As long as t < s, the value of a non-reported unit of capital withspell duration t therefore equals the flow payoff, r dt, plus the probability weighted discountedcontinuation values in case of detection and no detection, respectively. We thus have
V (t) = limdt→0
r dt+ e−ρ dt[(1 − λ dt)V (t+ dt) + λ dt(W (0) − π(t+ dt))], t < s,
implying that a unit in state (v, t) must satisfy the following standard no-arbitrage relationship:
(ρ+ λ)V (t) = r + V ′(t) + λ(−π(t) +W (0)), t < s. (3)
Equation (3) is derived in Appendix A.2. It states that, for t < s, a unit of capital in state (v, t)must pay the risk adjusted required return, ρ+ λ, in the form of either flow payoffs or expectedcapital gains. If the optimal stopping time s is finite, the household must be indifferent betweenkeeping a unit of capital in state (v, s) and switching it to state (w, 0):
V (s) = W (0) − k if s <∞. (4)
The fundamental, bubble free solution of (3) is therefore given by
V (t) =
∫ s
t
e−(ρ+λ)(x−t)(r + λ(−π(x) +W (0))) dx+ e−(ρ+λ)(s−t)(W (0) − k), t < s. (5)
Either T or k must be strictly positive for the dynamic tax evasion problem to be welldefined. If both parameters were equal to zero, households could switch capital from state v tostate w after an infinitesimally short duration (to “reset” the fine to π(0)) and then immediatelyback to state v. A strictly positive value for k induces households to keep the capital in statev for some time before switching it to state w. However, it does not induce them to keep itin state w for some time.11 In contrast, a strictly positive value for T enforces a minimumduration in state w. It also induces households to keep capital in state v for some time beforeswitching it to state w, even if k is zero. Throughout this section, I assume T > 0, k ≥ 0,implying that the optimal duration s is bounded away from zero, provided that tax evasionis profitable at all. An interior solution for s results if taxes are evaded and if (from (5))∫∞
te−(ρ+λ)(x−t)(r + λ(−π(x) +W (0))) dx < W (0) − k for some t > 0, such that s <∞.The optimal stopping time s can be obtained by combining conditions (1), (2), and (5) with
the smooth pasting condition V ′(s) = 0 (see Dixit and Pindyck, 1994).12 Alternatively, onemay maximize the function V0(s), defined as V (0) subject to conditions (1), (2), and (5). Thisfunction is given by13
V0(s) =
{
−λ∫ s
0e−(ρ+λ)xπ(x) dx+ q(s)
(
r + λr(1 − τ)
ρ(1 − e−ρT )
)
+
(
r(1 − τ)
ρ(1 − e−ρT ) − k
)
e−(ρ+λ)s − k(λe−ρT q(s) + e−ρT−(ρ+λ)s)
}
/
(
1 − λe−ρT q(s) − e−ρT−(ρ+λ)s)
,
11If it is optimal to switch capital to state v at some point, then it is optimal to do so as soon as possible.12Combined with (4), the smooth pasting condition implies (ρ + λ)(W (0) − k) = r + λ(−π(s) + W (0)).13See Appendix A.3.
6

with q(s) ≡∫ s
0 e−(ρ+λ)xdx = 1−e−(ρ+λ)s
ρ+λ. The optimal duration of a tax evasion spell is then
characterized by the condition V ′0(s) = 0.14 In the remainder of this section, I assume that
limt→∞ π′(t)/π(t) < ρ + λ, implying the integral term in V0(s) to be bounded. Since all otherterms in V0(s) are also bounded and the denominator is strictly positive, V0(s) is bounded.15
The difference between r/ρ, the social value of one unit of capital in the absence of taxevasion, and V0(s) reflects the present discounted value of taxes and fines as well as switchingcosts. These two present discounted values are recursively defined by, respectively,
PDVτ,π(s) =
∫ s
0e−ρxf(x)
[
π(x) +
∫ T
0e−ρyrτdy + e−ρT PDVτ,π(s)
]
dx
+ (1 − F (s))e−ρs
[∫ T
0e−ρyrτdy + e−ρT PDVτ,π(s)
]
,
PDVk(s) =
∫ s
0e−ρxf(x)
[
e−ρT (k + PDVk(s))]
dx+ (1 − F (s))e−ρs[
k + e−ρT (k + PDVk(s))]
.
Here, f(x) and F (x) denote the p.d.f. and c.d.f. of an exponential(λ) distribution, respectively.Straightforward manipulations yield
PDVτ,π(s) =λ∫ s
0 e−(ρ+λ)xπ(x)dx+(
λq(s) + e−(ρ+λ)s)
rτρ
(1 − e−ρT )
1 − λe−ρT q(s) − e−ρT−(ρ+λ)s, (6)
PDVk(s) = kλe−ρT q(s) + e−(ρ+λ)s(1 + e−ρT )
1 − λe−ρT q(s) − e−ρT−(ρ+λ)s. (7)
Based on (6) and (7), the effective tax-plus-fine rate, θ(s) ≡ PDVτ,π(s)ρ/r, and the switching-cost rate, κ(s) ≡ PDVk(s)ρ/r, can be defined.16 We then have
V0(s) =r(1 − θ(s) − κ(s))
ρ,
which yields yet another representation of the tax evasion program, conditional on tax evasionbeing more profitable than full compliance: mins θ(s) + κ(s).
Proposition 1. Let π(0) = 0, π′(t) ≥ 0, π′′(t) ≥ 0 ∀t ≥ 0; moreover π′(0) > 0 or π′′(0) > 0(strict convexity implies these conditions). Under the maintained assumptions
i. there exists a unique, finite s⋆ > 0 that minimizes θ(s) + κ(s);
ii. there exists a unique, finite s⋄ > 0 that minimizes θ(s);
iii. if k > 0, then s⋄ < s⋆ and θ(s⋆) > θ(s⋄);
iv. households evade taxes if θ(s⋆) + κ(s⋆) < τ .
Proof. See Appendix A.4.
14Combined with (4), this latter condition reduces to the smooth pasting condition.15Note that 0 ≤ q(s) < 1/(ρ + λ) and the denominator of V0(s) equals 1 − e−ρT (ρe−(ρ+λ)s + λ)/(ρ + λ).16Equivalently, κ(s) can be derived as −k ∂V0(s)/∂k
r/ρ.
7

If there exist stopping times s such that θ(s) + κ(s) < τ , then households evade taxes.Once the marginal benefit from continued evasion in the form of tax savings and lower averageswitching costs is outweighed by the expected fine, households switch capital back to state w.Under the assumptions of Proposition 1, this is generally the case after a finite duration, s⋆.17
Since households minimize the expected sum of taxes, fines, and switching costs, the privatelyoptimal tax evasion strategy does not minimize the government’s tax and fine collections, aslong as k is strictly positive.
Figures 1 and 2 display a numerical example under the assumption that the fine is given byπ(t) = α(ert − er(1−τ)t), α > 1.18 Such a fine is natural to consider; it requires, upon detection,repayment of α times the exact accumulated amount gained by tax evasion. It also satisfies theassumptions of the Proposition. In this example, s⋆ turns out to be approximately 8.58. SinceV0(s
⋆) ≈ 0.64 exceeds r(1−τ)/ρ = 0.56 (or τ exceeds θ(s⋆)+κ(s⋆)), households optimally evadetaxes until duration s⋆, or until the evasion is detected.
5 10 15 20t;s
0.55
0.575
0.625
0.65
0.675
0.7
Figure 1: V (t)[s⋆] (downward sloping section of line only), V0(s), W (0)[s] − k (in order ofdecreasing length of line segments).
3.2 Comparative Statics and Optimal Policy
An increase in the statutory tax rate τ increases s⋆ and thus, the average duration of tax evasionbecause
∂θ′(s)
∂τ< 0,
∂κ′(s)
∂τ= 0.
17While real world tax laws often imply an initially increasing fine, they also frequently feature a statute oflimitation that applies to offences committed more than t periods in the past. With such a statute of limitation,the fine π(t) becomes min[π(t), π(t)], thereby contradicting the assumptions of the Proposition. As a consequence,the optimal duration s⋆ need no longer be finite.
18The parameter values in the example are: λ = 0.05; ρ = 0.05; r = 0.04; τ = 0.3; T = 5; k = 0.01; α = 1.475.The choice of α is inspired by empirical evidence discussed in the following section.
8

5 10 15 20s
0.1
0.2
0.3
0.4
Figure 2: τ , θ(s), κ(s), θ(s) + κ(s) (in order of decreasing length of line segments).
This result contrasts with the finding in static models, where a higher statutory tax rate mighthave ambiguous effects (Allingham and Sandmo, 1972; Yitzhaki, 1974). While these modelsstress the income and substitution effects of changes in τ on the demand for state contingentconsumption, the dynamic perspective proposed here stresses the effect on expected returns:A higher statutory tax rate induces households to wait longer, and face higher expected finesbefore switching to reporting accrued income.
Other comparative statics results can easily be derived. The derivations become particularlysimple under the convenient assumption that T → ∞ (i.e., once a unit of capital is in state w,income from that unit is never again evaded), which implies that W (t) is independent of s⋆,such that the circular effect of V (0) via W (0) on V (0) disappears. We then have
limT→∞
V0(s) = −λ∫ s
0e−(ρ+λ)xπ(x) dx+ q(s)
(
r + λr(1 − τ)
ρ
)
+
(
r(1 − τ)
ρ− k
)
e−(ρ+λ)s,
limT→∞
θ(s) =ρ
rλ
∫ s
0e−(ρ+λ)xπ(x)dx+
(
λq(s) + e−(ρ+λ)s)
τ,
limT→∞
κ(s) =ρ
rke−(ρ+λ)s
and the optimal tax evasion strategy simplifies to
limT→∞
s⋆ = π−1
(
rτ + (ρ+ λ)k
λ
)
.
Increases in r, τ, ρ, or k raise s⋆, because they increase the benefit of not paying taxes (givenby rτ) and the cost of switching to state w. A decrease in λ raises s⋆, because it reduces theexpected cost of evasion, by rendering detection less likely.
Switching costs borne by households and detection efforts by the government are sociallywasteful. From an optimal taxation perspective, the former play a similar role as the deadweight
9

burden associated with tax induced substitution effects. In parallel to the optimal taxation liter-ature initiated by Ramsey (1927), the government’s problem of efficiently raising revenue subjectto the household’s optimal evasion choice may thus be considered. In the current setup, thisproblem assumes a very transparent form. Following the approach pioneered by Diamond andMirrlees (1971), it may be analyzed in terms of the household’s indirect utility function, which isto be maximized subject to the government’s budget constraint. Let α ≡ (λ, k, T, τ, π(·))19, lets⋆(α) denote the arg mins θ(s, α) + κ(s, α), and let 1[s⋆(α)>0] denote the indicator function thatequals 1 if s⋆(α) > 0. Normalizing by the household’s stock of capital and r/ρ, the governmentprogram reads
maxα
1 − θ(s⋆(α), α) − 1[s⋆(α)>0]κ(s⋆(α), α)
s.t. θ(s⋆(α), α) = C(α) + PDV(normalized government spending).
The first line represents the household’s indirect utility function: Normalized utility equals1 − θ(0, α) = 1 − τ in case of no evasion and 1 − θ(s⋆(α), α) − κ(s⋆(α), α) otherwise. Due tothe separability of θ and κ, the social losses of tax evasion appear in much more transparentform than the social losses of tax avoidance in standard models. The second line represents thenormalized budget constraint where the cost function C(·) depends on the parameters of thetax system. Letting µ denote the shadow value of government funds and confining ourselves toan interior equilibrium with tax evasion, the first-order condition for this problem is given by
µCα = θα(µ− 1) − κα + s⋆α(θs(µ− 1) − κs) =
= θα(µ− 1) − κα + s⋆αθsµ,
where all derivatives are evaluated at (s⋆, α). The left-hand side of this equation represents thecost for the government of a marginal increase in any of the tax parameters. The right-handside represents the net gain from the same adjustment. This gain consists of higher revenue,evaluated at the shadow value of government funds, minus the income loss for the household dueto taxes, fines, and switching costs; these changes in government revenue and private incomeoccur both directly and indirectly, i.e., through an induced change in s⋆.20
Should the government employ a strictly positive switching cost k, if it can influence thisparameter?21 The government’s optimality condition suggests a negative answer to that ques-tion, subject to qualifications. Starting from an initial value k = 0, a marginal increase in k isdetrimental. It neither delivers a direct revenue gain for the government (θk = 0 from (6)), noran indirect one (for k = 0, κs(s
⋆, α) = −θs(s⋆, α) = 0 by the household’s optimality condition)
but induces first-order switching costs and administrative costs (κk > 0, Ck ≥ 0). For furtherincreases in k, however, this argument need no longer hold as θs is then positive.
19For notational simplicity, I assume that π(·) can be represented as a vector.20If policy changes involved no direct resource cost (Cα = 0, as generally assumed in the optimal taxation
literature) and neither directly nor indirectly affected switching costs (κα = 0, and κs = 0 such that θs = 0 bythe household’s optimality condition), then µ would equal unity: the shadow values of public and private fundswould coincide and the government could costlessly transfer resources from the private to the public sector.
21One way for the government to affect k could be to demand more background information on units of capitalthat newly appear in or disappear from the tax declaration.
10

4 Aggregate Risk
4.1 Inaction and Hysteresis
To analyze the dynamic properties of tax evasion rates, it is necessary to go beyond the sta-tionary environment discussed above. This section extends the previous model to a setting withaggregate risk under the maintained assumptions that households optimally evade taxes andform rational expectations. As explained earlier, I assume risk neutrality to keep the modeltractable.
Aggregate risk arises in the form of dividend yield (or productivity) risk. I assume the returnon capital to fluctuate randomly around an average value, r. The relative deviation of the returnfrom r, denoted by r, follows the mean reverting Ito process
dr = −ηr dt+ σ dZ, η, σ > 0,
with dZ denoting the increment of a standard Brownian motion, and t denoting calendar time.I assume switching costs to be strictly positive. When deciding whether to declare income
to the tax authority, households trade off these costs against the benefit of switching capitalfrom state v to state w, or vice versa. Since these benefits depend on expected future dividendyields (and thus on the current yield), they vary stochastically over time. Even in the absence ofduration dependent fines, the tax evasion program is therefore non-trivial. For simplicity, I thuscompletely abstract from duration dependent fines and let T = 0; the duration of an evasionspell is no longer a relevant state variable.
As in models of entry and exit under uncertainty, switching costs give rise to an inactionrange. Households do not immediately switch capital from state w to state v when the net flowbenefit from a unit in state v exceeds the flow from a unit in state w, i.e., when the dividendyield is high, such that the tax savings due to evasion are high. Nor do they immediately switchcapital from state v to state w when the dividend yield is low, such that the net flow benefitfrom a unit in state w exceeds the flow from a unit in state v. They would rather wait untilthe difference between the two flows has become sufficiently large to compensate for two costcomponents: First, “annualized” switching costs, and second, the cost of foregoing the possibilityof costlessly returning to the current (pre-switching) state. This second cost component reflectsthe risk that the difference between the flow benefits quickly reverts, such that incurring theswitching cost becomes unprofitable ex post.22 Each cost component drives a wedge betweenthe upper boundary of the inaction range, rh say (associated with the dividend yield r(1+ rh)),at which it is optimal to switch from state w to state v, and the lower boundary, rl, at which itis optimal to switch from state v to state w. The presence of an inaction range, in turn, givesrise to hysteresis: The effect of a change in r on tax evasion is not immediately reversed if rreturns to its initial value. Even if r is such that all new units of capital are reported to the taxauthority, say, old units may still not be reported if the flow benefit differential is not sufficientlylarge. The fraction of taxes evaded therefore typically remains interior.
As in the previous section, optimal household behavior can be characterized by the valuesof a unit of capital in state v and state w. Also as in the previous section, these values areinterdependent. The two value functions (which now depend on the new state variable, r) mustthus be solved simultaneously. Within the inaction range, these functions are characterized by
(ρ+ λ)V (r) = r(1 + r) − V ′(r)ηr + 1/2V ′′(r)σ2 + λ(−π(r) +W (r)) − ψ, (8)
ρW (r) = (1 − τ(r))r(1 + r) −W ′(r)ηr + 1/2W ′′(r)σ2. (9)
22See Dixit (1989) for a detailed exposition.
11

Equations (8) and (9) represent no-arbitrage conditions, similar to (3). The required return onone unit of capital equals ρ + λ if the unit is subject to detection risk, and ρ otherwise. Thereturn consists of flow dividends, pre or after tax, expected capital losses due to detection riskin the case of V , and expected capital gains or losses due to changes in dividend yield (seeAppendix A.5 for the derivation). Equation (8) features an additional flow cost parameter, ψ,which serves calibration purposes and is discussed below.
As noted earlier, switching costs and dividend risk imply that entry and exit into/from taxevasion are characterized by an inaction range, [rl, rh]: Switching capital from state v to statew (from state w to state v) is optimal once r reaches the lower (upper) boundary of that range.To characterize rl and rh, the value matching and smooth pasting conditions need to be solved.The former state that switching occurs when the values of both alternatives, net of switchingcosts, are equal: V (rh) − kh = W (rh) and W (rl) − kl = V (rl).23 The latter specify that theseequalities extend to small variations around the optimal trigger points and thus, that there is nogain from delaying the switching decision for an infinitesimally short duration: V ′(rh) = W ′(rh),V ′(rl) = W ′(rl).24
Since we are not interested in the functions V (r) and W (r) per se, but only in the optimaldecision rules, we can simplify this problem. Let X(r) ≡ V (r) − W (r). The no-arbitrageconditions and the value matching and smooth pasting conditions can then be rewritten as
(ρ+ λ)X(r) = τ(r)r(1 + r) − λπ(r) −X ′(r)ηr + 1/2X ′′(r)σ2 − ψ, (10)
X(rh) = kh, X(rl) = −kl, X ′(rh) = 0, X ′(rl) = 0.
Consider a linear tax rate function τ(r) = τ0+τ1r and let fines be some multiple ζ of currentlyevaded taxes, π(r) = ζτ(r)r(1 + r). As argued below, this is a realistic assumption; note thatλζ needs to be smaller than unity for there to be an incentive to evade taxes. Appendix A.6shows that in this case, the solution to equation (10) is of the form
X(r) = A 1F1
(
ρ+ λ
2η,1
2,r2η
σ2
)
+Br
√
2η
σ2 1F1
(
ρ+ λ+ η
2η,3
2,r2η
σ2
)
+ φ0 + φ1r
√
2η
σ2+ φ2r
2 2η
σ2.
(11)A and B denote arbitrary constants; φ0, φ1, and φ2 denote functions of the parameters, specifiedin Appendix A.6; and 1F1(·) denotes the confluent hyper-geometric function or Pochhammer’sfunction. The four value matching and smooth pasting conditions together with (11) can besolved for the four unknowns A,B, rh, rl.
Figure 3 displays an example. The boundaries of the inaction range are rl ≈ −22.5 percentand rh ≈ 6.6 percent. If new units of capital are assigned to states v or w with equal cost, thennew units are assigned to state v whenever r exceeds the value at which X(r) equals zero; inthe figure, this value is ≈ 0.5 percent. Call that value rc (rl < rc < rh). Old units of capitalare not immediately switched between states v and w, once r reaches rc, however. Householdsrather wait with switches of that sort until r reaches the upper or lower boundary of the inactionrange.
Figure 3 and the benchmark simulation reported below are based on the parameter valuessummarized in Table 1. I assume a yearly discount rate of 5 percent. This approximatelytranslates into ρ = 0.0125 (in the model, time is measured in quarters). Slemrod and Yitzhaki
23In contrast to the previous section, I allow the switching costs on the upper and lower boundary of the inactionrange to differ.
24See Dixit (1993) or Dixit and Pindyck (1994).
12

-0.2 -0.15 -0.1 -0.05 0.05r
-0.05
-0.04
-0.03
-0.02
-0.01
0.01
Figure 3: X(r), benchmark calibration.
(2002) and Andreoni et al. (1998, p. 820) report for the U.S. that 1.5 to 1.7 percent of the taxreturns are audited per year, which translates into a flow detection rate of λ = 0.00375. Theyalso report that fines are levied at rates between 20 and 75 percent of the evaded income tax.The mean of these values translates into ζ = 1.475 (which satisfies the condition λζ < 1). Itake the statutory tax rate, τ0, to be 30 percent. With regard to switching costs, I assume thatit is easier to let a unit of capital “disappear” than “reappear” vis-a-vis the tax authorities; Iset kl = 0.05 and kh = 0.01. I assume the average annual yield on capital, broadly defined, tobe 20 percent, and the annual growth rate of the capital stock (introduced later in the model)to be 3 percent. This implies r = 0.05 and γ = 0.0075. To calibrate η and σ, I use standardassumptions from the Real Business Cycle literature about the persistence and volatility of theSolow residual. An AR(1)-regression on quarterly U.S. data of the Solow residual yields anauto-regressive coefficient of about 0.95, and a standard deviation of the innovation term ofabout 1 percent (see, for example, Hansen, 1985). These estimates imply a mean reversion andvariance rate of the diffusion process of η = 1 − 0.95 and σ2 = 0.0122η/(1 − e−2η) = 0.0102512,respectively (Dixit and Pindyck, 1994, p. 77). Finally, I set ψ = rτ0(1−λζ) = 0.014917, implyingthat under normal conditions, the difference between the flow benefit of a unit of capital in statev and a unit in state w is zero. This is to account for the fact that the model obviously doesnot comprise all relevant factors determining the amount of tax evasion.25 Fixing ψ at a lowervalue twists the inaction range towards lower (negative) values of r, reflecting the fact that thesmall risk of detection in the benchmark calibration renders tax evasion very lucrative.
Variations in the parameter values shift the inaction range in Figure 3 or change its width.An increase in σ widens the inaction range. A more volatile dividend yield increases the optionvalue of waiting and thus, induces households to wait “longer” before incurring the switchingcosts. A rise in η also increases the width of the inaction range (almost exclusively by reducingrl). Stronger mean reversion reduces the likelihood of persistent deviations of the fundamental
25Beyond the factors analyzed in static models or in the previous section of this paper, tax evasion might dependon mental costs and many other aspects, see Cowell (1990).
13
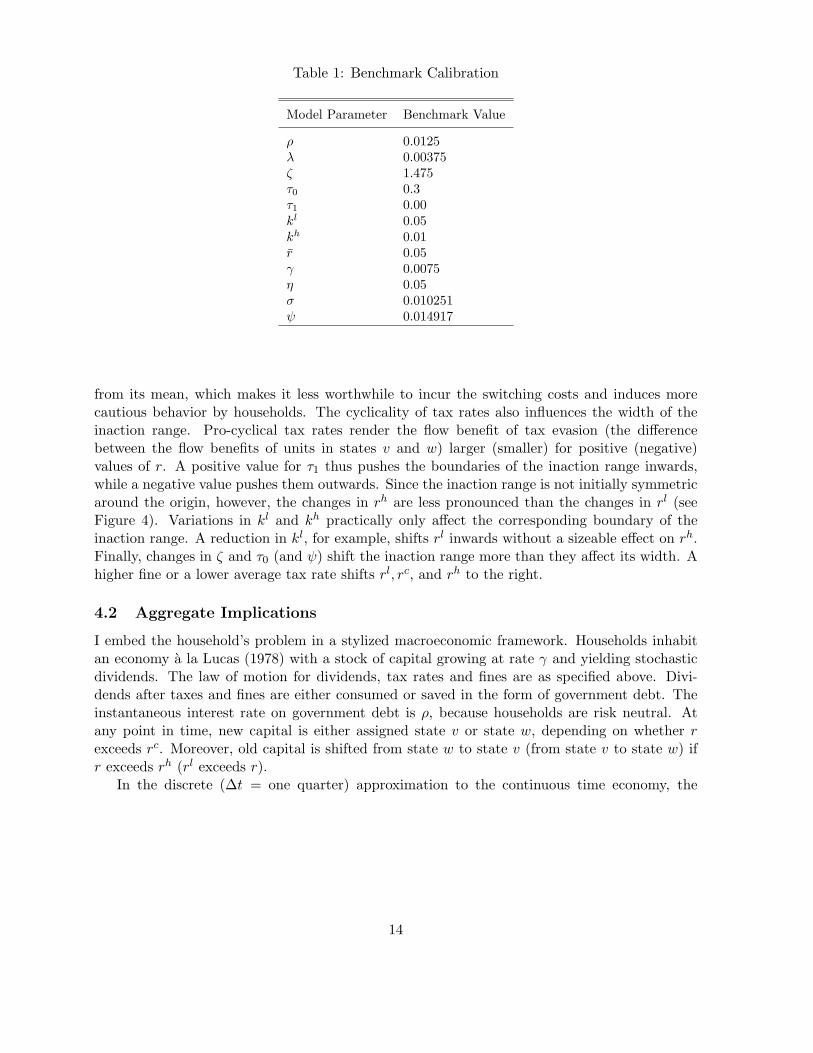
Table 1: Benchmark Calibration
Model Parameter Benchmark Value
ρ 0.0125λ 0.00375ζ 1.475τ0 0.3τ1 0.00kl 0.05kh 0.01r 0.05γ 0.0075η 0.05σ 0.010251ψ 0.014917
from its mean, which makes it less worthwhile to incur the switching costs and induces morecautious behavior by households. The cyclicality of tax rates also influences the width of theinaction range. Pro-cyclical tax rates render the flow benefit of tax evasion (the differencebetween the flow benefits of units in states v and w) larger (smaller) for positive (negative)values of r. A positive value for τ1 thus pushes the boundaries of the inaction range inwards,while a negative value pushes them outwards. Since the inaction range is not initially symmetricaround the origin, however, the changes in rh are less pronounced than the changes in rl (seeFigure 4). Variations in kl and kh practically only affect the corresponding boundary of theinaction range. A reduction in kl, for example, shifts rl inwards without a sizeable effect on rh.Finally, changes in ζ and τ0 (and ψ) shift the inaction range more than they affect its width. Ahigher fine or a lower average tax rate shifts rl, rc, and rh to the right.
4.2 Aggregate Implications
I embed the household’s problem in a stylized macroeconomic framework. Households inhabitan economy a la Lucas (1978) with a stock of capital growing at rate γ and yielding stochasticdividends. The law of motion for dividends, tax rates and fines are as specified above. Divi-dends after taxes and fines are either consumed or saved in the form of government debt. Theinstantaneous interest rate on government debt is ρ, because households are risk neutral. Atany point in time, new capital is either assigned state v or state w, depending on whether rexceeds rc. Moreover, old capital is shifted from state w to state v (from state v to state w) ifr exceeds rh (rl exceeds r).
In the discrete (∆t = one quarter) approximation to the continuous time economy, the
14

-0.2 -0.1 0.1r
-0.05
-0.04
-0.03
-0.02
-0.01
0.01
Figure 4: Effect of cyclicality of tax rates on X(r): τ1 = −0.75, 0, 0.75 (in order of increasinglength of line segments).
following laws of motion hold:
rt = e−ηrt−1 + ht, ht = ±σ with equal probability,
τt = τ0 + τ1rt,
Tt = r(1 + rt)τtwt,
Πt = r(1 + rt)τtζλvt,
gt = gT (Tt + Πt) + gddt,
δt = ρdt − Tt − Πt + gt,
dt+1 = dt + δt,
ct = r(1 + rt)(wt + vt) + ρdt − Tt − Πt − δt = r(1 + rt)(wt + vt) − gt,
wt+1 − wt = +λvt + 1[r<rl]vt(1 − λ)(1 − kl) − 1[r>rh]wt + (1 − 1[r>rc])Γ0(1 + γ)t,
vt+1 − vt = −λvt − 1[r<rl]vt(1 − λ) + 1[r>rh]wt(1 − kh) + 1[r>rc]Γ0(1 + γ)t.
Here, vt and wt denote the time t stock of non-reported and reported capital, respectively; Tt,Πt, gt, δt, dt, and ct denote tax collections, fines, government spending, deficit, debt, and pri-vate consumption, respectively; and 1[q] represents the indicator function for event q. The firstequation of the dynamic system discretely approximates the diffusion process for r (see Dixitand Pindyck, 1994, pp. 69, 76). The following three equations define the statutory tax rate,tax collections, and fines, respectively. Government spending is assumed to linearly dependon revenue and the stock of debt. In the simulations, I set gT = 1.1 and gd = −0.03.26 The
26On a balanced growth path, this spending rule and the definitions of dt and δt imply
(γ − ρ − gd)dt = (gT − 1)(Tt + Πt).
The values for gT and gd satisfy this equation for quarterly debt and tax-and-fine quotas of 160 percent and 40percent, respectively.
15

next three equations define the government’s deficit, debt accumulation, and household con-sumption.27 The last two equations link the household’s optimality conditions (the boundariesof the inaction range as well as rc) to the accumulation of reported and non-reported capital,respectively. With a total stock of capital in period t = 0 equal to 1 and Γ0 ≡ γ/(1 + γ), theinflow of new capital in period t equals Γ0(1 + γ)t. I also set d0 = 0.
0 1000 20000.035
0.04
0.045
0.05
0.055
0.06yield, trigger values
0 1000 20000
0.5
1tax rate
0 1000 20000
0.5
1w / (v+w)
0 1000 20000
0.005
0.01
0.015taxes / (v+w)
0 1000 20000
0.5
1x 10
−4 fines / (v+w)
0 1000 20000
0.005
0.01
0.015(taxes+fines) / (v+w)
0 1000 20000
0.02
0.04
0.06
0.08debt / (v+w)
0 1000 20000
0.02
0.04
0.06
0.08g / (v+w)
0 1000 20000
0.02
0.04
0.06
0.08c / (v+w)
Figure 5: Tax evasion dynamics.
Figure 5 illustrates the aggregate consequences of a sequence of 2000 realizations of thedividend yield. The upper left panel displays the dividend yield realizations, together with thehousehold’s optimal trigger points (rl, rc, rh), subject to the stochastic properties of the process rand the tax system. If r exceeds rc, households allocate new capital to state v, which is reflectedin a decrease in wt/(vt + wt). If the dividend yield also exceeds r(1 + rh), all capital is shiftedto state v and wt drops to zero. The corresponding fall in tax revenue strongly outweighs theincrease in fines and leads to a sharp drop in government spending, and a significant reductionin the debt quota. On the other hand, the increase in households’ disposable income togetherwith the fall in the government’s borrowing requirement increases consumption. Note that wenever observe sharp increases in the fraction of reported wealth in this sample because rl issufficiently low to never induce households to fully report their wealth.
When evaluating the simulation, in particular the high volatility of key macroeconomic vari-ables, it should be kept in mind that the model abstracts from various elements that wouldreduce this volatility. One such element is risk aversion, another relates to the fact that largefractions of income cannot be evaded in practice, because the tax authorities are directly no-
27Interest income from government bonds is assumed to be untaxed.
16

tified about them (for instance, by the employer).28 Nevertheless, several conclusions can bedrawn from this benchmark simulation. First, the macroeconomic responses to changes in rare highly non-linear, due to different behavioral responses within the inaction range and at itsboundaries. Second, the macroeconomic time series display asymmetry, due to the fact thatonly the upper boundary of the inaction range is “tested”. Finally, relatively small variationsin r can have a large impact. This finding sharply contrasts with the prediction of the standardtax evasion model, where tax evasion is governed by a succession of static evasion decisions. Inthat framework, small changes in the conditional expectation of future income flows will onlyindirectly and mildly affect the evasion decision.
Table 2 and Figures 6–9 summarize the effects of changes in tax policy on macroeconomicperformance. Throughout these scenarios, the sequence of dividend yields driving the aggregatedynamics is the same as in the benchmark scenario.
Table 2: Effects of Different Tax Policies
Variable Effects of Change in . . . a
τ1 to . . . kl to . . . ζ to . . . τ0 to . . .
-0.75 0.75 0.3 0.1 5.475 9.475 0.295 0.305
mean(vt + wt) 1.0003 0.9999 1.0000 0.9973 1.0026 1.0026 1.0026 0.9990mean(wt/(vt + wt)) 1.0699 0.9182 1.0000 1.0519 1.8176 1.8405 1.8273 0.2551mean(Tt) 0.9998 1.0204 1.0000 1.2923 1.8091 1.8265 1.7873 0.3313mean(Πt) 1.0061 0.9697 1.0000 0.6385 0.0788 0.0000 0.0106 1.8482mean(gt) 0.9996 1.0201 1.0000 1.3071 1.8172 1.8348 1.7953 0.3451mean(ct) 1.0005 0.9960 1.0000 0.9381 0.8467 0.8434 0.8509 1.1240d2000 0.9933 1.0189 1.0000 1.7014 2.1716 2.2014 2.1498 0.4986
a Relative to the outcome in the benchmark scenario. See the explanations in the text.
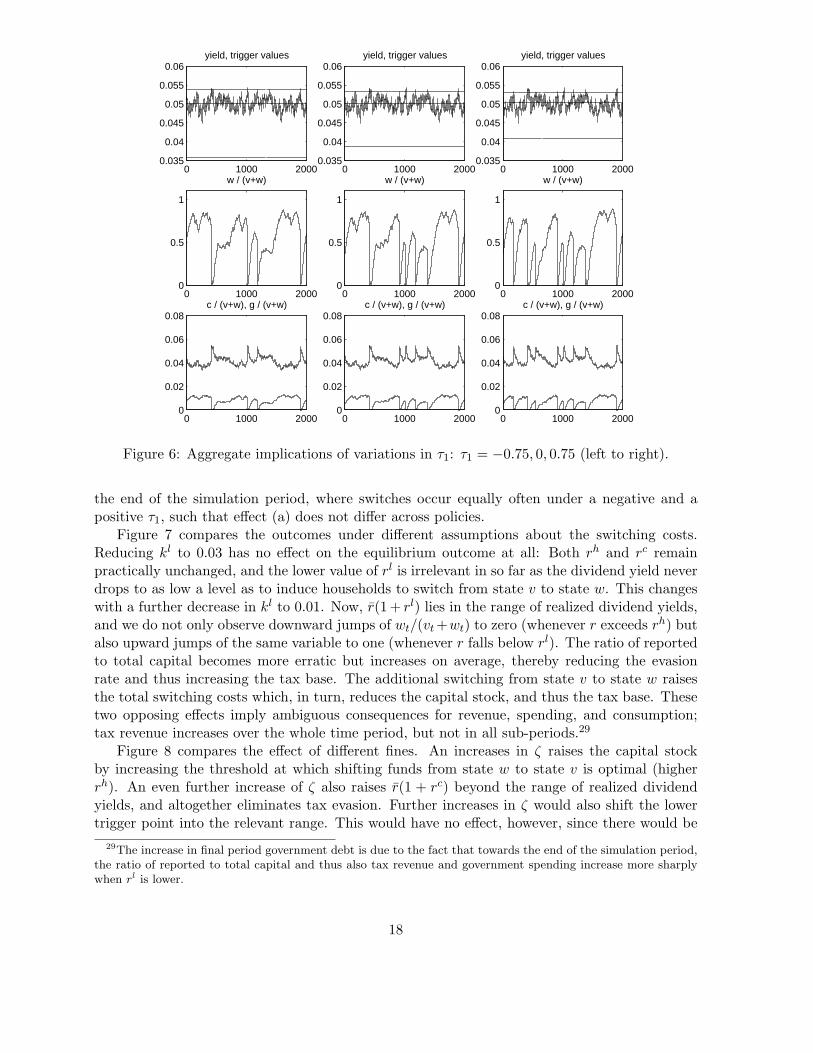
Consider first the effect of changes in the cyclicality of the tax rate (Figure 6). We sawearlier (cf. Figure 4) that a counter-cyclical tax rate pushes the boundaries of the inaction rangeoutwards. Households thus less often switch their capital from state w to state v, which increasesthe capital stock due to lower total switching costs. In addition to reducing the frequency ofswitches, a negative τ1 also reduces the trigger value rc. This implies that households becomemore aggressive in terms of allocating new funds to state v. In “normal times” (with r aroundrc), the inflow into the reported capital stock is thus lower. The combination of (a) less frequentswitching into state v but (b) larger direct flows into state v implies that the effect of thecyclicality of τ on both tax revenue and fines is ambiguous. Channel (a) increases the capitalstock and the fraction of reported income, and thus tends to raise tax revenue and reduce fines.Channel (b) reduces the fraction of reported income and thus tends to reduce tax revenue andraise fines. Which of the two effects is predominant is history dependent and varies with thecircumstances. The growth rate of the economy, for example, is of importance because it affectsthe strength of channel (b). In the particular simulation example considered here, effect (b)outweighs effect (a) on average, but not in all sub-periods. Effect (b) becomes decisive towards
28Andreoni et al. (1998, p. 821) report for the U.S. that the Internal Revenue Service receives direct notificationabout approximately 75 percent of all income.
17
0 1000 20000.035
0.04
0.045
0.05
0.055
0.06yield, trigger values
0 1000 20000.035
0.04
0.045
0.05
0.055
0.06yield, trigger values
0 1000 20000.035
0.04
0.045
0.05
0.055
0.06yield, trigger values
0 1000 20000
0.5
1
w / (v+w)
0 1000 20000
0.5
1
w / (v+w)
0 1000 20000
0.5
1
w / (v+w)
0 1000 20000
0.02
0.04
0.06
0.08c / (v+w), g / (v+w)
0 1000 20000
0.02
0.04
0.06
0.08c / (v+w), g / (v+w)
0 1000 20000
0.02
0.04
0.06
0.08c / (v+w), g / (v+w)
Figure 6: Aggregate implications of variations in τ1: τ1 = −0.75, 0, 0.75 (left to right).
the end of the simulation period, where switches occur equally often under a negative and apositive τ1, such that effect (a) does not differ across policies.
Figure 7 compares the outcomes under different assumptions about the switching costs.Reducing kl to 0.03 has no effect on the equilibrium outcome at all: Both rh and rc remainpractically unchanged, and the lower value of rl is irrelevant in so far as the dividend yield neverdrops to as low a level as to induce households to switch from state v to state w. This changeswith a further decrease in kl to 0.01. Now, r(1 + rl) lies in the range of realized dividend yields,and we do not only observe downward jumps of wt/(vt +wt) to zero (whenever r exceeds rh) butalso upward jumps of the same variable to one (whenever r falls below rl). The ratio of reportedto total capital becomes more erratic but increases on average, thereby reducing the evasionrate and thus increasing the tax base. The additional switching from state v to state w raisesthe total switching costs which, in turn, reduces the capital stock, and thus the tax base. Thesetwo opposing effects imply ambiguous consequences for revenue, spending, and consumption;tax revenue increases over the whole time period, but not in all sub-periods.29
Figure 8 compares the effect of different fines. An increases in ζ raises the capital stockby increasing the threshold at which shifting funds from state w to state v is optimal (higherrh). An even further increase of ζ also raises r(1 + rc) beyond the range of realized dividendyields, and altogether eliminates tax evasion. Further increases in ζ would also shift the lowertrigger point into the relevant range. This would have no effect, however, since there would be
29The increase in final period government debt is due to the fact that towards the end of the simulation period,the ratio of reported to total capital and thus also tax revenue and government spending increase more sharplywhen rl is lower.
18

0 1000 20000.035
0.04
0.045
0.05
0.055
0.06yield, trigger values
0 1000 20000.035
0.04
0.045
0.05
0.055
0.06yield, trigger values
0 1000 20000.035
0.04
0.045
0.05
0.055
0.06yield, trigger values
0 1000 20000
0.5
1
w / (v+w)
0 1000 20000
0.5
1
w / (v+w)
0 1000 20000
0.5
1
w / (v+w)
0 1000 20000
0.02
0.04
0.06
0.08c / (v+w), g / (v+w)
0 1000 20000
0.02
0.04
0.06
0.08c / (v+w), g / (v+w)
0 1000 20000
0.02
0.04
0.06
0.08c / (v+w), g / (v+w)
Figure 7: Aggregate implications of variations in kl: kl = 0.05, 0.03, 0.01 (left to right).
no non-reported capital to be shifted from state v to state w to start with. By discouragingswitches from state w to state v, the first increase in ζ raises the capital stock. Moreover, thereduction, and finally the elimination of tax evasion, strongly amplifies the positive effect ontax revenue, raises government spending and debt, and reduces private consumption. It alsosignificantly reduces the volatility of these variables.
Finally, Figure 9 shows that the economy is located on the declining portion of the Laffercurve. A small increase in the average tax rate from 29.5 percent to 30.5 percent shifts theinaction range downward by about fifty basis points. This, in turn, induces a near collapse ofgovernment activity. Tax revenue falls by more than eighty percent. Payments of fines skyrocketbut total government revenue collapses and government spending is contracted.
In conclusion, the simulations suggest that tax evasion dynamics severely complicate thegovernment’s task. The high sensitivity of tax evasion and its history dependence require sureinstinct by the government, and some luck. Once tax evasion starts to occur, tax policy becomesdifficult, and once it starts to spread, the sustainability of government activity is quickly at risk.
5 Conclusions
While risk aversion and endogenous detection probability do not guarantee interior solutions toa household’s tax evasion program, dynamic aspects tend to induce interior tax evasion rates.Two dynamic lines of argument have been explored in the paper: The first is based on durationdependent fines, the second on a cross-section of vintages subject to dividend risk and switchingcosts. Both arguments imply behavioral responses different from those predicted by standard
19

0 1000 20000.035
0.04
0.045
0.05
0.055
0.06yield, trigger values
0 1000 20000.035
0.04
0.045
0.05
0.055
0.06yield, trigger values
0 1000 20000.035
0.04
0.045
0.05
0.055
0.06yield, trigger values
0 1000 20000
0.5
1
w / (v+w)
0 1000 20000
0.5
1
w / (v+w)
0 1000 20000
0.5
1
w / (v+w)
0 1000 20000
0.02
0.04
0.06
0.08c / (v+w), g / (v+w)
0 1000 20000
0.02
0.04
0.06
0.08c / (v+w), g / (v+w)
0 1000 20000
0.02
0.04
0.06
0.08c / (v+w), g / (v+w)
Figure 8: Aggregate implications of variations in ζ: ζ = 1.475, 5.475, 9.475 (left to right).
theory. Static models stress the income and substitution effects of changes in the statutory taxrate on the demand for state-contingent consumption. The dynamic perspective proposed inthis paper stresses the maximization of expected returns—a higher statutory tax rate encourageshouseholds to wait longer before they report their accrued income. This prediction is testable.While beyond the scope of this paper, a careful empirical analysis controlling for the variousother aspects affecting households’ evasion decisions thus seems a promising avenue for futureresearch.
Throughout the analysis, I have abstracted from risk aversion. This was unimportant in themodel without dividend risk where households are fully insured. In the model with dividendrisk, however, the assumption was substantive. Introducing risk aversion here would complicatethe household’s portfolio choice problem, and change the riskfree rate on government debt.30
Other potential extensions include heterogeneous costs or benefits of tax evasion across thepopulation, or multiple sources of aggregate risk.31 Introducing such considerations is likely todampen the volatility observed in the simulations without changing the flavor of the arguments.Finally, an interesting extension would generalize the government’s spending rule, allowing forthe possibility of default. Interest on government debt would then include a risk premium, whichvaries with the level of debt and the anticipated extent of tax evasion. Such a model could, Isuspect, enhance our understanding of fiscally driven crises.
30For related work in the finance literature, see Constantinides (1986), Grossman and Laroque (1990), andVayanos (1998).
31An example for the latter extension that immediately comes to mind is the combination of nominal interestrate risk and inflation rate risk.
20

0 1000 20000.035
0.04
0.045
0.05
0.055
0.06yield, trigger values
0 1000 20000.035
0.04
0.045
0.05
0.055
0.06yield, trigger values
0 1000 20000.035
0.04
0.045
0.05
0.055
0.06yield, trigger values
0 1000 20000
0.5
1
w / (v+w)
0 1000 20000
0.5
1
w / (v+w)
0 1000 20000
0.5
1
w / (v+w)
0 1000 20000
0.02
0.04
0.06
0.08c / (v+w), g / (v+w)
0 1000 20000
0.02
0.04
0.06
0.08c / (v+w), g / (v+w)
0 1000 20000
0.02
0.04
0.06
0.08c / (v+w), g / (v+w)
Figure 9: Aggregate implications of variations in τ0: τ0 = 0.295, 0.3, 0.305 (left to right).
A Appendix
A.1 Micro Foundations for T > 0
To rationalize the assumption that T > 0, a duration dependent benefit of paying taxes mustbe introduced. One way is the following. Assume as in the main model that tax evasion paysa flow return of r and exposes the unit of capital to a risk of detection, which triggers durationdependent fines and a switch to w. In addition, assume that the duration at the start of a newevasion spell is not necessarily zero as in the main model; it rather depends on the duration ofthe previous spell of tax payments. Paying taxes thus constitutes an investment in good-will orreputation, reducing expected fines in the successive tax evasion spell.
To avoid the introduction of an additional state variable, posit that the duration of a taxpaying spell reduces the “effective duration” in the successive tax evasion spell by one-to-one.The accumulation of reputation thus reduces t, while evasion increases t; both V (t) and W (t)are decreasing in their argument. It is then optimal to keep a unit of capital in v until theeffective duration has increased to some value, t say, and keep it in w until the effective durationhas decreased to some other value, t say. Between these trigger points, the value of a unit ofcapital in v and w, respectively, is characterized by
(ρ+ λ)V (t) = r + V ′(t) + λ(−π(t) +W (t0)), t ≤ t ≤ t,
ρW (t) = r(1 − τ) −W ′(t), t ≤ t ≤ t,
as well as the value matching and smooth pasting conditions V (t) = W (t) − k, V ′(t) = W ′(t),V (t) = W (t) + k, V ′(t) = W ′(t).
21

For π(t) = 0, and T = t− t, the setup of the main model is replicated.
A.2 Derivation of Equation (3)
Let U(t+ dt) ≡ (1− λ dt)V (t+ dt) + λ dt(W (0)− π(t+ dt)). Using the differentiability of V (t),we then have
V (t) = limdt→0
r dt+ e−ρ dtU(t+ dt), t < s,
V (t) = limdt→0
r dt+ (1 + ρ dt)−1U(t+ dt), t < s, (using ρ dt ≈ ln(1 + ρ dt))
limdt→0
(1 + ρ dt)V (t) = limdt→0
r dt(1 + ρ dt) + U(t+ dt), t < s,
limdt→0
(λ+ ρ) dtV (t) = limdt→0
r dt(1 + ρ dt) + [U(t+ dt) − (1 − λ dt)V (t)], t < s,
limdt→0
(λ+ ρ) dtV (t) = limdt→0
r dt(1 + ρ dt) + [(1 − λ dt)V ′(t) dt+ λ dt(W (0) − π(t+ dt))], t < s,
(λ+ ρ)V (t) = limdt→0
r(1 + ρ dt) + [(1 − λ dt)V ′(t) + λ(W (0) − π(t+ dt))], t < s,
(ρ+ λ)V (t) = r + V ′(t) + λ(−π(t) +W (0)), t < s.
A.3 Derivation of V0(s)
Under the assumption s > 0: From (5), we have
V (0) =
∫ s
0e−(ρ+λ)x(r + λ(−π(x) +W (0))) dx+ e−(ρ+λ)s(W (0) − k).
From (1), (2) this implies
V0(s) =
∫ s
0e−(ρ+λ)x
[
r + λ
(
−π(x) +
[
e−ρT
(
W (T ) − r(1 − τ)
ρ
)
+r(1 − τ)
ρ
])]
dx+
e−(ρ+λ)s(W (0) − k) =
=
∫ s
0e−(ρ+λ)x
[
r + λ
(
−π(x) +
[
e−ρT
(
V0(s) − k − r(1 − τ)
ρ
)
+r(1 − τ)
ρ
])]
dx+
e−(ρ+λ)s
[
e−ρT
(
V0(s) − k − r(1 − τ)
ρ
)
+r(1 − τ)
ρ− k
]
=
=
∫ s
0e−(ρ+λ)x(r − λπ(x)) dx+ λ
r(1 − τ)
ρ(1 − e−ρT )q(s) +
λ(V0(s) − k)e−ρT q(s) +
(
r(1 − τ)
ρ(1 − e−ρT ) − k
)
e−(ρ+λ)s + (V0(s) − k)e−ρT−(ρ+λ)s,
V0(s) =
{
−λ∫ s
0e−(ρ+λ)xπ(x) dx+ q(s)
(
r + λr(1 − τ)
ρ(1 − e−ρT )
)
+
(
r(1 − τ)
ρ(1 − e−ρT ) − k
)
e−(ρ+λ)s − k(λe−ρT q(s) + e−ρT−(ρ+λ)s)
}
/
(
1 − λe−ρT q(s) − e−ρT−(ρ+λ)s)
.
22

A.4 Proof of Proposition 1
I assume throughout that ρ, λ, T > 0 and k, s ≥ 0. Denote the denominator of (6) or (7) byD(s). We have that D(s) > 0, D′(s) > 0. The derivatives of θ(s) and κ(s) are given by
θ′(s) =e−(ρ+λ)s
D(s)2ρ
r
[
D(s)λπ(s) − rτ(1 − e−ρT ) − λρe−ρT
∫ s
0e−(ρ+λ)xπ(x)dx
]
,
κ′(s) =e−(ρ+λ)s
D(s)2kρ
r
[
λ(e−ρT − 1) − ρ(1 + e−ρT )]
< 0,
such that
θ′(s) + κ′(s) =e−(ρ+λ)s
D(s)2ρ
r
[
D(s)λπ(s) − λρe−ρT
∫ s
0e−(ρ+λ)xπ(x)dx− Ψ(k)
]
,
with Ψ(k) > 0,Ψ′(k) > 0, and Ψ(k) independent of s. Denote the term in square brackets inthe last expression by S(s).
i. S(0) < 0. S′(s) = λ(D′(s)π(s) +D(s)π′(s)) − λρe−ρT e−(ρ+λ)sπ(s) = λD(s)π′(s) ≥ 0, (>0 for s > 0). Moreover, lims→∞ S′(s) is bounded away from zero because lims→∞D(s) >D(0) > 0. By continuity, there exists a unique, finite s⋆ > 0 such that S(s⋆) = 0. Sincee−(ρ+λ)s
D(s)2ρr> 0, s⋆ minimizes θ(s) + κ(s).
ii. The above argument holds for any k ≥ 0. For k = 0, κ(s) = 0 ∀s.
iii. By the above argument, s⋆ increases in Ψ(k) and thus, in k. Since s⋆ = s⋄ for k = 0,s⋆ > s⋄ and θ′(s⋆) > θ′(s⋄) for k > 0.
iv. Households evade taxes if the minimal tax-plus-fine and switching-cost rates sum to lessthan the statutory tax rate.
A.5 Derivation of Equations (8), (9)
Derivation for a value function M(r) with a flow payoff φ(r) and a flow probability ν of switchingto the other state with the associated value function N(r). Within the inaction range, we have
M(r) = limdt→0
φ(r) dt+ (1 + ρ dt)−1E[(1 − ν dt)M(r + dr) + ν dtN(r + dr)]
or, equivalently,
limdt→0
(ρ+ ν) dtM(r) = limdt→0
φ(r)(1 + ρdt) dt+ E[(1 − ν dt)dM(r) + ν dt(N(r) + dN(r))].
By Ito’s lemma and dr = −ηr dt+ σ dZ,
EdM(r) = −M ′(r)ηr dt+ 1/2M ′′(r)σ2 dt,
and parallel for EdN(r). Dividing by dt and taking the limit, we find that
(ρ+ ν)M(r) = φ(r) −M ′(r)ηr + 1/2M ′′(r)σ2 + νN(r).
Equations (8) and (9) follow by direct substitution for M(r), N(r), φ(r), and ν.
23

A.6 Solution of the ODE (10)
Let a ≡ 2η/σ2 > 0; b ≡ 2(ρ + λ)/σ2 > 0; and c ≡ b/a. To solve the homogeneous part of (10),we must find a function x(r) solving
x′′(r) − arx′(r) − bx(r) = 0.
Let z ≡ r√a and y(z) ≡ x(r). An equivalent representation of the homogeneous equation is
y′′(z) − zy′(z) − cy(z) = 0;
see Kamke (1956, 2.54). The solution to this equation is
yh(z) = A 1F1
(
c
2,1
2,z2
2
)
+Bz 1F1
(
1 + c
2,3
2,z2
2
)
,
for A,B arbitrary constants and 1F1(·) the confluent hyper-geometric function or Pochhammer’sfunction; see Kamke (1956, 2.44).
A particular solution to the original ODE in the modified representation,
y′′(z)η − ηzy′(z) − (ρ+ λ)y(z) = −(1 − λζ)r
(
τ0 +τ0 + τ1√
az +
τ1az2
)
+ ψ,
is given by yp(z) = φ0 + φ1z + φ2z2 with
φ0 =(1 − λζ)rτ0 − ψ + σ2rτ1(1−λζ)
2η+λ+ρ
λ+ ρ,
φ1 =(1 − λζ)r(τ0 + τ1)√
a(η + λ+ ρ),
φ2 =(1 − λζ)rσ2τ12η(2η + λ+ ρ)
.
The solution to the original ODE in the modified representation is thus y(z) = yh(z) + yp(z),subject to the value matching and smooth pasting conditions y(zh) = kh, y′(zh) = 0, y(zl) =−kl, y′(zl) = 0. Solutions for the four unknowns A,B, zh, zl can be numerically obtained.Solutions for rh, rl follow directly. Alternatively, one derives X(r) from y(z) and solves X(r)and the value matching and smooth pasting conditions numerically for A,B, rh, rl.
References
Agell, J., Englund, P. and Sodersten, J. (1996), ‘Tax reform of the century—the Swedish exper-iment’, National Tax Journal 49(4), 643–664.
Allingham, M. G. and Sandmo, A. (1972), ‘Income tax evasion: A theoretical analysis’, Journal
of Public Economics 1(3/4), 323–338.
Andreoni, J., Erard, B. and Feinstein, J. (1998), ‘Tax compliance’, Journal of Economic Liter-
ature 36(2), 818–860.
Auerbach, A. J. and Slemrod, J. (1997), ‘The economic effects of the tax reform act of 1986’,Journal of Economic Literature 35(2), 589–632.
24

Becker, G. S. (1968), ‘Crime and punishment: An economic approach’, Journal of Political
Economy 76(2), 169–217.
Constantinides, G. M. (1986), ‘Capital market equilibrium with transaction costs’, Journal of
Political Economy 94(4), 842–862.
Cowell, F. A. (1990), Cheating the Government: The Economics of Evasion, MIT Press, Cam-bridge, Massachusetts.
Diamond, P. A. and Mirrlees, J. A. (1971), ‘Optimal taxation and public production I: Produc-tion efficiency’, American Economic Review 61(1), 8–27.
Dixit, A. (1989), ‘Entry and exit decisions under uncertainty’, Journal of Political Economy
97(3), 620–638.
Dixit, A. K. (1993), The art of smooth pasting, Vol. 55 of Fundamentals of Pure and Applied
Economics, Harwood Academic Publishers, Chur.
Dixit, A. K. and Pindyck, R. S. (1994), Investment under Uncertainty, Princeton UniversityPress, Princeton.
Engel, E. M. R. and Hines, J. R. (1999), Understanding tax evasion dynamics, Working Paper6903, NBER, Cambridge, Massachusetts.
Feldstein, M. (1995), ‘The effect of marginal tax rates on taxable income: A panel study of the1986 tax reform act’, Journal of Political Economy 103(3), 551–572.
Grossman, S. J. and Laroque, G. (1990), ‘Asset pricing and optimal portfolio choice in thepresence of illiquid durable consumption goods’, Econometrica 58(1), 25–51.
Hansen, G. D. (1985), ‘Indivisible labor and the business cycle’, Journal of Monetary Economics
16(3), 309–327.
Kamke, E. (1956), Differentialgleichungen: Losungsmethoden und Losungen, 5. edn, Geest &Portig, Leipzig.
Lucas, R. E. (1978), ‘Asset prices in an exchange economy’, Econometrica 46(6), 1429–1445.
MaCurdy, T. (1992), ‘Work disincentive effects of taxes: A reexamination of some evidence’,American Economic Review, Papers and Proceedings 82(2), 243–249.
OECD (1998), Harmful Tax Competition: An Emerging Global Issue, OECD, Paris.
Ramsey, F. P. (1927), ‘A contribution to the theory of taxation’, Economic Journal 37(145), 47–61.
Slemrod, J. (1992), ‘Do taxes matter? Lessons from the 1980’s’, American Economic Review,
Papers and Proceedings 82(2), 250–256.
Slemrod, J. and Yitzhaki, S. (2002), Tax avoidance, evasion, and administration, in A. J. Auer-bach and M. Feldstein, eds, ‘Handbook of Public Economics’, Vol. 3, Elsevier Science,Amsterdam, chapter 22, pp. 1423–1470.
25

Vayanos, D. (1998), ‘Transaction costs and asset prices: A dynamic equilibrium model’, Review
of Financial Studies 11(1), 1–58.
Yitzhaki, S. (1974), ‘A note on income tax evasion: A theoretical analysis’, Journal of Public
Economics 3(2), 201–202.
26