Embed Size (px)
Citation preview
Lodging Industry Update
Times Are Good……
April 28, 2017
Mark Woodworth – Senior Managing Director
CBRE Hotels’ Americas Research
……Will They Get Better?

GLOBAL RESEARCH AND CONSULTING ● ECONOMETRIC ADVISORS
Bright Horizons..…
Dusty Dawns
The Agenda
• The Economy
• The Impact of New Supply
• The Year Ahead for Luxury • Buyers and Sellers Markets
• Our Forecasts
How Was the Economy in 2016?
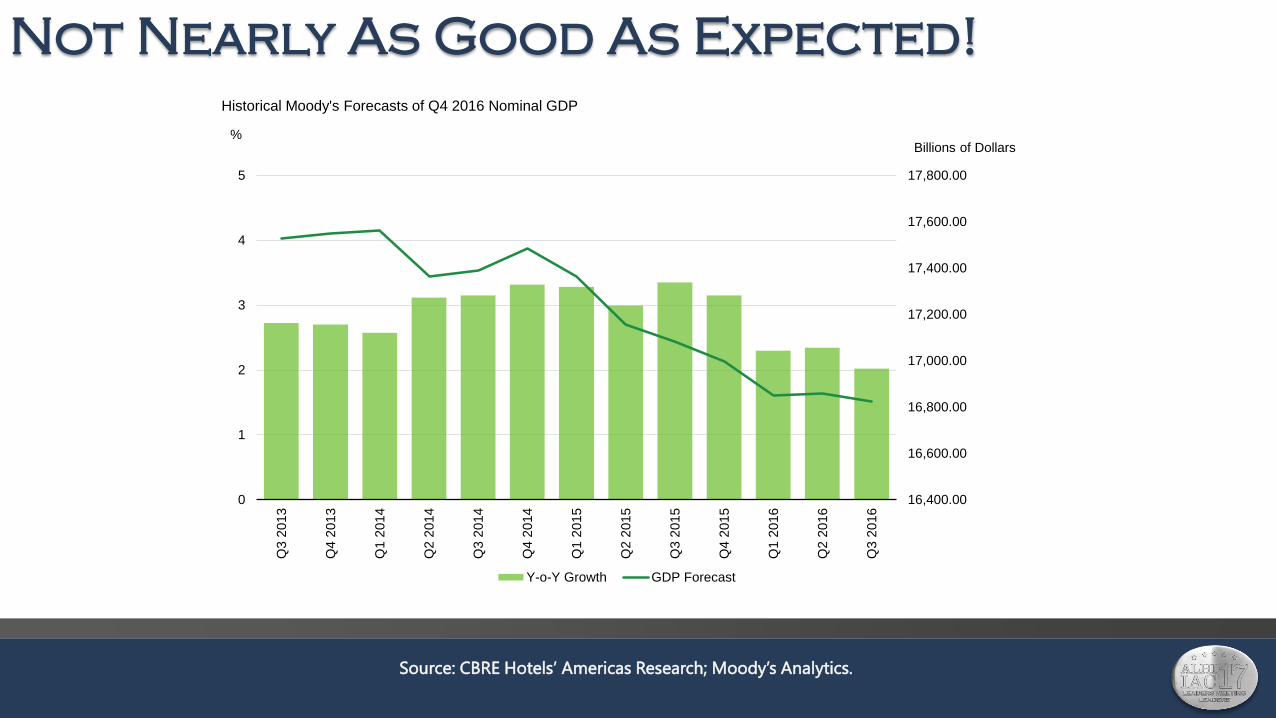
Not Nearly As Good As Expected!
Source: CBRE Hotels’ Americas Research; Moody’s Analytics.
16,400.00
16,600.00
16,800.00
17,000.00
17,200.00
17,400.00
17,600.00
17,800.00
0
1
2
3
4
5
Q3 2
013
Q4 2
013
Q1 2
014
Q2 2
014
Q3 2
014
Q4 2
014
Q1 2
015
Q2 2
015
Q3 2
015
Q4 2
015
Q1 2
016
Q2 2
016
Q3 2
016
Billions of Dollars %
Historical Moody's Forecasts of Q4 2016 Nominal GDP
Y-o-Y Growth GDP Forecast

How Will the Economy Be in 2017?
-2.7%
2.0%
-1.9%
-8.2%
-5.4%
-0.5%
1.3%
3.9%
1.7%
3.9%
2.7% 2.5%
-1.5%
2.9%
0.8%
4.6%
2.7%
1.9%
0.5% 0.1%
2.8%
0.8%
3.1%
4.0%
-1.2%
4.0% 5.0%
2.3% 2.0%
2.6% 2.0%
0.9% 0.8%
1.4% 3.5% 1.9%
2.1%
3.0% 2.7%
2.9% 3.1% 3.1%
2.3% 2.5%
-10
-8
-6
-4
-2
0
2
4
6
8
10
I II III IV I II III IV I II III IV I II III IV I II III IV I II III IV I II III IV I II III IV I II III IV I II III IV I II III IV
2008 2009 2010 2011 2012 2013 2014 2015 2016 2017 2018
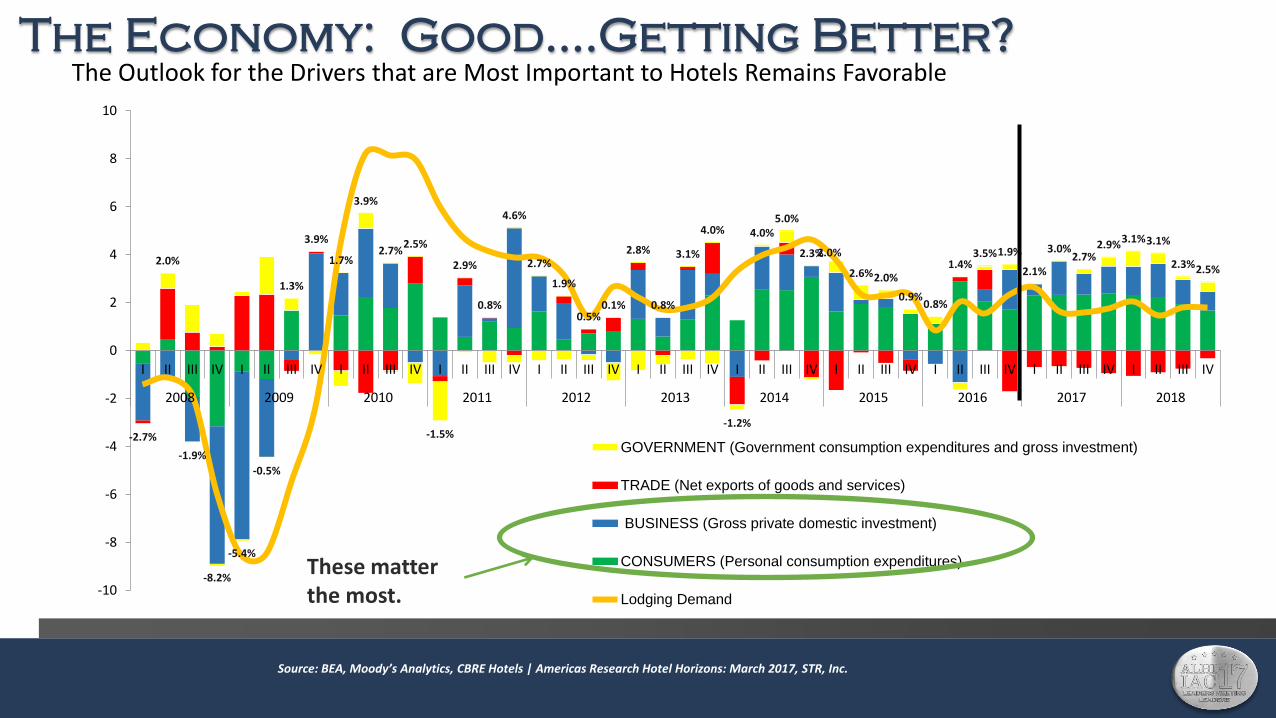
GOVERNMENT (Government consumption expenditures and gross investment)
TRADE (Net exports of goods and services)
BUSINESS (Gross private domestic investment)
CONSUMERS (Personal consumption expenditures)
Lodging Demand
These matter the most.
Source: BEA, Moody’s Analytics, CBRE Hotels | Americas Research Hotel Horizons: March 2017, STR, Inc.
The Outlook for the Drivers that are Most Important to Hotels Remains Favorable The Economy: Good….Getting Better?

Trump: Stimulus or Uncertainty?
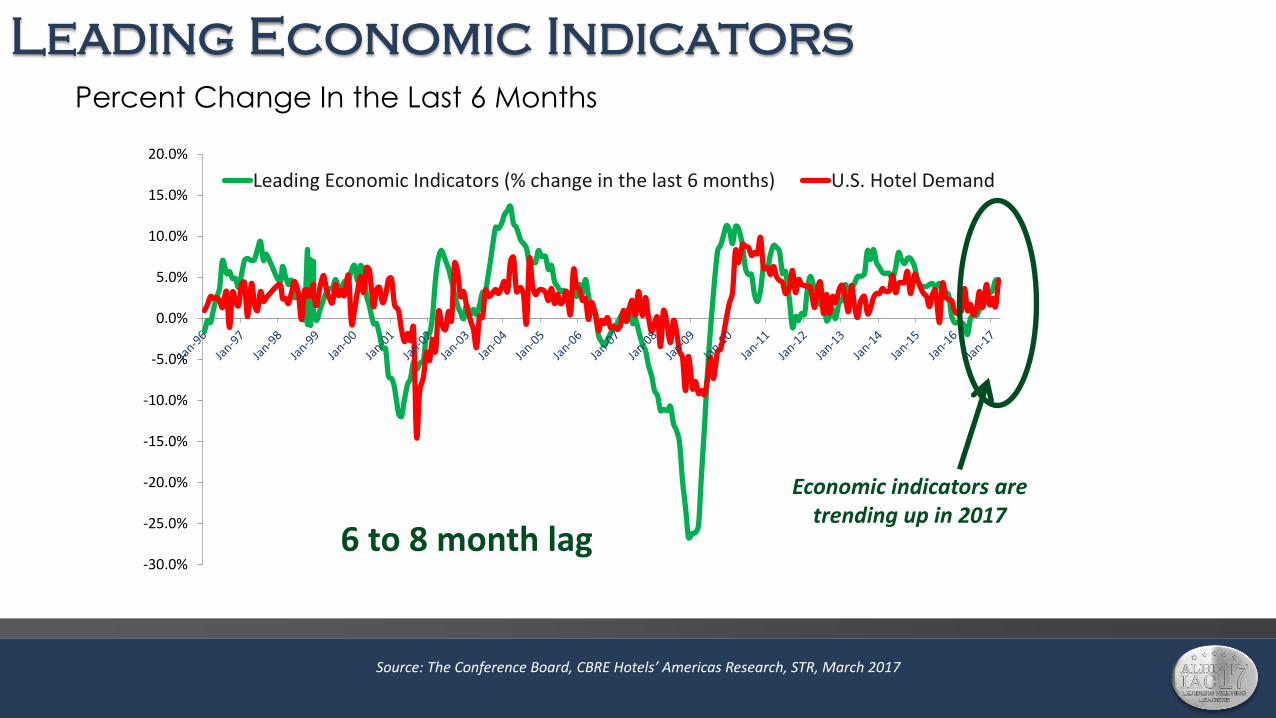
Leading Economic Indicators
Percent Change In the Last 6 Months
-30.0%
-25.0%
-20.0%
-15.0%
-10.0%
-5.0%
0.0%
5.0%
10.0%
15.0%
20.0%
Leading Economic Indicators (% change in the last 6 months) U.S. Hotel Demand
Source: The Conference Board, CBRE Hotels’ Americas Research, STR, March 2017
6 to 8 month lag
Economic indicators are trending up in 2017

Agenda
The Impact of New Supply
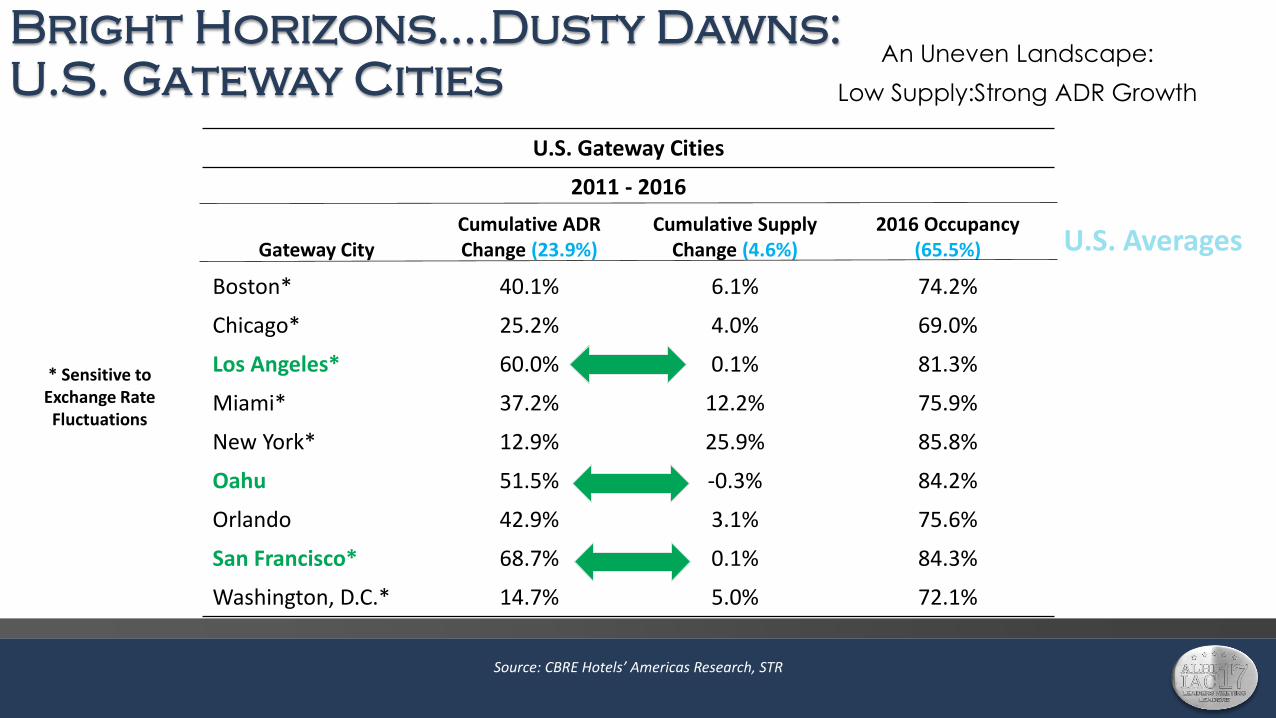
Bright Horizons….Dusty Dawns:
U.S. Gateway Cities An Uneven Landscape:
Low Supply:Strong ADR Growth
Source: CBRE Hotels’ Americas Research, STR
U.S. Gateway Cities
2011 - 2016
Gateway City Cumulative ADR Change (23.9%)
Cumulative Supply Change (4.6%)
2016 Occupancy (65.5%)
Boston* 40.1% 6.1% 74.2%
Chicago* 25.2% 4.0% 69.0%
Los Angeles* 60.0% 0.1% 81.3%
Miami* 37.2% 12.2% 75.9%
New York* 12.9% 25.9% 85.8%
Oahu 51.5% -0.3% 84.2%
Orlando 42.9% 3.1% 75.6%
San Francisco* 68.7% 0.1% 84.3%
Washington, D.C.* 14.7% 5.0% 72.1%
* Sensitive to Exchange Rate Fluctuations
U.S. Averages

Bright Horizons….Dusty Dawns:
U.S. Gateway Cities
An Uneven Landscape:
High Supply:Weak ADR Growth
Source: CBRE Hotels’ Americas Research, STR
* Sensitive to Exchange Rate Fluctuations
U.S. Averages

Agenda
The Year Ahead for Luxury Buyers and Sellers Markets

Market Outlook
Occupancy Levels will Decline in 51
of our 60 Top U.S. Markets this Year,
but in only 45 Markets in 2017.
Average Daily Rate Growth will Exceed
2.0% in 52 Markets this Year and Next.
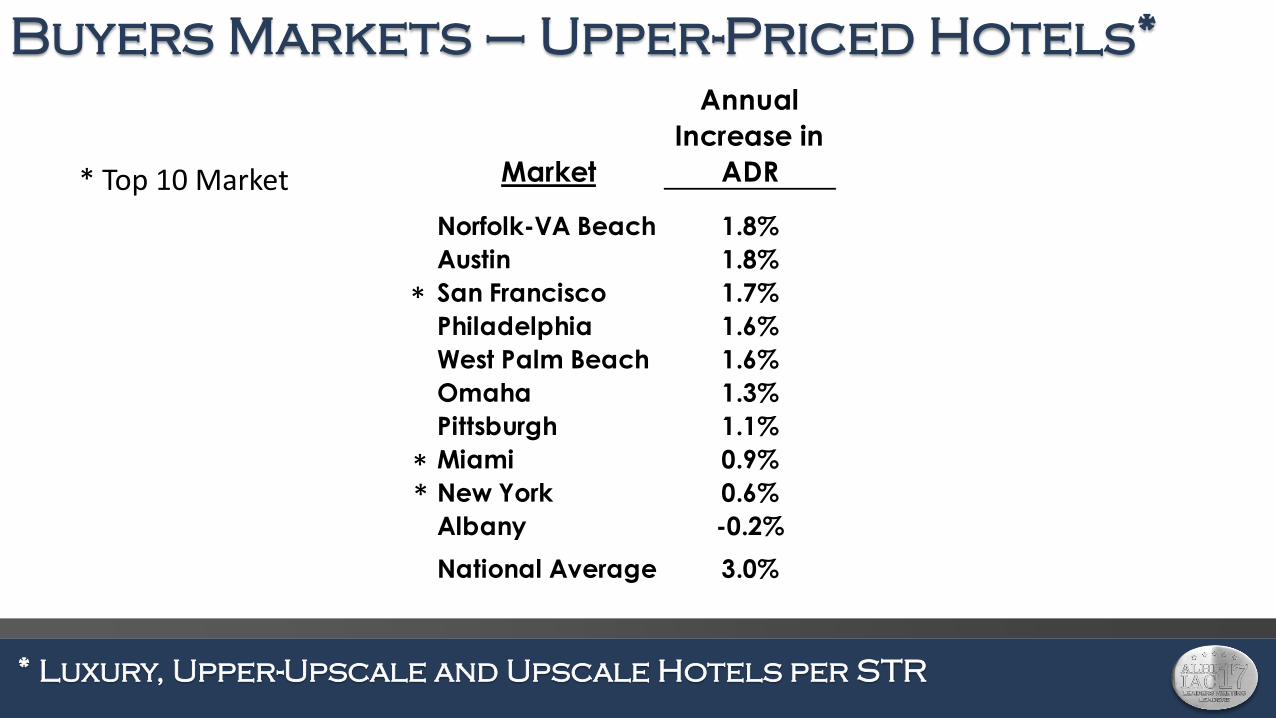
Buyers Markets – Upper-Priced Hotels*
* Luxury, Upper-Upscale and Upscale Hotels per STR
Market
Annual
Increase in
ADR
Norfolk-VA Beach 1.8%
Austin 1.8%
San Francisco 1.7%
Philadelphia 1.6%
West Palm Beach 1.6%
Omaha 1.3%
Pittsburgh 1.1%
Miami 0.9%
New York 0.6%
Albany -0.2%
National Average 3.0%
*
* *
* Top 10 Market
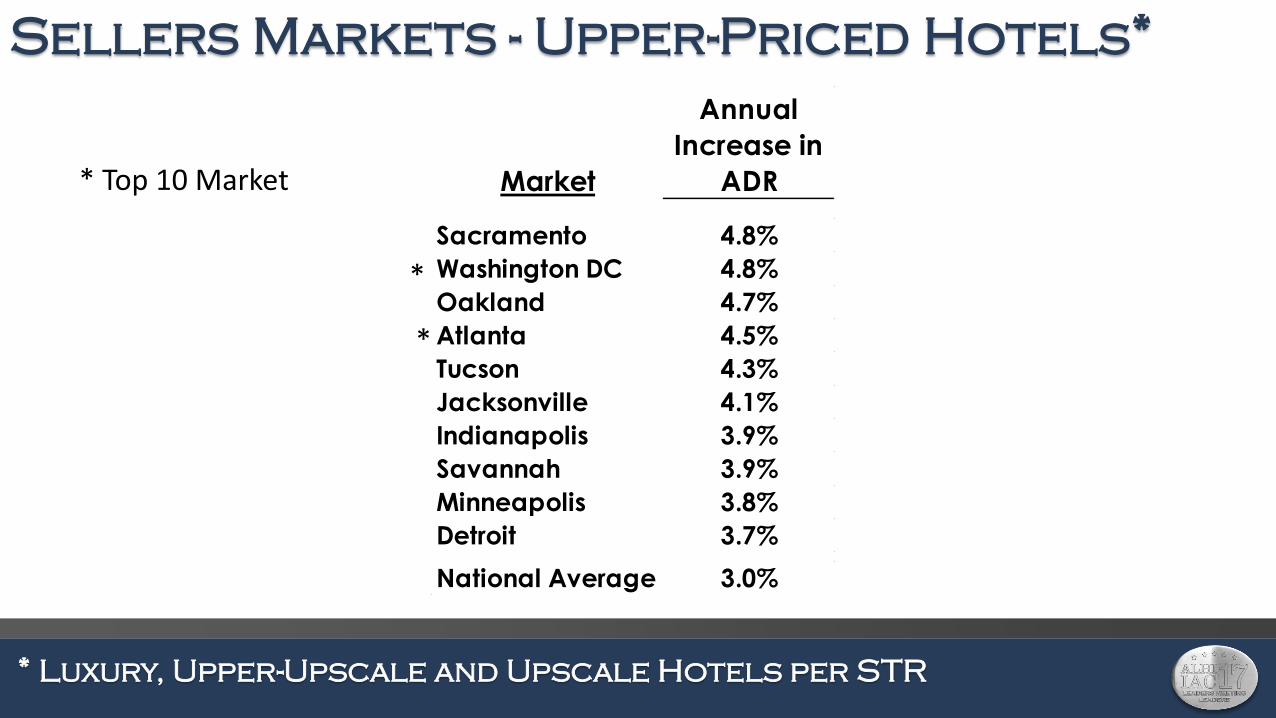
Sellers Markets - Upper-Priced Hotels*
* Luxury, Upper-Upscale and Upscale Hotels per STR
Market
Annual
Increase in
ADR
Sacramento 4.8%
Washington DC 4.8%
Oakland 4.7%
Atlanta 4.5%
Tucson 4.3%
Jacksonville 4.1%
Indianapolis 3.9%
Savannah 3.9%
Minneapolis 3.8%
Detroit 3.7%
National Average 3.0%
*
*
* Top 10 Market
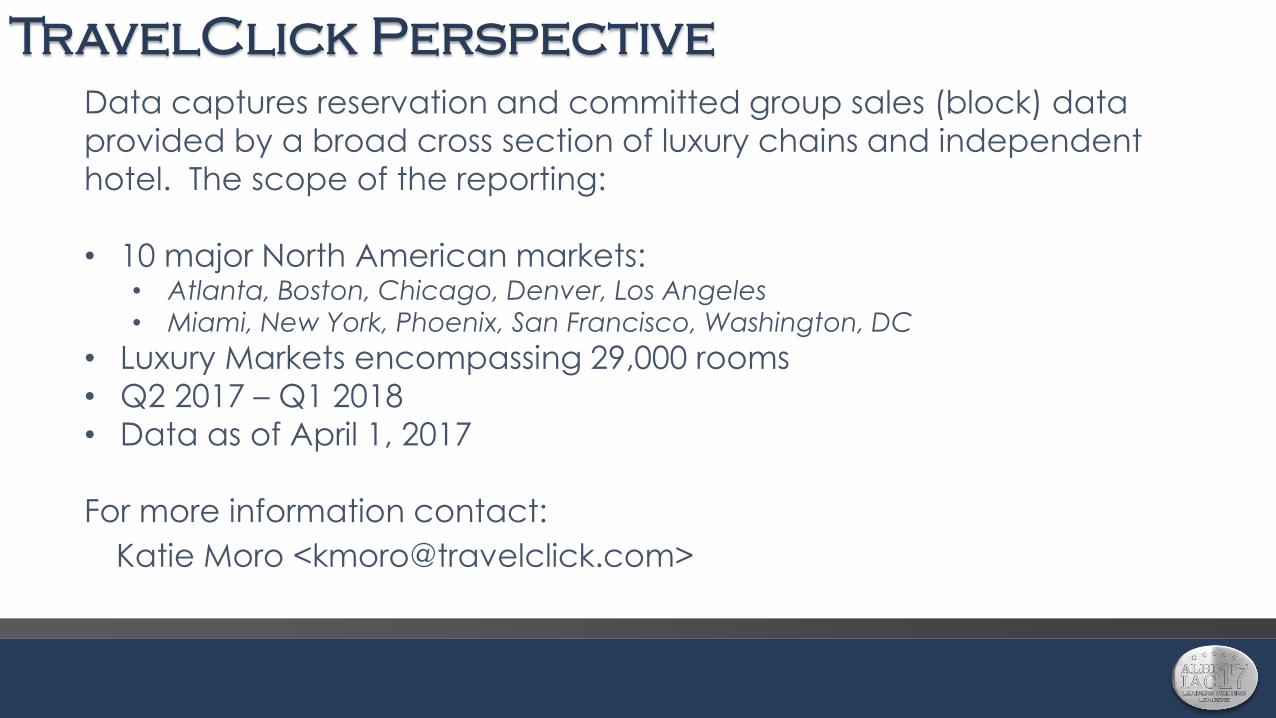
TravelClick Perspective
Data captures reservation and committed group sales (block) data
provided by a broad cross section of luxury chains and independent
hotel. The scope of the reporting:
• 10 major North American markets: • Atlanta, Boston, Chicago, Denver, Los Angeles
• Miami, New York, Phoenix, San Francisco, Washington, DC
• Luxury Markets encompassing 29,000 rooms
• Q2 2017 – Q1 2018
• Data as of April 1, 2017
For more information contact:
Katie Moro <[email protected]>
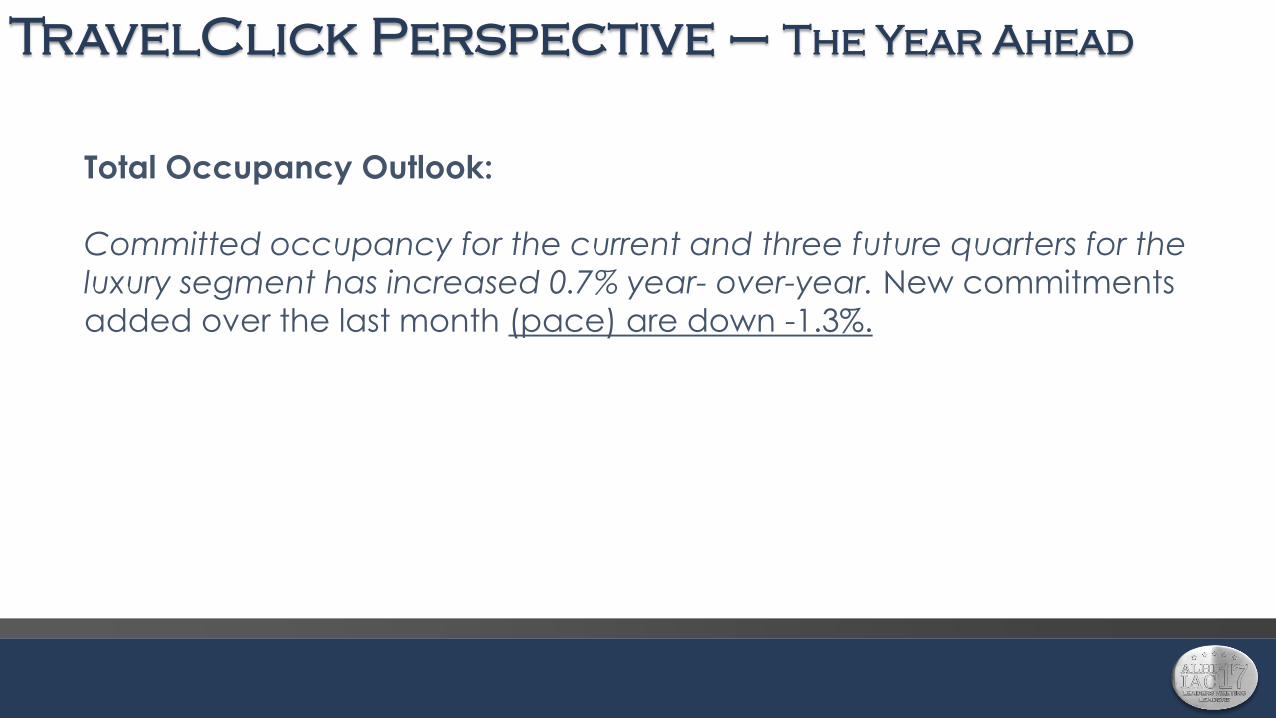
TravelClick Perspective – The Year Ahead
Total Occupancy Outlook:
Committed occupancy for the current and three future quarters for the
luxury segment has increased 0.7% year- over-year. New commitments
added over the last month (pace) are down -1.3%.
TravelClick Perspective – The Year Ahead
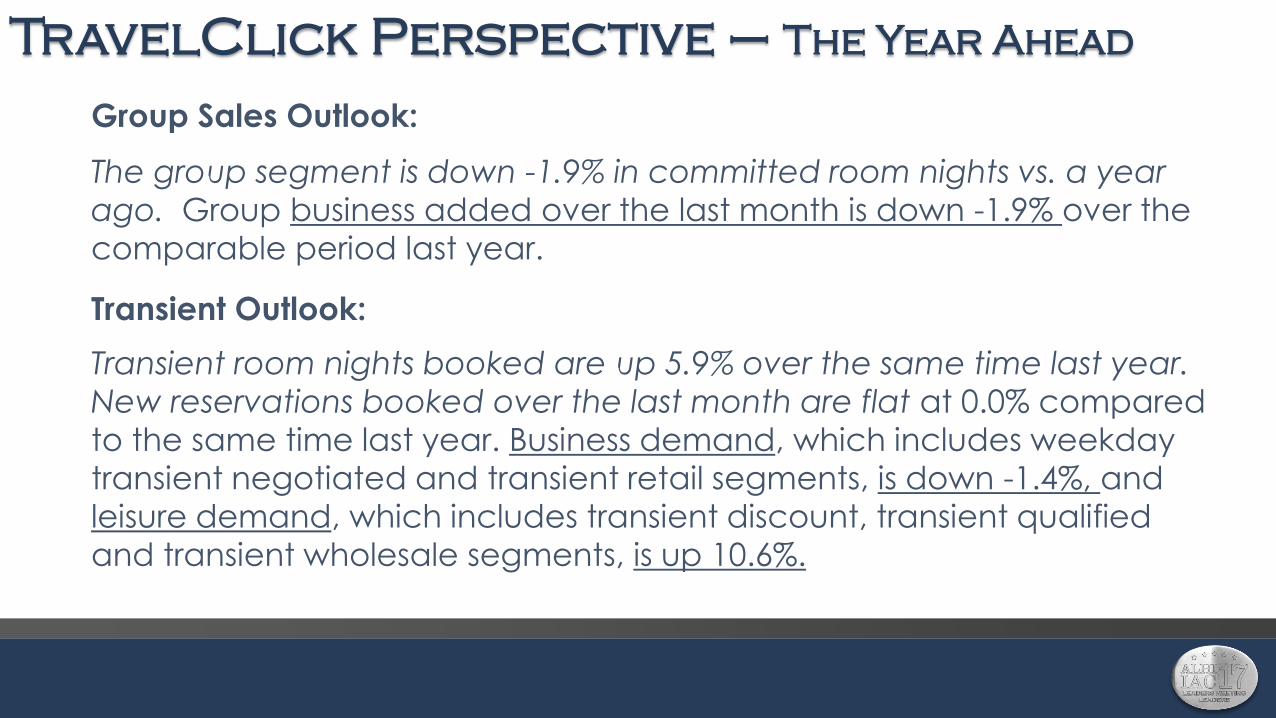
Group Sales Outlook:
The group segment is down -1.9% in committed room nights vs. a year
ago. Group business added over the last month is down -1.9% over the
comparable period last year.
Transient Outlook:
Transient room nights booked are up 5.9% over the same time last year.
New reservations booked over the last month are flat at 0.0% compared
to the same time last year. Business demand, which includes weekday
transient negotiated and transient retail segments, is down -1.4%, and
leisure demand, which includes transient discount, transient qualified
and transient wholesale segments, is up 10.6%.
TravelClick Perspective – The Year Ahead
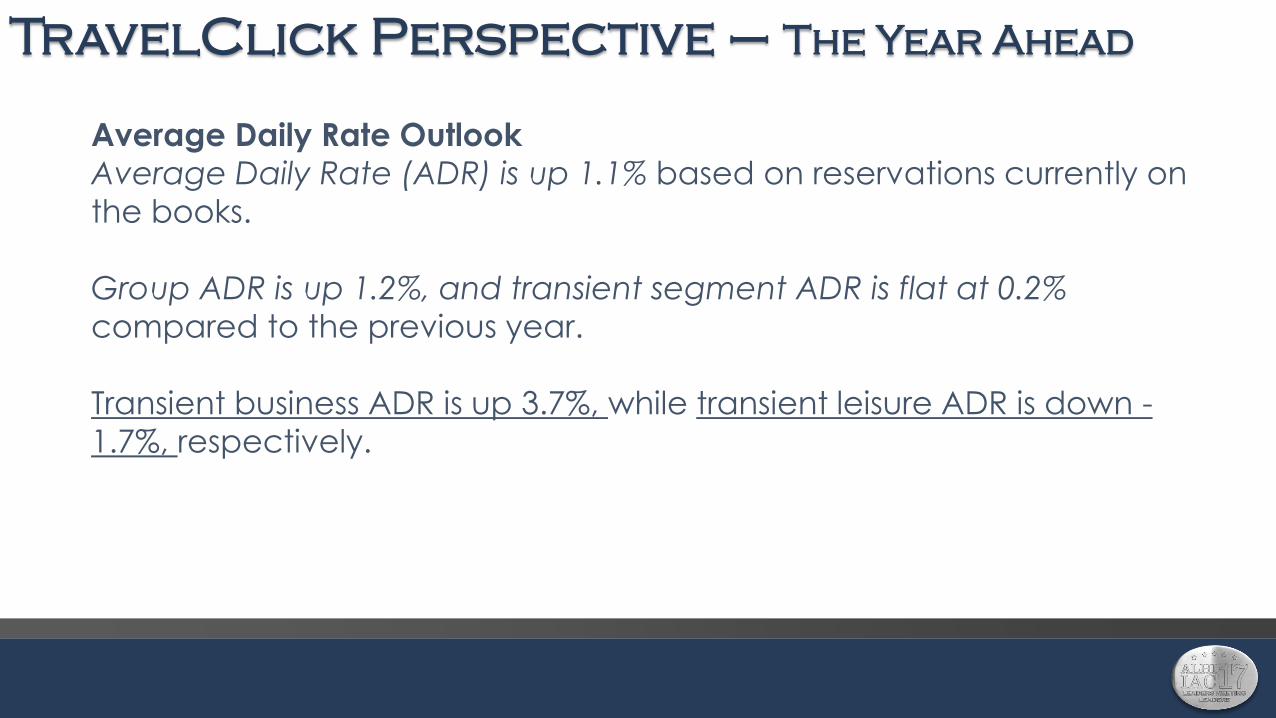
Average Daily Rate Outlook
Average Daily Rate (ADR) is up 1.1% based on reservations currently on
the books.
Group ADR is up 1.2%, and transient segment ADR is flat at 0.2%
compared to the previous year.
Transient business ADR is up 3.7%, while transient leisure ADR is down -
1.7%, respectively.
TravelClick Perspective – The Year Ahead
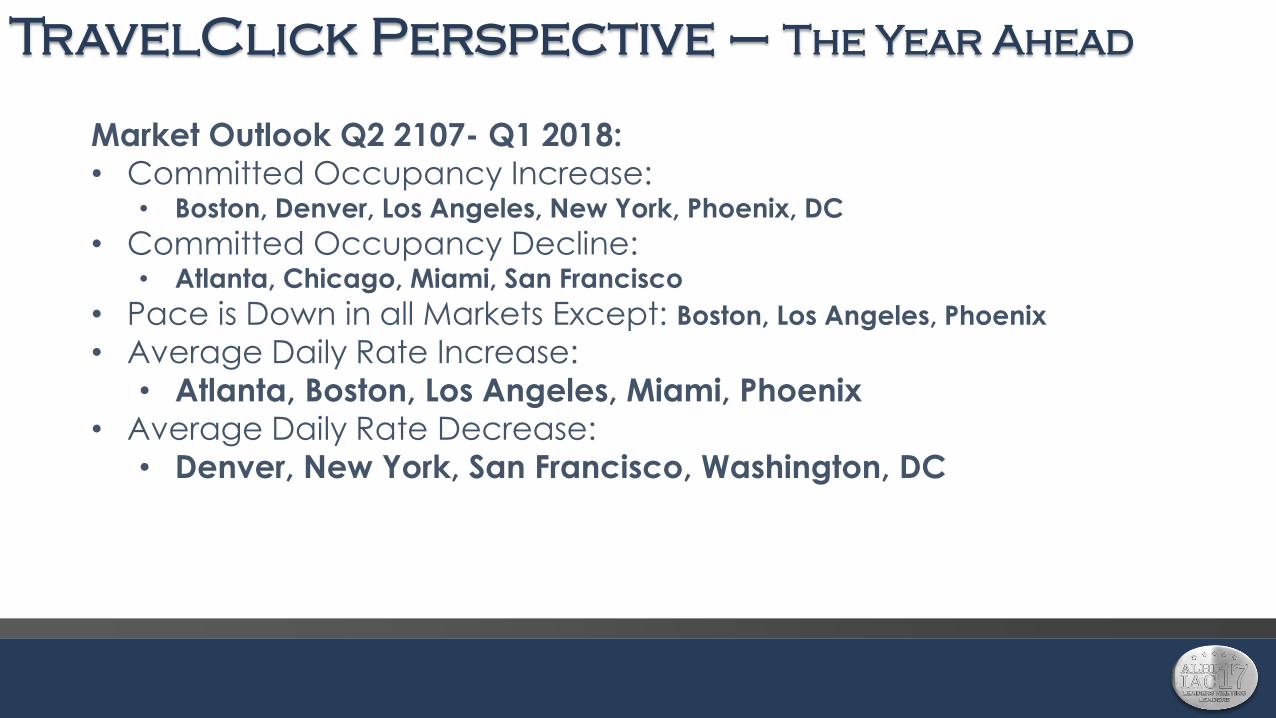
Market Outlook Q2 2107- Q1 2018:
• Committed Occupancy Increase: • Boston, Denver, Los Angeles, New York, Phoenix, DC
• Committed Occupancy Decline: • Atlanta, Chicago, Miami, San Francisco
• Pace is Down in all Markets Except: Boston, Los Angeles, Phoenix
• Average Daily Rate Increase:
• Atlanta, Boston, Los Angeles, Miami, Phoenix
• Average Daily Rate Decrease:
• Denver, New York, San Francisco, Washington, DC
TravelClick Perspective – The Year Ahead
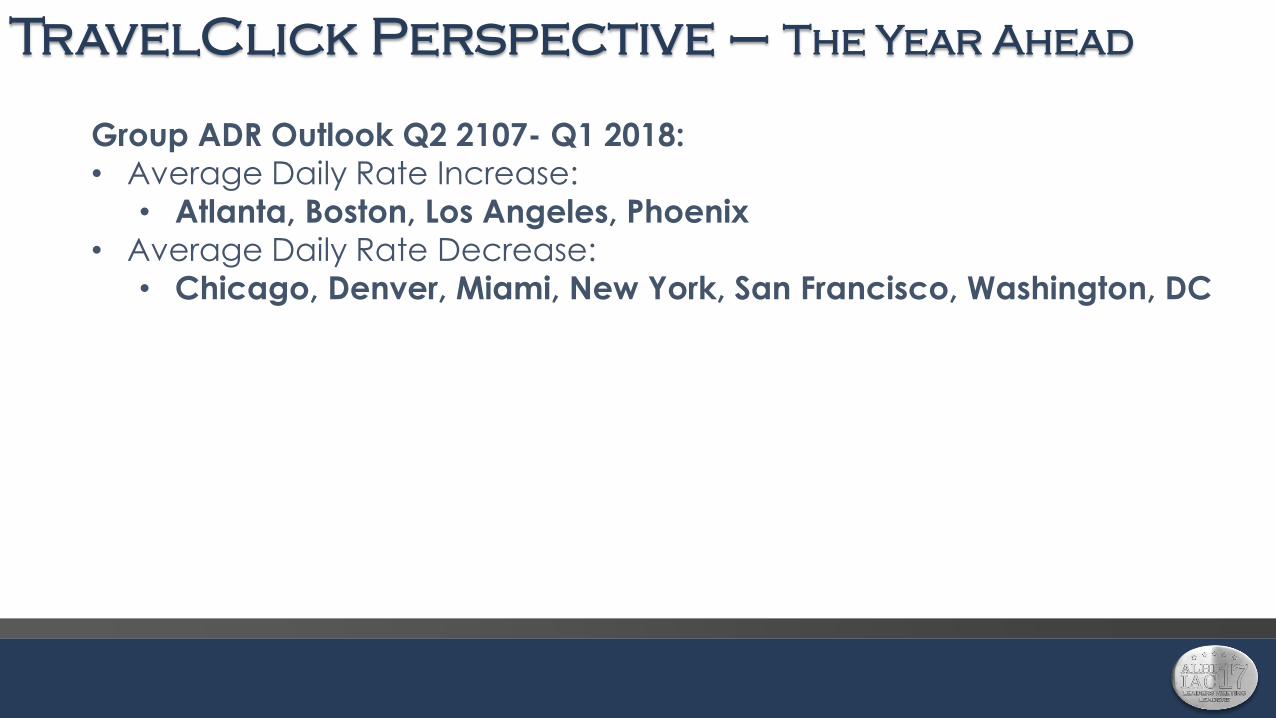
Group ADR Outlook Q2 2107- Q1 2018:
• Average Daily Rate Increase:
• Atlanta, Boston, Los Angeles, Phoenix
• Average Daily Rate Decrease:
• Chicago, Denver, Miami, New York, San Francisco, Washington, DC
Agenda
Our Forecasts
Bright Horizons….Dusty Dawns:
U.S. National Forecast
Source: CBRE Hotels’ Americas Research, STR
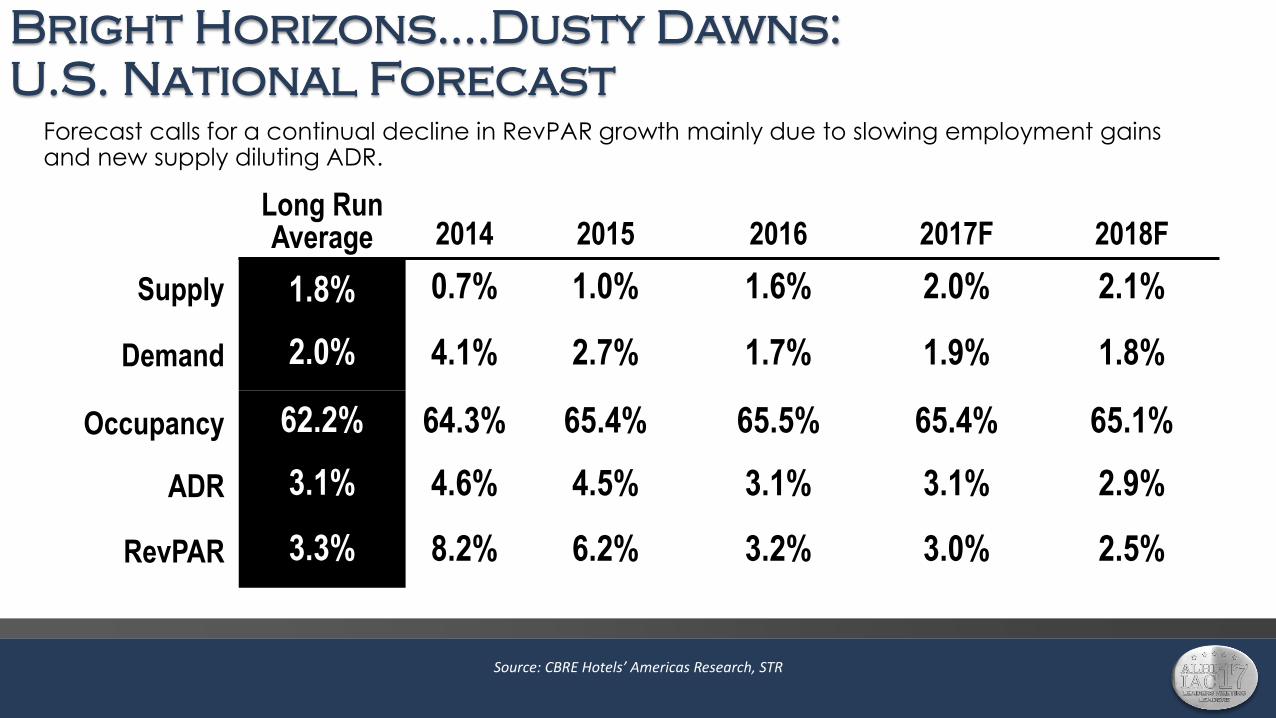
Long Run Average 2014 2015 2016 2017F 2018F
Supply 1.8% 0.7% 1.0% 1.6% 2.0% 2.1%
Demand 2.0% 4.1% 2.7% 1.7% 1.9% 1.8%
Occupancy 62.2% 64.3% 65.4% 65.5% 65.4% 65.1%
ADR 3.1% 4.6% 4.5% 3.1% 3.1% 2.9%
RevPAR 3.3% 8.2% 6.2% 3.2% 3.0% 2.5%
Forecast calls for a continual decline in RevPAR growth mainly due to slowing employment gains and new supply diluting ADR.

Bright Horizons….Dusty Dawns:
U.S. Luxury Hotels Forecast
Source: CBRE Hotels’ Americas Research, STR
Long Run Average 2014 2015 2016 2017F 2018F
Supply 4.4% 1.2% 0.8% 2.8% 3.8% 3.4%
Demand 4.8% 2.1% 1.1% 2.4% 3.1% 3.0%
Occupancy 69.7% 74.9% 75.2% 74.9% 74.4% 74.1%
ADR 3.8% 5.2% 4.2% 1.7% 2.2% 2.2%
RevPAR 4.4% 6.1% 4.6% 1.3% 1.5% 1.8%
Accelerated Supply Growth will Lead to Modest ADR Increases this Year and Next.
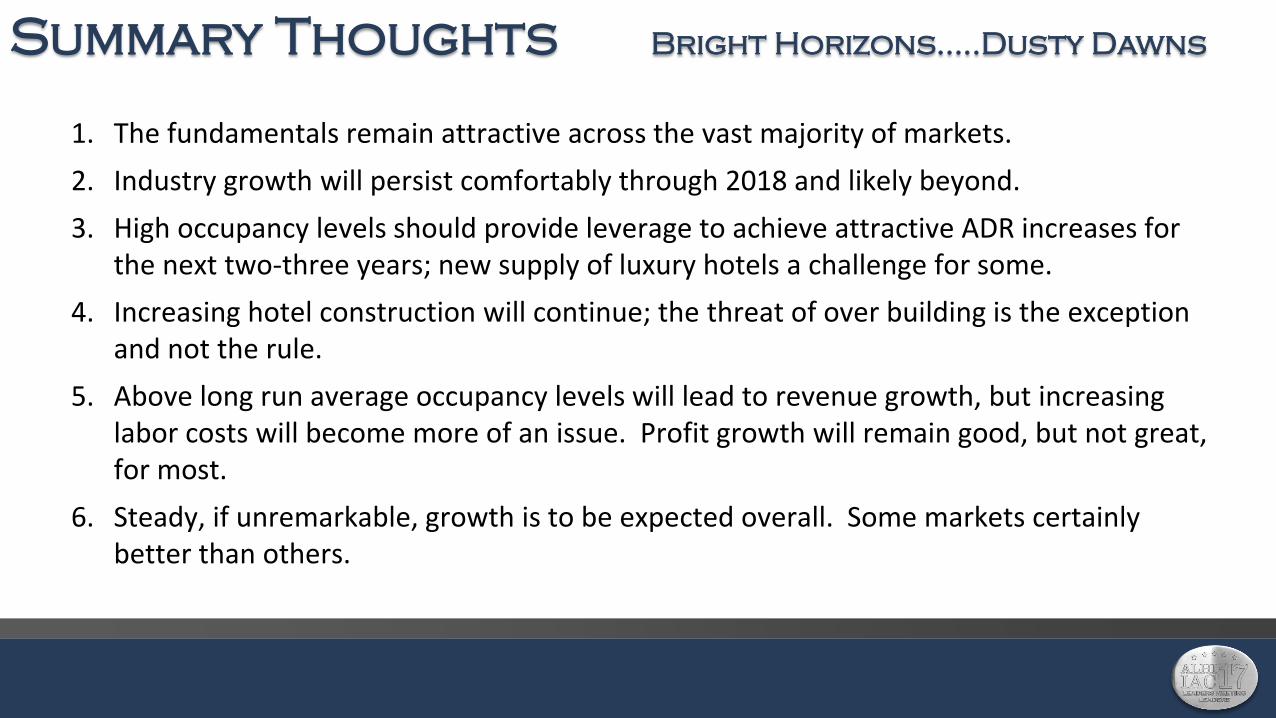
Summary Thoughts Bright Horizons…..Dusty Dawns
1. The fundamentals remain attractive across the vast majority of markets.
2. Industry growth will persist comfortably through 2018 and likely beyond.
3. High occupancy levels should provide leverage to achieve attractive ADR increases for the next two-three years; new supply of luxury hotels a challenge for some.
4. Increasing hotel construction will continue; the threat of over building is the exception and not the rule.
5. Above long run average occupancy levels will lead to revenue growth, but increasing labor costs will become more of an issue. Profit growth will remain good, but not great, for most.
6. Steady, if unremarkable, growth is to be expected overall. Some markets certainly better than others.