Embed Size (px)
Citation preview

Christopher A. Mouton, John P. Godges
Timelines for Reaching Injured Personnel in Africa
C O R P O R A T I O N

Limited Print and Electronic Distribution Rights
This document and trademark(s) contained herein are protected by law. This representation of RAND intellectual property is provided for noncommercial use only. Unauthorized posting of this publication online is prohibited. Permission is given to duplicate this document for personal use only, as long as it is unaltered and complete. Permission is required from RAND to reproduce, or reuse in another form, any of its research documents for commercial use. For information on reprint and linking permissions, please visit www.rand.org/pubs/permissions.
The RAND Corporation is a research organization that develops solutions to public policy challenges to help make communities throughout the world safer and more secure, healthier and more prosperous. RAND is nonprofit, nonpartisan, and committed to the public interest.
RAND’s publications do not necessarily reflect the opinions of its research clients and sponsors.
Support RANDMake a tax-deductible charitable contribution at
www.rand.org/giving/contribute
www.rand.org
Library of Congress Cataloging-in-Publication DataISBN: 978-0-8330-9635-7
For more information on this publication, visit www.rand.org/t/RR1536
Published by the RAND Corporation, Santa Monica, Calif.
© Copyright 2016 RAND Corporation
R® is a registered trademark.

iii
Preface
Conducting medical evacuations and other personnel recovery mis-sions for military and support personnel is a critical task for the U.S. Department of Defense. Providing this capability is particularly chal-lenging in Africa because of its vast geographic scope and the small number of U.S. personnel scattered across the continent. In Africa, a very large area needs to be covered with relatively limited resources. Even if very significant additional resources were available, achieving a medical response network such as the one that existed in the later parts of Operation Enduring Freedom would simply be infeasible in Africa.
While it is true that reaching an injured person faster is always better, the degree to which greater speed improves the rescuability (the likelihood that a person is still surviving until rescue forces arrive) of such a person needs to be quantified. In other words, what is the like-lihood that a faster arrival will make a meaningful difference in the chances of rescuing someone? Absent information relating rescuability to time, it is not possible to quantify the effectiveness (and thus the cost-effectiveness) of changes in the way rescues are conducted. This report seeks to close this gap.
This research was sponsored by Robert “Mike” Maxwell of the U.S. Africa Command and conducted within the International Secu-rity and Defense Policy Center of the RAND National Defense Research Institute, a federally funded research and development center sponsored by the Office of the Secretary of Defense, the Joint Staff, the Unified Combatant Commands, the Navy, the Marine Corps, the defense agencies, and the defense Intelligence Community.
iv Timelines for Reaching Injured Personnel in Africa
For more information about the International Security and Defense Policy Center, see www.rand.org/nsrd/ndri/centers/isdp or contact the director (contact information is provided on web page).

v
Contents
Preface . . . . . . . . . . . . . . . . . . . . . . . . . . . . . . . . . . . . . . . . . . . . . . . . . . . . . . . . . . . . . . . . . . . . . . . . . . . . . iiiFigures and Tables . . . . . . . . . . . . . . . . . . . . . . . . . . . . . . . . . . . . . . . . . . . . . . . . . . . . . . . . . . . . . . . viiSummary . . . . . . . . . . . . . . . . . . . . . . . . . . . . . . . . . . . . . . . . . . . . . . . . . . . . . . . . . . . . . . . . . . . . . . . . . . ixAcknowledgments . . . . . . . . . . . . . . . . . . . . . . . . . . . . . . . . . . . . . . . . . . . . . . . . . . . . . . . . . . . . . . . xv
CHAPTER ONE
Introduction and Methodology . . . . . . . . . . . . . . . . . . . . . . . . . . . . . . . . . . . . . . . . . . . . . . . . 1Motivation and Research Objectives . . . . . . . . . . . . . . . . . . . . . . . . . . . . . . . . . . . . . . . . . . . . 1Methodology . . . . . . . . . . . . . . . . . . . . . . . . . . . . . . . . . . . . . . . . . . . . . . . . . . . . . . . . . . . . . . . . . . . . . . . 3
CHAPTER TWO
Rescuability Data and Results . . . . . . . . . . . . . . . . . . . . . . . . . . . . . . . . . . . . . . . . . . . . . . . . 13Mortality Curves . . . . . . . . . . . . . . . . . . . . . . . . . . . . . . . . . . . . . . . . . . . . . . . . . . . . . . . . . . . . . . . . . . 13Injury Distributions . . . . . . . . . . . . . . . . . . . . . . . . . . . . . . . . . . . . . . . . . . . . . . . . . . . . . . . . . . . . . . . 16Rescuability Timelines . . . . . . . . . . . . . . . . . . . . . . . . . . . . . . . . . . . . . . . . . . . . . . . . . . . . . . . . . . . 17Toward Comparisons of Cost-Effectiveness . . . . . . . . . . . . . . . . . . . . . . . . . . . . . . . . . . . 20Overarching Observations on Rescuability . . . . . . . . . . . . . . . . . . . . . . . . . . . . . . . . . . . 24
CHAPTER THREE
Conclusions . . . . . . . . . . . . . . . . . . . . . . . . . . . . . . . . . . . . . . . . . . . . . . . . . . . . . . . . . . . . . . . . . . . . . . 27
APPENDIXES
A. List of ICD-9 Mortality Risks . . . . . . . . . . . . . . . . . . . . . . . . . . . . . . . . . . . . . . . . . . . . . 33B. Additional Rescuability Timelines . . . . . . . . . . . . . . . . . . . . . . . . . . . . . . . . . . . . . . . . 49
Abbreviations . . . . . . . . . . . . . . . . . . . . . . . . . . . . . . . . . . . . . . . . . . . . . . . . . . . . . . . . . . . . . . . . . . . . . 53References . . . . . . . . . . . . . . . . . . . . . . . . . . . . . . . . . . . . . . . . . . . . . . . . . . . . . . . . . . . . . . . . . . . . . . . . . 55

vii
Figures and Tables
Figures
S.1. Multiplying Mortality Rates by Injury Distributions to Produce Rescuability Timelines . . . . . . . . . . . . . . . . . . . . . . . . . . . . . . . . . . . . xi
S.2. Effects of Incidence Response Time on Rescuability Rates in General, Relative to Six Hours . . . . . . . . . . . . . . . . . . . . . . . . . . . . . . . . . . xii
1.1. Incident Response Covers Just the First Part of the Rescue Chain . . . . . . . . . . . . . . . . . . . . . . . . . . . . . . . . . . . . . . . . . . . . . . . . . . . . . . . . . . . . . . . . . . . 3
1.2. Multiplying Mortality Rates by Injury Distributions to Produce Rescuability Timelines . . . . . . . . . . . . . . . . . . . . . . . . . . . . . . . . . . . . . 5
2.1. Role 1—JMPT Mortality Curves with SABC . . . . . . . . . . . . . . . . . . 14 2.2. Role 1A—JMPT Mortality Curves with First-Responder
Care . . . . . . . . . . . . . . . . . . . . . . . . . . . . . . . . . . . . . . . . . . . . . . . . . . . . . . . . . . . . . . . . . . . 15 2.3. Role 1B—JMPT Mortality Curves with Aid-Station Care . . . . 16 2.4. Role 1— Rescuability Timelines with SABC . . . . . . . . . . . . . . . . . . . . 18 2.5. Role 1A—Rescuability Timelines with First-Responder
Care. . . . . . . . . . . . . . . . . . . . . . . . . . . . . . . . . . . . . . . . . . . . . . . . . . . . . . . . . . . . . . . . . . . . 19 2.6. Role 1B—Rescuability Timelines with Aid-Station Care . . . . . 20 2.7. Role 1—Rescuability Timelines, Relative to Six Hours,
with SABC . . . . . . . . . . . . . . . . . . . . . . . . . . . . . . . . . . . . . . . . . . . . . . . . . . . . . . . . . . 22 2.8. Role 1A—Rescuability Timelines, Relative to Six Hours,
with First-Responder Care . . . . . . . . . . . . . . . . . . . . . . . . . . . . . . . . . . . . . . . . . 23 2.9. Role 1B—Rescuability Timelines, Relative to Six Hours,
with Aid-Station Care . . . . . . . . . . . . . . . . . . . . . . . . . . . . . . . . . . . . . . . . . . . . . . 24 2.10. Rescuability Rates Across Three Roles of Care . . . . . . . . . . . . . . . . . . . 25 3.1. Effects of Response Speed on Rescuability Rates in
General, Relative to Six Hours . . . . . . . . . . . . . . . . . . . . . . . . . . . . . . . . . . . . 28

viii Timelines for Reaching Injured Personnel in Africa
3.2. Effects of Response Speed on Rescuability Rates in General, Relative to 12 Hours . . . . . . . . . . . . . . . . . . . . . . . . . . . . . . . . . . . . . . 29
B.1. Role 1—Additional Rescuability Timelines with SABC . . . . . . 50 B.2. Role 1A—Additional Rescuability Timelines with
First-Responder Care . . . . . . . . . . . . . . . . . . . . . . . . . . . . . . . . . . . . . . . . . . . . . . . . 51 B.3. Role 1B—Additional Rescuability Timelines with
Aid-Station Care . . . . . . . . . . . . . . . . . . . . . . . . . . . . . . . . . . . . . . . . . . . . . . . . . . . . . 51
Tables
1.1. Examples of JMPT Mortality Risk Categories . . . . . . . . . . . . . . . . . . . . 7 1.2. Prehospital and Hospital Roles of Care . . . . . . . . . . . . . . . . . . . . . . . . . . . . 8 1.3. Distribution of Mortality Risks Across Four Historical
Cases . . . . . . . . . . . . . . . . . . . . . . . . . . . . . . . . . . . . . . . . . . . . . . . . . . . . . . . . . . . . . . . . . . 11 2.1. Distribution of Life-Threatening Injuries Across Historical
Cases . . . . . . . . . . . . . . . . . . . . . . . . . . . . . . . . . . . . . . . . . . . . . . . . . . . . . . . . . . . . . . . . . . 17 A.1. Medical Conditions, ICD-9 Codes, and Mortality Risks . . . . . . 33 B.1. Distribution of Life-Threatening Injuries Across
Additional Historical Cases . . . . . . . . . . . . . . . . . . . . . . . . . . . . . . . . . . . . . . . 50

ix
Summary
Conducting medical evacuations and other personnel recovery mis-sions for military and support personnel is a critical task for the U.S. Department of Defense (DoD). Providing this capability is especially challenging in Africa because its vast geographic scope, limited basing options, and the small number of U.S. personnel scattered across the continent. In Africa, a very large area needs to be covered with rela-tively limited resources.
While it is always better to reach an injured person faster, the degree to which greater speed improves the rescuability of a person needs to be quantified.1 Absent information that relates rescuability to time, it is not possible to quantify the effectiveness (or cost-effectiveness) of changes in the way a rescue is conducted. This report seeks to fill this gap by deriving the relationship between the passage of time and an injured personnel’s rescuability. This current analysis is limited to the time between injury and initial rescue, as discussed in Chapter One.
By quantifying the value of time to reach injured personnel, it will be possible to compare investments in rescue assets with investments in medical resources—in terms of cost, as well as increased likelihood of rescue (net benefit). Similarly, the cost-effectiveness of enhanced rescue assets or medical resources can then be compared with that of other potential rescue-related investments, such as increased reliance on contractor rescue capabilities, improved communication, improved
1 We define rescuability as the likelihood that a person is still rescuable (i.e., surviving) until rescue forces arrive.

x Timelines for Reaching Injured Personnel in Africa
command and control, and indigenous medical capabilities. The most cost-effective options among all these alternatives can then be pursued.
In the context of this analysis, we define rescue as the entire sequence of events, from the time of incident to the final disposition of the injured personnel. More narrowly, we define incident response as just the first part of the sequence, from the time of incident to the first arrival of rescue forces, be they on missions of casualty evacuation, medical evacuation, personnel recovery, or combat search and rescue. Of course, the mere arrival of rescue forces does not guarantee that an injured person will survive. A much broader analysis would need to be conducted to evaluate the probability of the person surviving the injuries.
Methodology
Our methodology, which builds on past RAND research, has two components. First, we use the Joint Medical Planning Tool (JMPT) for clinical information about mortality curves associated with injuries of different mortality risk levels and with incident responses involving different tiers of medical care (or, to use military terminology, differ-ent medical-care roles). Second, we use the Medical Planners’ Toolkit (MPTk) for information about the distribution of mortality risk levels associated with injuries suffered across a sampling of recent military operations. In this way, both the military medical information about mortality curves and the historical information about injury distribu-tions inform our findings regarding the effects of speed on personnel rescue missions.
Figure S.1 portrays our methodology schematically. Essentially, we take an average of the JMPT mortality rates (for each level of injury severity and each role of medical care), weighted by the MPTk injury distributions (of low, medium, and high mortality risks from a given historical operation). The end product is a rescuability curve or a rescu-ability timeline for each operation. Note that a JMPT mortality curve is more specific than a rescuability curve. Whereas a JMPT mortality

Sum
mary xi
Figure S.1Multiplying Mortality Rates by Injury Distributions to Produce Rescuability Timelines
NOTE: SME = subject-matter expert.RAND RR1536-S.1
Medical SMEinputs (JMPT)
Expectedmortality
rate
Distributionof injuries
Historicalevents (MPTk)
Low
Medium
High
Low
Medium
High
×
+
+
×
×
L%
M%
H%

xii Timelines for Reaching Injured Personnel in Africa
curve represents a single mortality risk level, a rescuability curve rep-resents an average distribution of risks across the mortality risk levels.
Results
We found the rescuability rates to be highly consistent across the his-torical, operational, and clinical cases that we examined. Therefore, we concluded that an aggregate portrayal of the entire set of data across all of the examined cases could fairly represent the likely effects of faster or slower incident responses on rescuability rates, regardless of the his-torical, operational, or clinical settings. The aggregate results appear in Figure S.2.2 The bounds shown in Figure S.2 represent the range
2 Chapter Two presents details on the rescuability curves across a wide range of assump-tions. Given the similarity of results across these assumptions, and the uncertainty with regard to the assumptions themselves, we show a simple average here.
Figure S.2Effects of Incidence Response Time on Rescuability Rates in General, Relative to Six Hours
NOTE: Rescuable is defined as the probability that an injured person is still alive. RAND RR1536-S.2
Res
cuab
le c
han
ge
(%)
Response time relative to 6 hours (hrs)
More rescues
Fewer rescues
Slower responseFaster response
−6 6420−2−4
20
15
10
5
0
−5
−10
−15
−20
AverageBounds

Summary xiii
of potential rescuability rates across the two scenarios types and the three medical-care roles we considered. Six hours is chosen as a baseline for these results because it represents a potentially achievable objective across the U.S. Africa Command (AFRICOM) area of responsibility (AOR), making time an operationally relevant reference point.
On average, as shown in Figure S.2, accelerating the incident response time by two hours (faster than the six-hour standard for injured personnel with access to any kind of medical care across all his-torical cases and operational settings) raised the rescuability rate about 7 percent, while accelerating the incident response time by four hours raised the rescuability rate about 16 percent. On average, decelerating the response time by two hours reduced the rescuability rate about 5 percent, while decelerating the response time by four hours reduced the rescuability rate about 9 percent.
The results presented in Figure S.2 serve to benchmark poten-tially achievable response times across the AFRICOM AOR. These results establish a medically sound and historically validated reference point from which to compare the effects of alternative rescue strategies. Those strategies could vary greatly across Africa. Given the continent’s vastness and geographic diversity, the preferred strategies could vary by distance or region; for instance, faster responses with lower roles of care might work better in some regions, whereas slower responses with higher roles of care might work better in others. Future RAND analy-ses will use the aggregated rescuability timelines charted here as the basis for assessing potential alternative rescue options, either for Africa as a whole or for specific regions. By analyzing patient survivability, from injury to definitive care (i.e., the completion of recommended treatment), along with the myriad of rescue options potentially avail-able, the benefits of speed and improved care can be measured along with their associated operational, clinical, and financial costs.
In some cases in Africa, a six-hour response time would be opera-tionally infeasible. Therefore, we also looked at the average results using a 12-hour response time as a point of reference. Again, we compared the results given marginal changes in response times up to six hours in either direction (faster or slower). The marginal changes in response rates with a 12-hour point of reference were generally half as large as they were with a six-hour point of reference.

xiv Timelines for Reaching Injured Personnel in Africa
The baseline results from the overall rescuability timelines are as follows:
• Relative to a standard six-hour response time, marginal increases in response speeds of two to four hours could increase rescu-ability rates roughly 7 to 16 percent, on average, while marginal decreases in response speeds of two to four hours could decrease rescuability rates roughly 5 to 9 percent, on average.
• Relative to a standard 12-hour response time, marginal increases in response speeds of two to four hours could increase rescuability rates roughly 3 to 7 percent, on average, while marginal decreases in response speeds of two to four hours could decrease rescuabil-ity rates roughly 3 to 5 percent, on average.
• As indicated in Figure S.2, a six-hour response time would result in 9 to 16 percent more personnel being rescued than would a 12-hour response time.3 Likewise, a two-hour response time would result in 12 to 20 percent more personnel being rescued than would a six-hour response time.
As noted, future analyses will use these baseline results to assess the rescuability rates associated with alternative rescue options. The relative cost and effectiveness of each potential option will then be determined and compared. The analysis will recognize that the arrival of rescue assets, no matter how fast, will not guarantee that an injured person will survive. The analysis will also account for the different roles of care that could be performed by the rescue asset, as well as the initial military treatment facility. Faster will always be better when it comes to personnel rescues, but the policy question will continue to revolve around balancing the benefits of speed and improved care with the operational, clinical, and financial costs.
3 Reading Figure S.2, we see, for example, that the average curve is 0-percent change in rescuability at our reference point of six hours (0 on the x-axis). If we go to the far right of the x-axis, which corresponds to a response time of 12 hours (+6 on the x-axis), we see that the average rescuability change is −12 percent. Hence, a 12-hour response time, compared with a six-hour response time, corresponds to an average 12-percent decrease in the number of personnel who are likely still rescuable.
xv
Acknowledgments
The authors are extremely appreciative of the support they received from U.S. Africa Command. In particular, we would like to thank the project sponsor, Mike Maxwell, as well as LTC Marv King. We also thank LCDR Michael Kamas, Maj David Risius, CDR Byron Wiggins, Rick Barnes, and Dawn Underwood for their continuing support.
At RAND, we are greatly thankful for the analytic support pro-vided by Ed Chan and Cameron Wright. We would also like to thank Adam Grissom for his excellent feedback and suggestions throughout this research, as well as Michael Kennedy for his earlier work, which served as a solid foundation for us to build on. We would also like to acknowledge the excellent management support we received from Seth Jones and Chris Chivvis.


1
CHAPTER ONE
Introduction and Methodology
Motivation and Research Objectives
Conducting medical evacuations and other personnel recovery mis-sions for military and support personnel is a critical task for the U.S. Department of Defense (DoD). Providing this capability is especially challenging in Africa because of its vast geographic scope and the small number of U.S. personnel scattered across the continent. A very large area needs to be covered with relatively limited resources.
While it is always better to reach an injured person faster, the degree to which greater speed can improve the rescuability of a person needs to be quantified.1 Therefore, the objective of this research is to quantify the rescuability window—that is, the survivable length of time—for U.S. military, DoD civilian, and DoD contractor employ-ees who are injured and in need of medical care. In the context of the U.S. Africa Command (AFRICOM) area of responsibility (AOR), life-threatening injuries could result from, for example, hostile fire while training African partner forces, a mortar or gunman attack on a for-ward operating base, or even a vehicular or industrial accident.2 In any such event, a speedy response will be a priority. But absent information
1 We define rescuability as the likelihood that a person is still rescuable (i.e., surviving) until rescue forces arrive.2 Our modeling is based on a distribution of potential injury levels, rather than on specific combat injuries, since the precise causes of life-threatening injuries were generally not avail-able in the Medical Planners’ Toolkit (MPTk). The injury levels, however, capture all causes of injuries. In this analysis, the cause of an injury is not the critical factor; rather, it is the mortality risk associated with that injury.
2 Timelines for Reaching Injured Personnel in Africa
regarding the relationship between rescuability and time, relative to the mortality risk and the care initially available for assistance, it is not possible to quantify the effectiveness (or cost-effectiveness) of changes in the way rescues are conducted.
By quantifying the value of time needed to rescue people under a variety of crisis conditions, it will be possible to compare investments in rescue assets with investments in medical resources—in terms of both cost and increased likelihood of rescue (net benefit). Similarly, the cost-effectiveness of these investments can then be compared with that of other rescue-related alternatives, such as increased reliance on con-tractor rescue capabilities, improved communication, improved com-mand and control, and indigenous medical capabilities. Ultimately, the most cost-effective options among all the available alternatives could then be pursued.
In the context of this analysis, we define rescue as the entire sequence of events, from the time of incident to the final disposition of the injured personnel. More narrowly, we define incident response as just the first part of the rescue sequence, from the time of incident to the first arrival of rescue forces, be they on missions of casualty evacua-tion (CASEVAC), medical evacuation (MEDEVAC), personnel recov-ery (PR), or combat search and rescue (CSAR). Of course, the mere arrival of rescue forces does not guarantee that an injured person will survive. A much broader analysis would need to be conducted to evalu-ate the probability of the person surviving the injuries. In this report, we focus on just the early part of the sequence, illustrated in Figure 1.1.
It is also important to note that, because of doctrinal differences among MEDEVAC (the movement of injured personnel along with medical attendants for en route care, generally aboard dedicated air-craft), CASEVAC (the movement of injured personnel by other, expe-dient means), aeromedical evacuation (the movement of regulated and validated patients, along with time-sensitive en route care),3 and PR (the
3 By validated, we mean that the injured personnel have been approved for aeromedical evacuation by medical personnel at the medical treatment facility (MTF), and by regulated, we mean that the injured personnel have been assigned to their next MTF destination in a deliberate way, including approval for receipt at that MTF.

Introduction and Methodology 3
recovery and reintegration of distressed personnel who have become separated from their units or agencies), we use the terms rescue and res-cuability to encompass the range of transport and medical-care options that may be utilized while attempting to save the life of a person with life-threatening injuries, regardless of mission type.4
Methodology
Our methodology has two components, both drawn from DoD-accredited planning tools. First, we use the Joint Medical Planning Tool (JMPT)5 to derive clinical information about mortality curves
4 Joint Publication 4-02, Health Service Support, Washington, D.C.: Joint Chiefs of Staff , July 26, 2012; and Joint Publication 3-50, Personnel Recovery, Washington, D.C.: Joint Chiefs of Staff , December 20, 2011.5 Teledyne Brown Engineering Inc., Joint Medical Planning Tool Methodology Manual, Huntsville, Ala., Version 8.1, 2002–2015.
Figure 1.1Incident Response Covers Just the First Part of the Rescue Chain
NOTE: This is a notional rescue chain. The aircraft involved, the military treatment facilities (MTFs) utilized, and other details can be highly variable. The research presented here focuses on just the incident response. Definitive care refers to the completion of recommended treatment.RAND RR1536-1.1
Incident response
Point of injury
Aid station or other MTF
Theater hospital or other MTF
Definitive care

4 Timelines for Reaching Injured Personnel in Africa
associated with injuries of different mortality risk levels and with inci-dent responses involving different tiers of medical care (or, to use mili-tary terminology, different medical-care roles). The JMPT is a com-puter-based simulation program that plays a prominent role in the military medical literature.
Second, we use the Medical Planners’ Toolkit (MPTk) for esti-mates of the distribution of mortality risk levels associated with injuries suffered across a sampling of historical military operations.6 In this way, both the military medical information about mortality curves and the historical information about injury distributions inform our find-ings regarding the effects of incident response speed on PR missions.
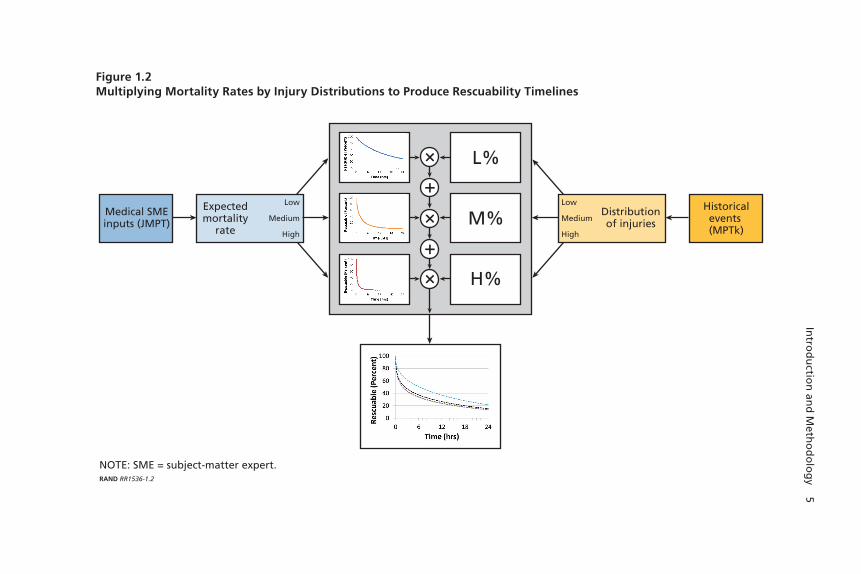
Figure 1.2 schematically portrays our methodology. Essentially, we take an average of the JMPT mortality rates (for each level of injury severity and each role of medical care), weighted by the MPTk injury distributions (of low, medium, and high mortality risks from a given historical operation).7 The end product is a rescuability curve or a rescu-ability timeline for each operation. Note that a JMPT mortality curve is more specific than a rescuability curve: The latter represents a single mortality risk level, while the former represents an average distribution across the mortality risk levels.
Our analysis and recommendations pertain exclusively to the res-cuability window of injured personnel—in particular, those with life-threatening injuries. The rescuability window refers to the period only up until the moment that rescue assets arrive. We do not analyze the likelihood of personnel survival beyond this point of arrival. Even after the rescue assets arrive, survival will still depend on a number of fac-tors, such as the capabilities of the rescue forces; however, these factors are beyond the scope of this analysis. These factors could be captured in future modeling efforts.
6 See Naval Health Research Center, Medical Planners’ Toolkit (MPTk), San Diego, Calif., 2013.7 MPTk provides the distribution of life-threatening injuries (low, medium, and high mor-tality risk), not the actual survival rates of the particular individuals involved in the conflicts.
Intro
du
ction
and
Meth
od
olo
gy 5
Figure 1.2Multiplying Mortality Rates by Injury Distributions to Produce Rescuability Timelines
NOTE: SME = subject-matter expert.RAND RR1536-1.2
Medical SMEinputs (JMPT)
Expectedmortality
rate
Distributionof injuries
Historicalevents (MPTk)
Low
Medium
High
Low
Medium
High
×
+
+
×
×
L%
M%
H%

6 Timelines for Reaching Injured Personnel in Africa
Mortality Data from the JMPT
In the military medical literature, the mortality data contained within the JMPT serve as the basis for mortality modeling for numerous injury types. Developed by the Naval Health Research Center and Teledyne Brown Engineering, the JMPT is the official medical planning tool of the Defense Health Agency.
For each injury type, the JMPT provides a mortality curve repre-senting the likelihood of a person with that injury type dying as a func-tion of time, as well as the level of mortality risk and the role of medical care. The JMPT also assigns each injury type a condition code, known as an ICD-9 code (ICD-9 stands for the Ninth Revision of the Interna-tional Classification of Diseases).8 More than 300 ICD-9 codes cover a wide range of medical conditions, from tetanus, to a closed fracture of nasal bones, to an open head wound with complications. A listing of medical conditions used in the JMPT, with their associated ICD-9 codes and mortality risks, appears in Appendix A.
The JMPT categorizes the hundreds of conditions into one of four mortality risk levels: high, medium, low, and non–life-threatening (NLT). The JMPT also distinguishes among seven medical-care roles, in order of clinical advancement: self-aid/buddy care (SABC), first-responder care, battalion aid station, emergency trauma care, forward resuscitative care, theater hospitalization, and definitive care (or comple-tion of recommended treatment).
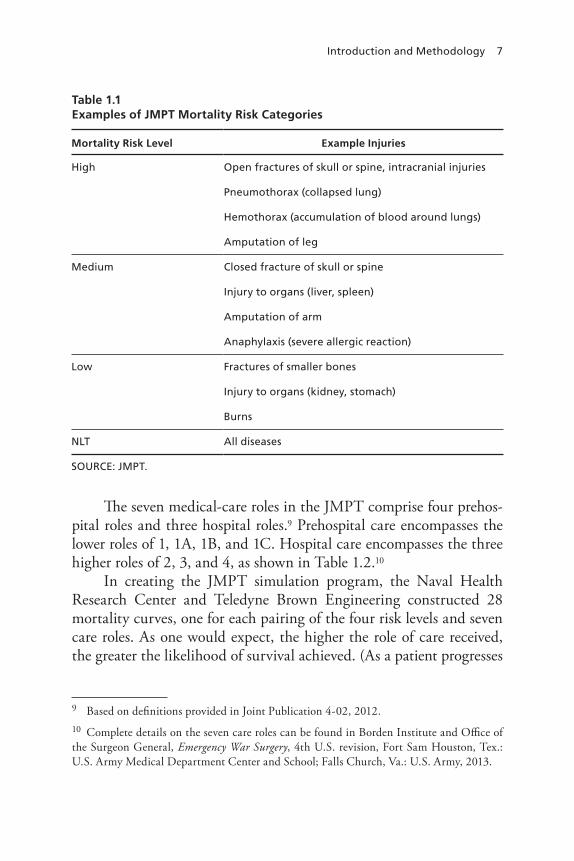
Because every ICD-9 is associated with one of just four mortality risks, it is the distribution among the four risks—and not the distri-bution among the hundreds of injuries or conditions—that is impor-tant in mortality modeling. In other words, the model does not need to know the difference between such disparate injuries as “a closed fracture of vault of skull without intracranial injury” and “a crushing injury of trunk,” because both are modeled as having the same mortal-ity risk (in this case, medium). Table 1.1 shows additional examples of dissimilar injuries placed into equivalent mortality risk categories by the JMPT.
8 World Health Organization, Ninth International Classification of Diseases, Ninth Revision (ICD-9), Vol. 1, Geneva, 1978.
Introduction and Methodology 7
The seven medical-care roles in the JMPT comprise four prehos-pital roles and three hospital roles.9 Prehospital care encompasses the lower roles of 1, 1A, 1B, and 1C. Hospital care encompasses the three higher roles of 2, 3, and 4, as shown in Table 1.2.10
In creating the JMPT simulation program, the Naval Health Research Center and Teledyne Brown Engineering constructed 28 mortality curves, one for each pairing of the four risk levels and seven care roles. As one would expect, the higher the role of care received, the greater the likelihood of survival achieved. (As a patient progresses
9 Based on definitions provided in Joint Publication 4-02, 2012.10 Complete details on the seven care roles can be found in Borden Institute and Office of the Surgeon General, Emergency War Surgery, 4th U.S. revision, Fort Sam Houston, Tex.: U.S. Army Medical Department Center and School; Falls Church, Va.: U.S. Army, 2013.
Table 1.1Examples of JMPT Mortality Risk Categories
Mortality Risk Level Example Injuries
High Open fractures of skull or spine, intracranial injuries
Pneumothorax (collapsed lung)
Hemothorax (accumulation of blood around lungs)
Amputation of leg
Medium Closed fracture of skull or spine
Injury to organs (liver, spleen)
Amputation of arm
Anaphylaxis (severe allergic reaction)
Low Fractures of smaller bones
Injury to organs (kidney, stomach)
Burns
NLT All diseases
SOURCE: JMPT.

8 Timelines for Reaching Injured Personnel in Africa
through one or more clinical steps toward higher roles of care, the mor-tality curve associated with each higher role of care affords the patient better odds of survival.)
The JMPT mortality curves are based either on expert opinion or on medical records. For the prehospital roles of care (roles 1 through 1C), the mortality curves are based on input from a panel of subject-matter experts. The experts were asked, for example, “Out of 100 patients with a particular ICD-9 code, receiving only first responder care, how many of those 100 would you expect to survive a half hour after injury? Three hours?” The results were then fitted to Weibull curves.11
11 Ray Mitchell, Mike Galarneau, Bill Hancock, and Doug Lowe, Modeling Dynamic Casu-alty Mortality Curves in the Tactical Medical Logistics (TML+) Planning Tool, San Diego, Calif.: Naval Health Research Center, Report No. 04-31, 2004.
Table 1.2Prehospital and Hospital Roles of Care
Prehospital and Hospital Role Definition of Care Examples
Prehospital 1 SABC
1A First-responder care
Combat medic, medical technician
1B Aid-station care Battalion aid station, squadron medical element
1C Emergency trauma care
Shock trauma platoon
Hospital 2 Forward resuscitative care
Forward surgical team, Expeditionary Medical Support– Health Response Team
3 Theater hospitalization
Combat support hospital, Expeditionary Medical Support +25
4 Definitive care Continental United States hospital, Landstuhl Regional Medical Center
SOURCE: JMPT.
NOTE: Definitive care = completion of recommended treatment.
Introduction and Methodology 9
For patients receiving surgical and hospital care (roles 2 and 3), the mortality curves were derived from patient data from Operation Enduring Freedom (OEF) and Operation Iraqi Freedom (OIF), cover-ing about the first six or 24 hours postinjury, respectively. The results were then fitted to lognormal curves.
Our focus of concern is the provision of life-saving or life-preserving medical care for injured personnel prior to the arrival of a rescue team. In the context of AFRICOM, injured personnel would very likely face severely constrained medical options: SABC, possibly first-responder care, and, at most, a battalion aid station. The opportu-nities for emergency trauma care, forward resuscitative (surgical) care, and theater hospital care would generally not be available for injured personnel in Africa, other than at specific locations. Moving forward, therefore, we will compare the likely effects on survival of only the three lowest roles of care: roles 1 through 1B.
Historical Data from the MPTk
The MPTk is a companion planning tool to the JMPT. The MPTk provides the distribution of injury risks for a typical conflict scenario. The distribution of injury risks across historical events depends on the specifics of each historical scenario.
In addition to reviewing the overall JMPT mortality curves asso-ciated with the three lowest roles of care for injuries of different mor-tality risk levels, we look closely at data from about half of the relevant historical combat events that are contained within the MPTk for infor-mation about the real-world distribution of injury risks. We focus on five historical data sets, three of which are recent (from OEF and OIF) and one of which contains data from Africa. We recognize that the available data may or may not be representative of the conditions that rescue missions would be expected to encounter in Africa.12
12 We are limited to the historical event data contained within the MPTk. While we believe that these data represent a wide range of historical operations, we acknowledge that this may be insufficient to cover the entire range of potential military operations. In Appendix B, we discuss the full set of events for which data are available.

10 Timelines for Reaching Injured Personnel in Africa
However, as we will later show, our results are fairly insensitive to the precise nature of each conflict. Because very few rescue missions involving personnel with life-threatening injuries have recently been conducted in Africa, and because the known details about such mis-sions are limited at any rate, we are not able to constrain our data set to Africa but must instead rely on a collection of historical cases repre-senting a range of locations and conditions. The five historical data sets we selected for this purpose are as follows:13
• OEF (U.S. Army data from Afghanistan from October 2001 to December 2014)
• Operation Gothic Serpent (the Battle of Mogadishu, Soma-lia, including the “Black Hawk down” incident, from August to October 1993)
• the Mayaguez incident (the Khmer Rouge seizure of the SS Maya-guez, anchored offshore a Cambodian island, in May 1975)
• OEF/OIF (multiservice data from Afghanistan and Iraq during the 2008–2009 surge in Iraq)
• the Second Battle of Fallujah (a joint American, Iraqi, and British offensive in Iraq, in November and December 2004).
The MPTk combined Operation Gothic Serpent and the Maya-guez incident under the term raid; therefore, these two events appear as a single case, as shown in Table 1.3. We also confine our analysis to the distribution of injuries posing low, medium, and high mortality risks across the five historical missions. We exclude NLT injuries from the analysis, because such injuries have no time urgency and thus are not germane to urgent PR missions (although a speedy response would, of course, be highly desirable in these cases as well).
Table 1.3 shows that the NLT injuries,14 which we excluded, had originally accounted for the majority of injuries in every historical case.
13 Appendix B includes details on additional historical events. Given the overlap and simi-larity between the OEF and OIF data sets, we should not be surprised to see a great deal of similarity between these events.14 The MPTk considers all diseases to be NLT. While this is obviously not always true, it is true that few diseases will kill within hours of the symptoms first appearing—i.e., the time horizon of a rescue mission.

Introduction and Methodology 11
For purposes of clearer distinctions among the three remaining catego-ries of mortality risk, therefore, we converted their percentage shares to total 100 percent, as indicated in the right portion of Table 1.3. In three of these four resulting totals, roughly one-half of the life-threatening injuries were of low mortality risk, one-eighth were of medium mortal-ity risk, and three-eighths were of high mortality risk. The exception to the rule is the combined Gothic Serpent/Mayaguez data set.
By combining the JMPT mortality curves with the MPTk distri-butions of life-threatening injuries across the historical events, we could begin to plot real-world relationships between rescuability and time for personnel with different kinds of life-threatening injuries who receive different kinds of medical-care responses. Chapter Two takes a step-by-step approach to showing how we combined the JMPT curves with the MPTk distributions to plot the historical relationships between rescuability and time. These plotted relationships are what we refer to as rescuability timelines.
Table 1.3Distribution of Mortality Risks Across Four Historical Cases
EventNLT Injury
(%)
Life-Threatening
Injury (%)
Breakdown of Life-Threatening Injuries, by Mortality Risk (%)
Low Medium High
OEF (Army) 58 42 45 16 38
Gothic Serpent/Mayaguez 85 15 74 5 22
OEF/OIF (2008–2009) 51 49 47 13 40
Second Battle of Fallujah 56 44 52 12 36
SOURCE: MPTk.
NOTE: These numbers are rounded and do not always sum to 100.


13
CHAPTER TWO
Rescuability Data and Results
Mortality Curves
The JMPT mortality curves serve as the initial building blocks for our rescuability timelines. The JMPT mortality curves show survival time-lines as a function of mortality risk levels and medical-care roles. Our rescuability timelines then incorporate MPTk historical data on the distribution of mortality risk levels associated with injuries suffered in Afghanistan, Cambodia, Somalia, and Iraq to estimate the overall rela-tionships between rescuability and time for injured personnel in each operational setting.
It is important to note that the distribution of injury levels in these combat operations may not be predictive of the particular life-threatening injuries that may be expected in AFRICOM in the present or in the future.1 However, the historical operations do serve as useful cases to illustrate the impacts of different rescue alternatives across a distribution of mortality risk levels. Again, the cause of each individual injury is not important for this analysis. What is important is the dis-tribution of mortality risk levels across the life-threatening injuries. We know that we should not expect all injuries in AFRICOM to be low mortality risk, medium mortality risk, or high mortality risk; rather,
1 It is important to note that we are focusing on the distribution of mortality risk and not the distribution of injuries. A preliminary analysis of AFRICOM injury data for 2015 shows injuries that are fundamentally different from those seen in OEF and OIF; however, the dis-tribution of mortality risk seen in the AFRICOM data is not inconsistent with the distribu-tion of mortality risk seen in OEF and OIF.

14 Timelines for Reaching Injured Personnel in Africa
the distribution of injury levels will be some mix of low, medium, and high. Therefore, we use as much historical data as are available in the MPTk to infer what this mix could potentially be. Planners might find the distributions used here to be unsuitable to Africa, so Figures 2.1 through 2.3 show the underlying data as a direct function of each mor-tality risk level, and these curves could be combined with any desired distribution of mortality risk levels to generate updated or customized rescuability timelines.
Figure 2.1 shows the JMPT mortality curves for personnel with life-threatening injuries who receive only role 1 care (SABC) for life-threatening injuries of low, medium, or high mortality risk. Nearly 70 percent of personnel with injuries of low mortality risk are likely to survive six hours with SABC alone, while just 15 percent of personnel with injuries of medium mortality risk are expected to survive six hours with this type of care. Almost no personnel with injuries of high mor-tality risk are expected to survive six hours with this type of care, based on the JMPT data.
Figure 2.1Role 1—JMPT Mortality Curves with SABC
SOURCE: JMPT.NOTE: Rescuable is de�ned as the probability that an injured person is still alive.RAND RR1536-2.1
Res
cuab
le (
%)
Time (hrs)
0 1 24232221201918171615141312111098765432
100
90
80
70
60
50
40
30
20
10
0
Low mortality risk
Medium mortality risk
High mortality risk
Rescuability Data and Results 15
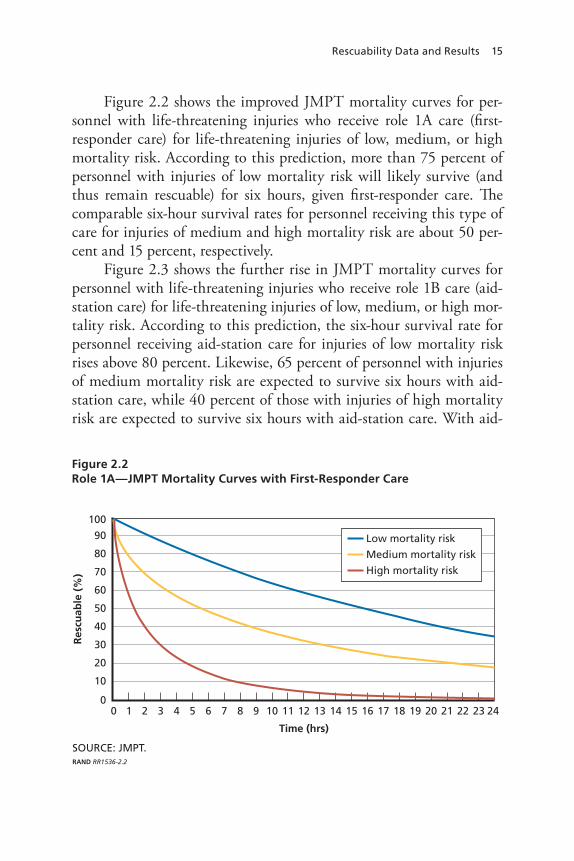
Figure 2.2 shows the improved JMPT mortality curves for per-sonnel with life-threatening injuries who receive role 1A care (first-responder care) for life-threatening injuries of low, medium, or high mortality risk. According to this prediction, more than 75 percent of personnel with injuries of low mortality risk will likely survive (and thus remain rescuable) for six hours, given first-responder care. The comparable six-hour survival rates for personnel receiving this type of care for injuries of medium and high mortality risk are about 50 per-cent and 15 percent, respectively.
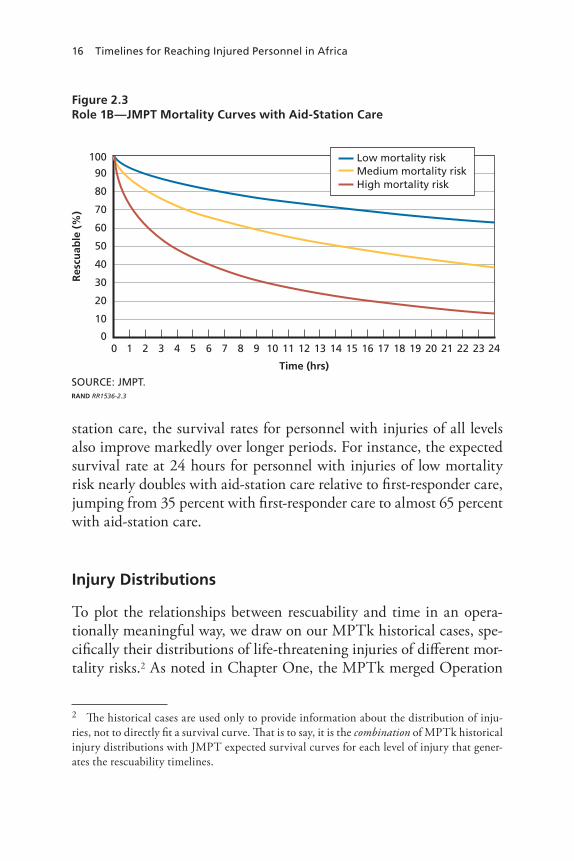
Figure 2.3 shows the further rise in JMPT mortality curves for personnel with life-threatening injuries who receive role 1B care (aid-station care) for life-threatening injuries of low, medium, or high mor-tality risk. According to this prediction, the six-hour survival rate for personnel receiving aid-station care for injuries of low mortality risk rises above 80 percent. Likewise, 65 percent of personnel with injuries of medium mortality risk are expected to survive six hours with aid-station care, while 40 percent of those with injuries of high mortality risk are expected to survive six hours with aid-station care. With aid-
Figure 2.2Role 1A—JMPT Mortality Curves with First-Responder Care
SOURCE: JMPT.RAND RR1536-2.2
Res
cuab
le (
%)
Time (hrs)
0 1 24232221201918171615141312111098765432
100
90
80
70
60
50
40
30
20
10
0
Low mortality risk
Medium mortality risk
High mortality risk
16 Timelines for Reaching Injured Personnel in Africa
station care, the survival rates for personnel with injuries of all levels also improve markedly over longer periods. For instance, the expected survival rate at 24 hours for personnel with injuries of low mortality risk nearly doubles with aid-station care relative to first-responder care, jumping from 35 percent with first-responder care to almost 65 percent with aid-station care.
Injury Distributions
To plot the relationships between rescuability and time in an opera-tionally meaningful way, we draw on our MPTk historical cases, spe-cifically their distributions of life-threatening injuries of different mor-tality risks.2 As noted in Chapter One, the MPTk merged Operation
2 The historical cases are used only to provide information about the distribution of inju-ries, not to directly fit a survival curve. That is to say, it is the combination of MPTk historical injury distributions with JMPT expected survival curves for each level of injury that gener-ates the rescuability timelines.
Figure 2.3Role 1B—JMPT Mortality Curves with Aid-Station Care
SOURCE: JMPT.RAND RR1536-2.3
Res
cuab
le (
%)
Time (hrs)
0 1 24232221201918171615141312111098765432
100
90
80
70
60
50
40
30
20
10
0
Low mortality riskMedium mortality riskHigh mortality risk
Rescuability Data and Results 17
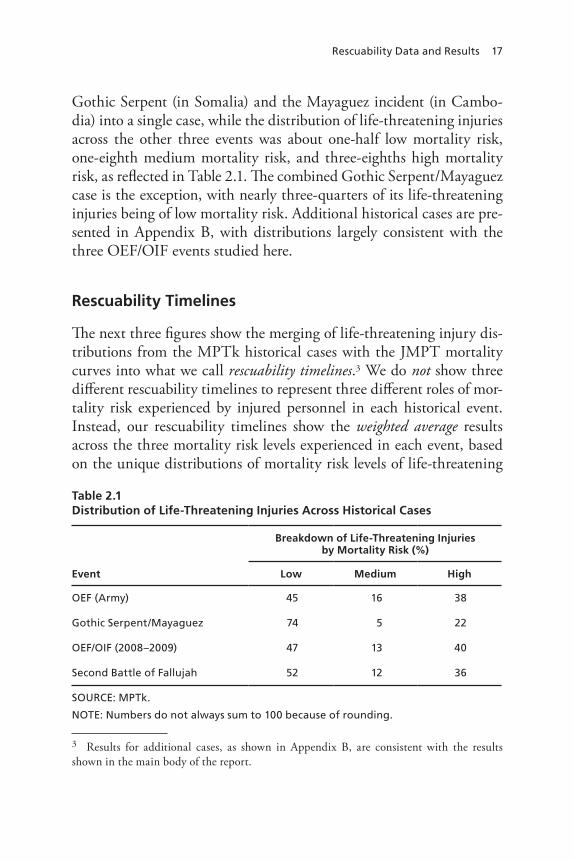
Gothic Serpent (in Somalia) and the Mayaguez incident (in Cambo-dia) into a single case, while the distribution of life-threatening injuries across the other three events was about one-half low mortality risk, one-eighth medium mortality risk, and three-eighths high mortality risk, as reflected in Table 2.1. The combined Gothic Serpent/Mayaguez case is the exception, with nearly three-quarters of its life-threatening injuries being of low mortality risk. Additional historical cases are pre-sented in Appendix B, with distributions largely consistent with the three OEF/OIF events studied here.
Rescuability Timelines
The next three figures show the merging of life-threatening injury dis-tributions from the MPTk historical cases with the JMPT mortality curves into what we call rescuability timelines.3 We do not show three different rescuability timelines to represent three different roles of mor-tality risk experienced by injured personnel in each historical event. Instead, our rescuability timelines show the weighted average results across the three mortality risk levels experienced in each event, based on the unique distributions of mortality risk levels of life-threatening
3 Results for additional cases, as shown in Appendix B, are consistent with the results shown in the main body of the report.
Table 2.1Distribution of Life-Threatening Injuries Across Historical Cases
Event
Breakdown of Life-Threatening Injuries by Mortality Risk (%)
Low Medium High
OEF (Army) 45 16 38
Gothic Serpent/Mayaguez 74 5 22
OEF/OIF (2008–2009) 47 13 40
Second Battle of Fallujah 52 12 36
SOURCE: MPTk.
NOTE: Numbers do not always sum to 100 because of rounding.

18 Timelines for Reaching Injured Personnel in Africa
injuries suffered in each event.4 (This averaging naturally produces curves that fall somewhere between the JMPT’s low and high mortal-ity risk curves.)
Figure 2.4 shows the averaged, weighted rescuability timelines for personnel with life-threatening injuries receiving only role 1 care (SABC) for all types of life-threatening injuries and for all four his-torical data sets. The markedly higher curve for the Gothic Serpent/Mayaguez data set reflects the markedly higher proportion of low-risk injuries in that particular data set compared with the others. This pattern appears repeatedly across Figures 2.4 through 2.6. In Figure 2.4, we see that, overall, 50 percent of personnel facing any severity of life-threatening injury in the Gothic Serpent and Maya-guez cases survived six hours with SABC, whereas only about 35 per-cent of personnel facing any severity of life-threatening injury in the other historical cases survived six hours with this type of care.
4 Again, these curves are based not on the individual injuries suffered in the conflicts but rather on the distribution of life-threatening injuries (of low, medium, and high mortality risk) that occurred in the conflicts.
Figure 2.4Role 1—Rescuability Timelines with SABC
RAND RR1536-2.4
Res
cuab
le (
%)
Time (hrs)
0 1 24232221201918171615141312111098765432
100
90
80
70
60
50
40
30
20
10
0
Gothic Serpent/MayaguezSecond Battle of FallujahOEF/OIF (2008–2009)OEF (Army)
Rescuability Data and Results 19
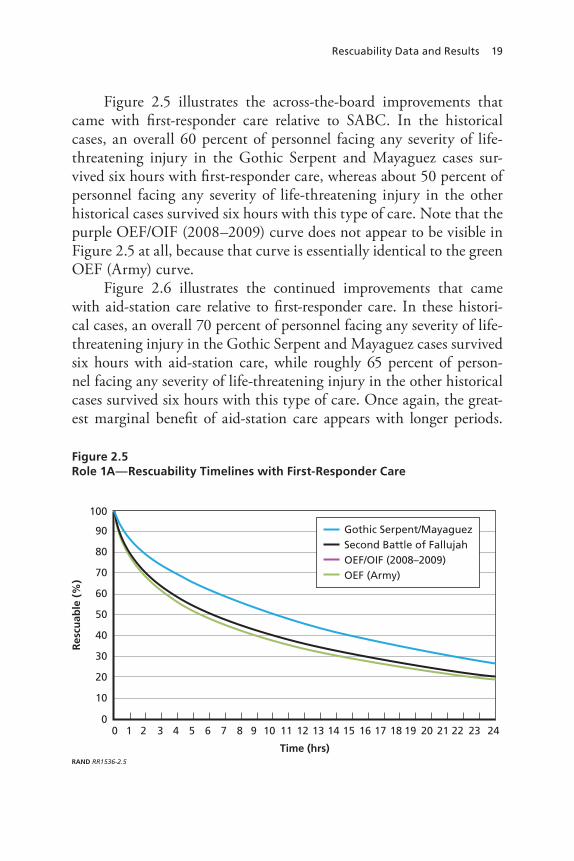
Figure 2.5 illustrates the across-the-board improvements that came with first-responder care relative to SABC. In the historical cases, an overall 60 percent of personnel facing any severity of life-threatening injury in the Gothic Serpent and Mayaguez cases sur-vived six hours with first-responder care, whereas about 50 percent of personnel facing any severity of life-threatening injury in the other historical cases survived six hours with this type of care. Note that the purple OEF/OIF (2008–2009) curve does not appear to be visible in Figure 2.5 at all, because that curve is essentially identical to the green OEF (Army) curve.
Figure 2.6 illustrates the continued improvements that came with aid-station care relative to first-responder care. In these histori-cal cases, an overall 70 percent of personnel facing any severity of life-threatening injury in the Gothic Serpent and Mayaguez cases survived six hours with aid-station care, while roughly 65 percent of person-nel facing any severity of life-threatening injury in the other historical cases survived six hours with this type of care. Once again, the great-est marginal benefit of aid-station care appears with longer periods.
Figure 2.5Role 1A—Rescuability Timelines with First-Responder Care
RAND RR1536-2.5
Res
cuab
le (
%)
Time (hrs)
0 1 24232221201918171615141312111098765432
100
90
80
70
60
50
40
30
20
10
0
Gothic Serpent/MayaguezSecond Battle of FallujahOEF/OIF (2008–2009)OEF (Army)

20 Timelines for Reaching Injured Personnel in Africa
Whereas the 24-hour rescuability rates for injured personnel receiv-ing first-responder care ranged from roughly 20 to 25 percent across the historical events, the 24-hour rescuability rates for such personnel receiving aid-station care nearly doubled, ranging from about 50 to more than 60 percent across the events. Also once again, the purple OEF/OIF (2008–2009) curve does not appear in the figure, because that curve is essentially identical to the green OEF (Army) curve.
Toward Comparisons of Cost-Effectiveness
The final step in summarizing our results is to establish baselines for comparing the cost-effectiveness of alternative approaches to PR in Africa. Because the results from three of the historical cases—OEF (Army), OEF/OIF (2008–2009), and the Second Battle of Fallujah—are very similar across all three medical-care roles, we consolidate the results from these cases into an aggregated data set called “OEF/OIF.”
Figure 2.6Role 1B—Rescuability Timelines with Aid-Station Care
RAND RR1536-2.6
Res
cuab
le (
%)
Time (hrs)
0 1 24232221201918171615141312111098765432
100
90
80
70
60
50
40
30
20
10
0
Gothic Serpent/MayaguezSecond Battle of FallujahOEF/OIF (2008–2009)OEF (Army)
Rescuability Data and Results 21
The similarity across these cases is not surprising given their similar distributions of life-threatening injuries.
In addition, following the naming convention used in the MPTk, we henceforward refer to the Gothic Serpent/Mayaguez curve simply as “Raid” to connote a limited operation to secure a modest objec-tive. This distinction allows us to detect whether there are any differ-ent effects of PR response alternatives in the context of raids versus campaigns.
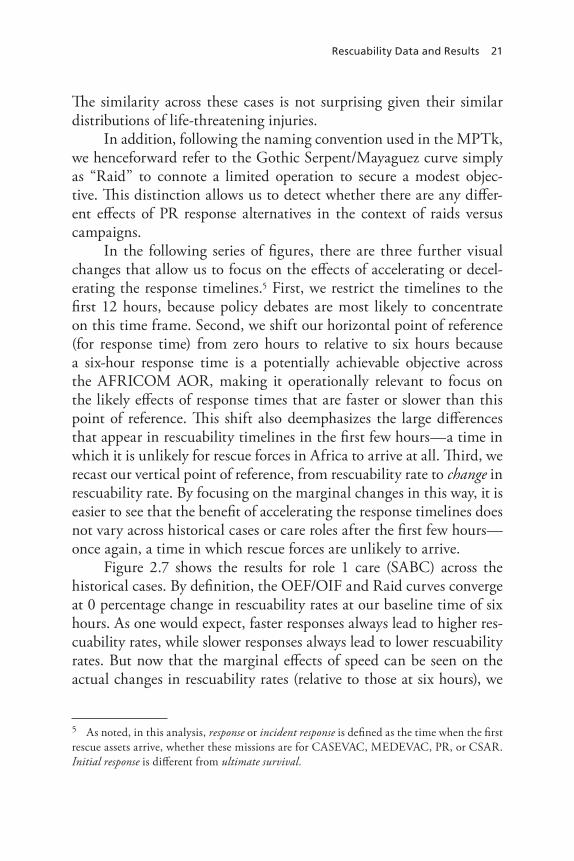
In the following series of figures, there are three further visual changes that allow us to focus on the effects of accelerating or decel-erating the response timelines.5 First, we restrict the timelines to the first 12 hours, because policy debates are most likely to concentrate on this time frame. Second, we shift our horizontal point of reference (for response time) from zero hours to relative to six hours because a six-hour response time is a potentially achievable objective across the AFRICOM AOR, making it operationally relevant to focus on the likely effects of response times that are faster or slower than this point of reference. This shift also deemphasizes the large differences that appear in rescuability timelines in the first few hours—a time in which it is unlikely for rescue forces in Africa to arrive at all. Third, we recast our vertical point of reference, from rescuability rate to change in rescuability rate. By focusing on the marginal changes in this way, it is easier to see that the benefit of accelerating the response timelines does not vary across historical cases or care roles after the first few hours—once again, a time in which rescue forces are unlikely to arrive.
Figure 2.7 shows the results for role 1 care (SABC) across the historical cases. By definition, the OEF/OIF and Raid curves converge at 0 percentage change in rescuability rates at our baseline time of six hours. As one would expect, faster responses always lead to higher res-cuability rates, while slower responses always lead to lower rescuability rates. But now that the marginal effects of speed can be seen on the actual changes in rescuability rates (relative to those at six hours), we
5 As noted, in this analysis, response or incident response is defined as the time when the first rescue assets arrive, whether these missions are for CASEVAC, MEDEVAC, PR, or CSAR. Initial response is different from ultimate survival.
22 Timelines for Reaching Injured Personnel in Africa
can ask: Would faster responses lead to enough of an improvement to justify their expense?
In Figure 2.7, we see that accelerating the response time by two hours for injured personnel with access to SABC alone raised the res-cuability rate more than 5 percent in both types of operations, while accelerating the response time by four hours for these personnel raised the rescuability rate roughly 15 percent in both types of operations. Compared with accelerated response times, the decelerated response times caused slightly smaller changes in rescuability rates.
Faster responses prompted only slightly larger gains in the Raid curve than in the OEF/OIF curve, while slower responses prompted relatively larger losses in the Raid curve than in the OEF/OIF curve. However, the speed of responses had nearly the same overall impact regardless of the scenario, indicating that the relative change in res-cuability, as a function of response speed, was fairly insensitive to the precise injury distribution represented by each scenario.
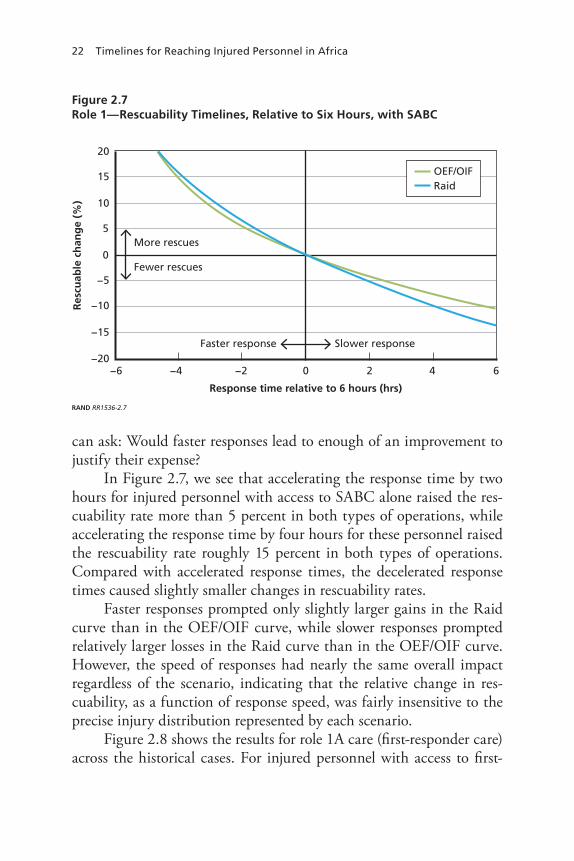
Figure 2.8 shows the results for role 1A care (first-responder care) across the historical cases. For injured personnel with access to first-
Figure 2.7Role 1—Rescuability Timelines, Relative to Six Hours, with SABC
RAND RR1536-2.7
Res
cuab
le c
han
ge
(%)
Response time relative to 6 hours (hrs)
More rescues
Fewer rescues
Slower responseFaster response
−6 6420−2−4
20
15
10
5
0
−5
−10
−15
−20
OEF/OIFRaid
Rescuability Data and Results 23
responder care, accelerating the response time by two hours raised the rescuability rate about 8 percent in both types of operations, while accelerating the response time by four hours raised the rate nearly 20 percent for both cases. Again, the curves were strikingly similar for both the OEF/OIF and the Raid data sets.
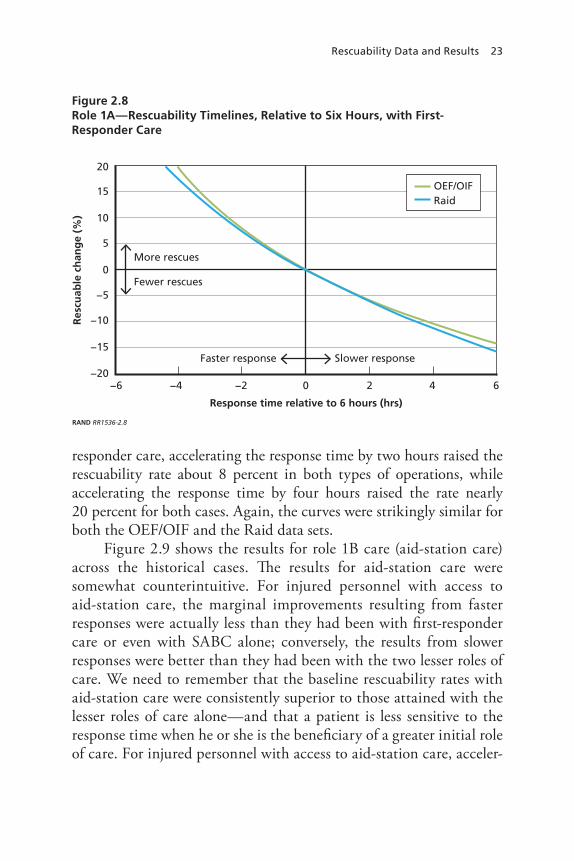
Figure 2.9 shows the results for role 1B care (aid-station care) across the historical cases. The results for aid-station care were somewhat counterintuitive. For injured personnel with access to aid-station care, the marginal improvements resulting from faster responses were actually less than they had been with first-responder care or even with SABC alone; conversely, the results from slower responses were better than they had been with the two lesser roles of care. We need to remember that the baseline rescuability rates with aid-station care were consistently superior to those attained with the lesser roles of care alone—and that a patient is less sensitive to the response time when he or she is the beneficiary of a greater initial role of care. For injured personnel with access to aid-station care, acceler-
Figure 2.8Role 1A—Rescuability Timelines, Relative to Six Hours, with First-Responder Care
RAND RR1536-2.8
Res
cuab
le c
han
ge
(%)
Response time relative to 6 hours (hrs)
More rescues
Fewer rescues
Slower responseFaster response
−6 6420−2−4
20
15
10
5
0
−5
−10
−15
−20
OEF/OIFRaid

24 Timelines for Reaching Injured Personnel in Africa
ating the response time by two hours raised the rescuability rate only about 5 percent in both types of operations, while accelerating the response time by four hours raised the rescuability rate between 10 and 15 percent. Yet again, the curves were very similar for both types of operations.
Overarching Observations on Rescuability
In Figures 2.7, 2.8, and 2.9, only minor differences appeared between the OEF/OIF and the Raid rescuability curves for personnel with life-threatening injuries. The differences between the two types of opera-tions had seemed large initially (in Figures 2.4, 2.5, and 2.6), but those differences were confined to the first few hours. Afterward, the curves (and, specifically, the changes in curves) behaved quite similarly. In other words, the marginal benefits of speed were similar in both types of operations, assuming similar roles of care.
Figure 2.9Role 1B—Rescuability Timelines, Relative to Six Hours, with Aid-Station Care
RAND RR1536-2.9
Res
cuab
le c
han
ge
(%)
Response time relative to 6 hours (hrs)
More rescues
Fewer rescues
Slower responseFaster response
−6 6420−2−4
20
15
10
5
0
−5
−10
−15
−20
OEF/OIFRaid

Rescuability Data and Results 25
Slightly greater differences appear when comparing the results across the different roles of care. In Figure 2.10, we average the OEF/OIF and Raid curves for each role of care in Figures 2.7 to 2.9.6 One insight from this chart is that first-responder care, on average, is the most sen-sitive to changes in response speed, with considerably improved rescu-ability given faster response speed and considerably worse rescuability given slower response speed. That makes some intuitive sense. First-responder care is sufficient to help a larger number of people survive the first few hours but not sufficient to allow those personnel to wait out the arrival of rescue forces for very long. With SABC alone, the overall likelihood of survival is lower; thus, the percentage of people surviving the initial hours is lower, and consequently there is a smaller pool of rescuable personnel who can benefit from a faster response. Finally, the aid-station role of care can offer a higher baseline likelihood of survival by stabilizing patients and putting them in a better position to wait
6 A three-fourth weight was used for the OEF/OIF case and a one-fourth weight for the Raid case.
Figure 2.10Rescuability Rates Across Three Roles of Care
RAND RR1536-2.10
Res
cuab
le c
han
ge
(%)
Response time relative to 6 hours (hrs)
More rescues
Fewer rescues
Slower responseFaster response
−6 6420−2−4
20
15
10
5
0
−5
−10
−15
−20
SABCFirst responderAid station
26 Timelines for Reaching Injured Personnel in Africa
for rescue forces to arrive, making this role of care the least sensitive to changes in response speed, whether they be faster or slower.7
7 With SABC, only 39 percent of injured personnel will survive for six hours. With first-responder care, only 52 percent will survive for six hours. This increases to 65 percent for aid-station care. This illustrates that the proportion of people for whom the difference between six hours and 12 hours is of relevance is lowest for those receiving SABC and highest for those receiving aid-station care. However, of those who do survive the first six hours, 71 per-cent will survive an additional six hours with SABC alone, 72 percent will do so with first-responder care, and 84 percent will do so with aid-station care. It is this combination of the proportion of people who survive the first six hours and their relative risk for the next six hours that gives rise to the effect seen in Figure 2.10.

27
CHAPTER THREE
Conclusions
This report has found strikingly consistent results of different response speeds across historical cases and care roles. Especially with a six-hour response time as a point of reference for reaching personnel with life-threatening injuries, the marginal changes in rescuability rates resulting from changes in response speeds of up to six hours in either direction (faster or slower) were very similar across the historical cases. Likewise, the performance of three different care roles did not produce dramati-cally different rescuability rates.
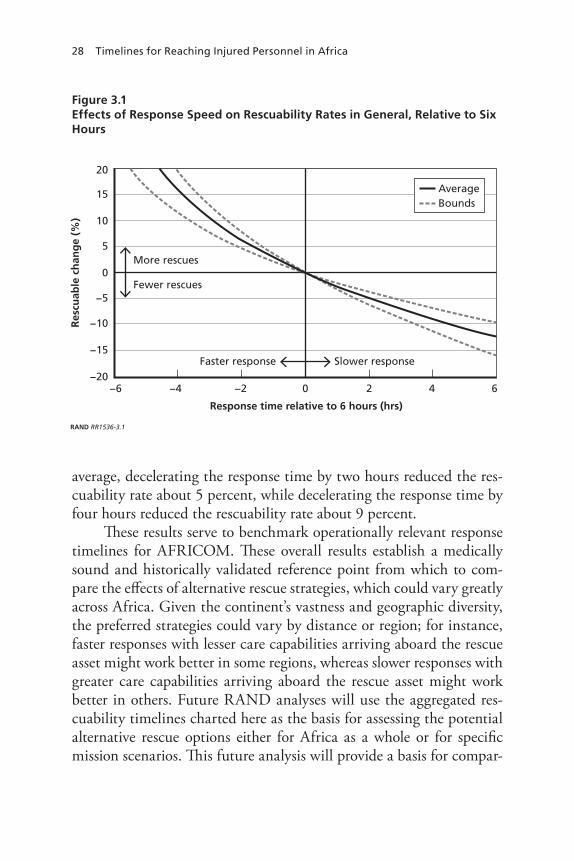
Because the rescuability rates were so consistent across the histori-cal, operational, and clinical cases, we are confident that an aggregated portrayal of the entire set of data can legitimately represent the likely effects of faster or slower personnel responses on rescuability rates in general, regardless of the historical, operational, or clinical settings. Therefore, we aggregate our findings in Figure 3.1, which shows the extremes (or bounds) of the results from Figures 2.7, 2.8, and 2.9. Spe-cifically, the bounds represent the highest and lowest likely changes in rescuability rates across the two types of scenarios and three types of care we considered. We also highlight the average of these consolidated results.
On average, as shown in Figure 3.1, accelerating the response time by two hours (faster than the six-hour standard for injured per-sonnel with access to any kind of care) across all historical cases and operational settings raised the rescuability rate about 7 percent, while accelerating the response time by four hours faster than this standard for these personnel raised the rescuability rate about 16 percent. On
28 Timelines for Reaching Injured Personnel in Africa
average, decelerating the response time by two hours reduced the res-cuability rate about 5 percent, while decelerating the response time by four hours reduced the rescuability rate about 9 percent.
These results serve to benchmark operationally relevant response timelines for AFRICOM. These overall results establish a medically sound and historically validated reference point from which to com-pare the effects of alternative rescue strategies, which could vary greatly across Africa. Given the continent’s vastness and geographic diversity, the preferred strategies could vary by distance or region; for instance, faster responses with lesser care capabilities arriving aboard the rescue asset might work better in some regions, whereas slower responses with greater care capabilities arriving aboard the rescue asset might work better in others. Future RAND analyses will use the aggregated res-cuability timelines charted here as the basis for assessing the potential alternative rescue options either for Africa as a whole or for specific mission scenarios. This future analysis will provide a basis for compar-
Figure 3.1Effects of Response Speed on Rescuability Rates in General, Relative to Six Hours
RAND RR1536-3.1
Res
cuab
le c
han
ge
(%)
Response time relative to 6 hours (hrs)
More rescues
Fewer rescues
Slower responseFaster response
−6 6420−2−4
20
15
10
5
0
−5
−10
−15
−20
AverageBounds

Conclusions 29
ing the overall benefits of speed and improved care with the associated operational, clinical, and financial costs.
In some cases in Africa, a six-hour response time would be oper-ationally infeasible. Therefore, we also looked at a 12-hour response as the baseline, and we again compared the results given marginal changes in response times up to six hours in either direction (faster or slower). The marginal changes in rescuability rates with a 12-hour point of reference were generally half as large as they were with a six-hour point of reference.
On average, as shown in Figure 3.2, accelerating the response time by two hours (faster than a 12-hour standard for personnel with life-threatening injuries and access to any kind of care) across all historical cases and operational settings raised the rescuability rate about 3 per-cent, while accelerating the response time by four hours faster than this standard for these personnel raised the rescuability rate about 7 per-cent. On average, decelerating the response time by two hours reduced
Figure 3.2Effects of Response Speed on Rescuability Rates in General, Relative to 12 Hours
RAND RR1536-3.2
Res
cuab
le c
han
ge
(%)
Response time relative to 12 hours (hrs)
More rescues
Fewer rescues
Slower responseFaster response
−6 6420−2−4
20
15
10
5
0
−5
−10
−15
−20
AverageBounds

30 Timelines for Reaching Injured Personnel in Africa
the rescuability rate about 3 percent, while decelerating the response time by four hours reduced the rescuability rate about 5 percent.
The timelines in both Figure 3.1 and Figure 3.2 indicate that, in absolute terms, 9 percent to 16 percent fewer injured personnel would survive 12 hours than would survive six hours while waiting to be res-cued. In Figure 3.1, this range of outcomes appears on the right side. In Figure 3.2, the same range of outcomes appears along the left side.
In summary, the baseline results from the overall rescuability timelines are as follows:
• Relative to a standard six-hour response time, marginal increases in response speeds of two to four hours could increase rescu-ability rates roughly 7 to 16 percent, on average, while marginal decreases in response speeds of two to four hours could decrease rescuability rates roughly 5 to 9 percent, on average.
• Relative to a standard 12-hour response time, marginal increases in response speeds of two to four hours would increase rescu-ability rates roughly 3 to 7 percent, on average, while marginal decreases in response speeds of two to four hours would decrease rescuability rates roughly 3 to 5 percent, on average.
• As illustrated by the bounds along the left side in Figure 3.2, a six-hour response time would result in 9 to 16 percent more per-sonnel being rescued than would a 12-hour response time. As illustrated by the bounds in Figure 3.1, a four-hour response time would result in 5 to 8 percent more personnel being rescued than would a six-hour response time. Likewise, as illustrated by the bounds in Figure 3.1, a two-hour response time would result in 12 to 20 percent more personnel being rescued than would a six-hour response time.
We observe that a faster response of six hours (relative to a 12-hour response time) would mean around a 12-percent improvement in the number of people potentially rescued. However, the costs to achieve

Conclusions 31
this improved rescuability timeline are likely significant. Judging these improvements against the costs will require further analysis.1
As mentioned, forthcoming analyses will use the aggregated res-cuability timelines in Figures 3.1 and 3.2 to assess the rescuability rates associated with potential alternative rescue options. The relative cost and effectiveness of each option will then be determined and com-pared. This analysis will recognize that the arrival of rescue assets, no matter how fast, will not guarantee that an injured person will sur-vive. The analysis will also consider the roles of care played throughout the entire rescue chain. This analysis will, for instance, compare faster responses with lesser roles of care against slower responses with greater roles of care. This forthcoming analysis will serve to answer the policy question of how to balance the benefits of speed and improved care with operational, clinical, and financial costs.
1 Had the improvement been 50 percent or 1 percent, the decision of whether or not to make the necessary investments might have been obvious.


33
APPENDIX A
List of ICD-9 Mortality Risks
Table A.1Medical Conditions, ICD-9 Codes, and Mortality Risks
Patient Code Category Description
Mortality Risk
005 Infectious Food poisoning bacterial NLT
006 Infectious Amebiasis NLT
007.9 Infectious Unspecified protozoal intestinal disease NLT
008.45 Infectious Intestinal infection due to clostridium difficile
NLT
008.8 Infectious Intestinal infection due to other organism not classified
NLT
010 Infectious Primary TB NLT
037 Infectious Tetanus NLT
038.9 Infectious Unspecified septicemia NLT
042 Infectious Human immunodeficiency virus (HIV) disease
NLT
047.9 Infectious Viral meningitis NLT
052 Infectious Varicella NLT
053 Infectious Herpes zoster NLT
054.1 Infectious Genital herpes NLT
057.0 Infectious Fifth disease NLT

34 Timelines for Reaching Injured Personnel in Africa
Patient Code Category Description
Mortality Risk
060 Infectious Yellow fever NLT
061 Infectious Dengue NLT
062 Infectious Mosquito-borne encephalitis NLT
063.9 Infectious Tick-borne encephalitis NLT
065 Infectious Arthropod-borne hemorrhagic fever NLT
066.40 Infectious West Nile fever, unspecified NLT
070.1 Infectious Viral hepatitis NLT
071 Infectious Rabies NLT
076 Infectious Trachoma NLT
078.0 Infectious Molluscom contagiosum NLT
078.1 Infectious Viral warts NLT
078.4 Infectious Hand, foot, and mouth disease NLT
079.3 Infectious Rhinovirus infection in conditions elsewhere and of unspecified site
NLT
079.99 Infectious Unspecified viral infection NLT
082 Infectious Tick-borne rickettsiosis NLT
084 Infectious Malaria NLT
085 Infectious Leishmaniasis, visceral NLT
086 Infectious Trypanosomiasis NLT
091 Infectious Early primary syphilis NLT
091.9 Infectious Secondary syphilis, unspecified NLT
094 Infectious Neurosyphilis NLT
098.5 Infectious Gonococcal arthritis NLT
099.4 Infectious Nongonococcal urethritis NLT
100 Infectious Leptospirosis NLT
274 Endocrine Gout NLT
Table A.1—Continued

List of ICD-9 Mortality Risks 35
Patient Code Category Description
Mortality Risk
276 Endocrine Disorder of fluid, electrolyte + acid base balance
NLT
296.0 Mental Disorders
Bipolar disorder, single manic episode NLT
298.9 Mental Disorders
Unspecified psychosis NLT
309.0 Mental Disorders
Adjustment disorder with depressed mood
NLT
309.81 Mental Disorders
PTSD NLT
309.9 Mental Disorders
Unspecified adjustment reaction NLT
310.2 Mental Disorders
Post concussion syndrome NLT
345.2 Sense Epilepsy petit mal NLT
345.3 Sense Epilepsy grand mal NLT
346 Misc Migraine NLT
361 Sense Retinal detachment NLT
364.3 Sense Uveitis NOS NLT
365 Sense Glaucoma NLT
370.0 Sense Corneal ulcer NLT
379.31 Sense Aphakia NLT
380.1 Sense Infective otitis externa NLT
380.4 Sense Impacted cerumen NLT
381 Sense Acute nonsuppurative otitis media NLT
381.9 Sense Unspecified eustachian tube disorder NLT
384.2 Sense Perforated tympanic membrane NLT
388.3 Sense Tinnitus, unspecified NLT
389.9 Sense Unspecified hearing loss NLT
Table A.1—Continued
36 Timelines for Reaching Injured Personnel in Africa
Patient Code Category Description
Mortality Risk
401 Circulatory Essential hypertension NLT
410 Circulatory Myocardial infarction NLT
413.9 Circulatory Other and unspecified angina pectoris NLT
427.9 Circulatory Cardiac dysryhthmia unspecified NLT
453.4 Circulatory Venous embolism/thrombus of deep vessels lower extremity
NLT
462 Respiratory Acute pharyngitis NLT
465 Respiratory Acute upper respiratory infections of multiple or unspecified sites
NLT
466 Respiratory Acute bronchitis and bronchiolitis NLT
475 Respiratory Peritonsillar abscess NLT
486 Respiratory Pneumonia, organism unspecified NLT
491 Respiratory Chronic bronchitis NLT
492 Respiratory Emphysema NLT
493.9 Respiratory Asthma NLT
523 Digestive Gingival and periodontal disease NLT
530.2 Digestive Ulcer of esophagus NLT
530.81 Digestive Gastroesophageal reflux NLT
531 Digestive Gastric ulcer NLT
532 Digestive Duodenal ulcer NLT
540.9 Digestive Acute appendicitis without mention of peritonitis
NLT
541 Digestive Appendicitis, unspecified NLT
550.9 Digestive Unilateral inguinal hernia NLT
553.1 Digestive Umbilical hernia NLT
553.9 Digestive Hernia NOS NLT
564.0 Digestive Constipation NLT
Table A.1—Continued

List of ICD-9 Mortality Risks 37
Patient Code Category Description
Mortality Risk
564.1 Digestive Irritable bowel disease NLT
566 Digestive Abscess of anal and rectal regions NLT
567.9 Digestive Unspecified peritonitis NLT
574 Digestive Cholelithiasis NLT
577.0 Digestive Acute pancreatitis NLT
577.1 Digestive Chronic pancreatitis NLT
578.9 Digestive Hemorrhage of gastrointestinal tract unspecified
NLT
584.9 Genitourinary Acute renal failure, unspecified NLT
592 Genitourinary Calculus of kidney NLT
599.0 Genitourinary Unspecified urinary tract infection NLT
599.7 Genitourinary Hematuria NLT
608.2 Genitourinary Torsion of testes NLT
608.4 Genitourinary Other inflammatory disorders of male genital organs
NLT
611.7 Genitourinary Breast lump NLT
633 Pregnancy Ectopic pregnancy NLT
634 Pregnancy Spontaneous abortion NLT
681 Skin Cellulitis and abscess of finger and toe NLT
682.0 Skin Cellulitis and abscess of face NLT
682.6 Skin Cellulitis and abscess of leg except foot NLT
682.7 Skin Cellulitis and abscess of foot except toes NLT
682.9 Skin Cellulitis and abscess of unspecified parts NLT
719.41 Musculoskeletal Pain in joint shoulder NLT
719.46 Musculoskeletal Pain in joint lower leg NLT
719.47 Musculoskeletal Pain in joint ankle/foot NLT
Table A.1—Continued
38 Timelines for Reaching Injured Personnel in Africa
Patient Code Category Description
Mortality Risk
722.1 Musculoskeletal Displacement lumbar intervertebral disc without myelopathy
NLT
723.0 Musculoskeletal Spinal stenosis in cervical region NLT
724.02 Musculoskeletal Spinal stenosis of lumbar region NLT
724.2 Musculoskeletal Lumbago NLT
724.3 Musculoskeletal Sciatica NLT
724.4 Musculoskeletal Lumbar sprain (thoracic/lumbosacral) neuritis or radiculitis, unspecified
NLT
724.5 Musculoskeletal Backache unspecified NLT
726.10 Musculoskeletal Disorders of bursae and tendons in shoulder, unspecified
NLT
726.12 Musculoskeletal Bicipital tenosynovitis NLT
726.3 Musculoskeletal Enthesopathy of elbow region NLT
726.4 Musculoskeletal Enthesopathy of wrist and carpus NLT
726.5 Musculoskeletal Enthesopathy of hip region NLT
726.6 Musculoskeletal Enthesopathy of knee NLT
726.7 Musculoskeletal Enthesopathy of ankle and tarsus NLT
729.0 Musculoskeletal Rheumatism unspecified and fibrositis NLT
729.5 Musculoskeletal Pain in limb NLT
780.0 Ill-defined Alterations of consciousness NLT
780.2 Ill-defined Syncope NLT
780.39 Ill-defined Other convulsions NLT
780.5 Ill-defined Sleep disturbances NLT
780.6 Ill-defined Fever NLT
782.1 Ill-defined Rash and other nonspecific skin eruptions NLT
782.3 Ill-defined Edema NLT
783.0 Ill-defined Anorexia NLT
Table A.1—Continued
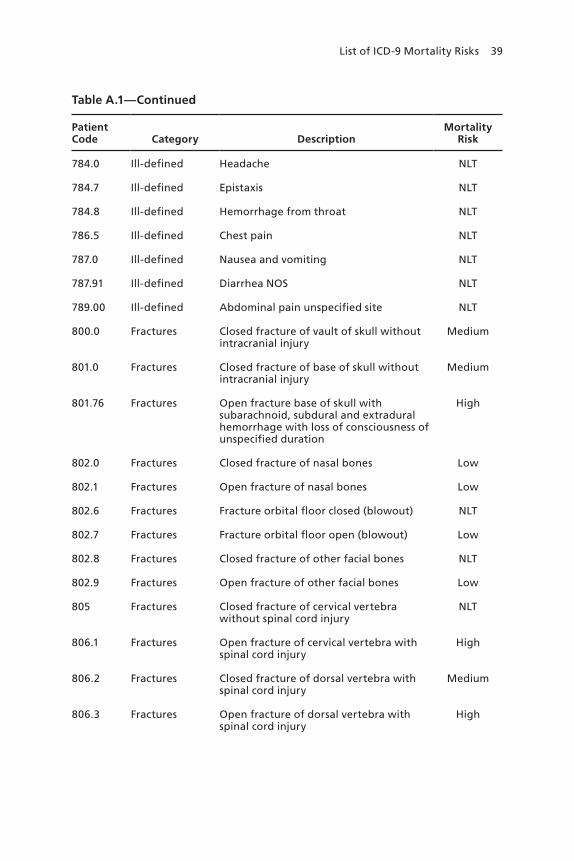
List of ICD-9 Mortality Risks 39
Patient Code Category Description
Mortality Risk
784.0 Ill-defined Headache NLT
784.7 Ill-defined Epistaxis NLT
784.8 Ill-defined Hemorrhage from throat NLT
786.5 Ill-defined Chest pain NLT
787.0 Ill-defined Nausea and vomiting NLT
787.91 Ill-defined Diarrhea NOS NLT
789.00 Ill-defined Abdominal pain unspecified site NLT
800.0 Fractures Closed fracture of vault of skull without intracranial injury
Medium
801.0 Fractures Closed fracture of base of skull without intracranial injury
Medium
801.76 Fractures Open fracture base of skull with subarachnoid, subdural and extradural hemorrhage with loss of consciousness of unspecified duration
High
802.0 Fractures Closed fracture of nasal bones Low
802.1 Fractures Open fracture of nasal bones Low
802.6 Fractures Fracture orbital floor closed (blowout) NLT
802.7 Fractures Fracture orbital floor open (blowout) Low
802.8 Fractures Closed fracture of other facial bones NLT
802.9 Fractures Open fracture of other facial bones Low
805 Fractures Closed fracture of cervical vertebra without spinal cord injury
NLT
806.1 Fractures Open fracture of cervical vertebra with spinal cord injury
High
806.2 Fractures Closed fracture of dorsal vertebra with spinal cord injury
Medium
806.3 Fractures Open fracture of dorsal vertebra with spinal cord injury
High
Table A.1—Continued
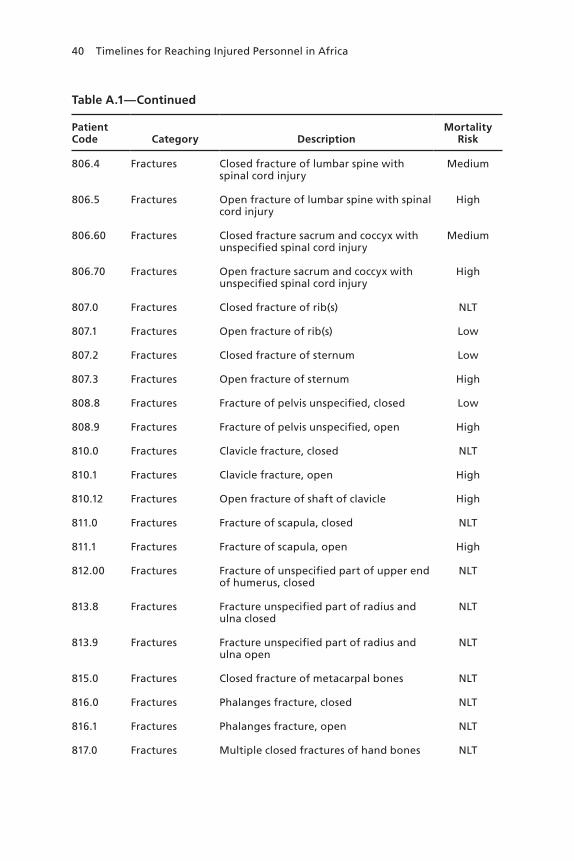
40 Timelines for Reaching Injured Personnel in Africa
Patient Code Category Description
Mortality Risk
806.4 Fractures Closed fracture of lumbar spine with spinal cord injury
Medium
806.5 Fractures Open fracture of lumbar spine with spinal cord injury
High
806.60 Fractures Closed fracture sacrum and coccyx with unspecified spinal cord injury
Medium
806.70 Fractures Open fracture sacrum and coccyx with unspecified spinal cord injury
High
807.0 Fractures Closed fracture of rib(s) NLT
807.1 Fractures Open fracture of rib(s) Low
807.2 Fractures Closed fracture of sternum Low
807.3 Fractures Open fracture of sternum High
808.8 Fractures Fracture of pelvis unspecified, closed Low
808.9 Fractures Fracture of pelvis unspecified, open High
810.0 Fractures Clavicle fracture, closed NLT
810.1 Fractures Clavicle fracture, open High
810.12 Fractures Open fracture of shaft of clavicle High
811.0 Fractures Fracture of scapula, closed NLT
811.1 Fractures Fracture of scapula, open High
812.00 Fractures Fracture of unspecified part of upper end of humerus, closed
NLT
813.8 Fractures Fracture unspecified part of radius and ulna closed
NLT
813.9 Fractures Fracture unspecified part of radius and ulna open
NLT
815.0 Fractures Closed fracture of metacarpal bones NLT
816.0 Fractures Phalanges fracture, closed NLT
816.1 Fractures Phalanges fracture, open NLT
817.0 Fractures Multiple closed fractures of hand bones NLT
Table A.1—Continued

List of ICD-9 Mortality Risks 41
Patient Code Category Description
Mortality Risk
817.1 Fractures Multiple open fracture of hand bones NLT
820.8 Fractures Fracture of femur neck, closed Medium
820.9 Fractures Fracture of femur neck, open High
821.01 Fractures Fracture shaft femur, closed Medium
821.11 Fractures Fracture shaft of femur, open Medium
822.0 Fractures Closed fracture of patella NLT
822.1 Fractures Open fracture of patella NLT
823.82 Fractures Closed fracture of unspecified part of fibula with tibia
NLT
823.9 Fractures Fracture of unspecified part of tibia and fibula open
Low
824.8 Fractures Fracture ankle, NOS, closed NLT
824.9 Fractures Ankle fracture, open Low
825.0 Fractures Fracture to calcaneus, closed Low
826.0 Fractures Closed fracture of one or more phalanges of foot
Low
829.0 Fractures Fracture of unspecified bone, closed Low
830.0 Dislocations Closed dislocation of jaw NLT
830.1 Dislocations Open dislocation of jaw NLT
831 Dislocations Dislocation shoulder NLT
831.04 Dislocations Closed dislocation of acromioclavicular joint
NLT
831.1 Dislocations Dislocation of shoulder, open NLT
832.0 Dislocations Dislocation of elbow, closed NLT
832.1 Dislocations Dislocation of elbow, open NLT
833 Dislocations Dislocation of wrist closed NLT
833.1 Dislocations Dislocation of wrist, open NLT
Table A.1—Continued

42 Timelines for Reaching Injured Personnel in Africa
Patient Code Category Description
Mortality Risk
834.0 Dislocations Dislocation of finger, closed NLT
834.1 Dislocations Dislocation of finger, open NLT
835 Dislocations Closed dislocation of hip NLT
835.1 Dislocations Hip dislocation open NLT
836.0 Dislocations Medial meniscus tear NLT
836.1 Dislocations Lateral meniscus tear NLT
836.2 Dislocations Meniscus tear of knee NLT
836.5 Dislocations Dislocation of knee, closed NLT
836.6 Dislocations Other dislocation of knee, open NLT
839.01 Dislocations Closed dislocation of first cervical vertebra
Medium
840.4 Sprains & Strains Rotator cuff sprain NLT
840.9 Sprains & Strains Sprain, shoulder NLT
843 Sprains & Strains Sprains and strains of hip and thigh NLT
844.9 Sprains & Strains Sprain, knee NLT
845 Sprains & Strains Sprain, ankle NLT
846 Sprains & Strains Sprains and strains of sacroiliac region NLT
846.0 Sprains & Strains Sprain of lumbosacral (joint) (ligament) NLT
847.2 Sprains & Strains Sprain lumbar region NLT
847.3 Sprains & Strains Sprain of sacrum NLT
848.1 Sprains & Strains Jaw sprain NLT
848.3 Sprains & Strains Sprain of ribs NLT
850.9 Intracranial Injuries
Concussion NLT
851.0 Intracranial Injuries
Cortex (Cerebral) contusion without open intracranial wound
High
Table A.1—Continued

List of ICD-9 Mortality Risks 43
Patient Code Category Description
Mortality Risk
851.01 Intracranial Injuries
Cortex (Cerebral) contusion without open wound, no loss of consciousness
High
852 Intracranial Injuries
Subarachnoid subdural extradural hemorrhage injury
Low
853 Intracranial Injuries
Other and unspecified intracranial hemorrhage injury without open wound
High
853.15 Intracranial Injuries
Unspecified intracranial hemorrhage with open intracranial wound
High
860.0 Thorax Abdomen Injuries
Traumatic pneumothorax without open wound into thorax
High
860.1 Thorax Abdomen Injuries
Traumatic pneumothorax with open wound into thorax
High
860.2 Thorax Abdomen Injuries
Traumatic hemothorax without open wound into thorax
High
860.3 Thorax Abdomen Injuries
Traumatic hemothorax with open wound into thorax
High
860.4 Thorax Abdomen Injuries
Traumatic pneumohemothorax without open wound into thorax
High
860.5 Thorax Abdomen Injuries
Traumatic pneumohemothorax with open wound into thorax
High
861.0 Thorax Abdomen Injuries
Injury to heart without open wound into thorax
High
861.1 Thorax Abdomen Injuries
Unspecified injury of heart with open wound into thorax
High
861.2 Thorax Abdomen Injuries
Injury to lung, NOS, closed High
861.3 Thorax Abdomen Injuries
Injury to lung, NOS, open High
863.0 Thorax Abdomen Injuries
Stomach injury, without open wound into cavity
Low
864.10 Thorax Abdomen Injuries
Unspecified injury to liver with open wound into cavity
Medium
865 Thorax Abdomen Injuries
Injury to spleen Medium
Table A.1—Continued

44 Timelines for Reaching Injured Personnel in Africa
Patient Code Category Description
Mortality Risk
866.0 Thorax Abdomen Injuries
Injury to kidney without open wound Low
866.1 Thorax Abdomen Injuries
Injury to kidney with open wound into cavity
Low
867.0 Thorax Abdomen Injuries
Injury to bladder and urethra without open wound into cavity
Low
867.1 Thorax Abdomen Injuries
Injury to bladder and urethra with open wound into cavity
Medium
867.2 Thorax Abdomen Injuries
Injury to ureter without open wound into cavity
Low
867.3 Thorax Abdomen Injuries
Injury to ureter with open wound into cavity
Medium
867.4 Thorax Abdomen Injuries
Injury to uterus without open wound into cavity
Low
867.5 Thorax Abdomen Injuries
Injury to uterus with open wound into cavity
Medium
870 Open Wounds Open wound of ocular adnexa NLT
870.3 Open Wounds Penetrating wound of orbit without foreign body
NLT
870.4 Open Wounds Penetrating wound of orbit with foreign body
NLT
871.5 Open Wounds Penetration of eyeball with magnetic foreign body
NLT
872 Open Wounds Open wound of ear NLT
873.4 Open Wounds Open wound of face, without mention of complication
NLT
873.8 Open Wounds Open head wound, without complication
NLT
873.9 Open Wounds Open head wound, with complications Low
874.8 Open Wounds Open wound of other and unspecified parts of neck, without complications
NLT
875.0 Open Wounds Open wound of chest (wall), without complication
NLT
Table A.1—Continued

List of ICD-9 Mortality Risks 45
Patient Code Category Description
Mortality Risk
876.0 Open Wounds Open wound of back without complication
Low
877.0 Open Wounds Open wound of buttock without complication
NLT
878 Open Wounds Open wound of genital organs (external) including traumatic amputation
Low
879.2 Open Wounds Open wound of abdominal wall anterior without complication
Low
879.6 Open Wounds Open wound of other unspecified parts of trunk, without complication
Low
879.8 Open Wounds Open wound(s) (multiple) of unspecified site(s), without complication
Low
880 Open Wounds Open wound of the shoulder and upper arm
NLT
881 Open Wounds Open wound of elbows, forearm, and wrist
NLT
882 Open Wounds Open wound of hand except fingers alone NLT
883.0 Open Wounds Open wound of fingers, without complication
NLT
884.0 Open Wounds Multiple/unspecified open wound upper limb, without complication
NLT
885 Open Wounds Traumatic amputation of thumb (complete) (partial)
NLT
886 Open Wounds Traumatic amputation of other finger(s) (complete) (partial)
NLT
887 Open Wounds Traumatic amputation of arm and hand (complete) (partial)
Medium
890 Open Wounds Open wound of hip and thigh NLT
891 Open Wounds Open wound of knee, leg (except thigh), and ankle
NLT
892.0 Open Wounds Open wound of foot except toes alone, without complication
NLT
Table A.1—Continued
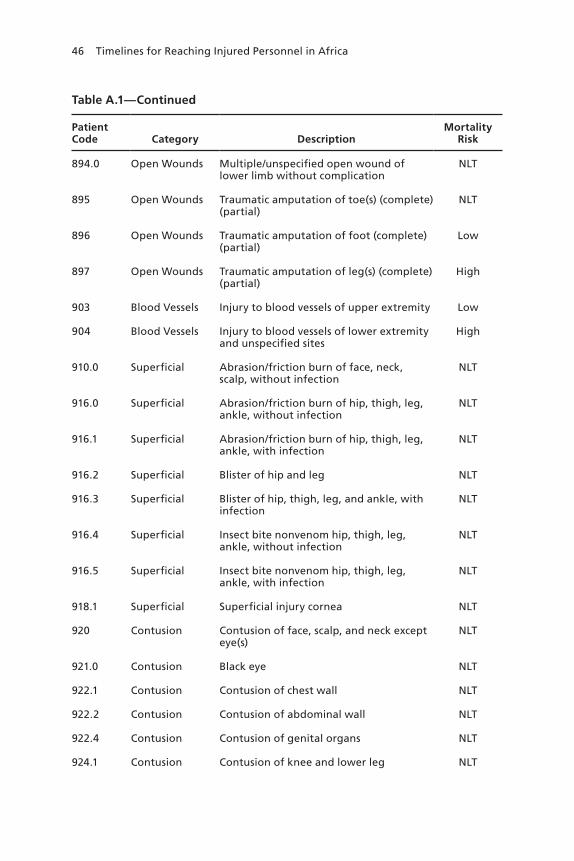
46 Timelines for Reaching Injured Personnel in Africa
Patient Code Category Description
Mortality Risk
894.0 Open Wounds Multiple/unspecified open wound of lower limb without complication
NLT
895 Open Wounds Traumatic amputation of toe(s) (complete) (partial)
NLT
896 Open Wounds Traumatic amputation of foot (complete) (partial)
Low
897 Open Wounds Traumatic amputation of leg(s) (complete) (partial)
High
903 Blood Vessels Injury to blood vessels of upper extremity Low
904 Blood Vessels Injury to blood vessels of lower extremity and unspecified sites
High
910.0 Superficial Abrasion/friction burn of face, neck, scalp, without infection
NLT
916.0 Superficial Abrasion/friction burn of hip, thigh, leg, ankle, without infection
NLT
916.1 Superficial Abrasion/friction burn of hip, thigh, leg, ankle, with infection
NLT
916.2 Superficial Blister of hip and leg NLT
916.3 Superficial Blister of hip, thigh, leg, and ankle, with infection
NLT
916.4 Superficial Insect bite nonvenom hip, thigh, leg, ankle, without infection
NLT
916.5 Superficial Insect bite nonvenom hip, thigh, leg, ankle, with infection
NLT
918.1 Superficial Superficial injury cornea NLT
920 Contusion Contusion of face, scalp, and neck except eye(s)
NLT
921.0 Contusion Black eye NLT
922.1 Contusion Contusion of chest wall NLT
922.2 Contusion Contusion of abdominal wall NLT
922.4 Contusion Contusion of genital organs NLT
924.1 Contusion Contusion of knee and lower leg NLT
Table A.1—Continued

List of ICD-9 Mortality Risks 47
Patient Code Category Description
Mortality Risk
924.2 Contusion Contusion of ankle and foot NLT
924.3 Contusion Contusion of toe NLT
925 Crush Injuries Crushing injury of face, scalp, and neck Medium
926 Crush Injuries Crushing injury of trunk Medium
927 Crush Injuries Crushing injury of upper limb NLT
928 Crush Injuries Crushing injury of lower limb Low
930 Foreign Bodies Foreign body on external eye NLT
935 Foreign Bodies Foreign body in mouth, esophagus, and stomach
NLT
941 Burns Burn of face, head, neck NLT
942.0 Burns Burn of trunk, unspecified degree Low
943.0 Burns Burn of upper limb except wrist and hand, unspecified degree
NLT
944 Burns Burn of wrist and hand NLT
945 Burns Burn of lower limb(s) NLT
950 Nerves Injury to optic nerve and pathways NLT
953.0 Nerves Injury to cervical nerve root Low
953.4 Nerves Injury to brachial plexus NLT
955.0 Nerves Injury to axillary nerve NLT
956.0 Nerves Injury to sciatic nerve NLT
959.01 Complications Other and unspecified injury to head Low
959.09 Complications Other and unspecified injury to face and neck
Low
959.7 Complications Other and unspecified injury to knee, leg, ankle, and foot
Low
989.5 Toxic Non-Medicinal
Toxic effect of venom Low
989.9 Toxic Non-Medicinal
Toxic effect of unspecified substance, chiefly nonmedicinal as to source
Low
Table A.1—Continued
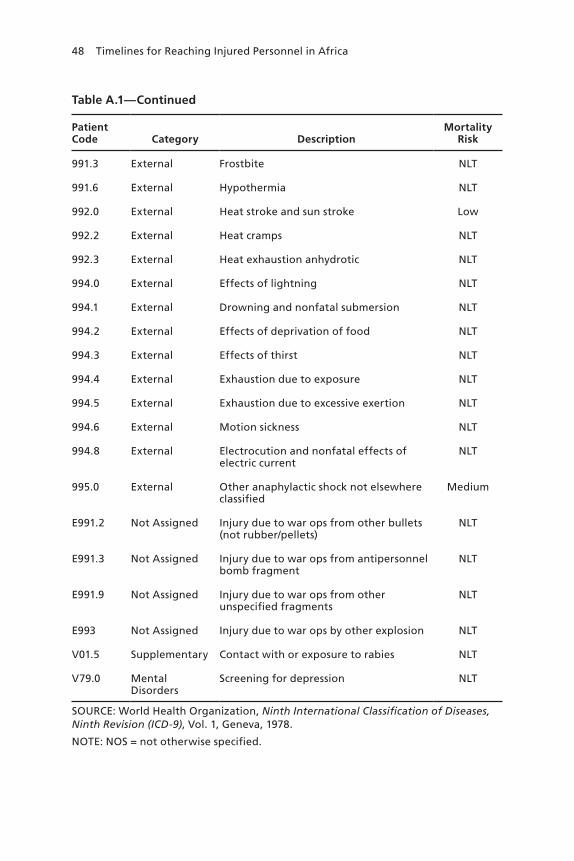
48 Timelines for Reaching Injured Personnel in Africa
Patient Code Category Description
Mortality Risk
991.3 External Frostbite NLT
991.6 External Hypothermia NLT
992.0 External Heat stroke and sun stroke Low
992.2 External Heat cramps NLT
992.3 External Heat exhaustion anhydrotic NLT
994.0 External Effects of lightning NLT
994.1 External Drowning and nonfatal submersion NLT
994.2 External Effects of deprivation of food NLT
994.3 External Effects of thirst NLT
994.4 External Exhaustion due to exposure NLT
994.5 External Exhaustion due to excessive exertion NLT
994.6 External Motion sickness NLT
994.8 External Electrocution and nonfatal effects of electric current
NLT
995.0 External Other anaphylactic shock not elsewhere classified
Medium
E991.2 Not Assigned Injury due to war ops from other bullets (not rubber/pellets)
NLT
E991.3 Not Assigned Injury due to war ops from antipersonnel bomb fragment
NLT
E991.9 Not Assigned Injury due to war ops from other unspecified fragments
NLT
E993 Not Assigned Injury due to war ops by other explosion NLT
V01.5 Supplementary Contact with or exposure to rabies NLT
V79.0 Mental Disorders
Screening for depression NLT
SOURCE: World Health Organization, Ninth International Classification of Diseases, Ninth Revision (ICD-9), Vol. 1, Geneva, 1978.
NOTE: NOS = not otherwise specified.
Table A.1—Continued
49
APPENDIX B
Additional Rescuability Timelines
Beyond the five historical cases considered in the main document, we looked at five additional ones, four of which were drawn from OEF/OIF and one from Vietnam. These are shown in the bottom half of Table B.1 and in Figures B.1 to B.3. This expanded collection of cases represents the entire universe of MPTk data available on the injury distributions from historical conflicts.
The additional OEF/OIF rescuability timelines fall, perhaps as expected, closely alongside those of the other OEF/OIF rescuability timelines. The Vietnam timeline falls almost halfway between the OEF/OIF timelines and the combined Gothic Serpent/Mayaguez timeline. The contiguity of all of these timelines further strengthens the argument that the cases considered in this research and the results presented are robust across conflicts.

50 Timelines for Reaching Injured Personnel in Africa
Table B.1Distribution of Life-Threatening Injuries Across Additional Historical Cases
Event
Breakdown of Life-Threatening Injuries by Mortality Risk (%)
Low Medium High
OEF (Army) 45 16 38
Gothic Serpent/Mayaguez 74 5 22
OEF/OIF (2008–2009) 47 13 40
Second Battle of Fallujah 52 12 36
OIF (Army) 47 14 39
OIF (Marines) 48 16 36
OEF (Marines) 47 13 41
Vietnam (1965–1971) 62 10 28
OEF (2010) 44 12 44
SOURCE: MPTk.
Figure B.1Role 1—Additional Rescuability Timelines with SABC
RAND RR1536-B.1
Res
cuab
le (
%)
Time (hrs)
0 1 24232221201918171615141312111098765432
100
90
80
70
60
50
40
30
20
10
0
OEF/OIF (2008–2009)OEF (Marines)OEF (Army)OEF (2010)
Gothic Serpent/MayaguezVietnam (1965–1971)Second Battle of FallujahOIF (Marines)OIF (Army)

Additional Rescuability Timelines 51
Figure B.2Role 1A—Additional Rescuability Timelines with First-Responder Care
RAND RR1536-B.2
Res
cuab
le (
%)
Time (hrs)
0 1 24232221201918171615141312111098765432
100
90
80
70
60
50
40
30
20
10
0
OEF/OIF (2008–2009)OEF (Marines)OEF (Army)OEF (2010)
Gothic Serpent/MayaguezVietnam (1965–1971)Second Battle of FallujahOIF (Marines)OIF (Army)
Figure B.3Role 1B—Additional Rescuability Timelines with Aid-Station Care
RAND RR1536-B.3
Res
cuab
le (
%)
Time (hrs)
0 1 24232221201918171615141312111098765432
100
90
80
70
60
50
40
30
20
10
0
OEF/OIF (2008–2009)OEF (Marines)OEF (Army)OEF (2010)
Gothic Serpent/MayaguezVietnam (1965–1971)Second Battle of FallujahOIF (Marines)OIF (Army)


53
Abbreviations
AFRICOM U.S. Africa Command
AOR area of responsibility
CASEVAC casualty evacuation
CSAR combat search and rescue
DoD U.S. Department of Defense
ICD International Classification of Diseases
JMPT Joint Medical Planning Tool
MEDEVAC medical evacuation
MPTk Medical Planners’ Toolkit
MTF military treatment facility
NLT non–life-threatening
OEF Operation Enduring Freedom
OIF Operation Iraqi Freedom
PR personnel recovery
SABC self-aid/buddy care
SME subject-matter expert


55
References
Borden Institute and Office of the Surgeon General, Emergency War Surgery, 4th U.S. revision, Fort Sam Houston, Tex.: U.S. Army Medical Department Center and School; Falls Church, Va.: U.S. Army, 2013. As of June 3, 2016: http://www.cs.amedd.army.mil/ Portlet.aspx?ID=cb88853d-5b33-4b3f-968c-2cd95f7b7809
Joint Publication 3-50, Personnel Recovery, Washington, D.C.: Joint Chiefs of Staff, December 20, 2011.
Joint Publication 4-02, Health Service Support, Washington, D.C.: Joint Chiefs of Staff, July 26, 2012.
Mitchell, Ray, Mike Galarneau, Bill Hancock, and Doug Lowe, Modeling Dynamic Casualty Mortality Curves in the Tactical Medical Logistics (TML+) Planning Tool, San Diego, Calif.: Naval Health Research Center, Report No. 04-31, 2004.
Naval Health Research Center, Medical Planners’ Toolkit (MPTk), San Diego, Calif., 2013. As of June 5, 2016: http://www.med.navy.mil/sites/nhrc/Documents/MPTk_2013.pdf
Teledyne Brown Engineering Inc., Joint Medical Planning Tool Methodology Manual, Huntsville, Ala., Version 8.1, 2002–2015.
World Health Organization, Ninth International Classification of Diseases, Ninth Revision (ICD-9), Vol. 1, Geneva, 1978.
gj
$17.50
NATIONAL DEFENSE RESEARCH INSTITUTE
www.rand.org
RR-1536-OSD 9 7 8 0 8 3 3 0 9 6 3 5 7
ISBN-13 978-0-8330-9635-7ISBN-10 0-8330-9635-4
51750
Conducting medical evacuations and other personnel recovery missions in Africa is challenging because of the continent’s vast geographic scope and the small number of U.S. personnel scattered across it. This report studies the military medical literature and recent historical cases to explore the relationships between rescuability and time. Marginal changes in incident response times, given a baseline of 6 or 12 hours, do not correlate with dramatically different rescuability rates in the historical cases. Enhancements of the initial medical care provided can improve rescuability rates; however, providing even modestly improved care in an operational context may prove difficult. Future analyses can use the baseline results outlined here to assess the likely rescuability rates associated with alternative rescue options. The cost and effectiveness of options can then be determined and compared. The policy question revolves around balancing the benefits of speed and improved care with the operational, clinical, and financial costs.