Embed Size (px)
Citation preview

SEISMOLOGY
TIME, SPACE AND SIZE DISTRIBUTION OF EARTHQUAKES FOR FĂGĂRAŞ SEISMOGENIC REGION (ROMANIA)
I.A. MOLDOVAN1, E. POPESCU1, O. BAZACLIU1 , B.D. ENESCU2, M. RADULIAN1 1National Institute for Earth Physics, P.O.Box MG-2, Bucharest-Magurele, RO-769191, Romania,
[email protected] 2Research Center for Earthquake Prediction, Disaster Prevention Research Institute, Kyoto
University, Gokasho, Uji, Kyoto 611-0011, Japan
Received August 24, 2005
The probabilistic seismic hazard assessment (PSHA) in dense-populated geographical regions and subsequently the design of the strategic objectives are primary based on the knowledge of the seismicity parameters of the seismogenic sources which can generate ground motion amplitudes above the minimum level considered risky at the specific site. The PSHA deals with a Poissonian earthquakes distribution in space and time. This assumption implies the necessity of a catalog containing only independent events.
For Romanian territory, besides the major impact of the Vrancea seismic region, characterized by strong intermediate-depth earthquakes, another important seismic source of crustal earthquakes is the Făgăraş region, located in the Southern Carpathians, which should be taken into consideration when assessing the seismic hazard. The seismic regime of the region shows significant clustering effects related to earthquake generation together with quarry blasts generation. In order to study the time, space and size clustering of the seismicity, first we propose a method to discriminate the quarry blasts in the existing catalog. Second, we focused our analysis on the earthquake sequence generated near the Sinaia town in 1993, consisting of foreshock and aftershock sequences associated to a main shock of magnitude MW = 5.1. Fractal properties are investigated in the time, space and size distributions and their correlation. A few noticeable tendencies are outlined and discussed.
Key words: seismicity patterns, earthquake sequence, Făgăraş seismic region, quarry blasts discrimination, fractal dimension.
I. FĂGĂRAŞ REGION SETTING
The Făgăraş seismogenic region is located in the Southern Carpathians, in Romania, approximately between 45.0o and 46.0o North latitude and 24.0o and 25.8o East longitude, adjacently to the West of Vrancea seismic region (Fig. 1) and is a part of the major dome uplift of the Getic Domain basement. It is bordered at its Northern and Southern edges by first order crustal fractures and consists of three seismogenic zones: Făgăraş Mountains, containing Loviştea Depression and North Oltenia, Câmpulung and Sinaia zones. Rom. Journ. Phys., Volume 51, Nos. 3–4, p. 479–494, Bucharest, 2006

I.A. Moldovan et al. 2 480
Fig. 1. Epicentral distribution of earthquakes in Romania; Fagaras region is located approximately
between 45.0o and 46.0o North latitude and 24.0oand 25.8o East longitude. The earthquake activity is related to intracrustal fractures extending from 5 to
30 km depth. The earthquakes in Făgăraş Mountains are generated at South, on deep fractures extending on inherited hercynian lines along NW and NE alpine origin directions and at North, throughout Transylvania, along a stepped fault system separating the Carpathian orogen from its intermountain depression.
Most of the earthquakes are of low energy, but once per century a large destructive event with epicentral intensity larger than VIII is expected in Făgăraş area. The last major shock occurred in January 26, 1916, MW = 6.4, I0 = IX [1] . Făgăraş seismogenic region is the second seismic source in Romania as concerns the largest observed magnitude (Mw = 6.5), after the Vrancea intermediate-depth source (with maximum magnitude Mw ~ 7.7-7.8). Therefore, this is an important earthquake-prone area to be considered in any seismic hazard assessment for Romania.
The zone sited near Câmpulung is the origin of moderate earthquakes with epicentral intensity not larger than V degrees (MSK77) and Mw not exceeding 5.9. The last felt earthquake occurred in 2004 (19 May) with a magnitude of Mw = 3.8 and epicentral intensity I0 = IV ½. Sinaia seismic zone is situated in the Eastern part of the Câmpulung zone and is characterized by earthquakes with magnitudes (MW) smaller than 5.1 (the sequence of 1993).
The fault plane solutions of the main shocks of the earthquakes generated in the Făgăraş region are mainly of strike-slip type with slip motion on the NW-SE oriented nodal planes [2] and normal type, indicating an extensional stress pattern.

3 Time, space and size distribution of earthquakes for Făgăraş region 481
One could speculate that the earthquakes are generated on an extension of the Intramoesian fault, oriented NW-SE, as well, going from Black Sea, South Dobrogea, and possibly reaching the Southern Carpathians area. However, the azimuths of the principal axes are almost randomly distributed and it is impossible to constrain a predominant direction of the deformation field.
II. SEISMICITY AND MACROSEISMIC FEATURES
The Făgăraş seismogenic region is characterized by a moderate seismicity rate. However, the return period estimated for the largest earthquakes is sufficiently high to represent a potential risk in the region. Nine major shocks (Mw ~ 6.5) were reported during the last 600 years. Except one event occurred in the XX- th century, on January 26, 1916 (Mw = 6.4, Io = IX), for which we have instrumental information, for all the others only macroseismic information is available.
One of the main problems in seismicity studies and hazard assessment in regions like Făgăraş, with few and rare major earthquakes, most of them occurred before the instrumental period, or when the density and quality of the seismic instruments are poor, is the scarcity of available data sets. The instrumental part of the catalog of the Romanian earthquakes [4] covers almost 90 years, with acceptable density of measurement sites only for the last 25 years. Therefore, the incorporation of macroseismic observation becomes important for improving the completeness of the catalogue before 1900, and thus the reliability of the analysis.
The earthquakes belonging to the Făgăraş region are both of local and regional importance, since relatively high values of macroseismic intensity are observed in areas far from the epicenter implying low attenuation with distance. Thus, the felt area (I > 2) is greater than 200.000 km2 for the large earthquakes, 27.000 km2 for moderate earthquakes and of 7.000 km2 for earthquakes with magnitudes around 4.5 [1].
To determine the characteristics of the seismicity for the Făgăraş seismogenic region, a revised and updated earthquake catalogue (compiled by [4] and updated by the authors) is used. The catalogue contains 551 main shocks and more than 800 events in sequences for a 600-year time interval and is homogenous starting with 1471 for I > VIII and starting with 1801 for I > VII. As concerns the instrumental catalogue, the analysis of the variation of the magnitude of completeness (Mc) was performed for two different situations and will be discussed later.
The spatial distribution of the earthquakes in the study area is neither uniform, nor random. Also the time occurrence is characterized by non-random sequences of events, like swarms, induced earthquakes or explosions, significant clusters being identified in all three zones.
In the western part (Făgăraş Mountains) the earthquakes have a typical polikinetic character, with many delayed aftershocks, especially for large events,

I.A. Moldovan et al. 4 482
like the one produced in 1916. Preferential centers and lines of seismicity were identified after the occurrence of the large earthquakes and the subsequent aftershock activity.
From the central part of the region to the East, in Câmpulung and Sinaia areas bursts of seismic activity with foreshock and aftershock sequences associated to a main shock were identified. During the last 40 years several main shocks with magnitude smaller than 6.0 have been reported in these two areas, followed by aftershocks, as mentioned below:
– Câmpulung, 12 April 1969: a main shock of Mw = 5.2, followed by a strong aftershock activity (approximately 488 aftershocks);
– Câmpulung, 24 May 1975: a main shock of Mw = 3.6 and 18 aftershocks; – Câmpulung, 6 May 1976: a main shock of Mw = 3.3 followed by 11
aftershocks; – Sinaia, 23 May 1993: a main shock of Mw = 5.1 accompanied by 318
foreshocks and aftershocks [5]; The last sequence was the most prominent earthquake sequence generated in
the area since monitoring commenced in 1980 by the Romanian telemeterd network. The present study will be focused on seismicity analysis related to this particular and complex sequence.
Because of the presence of quarry explosions among the earthquakes recorded by the Romanian network, the decontamination of the catalog is essential in this approach for a reliable seismicity analysis.
III. DECONTAMINATION OF THE CATALOGUE
Due to the improvement of the location capability of the Romanian Seismic Network, an increasing number of smaller events is currently listed in the seismic catalogues. Many of these smaller shocks are however explosions, not earthquakes, and must be excluded from the catalogue. Otherwise, they contaminate the catalogue and introduce biases, like the non-randomness in the probability distribution function of earthquakes, or spatial clustering that may wrongly suggest possible fault lines. For example, the distribution of quarry blasts around Câmpulung city (Fig. 1) might incorrectly suggest that faults oriented along N-S direction are potentially seismic active.
Evidence of the presence of nonrandom events in the catalogue is shown by the hypocentral distribution of the earthquakes in the region, which outlines significant clustering at the Earth’s surface (h around 0km) (Fig. 2).
The histogram of the number of events as a function of their occurrence hour (Fig. 3) shows a strong clustering at the “working” hours of the quarries. One can notice the significant difference between the number of earthquakes occurred in daytime and at night.

5 Time, space and size distribution of earthquakes for Făgăraş region 483
Fig. 2. Hypocentral distribution of the seismic events in the studied zone.
Fig.3. Number of the recorded events versus their hour of occurrence in Fagaras zone.
Unfortunately there is no precise information concerning the geographical
position and time of the quarry blasts, and therefore a special analysis for each event recorded between 7 AM and 6 PM, with magnitude and depth ranges
I.A. Moldovan et al. 6 484
potentially associated with quarry blasts, is required to allow the discrimination of explosions from earthquakes. We analyze the waveforms, recorded at several seismic stations, in both time and spectral domains.
The criteria used to discriminate explosions from earthquakes are: 1. the time of occurrence and the relocated epicentral coordinates; 2. the shape of the digital recordings and 3. the sign of the first arrival (the occurrence mechanism) and the shape of
the body wave spectra - the comparison in the frequency domain shows higher dominant contribution at high frequencies for earthquakes than for explosions when the size and location are similar (due to different attenuation effect).
The analysis of the quarry blasts discrimination is performed for the catalogue starting with 1974. According to the first criterion, we find a number of 83 events in the catalogue, from which we excluded a number of 35 explosions, using the criterion of the first arrival sign. The total number of the recorded events between 1974 and 2004 is 471, so that the number of explosions from the total recorded events represents 7.43%.
Finally, the catalog is cleaned up of explosions, operation which is compulsory for any seismicity study and probabilistic seismic hazard assessment.
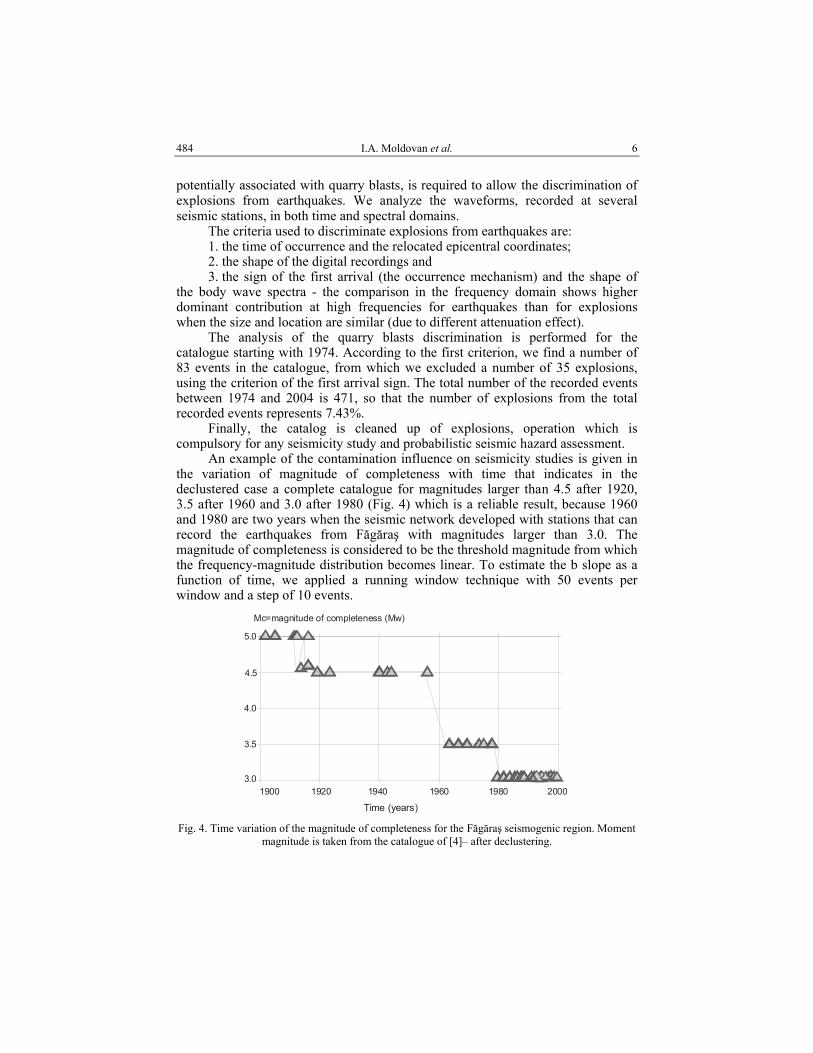
An example of the contamination influence on seismicity studies is given in the variation of magnitude of completeness with time that indicates in the declustered case a complete catalogue for magnitudes larger than 4.5 after 1920, 3.5 after 1960 and 3.0 after 1980 (Fig. 4) which is a reliable result, because 1960 and 1980 are two years when the seismic network developed with stations that can record the earthquakes from Făgăraş with magnitudes larger than 3.0. The magnitude of completeness is considered to be the threshold magnitude from which the frequency-magnitude distribution becomes linear. To estimate the b slope as a function of time, we applied a running window technique with 50 events per window and a step of 10 events.
Mc=magnitude of completeness (Mw)
Time (years)
1900 1920 1940 1960 1980 2000
5.0
4.5
4.0
3.5
3.0
Fig. 4. Time variation of the magnitude of completeness for the Făgăraş seismogenic region. Moment
magnitude is taken from the catalogue of [4]– after declustering.

7 Time, space and size distribution of earthquakes for Făgăraş region 485
If we take the catalogue before declustering, represent the variation Mc in time after 1974 (Fig. 5) and compare with the results from Fig. 4 we note remarkable differences. The magnitude of completeness seems to have smaller values, between 2.5 and 2.8.
.
1975 1980 1985 1990 1995 2000
2.8
2.5
2.6
2.7
Mc=magnitude of completeness (Mw)
Time (years) Fig. 5. Time variation of the magnitude of completeness for the Făgăraş seismogenic region. Moment
magnitude is taken from the catalog of [4]– before declustering.
IV. TIME, SPACE AND SIZE DISTRIBUTIONS
The sequence occurred in Sinaia zone in 1993 is the most prominent sequence that occurred after the installation in 1980 of the Romanian telemetered seismic network. A burst of seismic activity occurred in May - June 1993 with foreshock and aftershock sequences associated to a main shock of magnitude ML = 5.1 [5]. We identified 318 earthquakes in the magnitude domain 1.3 ≤ ML ≤ 5.1 on the analogical and digital recordings of the Romanian seismic network. The epicentral distribution of the 93 localized earthquakes can be approximated by an ellipse with a surface of around 225 km2, elongated on a NW-SE direction and is presented, together with a simplified seismotectonic map of the study region in Fig. 6. The hypocentral location, source parameters and their scaling laws for the Sinaia seismic sequence were previously analyzed by [2], [3].
Due to the complexity of the physical phenomenon related to this sequence and the great number of the seismic events, our goal was to carry out a detailed analysis of the time, space and size distributions in order to outline possible fractal

I.A. Moldovan et al. 8 486
characteristics of the earthquake generation process. For the time being, Sinaia sequence is the only sequence in the Făgăraş region digitally recorded.
Fig. 6. Epicentral distribution of localized events of the Sinaia sequence of May-June 1993 (after, [2])
IV.1. TIME DISTRIBUTION OF THE EARTHQUAKE SEQUENCE
The aftershock rate n(t) is well modeled by Omori’s modified formula [6]:
n(t)=Kt-p (1)
where K and p are constants estimated from observational data set. The constant K depends on the threshold magnitude, while p may dependent or not on the threshold magnitude.
To analyze the time behavior of the Sinaia earthquake sequence we first establish the completitude magnitude of the data set: Mc=2.0 from the frequency-magnitude distribution (Fig. 7). We estimate then the constants p and K for different combinations of parameters (Mc, ∆t, total time interval). The results are given in Table 1.
Simplified seismotectonic map of Sinaia region and their neighborhoods; – full triangles – seismic stations; – star – epicenter of main shock; – empty circles – high level localized epicenters; – empty diamonds – low level localized epicenters.

9 Time, space and size distribution of earthquakes for Făgăraş region 487
Table 1
Constants p and K estimated for different threshold magnitudes (Mc), total intervals (T) and unit time intervals (∆t)
Mc T (days)
∆t (days)
P K
2.0 13 1 1.50 69.45 2.0 20 2 1.52 214.70 2.2 9 1 1.39 47.27 2.2 20 2 1.40 135.77 2.5 6 1 1.49 26.88 2.5 18 2 1.07 44.94
0 1 2 3 4 5 6M
05
10152025303540
Ncum
0 1 2 3 4 5 6 7M
0
1
2
3
Ncum
(b)(a)
Fig. 7. Frequency-magnitude distribution of the Sinaia earthquakes for the time interval May 4-June 30, 1993: a) noncumulative distribution; b) cumulative distribution.
The case corresponding to the threshold magnitude 2.2 is represented in Fig. 8.
1 2 3 4 5 6 7 8 9t(days)
0
10
20
30
40
50
60
70
n(t)
2 4 6 8 10 12 14 16 18 20t (days)
0
10
20
30
40
50
60
70
n(t)
(a) (b)
Fig. 8. Omori’s power law for threshold magnitude Mc = 2.2 and: a) ∆t=1 day; b) ∆t=2 days.
I.A. Moldovan et al. 10 488
Our analysis shows that: a) for all the threshold magnitudes (Mc = 2.0, 2.2, 2.5) and unit time intervals
(∆t = 1 day and ∆t = 2 days) with one single exception (Mc = 2.5 and ∆t = 2 days) p slope deviates significantly from 1; this behavior is typical for aftershock sequences with one single large earthquake (Lu et al., 1994) with a relative large stress drop for the main shock (∆σ = 54 bar, as determined by [3];
b) the value of the decrease rate (p) of the aftershocks depends neither of the threshold magnitude or of the time unit interval;
c) the constant K depends on both time unit interval and threshold magnitude.
IV.2. FRACTAL ANALYSIS OF THE TIME DISTRIBUTION OF THE SEQUENCE
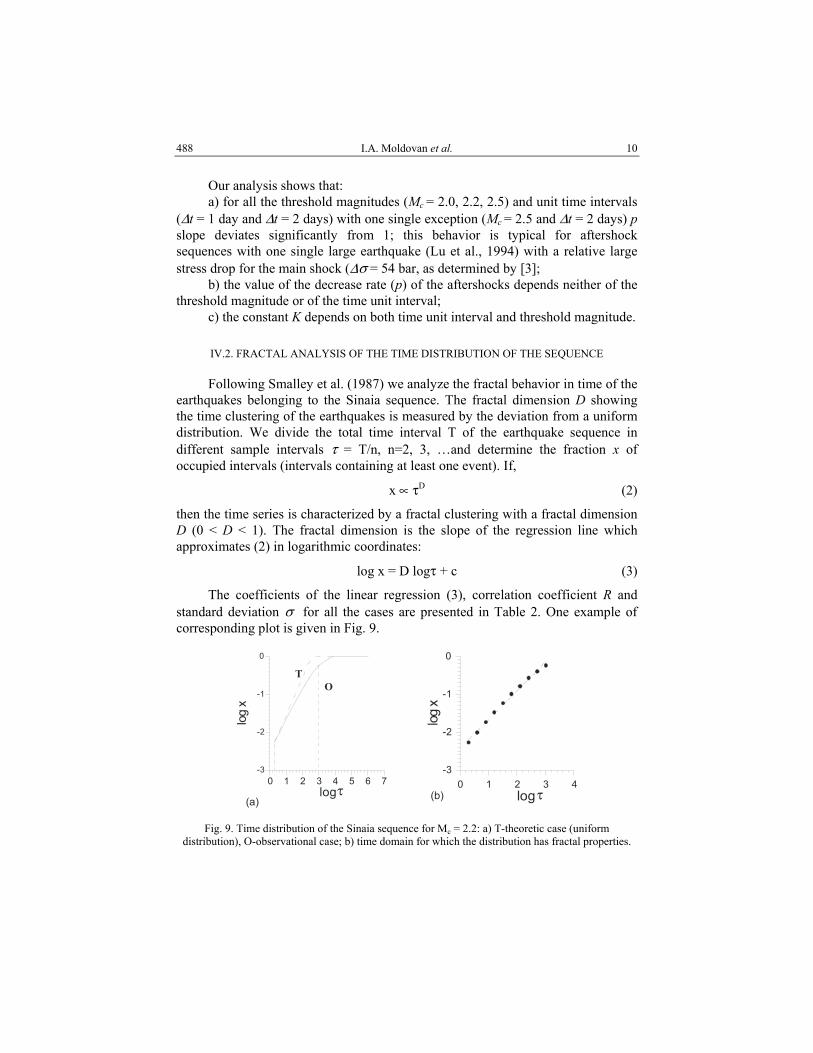
Following Smalley et al. (1987) we analyze the fractal behavior in time of the earthquakes belonging to the Sinaia sequence. The fractal dimension D showing the time clustering of the earthquakes is measured by the deviation from a uniform distribution. We divide the total time interval T of the earthquake sequence in different sample intervals τ = T/n, n=2, 3, …and determine the fraction x of occupied intervals (intervals containing at least one event). If,
x ∝ τD (2)
then the time series is characterized by a fractal clustering with a fractal dimension D (0 < D < 1). The fractal dimension is the slope of the regression line which approximates (2) in logarithmic coordinates:
log x = D logτ + c (3)
The coefficients of the linear regression (3), correlation coefficient R and standard deviation σ for all the cases are presented in Table 2. One example of corresponding plot is given in Fig. 9.
0 1 2 3 4 5 6 7log
-3
-2
-1
0
log
x
O T
0 1 2 3 4log
-3
-2
-1
0
log
x
(a) (b)τ τ
Fig. 9. Time distribution of the Sinaia sequence for Mc = 2.2: a) T-theoretic case (uniform
distribution), O-observational case; b) time domain for which the distribution has fractal properties.

11 Time, space and size distribution of earthquakes for Făgăraş region 489
The conclusions resulted from Table 2 are: a) fractal dimension of the time distribution of the Sinaia earthquake sequence is D ∈ [0.760, 0.840] for τ in the range x ∈ [2, 210 minutes]. The deviation from 1 (uniform distribution) is relatively small, indicating only a slight tendency of clustering in time; b) the bending of the observed curve in Fig. 10 indicates that the fractal behavior (selfsimilarity) combines with a random behavior; this result is compatible with that obtained for the Banat sequences in the western part of Romania during July 12 - December 1991 [5]; c) the fractal dimension is smaller when the threshold magnitude is smaller suggesting more clustering for the smallest earthquakes.
Table 2
Coefficients of the regression line (3)
Number of events
Mc D C R σ time interval of linearity (min)
207 2.0 0.76±0.02 -2.32±0.02 0.998 0.04 2-210 151 2.2 0.76±0.02 -2.43±0.04 0.997 0.06 2-210 83 2.5 0.84±0.02 -2.73±0.03 0.999 0.04 2-29
IV.3. FRACTAL DIMENSION OF THE SPACE DISTRIBUTION
The data set used for estimation of the fractal dimension of epicenter distribution consists of 93 events localized using the HYPO program and JHD (Joint Hypocenter Determination) method. The seismic activity is characteristic for a sequence of the type “foreshocks-main shock-aftershocks” (Fig. 10).
The data set is represented by the time series {Xi, Mi }i N, where Xi is the
epicenter of event “i” with the epicentral coordinates (ϕi, λi ), Mi is the magnitude of earthquake generated at the moment ti. We use a running moving window technique to study the time variation of the fractal dimension of the epicentral distribution. The number of earthquakes in a subset is either of 40 events or 50 events. The windows are shifted by a step of 10 events.
The correlation integral for the space distribution of the earthquake epicenters for a subset {Xi }i =1
K is defined as:
( ) ( ) ( )p2C r = N R < r
K K – 1 (4)
where Np (R<r) is the number of earthquake pairs with the relative distance less than r [7]. If the epicenter distribution has fractal properties then:
C(r) ∝ rD2 (5)

I.A. Moldovan et al. 12 490
where D2 is the correlation dimension. In logarithmic coordinates equation (5) becomes:
log C(r) = D2 log r + f (6)
Fig. 10. Seismic activity of the Sinaia sequence during May 1 - June 30, 1993 (after Enescu et al., 1996).
Our tests show that the relation between C and r is linear for r in the interval
r ∈ [2, 10 km]. Examples of regression lines are plotted in Fig. 11, while the corresponding coefficients are given in Table 3.
0.0 0.2 0.4 0.6 0.8 1.0log r
-1.5
-1.0
-0.5
0.0
logC
(r)
(a)0.0 0.2 0.4 0.6 0.8 1.0
log r
-1.5
-1.0
-0.5
0.0
logC
(r)
(b)
Fig. 11. Representative curves for space distributions of the earthquake epicenters: a) subsets of 40 events, b) subsets of 50 events; the domain on which the epicentral distribution of earthquakes is
fractal is shown: log r ∈[0.3, 0.9 km].
13 Time, space and size distribution of earthquakes for Făgăraş region 491
Table 3
Coefficients of the regression line (6) estimated for different subsets
Number of events for a subset (K)
Current number of subset D2 f
50 1 1.16 -1.43 “ 2 1.10 -1.39 “ 3 0.94 -1.19 “ 4 0.88 -1.04 “ 5 0.74 -0.86
40 1 1.15 -1.41 “ 2 1.18 -1.48 “ 3 0.97 -1.23 “ 4 0.92 -1.10 “ 5 0.79 -0.92 “ 6 0.74 -0.79
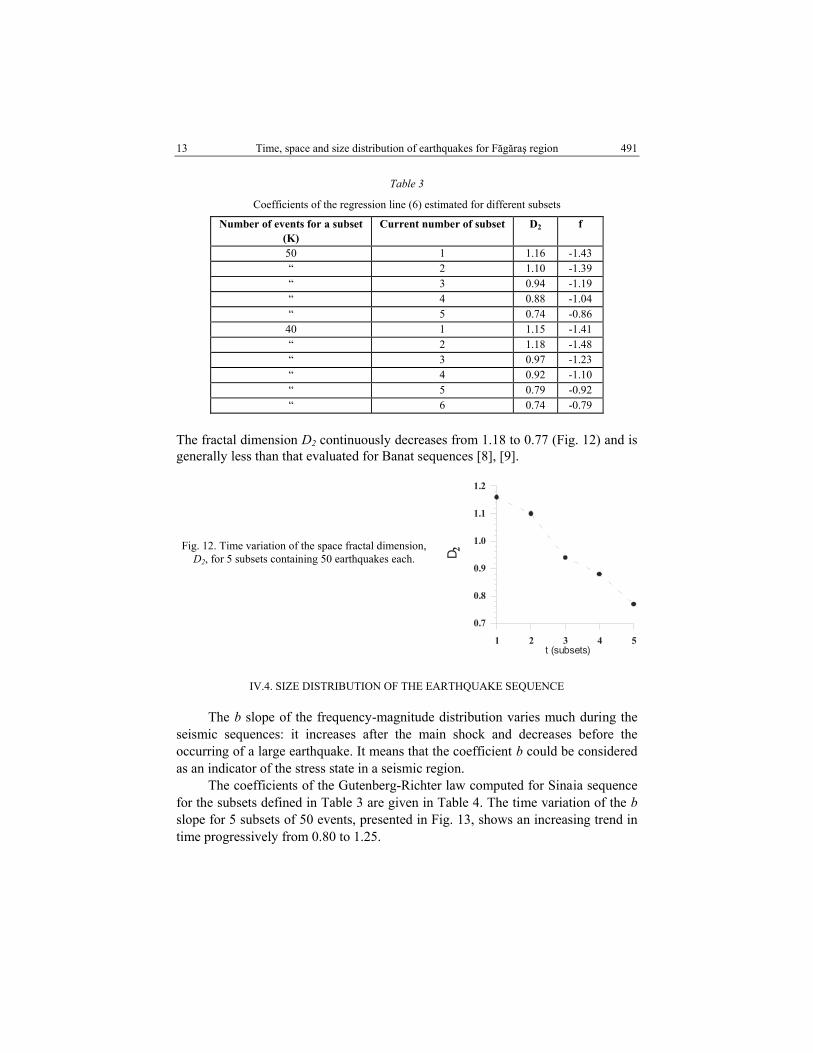
The fractal dimension D2 continuously decreases from 1.18 to 0.77 (Fig. 12) and is generally less than that evaluated for Banat sequences [8], [9].
1 2 3 4 5t (subsets)
0.7
0.8
0.9
1.0
1.1
1.2
D 2
IV.4. SIZE DISTRIBUTION OF THE EARTHQUAKE SEQUENCE
The b slope of the frequency-magnitude distribution varies much during the seismic sequences: it increases after the main shock and decreases before the occurring of a large earthquake. It means that the coefficient b could be considered as an indicator of the stress state in a seismic region.
The coefficients of the Gutenberg-Richter law computed for Sinaia sequence for the subsets defined in Table 3 are given in Table 4. The time variation of the b slope for 5 subsets of 50 events, presented in Fig. 13, shows an increasing trend in time progressively from 0.80 to 1.25.
Fig. 12. Time variation of the space fractal dimension, D2, for 5 subsets containing 50 earthquakes each.

I.A. Moldovan et al. 14 492
1 2 3 4 5t (subsets)
0.6
0.7
0.8
0.9
1.0
1.1
1.2b
Table 4
Coefficients of the Gutenberg-Richter relation for the subsets defined in Table 3
Current number of subset B A R σ
1 0.81 ± 0.03 3.73 ± 0.07 0.993 0.05
2 1.02 ± 0.04 4.26 ± 0.10 0.991 0.07
3 1.07 ± 0.03 4.28 ± 0.08 0.996 0.04
4 1.21 ± 0.05 4.54 ± 0.12 0.993 0.06
5 1.18 ± 0.08 4.53 ± 0.22 0.970 0.11
1 0.80 ± 0.02 3.68 ± 0.07 0.994 0.04
2 0.95 ± 0.03 4.01 ± 0.10 0.991 0.06
3 1.11 ± 0.05 4.30 ± 0.13 0.991 0.06
4 1.17 ± 0.03 4.37 ± 0.12 0.994 0.05
5 1.25 ± 0.09 4.46 ± 0.24 0.981 0.08
6 1.12 ± 0.03 4.38 ± 0.28 0.967 0.10
Consequently, there is a negative correlation between the fractal dimension of
the space distribution of the Sinaia sequence D2 and the coefficient b of the frequency-magnitude distribution:
D2 = (1.91 ± 0.29) - (0.90 ±0.28)b (7)
with correlation coefficient R = 0.88 and standard deviation σ = 0.09 (Fig. 14). A similar correlation was found by [10] for earthquakes generated in Tohoku (Japan) region and [8] for Banat crustal sequences occurred during July - December, 1991.
Fig. 13. Time variation of the slope b for 5 subsets containing 50 earthquakes each.

15 Time, space and size distribution of earthquakes for Făgăraş region 493
0.7 0.8 0.9 1.0 1.1 1.2 1.3b
0.7
0.8
0.9
1.0
1.1
1.2
D 2
V. CONCLUSIONS
Using different criterions we have excluded a number of 35 explosions, the equivalent of 7.43% from the total recorded events. The final purpose of the exclusion was reached by obtaining a decontaminated earthquake catalogue that can be used for obtaining reliable seismicity parameters, the ideal input for assessing the seismic hazard due to Fagaras earthquakes. The systematic investigation of the seismicity regime in space and time, and the waveform examination showed that the exclusion of explosions from catalogues became compulsory for PSHA, either by statistic or deterministic methods.
At the same time, we analyzed the fractal properties of the space, time and size distributions of the Sinaia earthquake sequence occurred during May, 4-June, 30, 1993, sequence that was also decontaminated from explosions.
The decay in time of the aftershock activity is well approximated by the modified Omori’s power law (1).
1) The power coefficient p deviates significantly from 1 (p≅1.4) independently of the threshold magnitude and unit time interval; this is typical for aftershock sequences with one single large earthquake and with a relative large stress drop for the main shock;
2) the value of the decrease rate (p) of the aftershocks depends neither of the threshold magnitude nor of the time unit interval;
3) the constant K depends on time unit interval and also on threshold magnitude.
The values of the time fractal dimension, D, show a relative small deviation from 1 (uniform distribution), indicating a slight tendency of clustering in time.
The fractal dimension D2 of the space distribution of the earthquake epicenters continuously decreases from 1.18 to 0.77 (Fig. 7) and is, generally, less than that evaluated for Banat sequences [8], [9];
The b value of the frequency-magnitude distribution increases progressively in time in the interval b ∈ [0.80,1.25].
Fig. 14. The correlation between D2 and slope b for 5 subsets containing 50 earthquakes.

I.A. Moldovan et al. 16 494
We conclude that there is a negative correlation between the fractal dimension of the space distribution of the Sinaia sequence D2 and the coefficient b of the frequency-magnitude distribution.
REFERENCES
1. I. Atanasiu, Romanian earthquakes, Bucharest Academic publishing house, 1961, 194 pp. (in Romanian). 2. D. Enescu, E. Popescu, M. Radulian, Source characteristics of Sinaia (Romania) sequence of May-
June 1993, Tectonophysics, 261, 39–49, 1996. 3. D. Enescu, E. Popescu, M. Radulian, Some parameters and scaling relations for Sinaia (Romania),
Rom. Journ. Phys. vol. 41, 3-4, 321–330, 1996. 4. M.C. Oncescu, V. Mârza, M. Rizescu, M. Popa, The Romanian Earthquake catalogue between 984-
1997, In Vrancea Earthquakes: Tectonics, Hazard and Risk Mitigation (eds. Wenzel, F., Lungu, D., and Novak, O.) (Kluwer Academic Publishers, 1999), pp. 43-49, 1999.
5. E. Popescu, Complex study of the seismic sequences on the Romanian territory, PhD thesis, 281 p., Institute of Atomic Physics, Bucharest, September 5, 2000.
6. T. Utsu, A statistical study on the occurrence of aftershocks. Geoph. Mag., 30, 523–605. 7. P. Grassberger, , I. Procaccia (1983). Measuring the strangeness of strange attractors. Physica D 9,
189–208, 1961. 8. E. Popescu, A. Utale, M. Radulian, Fractal analysis of the time, space and size distributions of the
earthquake sequences generated in Banat seismic zone during July, 12 1991 and June 20, 1992, Report INCDFP/MCT no. 98/1998, 1998.
9. E. Popescu, A. Utale, M. Radulian, Fractal distribution of earthquake sequences in Banat and Câmpulung-Făgăraş seismic regions (Romania), Abstract of IUGG Gen. Ass., 19–24 July, 1999, Birmingham, pp. A145, 1999.
10. T. Hirata, A correlation between b value and fractal dimension of earthquakes, J. Geophys. Res. 94, 7507–7514, 1989.


