Embed Size (px)
Citation preview

Time Series Analytics with Simple Relational Database ParadigmsBen Leighton, Julia Anticev, Alex Khassapov
LAND AND WATER & CSIRO IMT SCIENTIFIC COMPUTING

2 |
Energy Use Data Model (EUDM) endeavours to
deliver a wide range of energy datasets to a
broad set of stakeholders especially the
research community
As part of this provision transformations and
views on data provide value by reducing
complexity, building fit for purpose structures,
and aligning observations to reduce the gap
between data and insight
As EUDM developers: Is there a, performant,
rapidly deployable, conceptual simple
approach, that leverages existing technology
and is industry proven for providing an analytics
platform?
Context

3 |
Many data providers, for example energy utility
companies
Not Surprisingly: They all structure data
differently. However some of this data is similar,
for example many utilities meter readings from
substations
For researchers it is useful to harmonize the
format across such similar datasets. EUDM do
this for substation data to provide a single
format for further analysis
Building a FoundationEUDM Data Harmonisation
Meter DataMeter
DataMeter Data
Electricity Industry Data In Varying Formats
Python Pandas
Translations
Harmonised Data

4 |
45gb of csv data but a fair
bit of intentional
redundancy in columns like
units
Characteristics of Harmonised EUDM Data
Fairly Static (we don’t get
new data that often yet)
218 million substation
sensor records
Varying timesteps
Usually observations
every 30 minutes
Up to 3
measurements per
record
Active Power
Reactive Power
Apparent Power
Harmonized to consistent
column schema
100s of substations
Varying Power Units
Data for > 10 years

5 |
Views and Analytics in EUDM
Column Based CSV
- Conciseness
Consistent Timesteps
- Interoperability
Aggregated Observations
- Summaries, Statistics, Tractability
Unit Harmony / Conversions
- Interoperability
(Future) Real time Analytics
Platforms
Dynamic Views
Generation
Interactive
Near Real time

6 |
Options for Time Series Analysis
2014 - InfluxDB -
https://www.influxdata.com/
Land and Water Weather Station Data
Hybrid SOS system
No schema, Kind of free
but you pay for clustering
Online skepticism about
performance
Pandas working well for
us but not when we run
out of memory. Clunky
querying.
Learning Curve, Do I
need a cluster? But this
might be a better / good
choice
Already started by the
time it was suggested
down the track but might
be a good option
Very interesting as built
on top of postgresql and
at least I know that is high
quality

7 |
TimeScale DB for Quality AssuranceTo debug the data harmonization process
we needed a way of spotting systemic
errors quickly
TimeScale provided a way to quickly
aggregate data to yearly average
maximum and minimum (thanks pre built
Docker Image and Python + Jupyter)
Physically unrealistic averages and outlier
maximums and minimums could indicate
potential process errors but also might
reflect errors in original data
Giant denormalized data table
Harmonized
Data
pgsql \COPY
TimeScale Enhanced
Denormalized Table
Compact Yearly Statistics Output
SELECT … time_bucket('365 days', ‘StartDeliveryTime’)
… MIN .. MAX …
2 hours about 500 million rows

8 |
TimeScale is not well
documented and doesn’t
seem capable of much more
than Aggregation
What about native
PostgreSQL then?
Postgres for Time Series Analysis
21 years of development
SQLQuery Planner
Open Source
Extensive Community
Native Time Support
Row BasedBuilt High Transactional Workflows
Very fast to prototype with Docker or AWS
RDS
Looks as if others use it as a Time Series
DB
Scalable

9 |
A PostgreSQL Solution AWS, Features Used, A Simple Schema

10 |
Easy and Powerful - AWS RDS
Out of the box scalable DB instances including
Postgresql
PostgreSQL 10 supported at up to 64cpus 256GB
RAM
Performance Visualisation For Optimisation
Relatively Cheap
Not AWS specific maintaining portability avoiding
vendor lock in

11 |
Modern PostgreSQL Features Used
Partitioned Tables Matching
Likely Query Domain
A fair bit of inspiration from https://dba.stackexchange.com/a/39599 Erwin Brandstetter
GiST Indexes
Many date range operators
including overlaps
Parallel Queries
10:21
10:32
10:10
10:25

data
12 |
A Simple Schema for Time Series Analysis
Queries and Insert Operations
data_[Utility Name]
data_[Utility Name]_[Year]
indexes
indexes
Programmatically Generated With Python
and SQL
Queries and Data Insert Sorted By Partition
Parameters
Execution Planner Targets Small Subset of
Tables Transparently When Queries Within
Utility And Year
Denormalized Simpler and Faster(?)
Inefficient Storage

13 |
Ephemeral Reproducible Database
Database creation and data upload via
Jupyter for rapid development
DDL/SQL via Templates with Python
Programmatic Index Creation Mitigating
Duplication (required until Postgresql11)
Needs refactoring into robust libraries
Python Workflow Engines?

14 |
Time Series QueriesPostgreSQL SQL is
succinct and simple for
Time Series AnalyticsSELECT min("StartDeliveryTime"),max("EndDeliveryTime),
avg("ActivePower"),"UtilityName","SupplyRegionName"
FROM DATA WHERE
"UtilityName" = 'WesternPower'
GROUP BY "UtilityName", "SupplyRegionName",
floor(EXTRACT(epoch FROM "StartDeliveryTime") / 60 / 30)
ORDER BY "UtilityName", "SupplyRegionName", min("StartDeliveryTime")
convert date to seconds since 1/1/1970
get the fractional number of half hourly increments
since 1/1/1970
floor to specify which half hour this time belongs to
group all times in the same half hour together and
apply functions to aggregate values to a new half
hourly record
SELECT ... [LOTS OF COLUMNS] ...
JOIN zone_weather ON zone_weather."StationId" = weather."stationNumber"
JOIN data ON
data."SupplyRegionID" = zone_weather."ZoneId"
AND
(data."TimeRange" && weather."TimeRange")
WHERE data."UtilityName" = 'WesternPower' AND ...
[LIMIT THIS TO A HAPPEN WITHIN A YEAR... ] ... AND
zone_weather."Supplier" = 'WesternPower' ORDER BY ... [TIME] ...
Find any overlapping weather observations and substation sensor measurement
s even if they are at different timesteps with unaliigned start and end dates
Aggregate time series to half hourly
date range overlaps operator
15 |
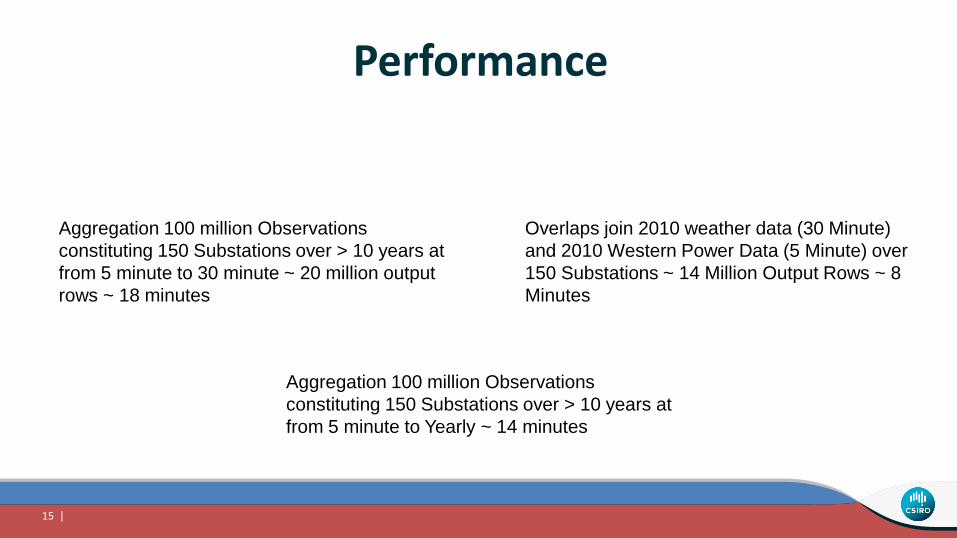
Aggregation 100 million Observations
constituting 150 Substations over > 10 years at
from 5 minute to 30 minute ~ 20 million output
rows ~ 18 minutes
Performance
Overlaps join 2010 weather data (30 Minute)
and 2010 Western Power Data (5 Minute) over
150 Substations ~ 14 Million Output Rows ~ 8
Minutes
Aggregation 100 million Observations
constituting 150 Substations over > 10 years at
from 5 minute to Yearly ~ 14 minutes

16 |
Research Use Case and Visualisation
Percentage of average active power
consumption happening per month for a
selection of Perth Substations in 2010
Percentage summed average active
power consumption over 8 years
happening per year for a selection of
Perth Substations in 2010

17 |
Columnar Stores
Sharding
Pre Canned Aggregations
Limiting Workloads via
Query Estimation
Potential For Real Time Analytics
18 |
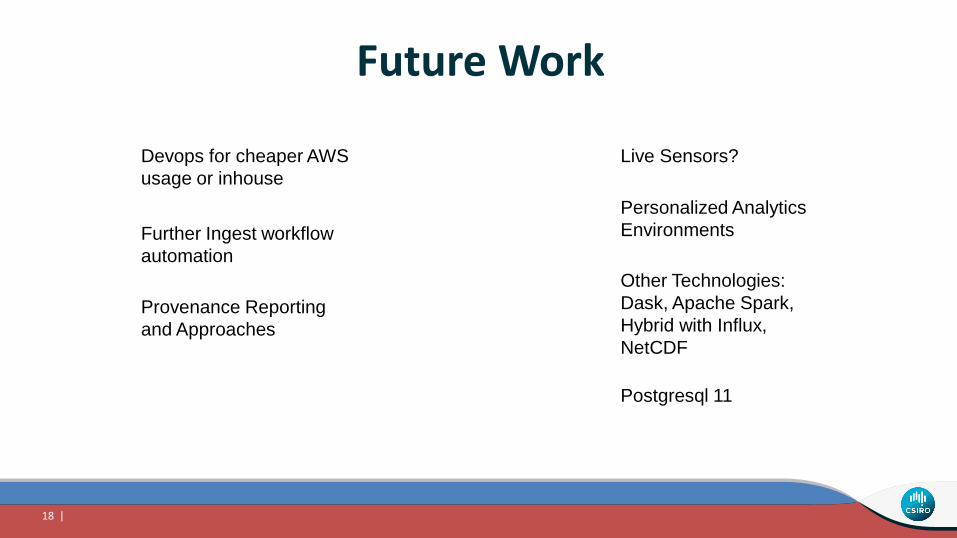
Future Work
Devops for cheaper AWS
usage or inhouse
Further Ingest workflow
automation
Provenance Reporting
and Approaches
Postgresql 11
Other Technologies:
Dask, Apache Spark,
Hybrid with Influx,
NetCDF
Live Sensors?
Personalized Analytics
Environments

LAND AND WATER
Land and WaterBen LeightonScientific ComputeJulia Anticev, Alex Khassapov
Thanks