Embed Size (px)
Citation preview

Working Paper June 2015
Forests
Keywords:Timber, import, export, discrepancyChina, Mozambique, Cameroon, Uganda, DRC
Timber flow study: export/import discrepancy analysisChina vs. Mozambique, Cameroon, Uganda and DRC
You Chang and Ren Peng
International Institute for Environment and Development 80-86 Gray’s Inn Road, London WC1X 8NH, UK Tel: +44 (0)20 3463 7399 Fax: +44 (0)20 3514 9055 email: [email protected] www.iied.org
@iied www.facebook.com/theIIED
Download more publications at www.iied.org/pubs
About the authorsYou Chang and Ren Peng are program officers at Global Environmental Institute (GEI) working on the field of Investment, Trade and the Environment.
You Chang can be reached at [email protected]
Ren Peng can be reached at [email protected]
Global Environmental Institute (GEI) is a non-profit organisation which was founded in Beijing in 2004. GEI explores solutions to environmental issues facing China and the world, proposes forward-looking policy recommendations to the Chinese government, and through innovative demonstration projects fuses best practices in environmental protection, energy conservation and community development.
In the investment, trade and the environment field, GEI endeavours to promote more environmentally friendly and socially conscious investment and trade patterns. We provide and promote research and recommendations for environmentally friendly policies related to China’s trade and investment overseas; develop and carry out environmental policy training and capacity building activities for policy makers from China and host countries; and increase the governance capacity of Chinese enterprises operating overseas through pilot projects, to allow them to fulfill their environment and social obligations and mitigate investment risks.
AcknowledgementsThe authors would like to thank those who made the study possible. Special mention for Xiaoxue Weng and Seth Cook from International Institute for Environment and Development (IIED) who provided detailed inputs for the draft, and Sun Xiufang from Forest Trends, who kindly provided her thoughts during our research.
We would also like to than Xu Bin, Li Jianquan, Chen Yong, Chen Jie and Li Ming from Chinese Academy of Forestry, Wang Lei and Huang Wenbin from WWF for their time to participate in discussions surrounding this research project.
We would like to thank Lucy Southwood, Benedict Beaupré and Khanh Tran-Thanh for their work on editing, design and coordination.
This research was funded by the China Africa Forest Governance Project led by IIED. We would like to express our deep appreciation for IIED’s generous support and guidance.
Produced by IIED’s Natural Resources GroupThe aim of the Natural Resources Group is to build partnerships, capacity and wise decision-making for fair and sustainable use of natural resources. Our priority in pursuing this purpose is on local control and management of natural resources and other ecosystems.
Published by IIED, June 2015
You Chang and Ren Peng. 2015. Timber flow study: export/import discrepancy analysis China vs. Mozambique, Cameroon, Uganda and DRC. IIED Issue Paper. IIED, London.
http://pubs.iied.org/13579IIED
ISBN: 978-1-78431-212-1
Printed on recycled paper with vegetable-based inks.
IIED WORKING PAPER
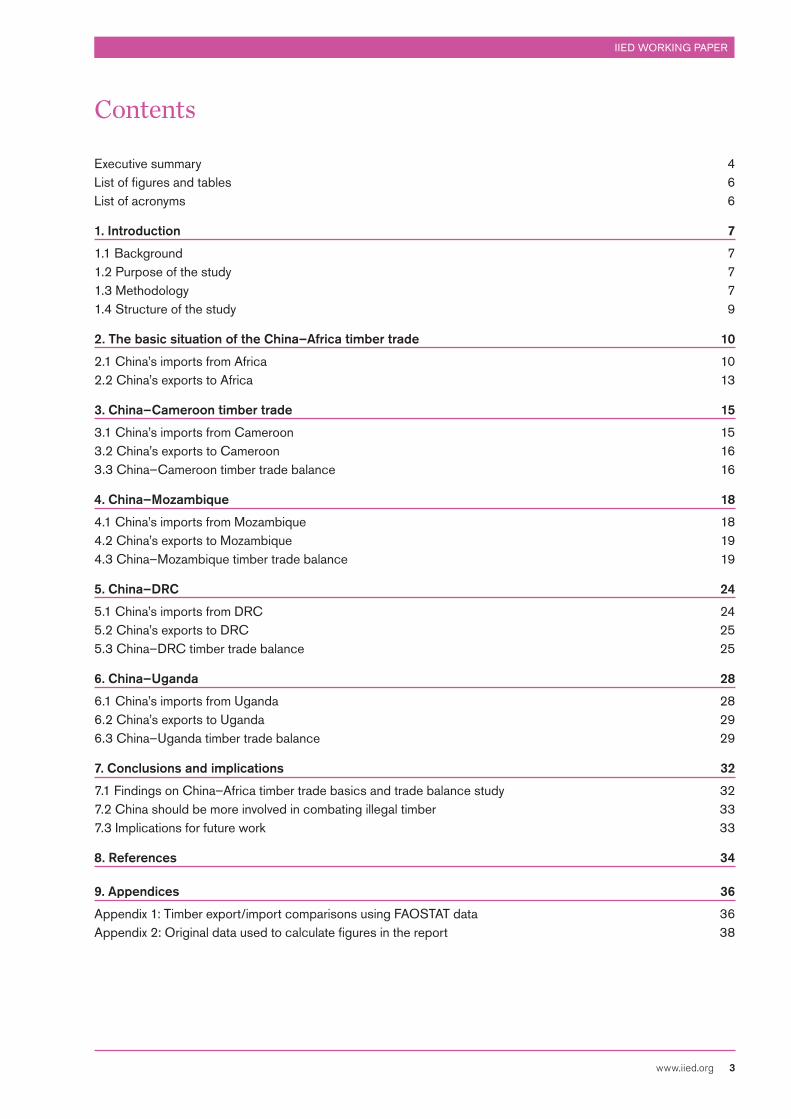
Contents
Executive summary 4List of figures and tables 6List of acronyms 6
1. Introduction 7
1.1 Background 71.2 Purpose of the study 71.3 Methodology 71.4 Structure of the study 9
2. The basic situation of the China–Africa timber trade 10
2.1 China’s imports from Africa 102.2 China’s exports to Africa 13
3. China–Cameroon timber trade 15
3.1 China’s imports from Cameroon 153.2 China’s exports to Cameroon 163.3 China–Cameroon timber trade balance 16
4. China–Mozambique 18
4.1 China’s imports from Mozambique 184.2 China’s exports to Mozambique 194.3 China–Mozambique timber trade balance 19
5. China–DRC 24
5.1 China’s imports from DRC 245.2 China’s exports to DRC 255.3 China–DRC timber trade balance 25
6. China–Uganda 28
6.1 China’s imports from Uganda 286.2 China’s exports to Uganda 296.3 China–Uganda timber trade balance 29
7. Conclusions and implications 32
7.1 Findings on China–Africa timber trade basics and trade balance study 327.2 China should be more involved in combating illegal timber 337.3 Implications for future work 33
8. References 34
9. Appendices 36
Appendix 1: Timber export/import comparisons using FAOSTAT data 36Appendix 2: Original data used to calculate figures in the report 38
www.iied.org 3
TIMBER FLOW STUDY: EXPORT/IMPORT DISCREPANCY ANALYSIS
4 www.iied.org
In the international forest governance area, the European Union and United States lead with their efforts to promote legal timber trade through EU timber regulations, related Voluntary Partnership Agreements (VPAs) and the amended US Lacey Act prohibiting illegally sourced timber. However, the Chinese market is the largest export destination for many African countries, which have relatively lax requirements. Global efforts to improve legality and sustainability in the timber trade therefore depend heavily on the Chinese market. To be truly effective, international efforts to tackle the illegal timber trade must incorporate China. Without it, the EU’s Forest Law Enforcement Governance and Trade (FLEGT) Action Plan and other international efforts may not achieve their desired impact in improving the sustainability and legality of the timber trade.
Although logs still account for the majority of timber exports from Africa to China, the volume flow of sawn wood is rising fast (by 700 per cent, compared to a 50 per cent increase in log trade in the last nine years). This may hint at higher added values captured by African countries as more countries implement log export bans.
Fibreboard and plywood dominate China’s timber exports to Africa, increasing by 900 per cent in the last nine years. Among these exporters are Chinese construction companies, which have confirmed that some of their exports are for Chinese companies contracting in Africa.
Data discrepancies between China and the four African countries lead to assumptions around the extent of illegal trade. The size of the discrepancy varies among countries.
Although trade data shows that Cameroon is the second-largest timber source country feeding Chinese imports from the region (accumulated from 2011–2013), Cameroon is known as a timber transit country. Imports from Cameroon experienced a slight drop in early 2000 and started rising again to exceed 2000 in 2010. We found that this drop coincides with a smaller trade data discrepancy between China and Cameroon, and an improvement in timber legality in Cameroon. This decrease in trade discrepancy may be partly due to Chinese companies increasingly sourcing from legal sources in Cameroon from the early 2000s.
Accumulating from 2011 to 2013, Mozambique is Africa’s fourth-largest timber-exporting country to China. Timber imports from Mozambique increased around seven-fold in the last 10 years. The flow of sawn timber has risen from almost nothing to about half the roundwood equivalent volume of total imports, which is encouraging. However, about 10 per cent of log imports from Mozambique to China in recent years is made up of Dalbergia melanoxylon (African Blackwood), a near-threatened hongmu (rosewood) species on the IUCN’s red list. Our efforts to identify discrepancies in the China–Mozambique log trade is hindered by untrustworthy Mozambican data. Previous timber discrepancy studies for trade between these countries using Mozambican total exports data from its forestry sector annual reviews, have shown long-standing, large discrepancies, which point to log smuggling. Such discrepancies are more suspicious in the light of EIA undercover investigations that showed startling illegal activities (EIA 2013).
SummaryThe timber trade between China and Africa has increased dramatically in the last decade, raising concerns over forest conservation in Africa. In order to improve the governance and sustainability of China–Africa timber trade, we need to understand its scale and identify possible problems associated with it. This study provides an in-depth analysis of the most recent data for the trade between China and four African countries. The study is in two parts. First, we analyse Chinese customs data and Chinese data on UN Comtrade, to understand the basic situation of the China–Africa timber trade, its product composition and developing trends. Second, we explore the extent of data discrepancy.
IIED WORKING PAPER
www.iied.org 5
China–DRC timber trade has enjoyed a fast growth, going from virtually nothing in the early 2000s to being in Africa’s top ten timber source countries for the Chinese market. About 30–50 per cent of log imports from DRC to China in the last three years were made up of Millettia laurentii (or wenge), which is listed as endangered in IUCN red list. A lack of UN Comtrade data meant we had to use data from the FAOSTAT database to study China–DRC timber trade discrepancies. With the comparison results showing almost no discrepancies, we conclude that the results are untrustworthy. Using DRCs domestic data on total exports to all Asian countries, we found the latters’ recorded imports exceeded DRC-claimed timber exports to Asia in 2010 and 2011. China’s imports alone exceeded DRC’s total reported exports to all Asian countries in 2010. Such sporadic discrepancies alone are not evidence enough, but our findings reflect earlier studies suggesting that illegal timber trade is rife in DRC.
The volume of Chinese timber product imports from Uganda is low compared to imports from the other three countries and are composed of more sawn wood than logs. According to UN Comtrade data, Uganda-reported imports from China exceed China-reported exports to Uganda, while China-reported imports also exceed Uganda-reported exports. Such two-way discrepancies are on a small scale because of the low trade volume between these two countries. We do not claim to have found evidence or suggestions of illegal trade between these two countries.
We attempted to identify the top 10 Chinese companies involved in the timber trade between China and Africa in general and China and the four countries in this study in particular, but do not consider the company information to be 100 per cent accurate. Smaller companies tend to import through agents or bigger companies, and do not appear on the list. We therefore recommend leaving such an analysis for the future, when we hope to get a more accurate importing list by interviewing the parties involved.
We conclude that the drawbacks in our data sources point to the need for further work in this area. Due to data reliability issues, our current discrepancy analysis is far from reaching a definitive conclusion. We also note that multiple factors contribute to discrepancies.
To understand the illegal timber trade, we can either take a different approach or source more reliable data and rule out other factors. We can do this by either taking data from African national customs agencies or by tracing cases of timber trade (if possible) to examine the ‘legal’ factors that results in discrepancies.
TIMBER FLOW STUDY: EXPORT/IMPORT DISCREPANCY ANALYSIS
6 www.iied.org
List of figures and tablesFigure 1: Chinese wood and wood products imports from Africa, 2005–2009 12
Figure 2: Top source African countries for Chinese log imports (based on data 2011–2013) 12
Figure 3: Chinese timber product exports to Africa, 2005–2013 13
Figure 4: Chinese timber product imports from Cameroon, 2004–2013 15
Figure 5: Chinese timber-related product exports to Cameroon, 2004–2013 16
Figure 6: Export/import comparison for logs exported from Cameroon* to China, 2000–2012 17
Figure 7: Chinese timber-related product imports from Mozambique, 2004–2013 18
Figure 8: Chinese timber-related product exports to Mozambique, 2004–2013 19
Figure 9: Comparison of total Mozambican licensed timber exports and China-reported timber imports from Mozambique, 2007–2013 20
Figure 10: Comparison for log exports from Mozambique to China, as reported by both countries 21
Figure 11: Chinese timber product imports from DRC 24
Figure 12: Chinese timber-related product exports to DRC 25
Figure 13: Chinese timber product imports from Uganda 28
Figure 14: Chinese timber-related product exports to Uganda, 2004–2013 29
Figure 15: Exports/imports comparison for sawn wood, Uganda to China 29
Figure 16: Exports/imports comparison for sawn wood, China to Uganda 30
Figure A 1: Mozambican log exports to China, as reported by both countries, 2005–2012 36
Figure A 2: Cameroonian log exports to China, as reported by both countries, 1998–2012 37
Table 1: Chinese timber product imports from Africa, 2009–2013 10
Table 2: Chinese wood and wood product imports from Africa, 2005–2013 11
Table 3: Chinese timber product exports to Africa, 2009–2013 13
Table 4: Chinese timber product exports to Africa, 2005–2013 14
Table 5: Export/import comparison for logs exported from Cameroon to China 16
Table 6: Comparison of total Mozambican licensed timber exports and China-reported timber imports from Mozambique, 2007–2013 20
Table 7: Log exports from Mozambique to China, as reported by both countries 21
Table 8: Wood density of species that Mozambique typically exports to China 22
Table 9: Mozambican log exports to Japan, as reported by both countries 22
Table 10: Mozambican log exports to Portugal, as reported by both countries 22
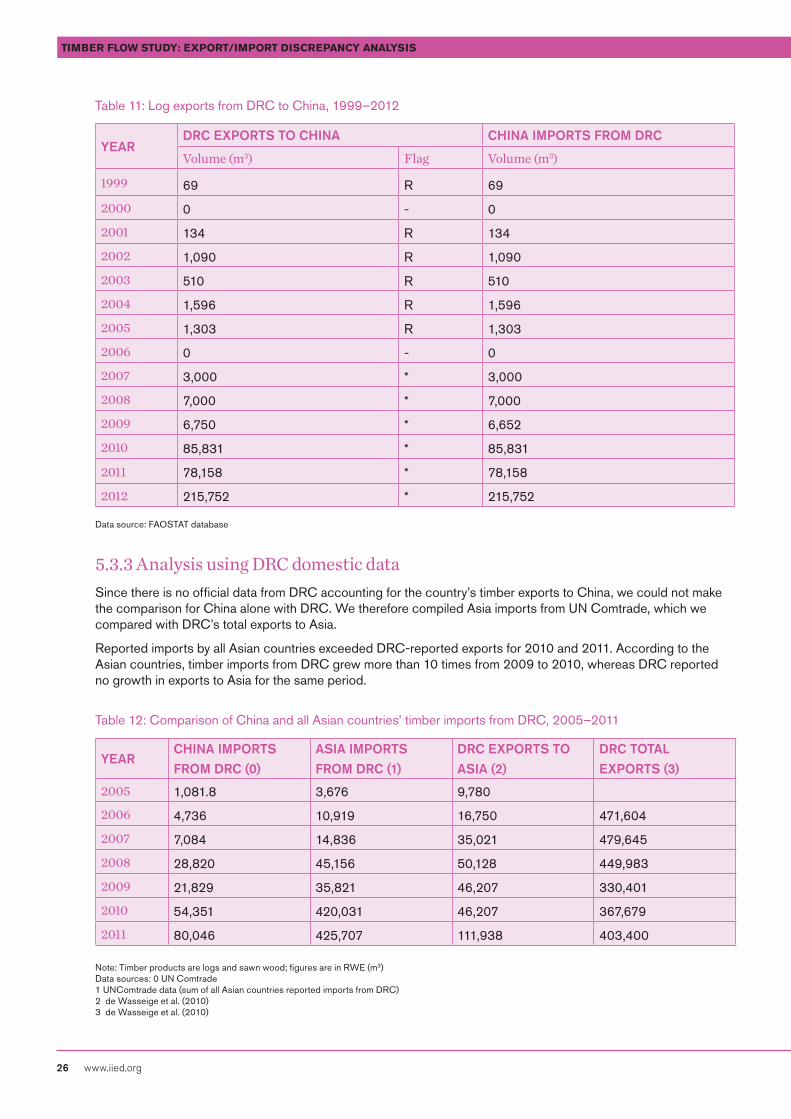
Table 11: Log exports from DRC to China, 1999–2012 26
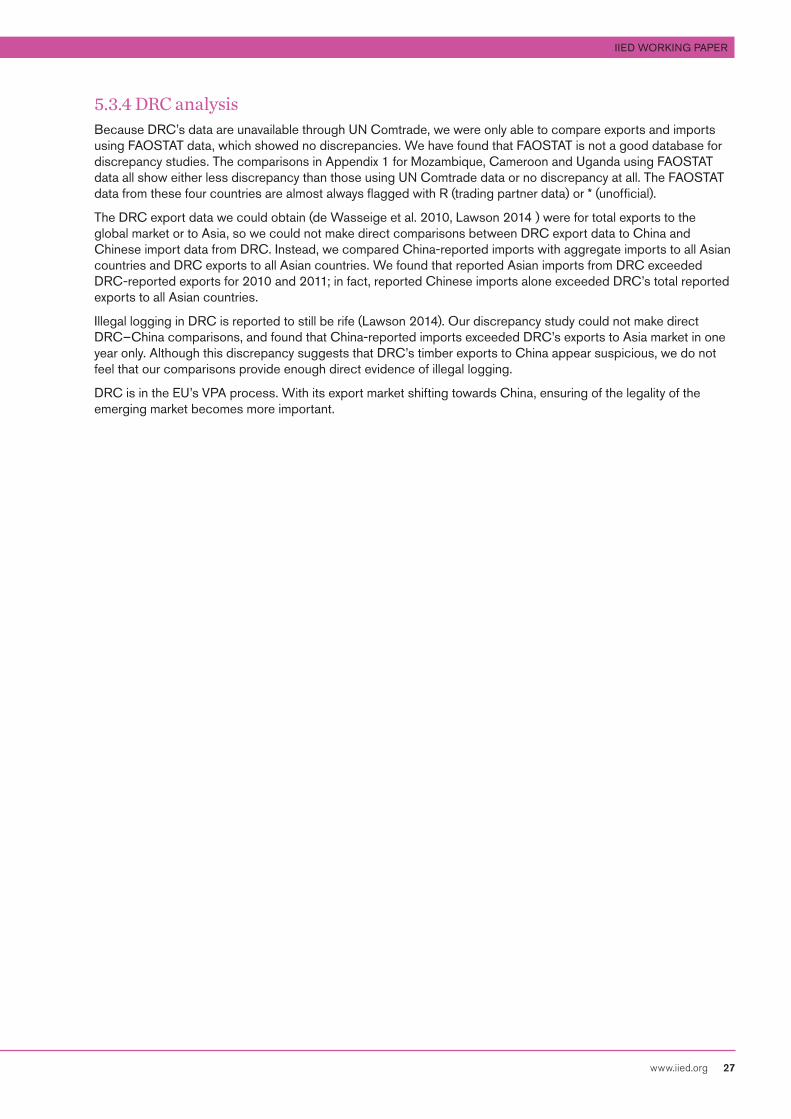
Table 12: Comparison of China and all Asian countries’ timber imports from DRC, 2005–2011 26
Table 13: Log trade between Uganda and China, 1999–2013 30
Table A 1: Ugandan sawn wood exports to China, as reported by both countries 37
Table A 2: Ugandan log exports to China, as reported by both countries 38
Table A 3: Chinese timber-related product imports from Mozambique (data used in Figure 7) 38
Table A 4: Sawn wood exports from China to Uganda, as reported by both countries, (data used in Figure 16) 39
Table A 5: Chinese timber product imports from Uganda (data used in Figure 13) 39
Table A 6: Chinese timber product imports from DRC (data used in Figure 11) 40
Table A 7: Chinese timber product imports from Cameroon (data used in Figure 4) 40
List of acronymsDRC Democratic Republic of the CongoEIA Environmental Investigation AgencyEU European UnionHS harmonisation system IIED International Institute for Environment and DevelopmentITTO International Tropical Timber OrganizationIUCN International Union for Conservation of NatureFAO Food and Agriculture Organization of the United NationsFGLP Forest Governance Learning PlatformFLEGT Forest Law Enforcement Governance and Trade (EU)RWE roundwood equivalentTLVS Timber Legality Verification SystemUN United NationsVPA Voluntary Partnership Agreement
IIED WORKING PAPER
www.iied.org 7
1 Introduction1.1 BackgroundThe flow of timber between China and Africa has increased in the last decade. The trade has received intensive international attention, with some criticisms and accusations of threats to tropical forest and highly valuable timber species. The timber trade, along with other extractive sectors, is of special concern due to its impact on forests and biodiversity.
Although the European Union has traditionally been the most important destination of African timber (Sun 2014) and continues to dominate the export market of many African countries, African timber exports to China are increasing fast, exceeding EU in some countries. As the Chinese market becomes more important, features of this market strongly influence the African timber industry. The legality of the trade has at times been questioned, as reflected in Environmental Investigation Agency (EIA) investigations (EIA 2013, 2014).
1.2 Purpose of the studyAs the Chinese market finds more African timber sources, problems are emerging around sustainable investments, illegal logging and rural livelihoods. The International Institute for Environment and Development (IIED) identified a lack of understanding of Chinese forest-linked investments among African policy opinion formers and researchers and a lack of dialogue between African and Chinese stakeholders to address such issues. IIED therefore launched the Africa–China Forest Governance Learning Platform (FGLP) in 2013, which included representatives from China and four African countries: Cameroon, Mozambique, Uganda and Democratic Republic of Congo (DRC). The FGLP has since worked in these countries to generate evidence, strengthen capacity and dialogue and improve policy and investment practice.
This study presents evidence for the project on timber trade discrepancies. It offers basic background information on the current situation of the China–Africa timber trade, as a part of the effort to improve China–Africa forest governance. We also identify and understand discrepancies in import and export data, to shed light on the extent of illegal timber trade.
1.3 MethodologyAlthough our project focuses on Mozambique, DRC, Cameroon and Uganda, we also look at Africa as a whole. Our first consideration was the basic situation of the timber product trade between China and Africa and between China and the four African countries named above. We analysed Chinese data to understand the product composition and developing trends in the trade, including information about the top 10 companies in the trade for future reference.
Export/import discrepancies have long been used as an important indicator of illegal timber trade (Brunner et al. 1998, Contreras-Hermosilla and Global Witness 2003). We obtained export data for the four African countries and Chinese import data from public databases to make export/import comparisons. Each comparison is made only within the same database. We also restricted the export/import study to volume whenever possible, conducting unit conversions when only weight — not volume — data were available.
TIMBER FLOW STUDY: EXPORT/IMPORT DISCREPANCY ANALYSIS
8 www.iied.org
1.3.1 Trade data discrepancy analysisWe present trade data discrepancies that previous studies have found between China and the four countries, presenting some possible reasons for these discrepancies and discussing how data sources affect what we observe. In each section, we carry out our own discrepancy analysis for each country.
Previous studies have identified a variety of factors as possible causes and influences on discrepancies in exports and imports:
• A Forest Trends presentation1 lists the following: change in fiscal year, production valuation, time lag between exports and imports, data entry errors, unit and conversion factors, log scaling methods, mixed products in shipment, harmonisation system (HS) code classifications2, under-invoicing, errors in speciation and grading, and smuggling. If discrepancies persist over the long term, factors that cannot be ruled out include unit and conversion factors, log scaling methods, HS code classification, under-invoicing and smuggling.
• Another study identifies the incorrect specification of origin or destination of shipment as a probably cause, particularly when a significant quantity of tropical timber imports to China are trans-shipped through Hong Kong; confusion in the classification of tropical and temperate non-coniferous timber; and differences in measurement standards and scaling methods (Johnson 2002).
• The International Tropical Timber Organization (ITTO) found it probable that illegal trade accounts for some of the discrepancies, but concluded that the extent of it is difficult to assess3.
Data for logs and sawn wood imports/exports are usually given in volume. In these cases, we were able to compare data directly. Where import and export data was given in weight, we needed to convert them using roundwood equivalent (RWE) conversion factors, which we adopted from Contreras-Hermosilla et al. (2007, Table A3).
1.3.2 Data sourcesWe used three main sources of data for our study:
• Chinese customs: this data is provided by China Cuslink Company, which is affiliated to the China Customs Information Center. This source only provides official Chinese data in the original units that were recorded.
• UN Comtrade: “ The United Nations Commodity Trade Statistics Database stores more than 1 billion trade data records from 1962. Over 140 reporter countries provide the United Nations Statistics Division with their annual international trade statistics detailed by commodities and partner countries. These data are subsequently transformed into the United Nations Statistics Division standard format with consistent coding and valuation using the UN/OECD CoprA internal processing system.”4
• FAOSTAT: According to the FAOSTAT website, “the main source is official statistics from FAO member countries. Exceptionally, unofficial data are also used as well as imputed data. In both cases these are flagged. Data are recorded as countries report them, except for elimination obvious errors.”5
We used Chinese customs data and UN Comtrade data to analyse the current situation of the China–Africa timber product trade. We confirmed that both sets of data agree with each other using a subset and then obtained only those detailed data that are not available online.
To make export/import comparisons between China and the exporting countries, we used data from the UN Comtrade database, FAOSTAT database and research studies, including EIA and ITTO reports.
Official data from African countries can be hard to obtain, so we used UN Comtrade data where they are available; FAOSTAT data when Comtrade data do not exist; and data from published studies. However, data from different sources do not always agree, so where possible we confined our comparisons within the same database.
The FAOSTAT database proved to be unsuitable for discrepancy studies for the five countries in our study. Most African data in the FAOSTAT database are unofficial, or taken from trading partners’ data. This means that comparisons show no discrepancy at all.
1 http://forest-trends.org/documents/files/doc_845.pdf 2 HS codes are created by the World Customs Organization to categorise commodities for export/import. 3 ITTO identifies causes of trade data discrepancies: www.itto.int/sfm_detail/id=2170000 4 http://data.un.org/DataMartInfo.aspx 5 http://faostat3.fao.org/
IIED WORKING PAPER
www.iied.org 9
1.3.3 Classification of timber-related productsFor the study, we divided Chinese timber imports from Africa in general into three categories: wood and wood products; paper and pulp; and furniture. For our more detailed analysis, we maintained the category of furniture, but further divided the other categories into paper; pulp; logs; sawn wood; fiberboard; plywood; any products not specified in a particular figure/table are included under ‘other’.
1.4 Structure of the studyThe structure of the study report is as follows:
Section 2 is a brief review of the China–Africa timber trade, including the major commodities, trends and main exporting countries.
Sections 3, 4, 5 and 6 focus on the four African countries — Cameroon, Mozambique, DRC and Uganda — in turn. For each country, we review the timber trade basic trend and then study the trade balance with China, trying to identify reasons for discrepancies where these appear.
Section 7 concludes the study with our findings and implications.
TIMBER FLOW STUDY: EXPORT/IMPORT DISCREPANCY ANALYSIS
10 www.iied.org
2 The basic situation of the China–Africa timber trade This section examines the background of China’s timber trade with Africa as a whole and with the four specific countries. This includes major timber commodities and trading trends. Because Chinese data is more complete in UN Comtrade and other public databases, we use China-reported data for these analyses, including Chinese customs agency data and UN Comtrade data. We also include information for the top 10 Chinese companies involved in the timber trade.
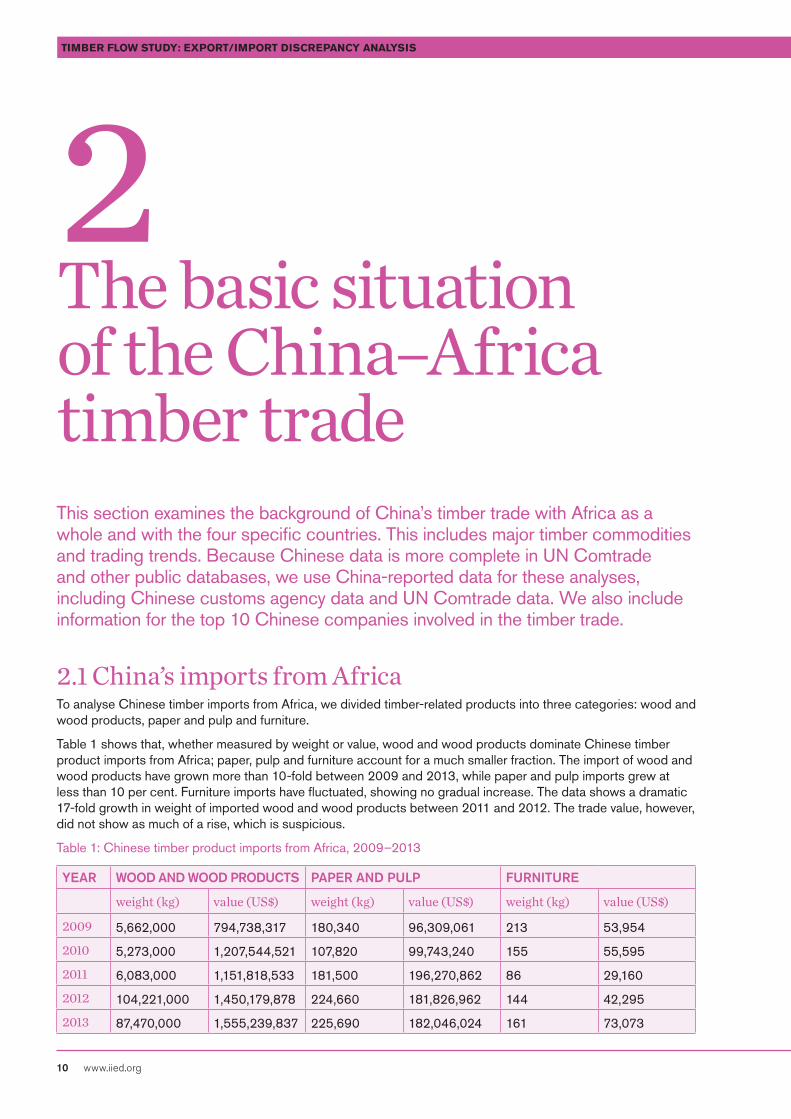
2.1 China’s imports from AfricaTo analyse Chinese timber imports from Africa, we divided timber-related products into three categories: wood and wood products, paper and pulp and furniture.
Table 1 shows that, whether measured by weight or value, wood and wood products dominate Chinese timber product imports from Africa; paper, pulp and furniture account for a much smaller fraction. The import of wood and wood products have grown more than 10-fold between 2009 and 2013, while paper and pulp imports grew at less than 10 per cent. Furniture imports have fluctuated, showing no gradual increase. The data shows a dramatic 17-fold growth in weight of imported wood and wood products between 2011 and 2012. The trade value, however, did not show as much of a rise, which is suspicious.
Table 1: Chinese timber product imports from Africa, 2009–2013
YEAR WOOD AND WOOD PRODUCTS PAPER AND PULP FURNITURE
weight (kg) value (US$) weight (kg) value (US$) weight (kg) value (US$)
2009 5,662,000 794,738,317 180,340 96,309,061 213 53,954
2010 5,273,000 1,207,544,521 107,820 99,743,240 155 55,595
2011 6,083,000 1,151,818,533 181,500 196,270,862 86 29,160
2012 104,221,000 1,450,179,878 224,660 181,826,962 144 42,295
2013 87,470,000 1,555,239,837 225,690 182,046,024 161 73,073
IIED WORKING PAPER
www.iied.org 11
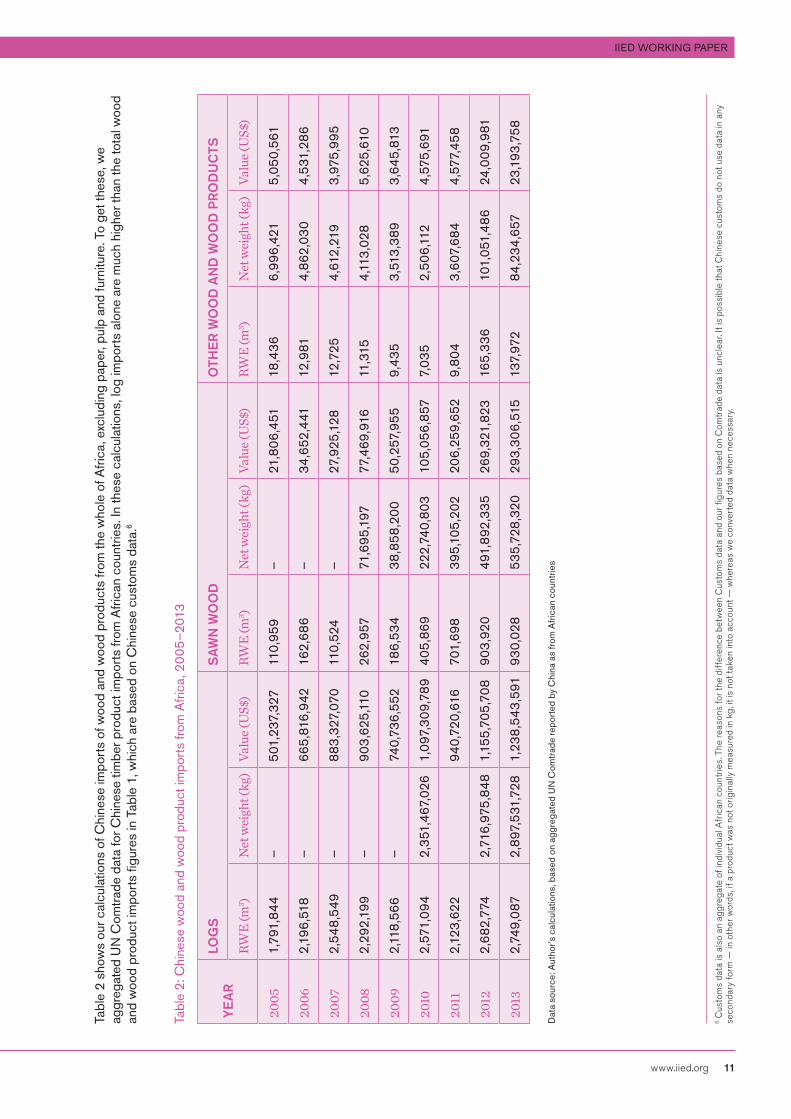
Tabl
e 2
show
s ou
r cal
cula
tions
of C
hine
se im
port
s of
woo
d an
d w
ood
prod
ucts
from
the
who
le o
f Afri
ca, e
xclu
ding
pap
er, p
ulp
and
furn
iture
. To
get t
hese
, we
aggr
egat
ed U
N C
omtr
ade
data
for C
hine
se ti
mbe
r pro
duct
impo
rts
from
Afri
can
coun
trie
s. In
thes
e ca
lcul
atio
ns, l
og im
port
s al
one
are
muc
h hi
gher
than
the
tota
l woo
d an
d w
ood
prod
uct i
mpo
rts
figur
es in
Tab
le 1
, whi
ch a
re b
ased
on
Chi
nese
cus
tom
s da
ta.6
Tabl
e 2:
Chi
nese
woo
d an
d w
ood
prod
uct i
mpo
rts
from
Afri
ca, 2
005
–201
3
YE
AR
LOG
SS
AW
N W
OO
DO
THE
R W
OO
D A
ND
WO
OD
PR
OD
UC
TS
RWE
(m3 )
Net
wei
ght (
kg)
Valu
e (U
S$)
RWE
(m3 )
Net
wei
ght (
kg)
Valu
e (U
S$)
RWE
(m3 )
Net
wei
ght (
kg)
Valu
e (U
S$)
2005
1,79
1,84
4–
501,
237,
327
110,
959
–21
,806
,451
18,4
366,
996,
421
5,05
0,56
1
2006
2,19
6,51
8–
665,
816,
942
162,
686
–34
,652
,441
12,9
814,
862,
030
4,53
1,28
6
2007
2,54
8,5
49–
883
,327
,070
110,
524
–27
,925
,128
12,7
254,
612,
219
3,9
75,9
95
2008
2,29
2,19
9–
903
,625
,110
262,
957
71,6
95,1
9777
,469
,916
11,3
154,
113
,028
5,62
5,61
0
2009
2,11
8,5
66–
740,
736,
552
186,
534
38,8
58,2
00
50,2
57,9
559,
435
3,5
13,3
893
,645
,813
2010
2,57
1,09
42,
351,
467,
026
1,09
7,30
9,78
940
5,86
922
2,74
0,80
310
5,05
6,8
577,
035
2,50
6,11
24,
575,
691
2011
2,12
3,6
2294
0,72
0,61
670
1,69
839
5,10
5,20
220
6,25
9,65
29,
804
3,6
07,6
844,
577,
458
2012
2,68
2,77
42,
716,
975,
848
1,15
5,70
5,70
890
3,9
2049
1,89
2,33
526
9,32
1,82
316
5,33
610
1,05
1,48
624
,009
,981
2013
2,74
9,08
72,
897,
531,
728
1,23
8,5
43,5
9193
0,02
853
5,72
8,3
2029
3,3
06,5
1513
7,97
284
,234
,657
23,1
93,7
58
Dat
a so
urce
: Aut
hor’s
cal
cula
tions
, bas
ed o
n ag
greg
ated
UN
Com
trad
e re
port
ed b
y C
hina
as
from
Afr
ican
cou
ntrie
s
6 C
usto
ms
data
is a
lso
an a
ggre
gate
of i
ndiv
idua
l Afr
ican
cou
ntrie
s. T
he r
easo
ns fo
r the
diff
eren
ce b
etw
een
Cus
tom
s da
ta a
nd o
ur f
igur
es b
ased
on
Com
trad
e da
ta is
unc
lear
. It i
s po
ssib
le th
at C
hine
se c
usto
ms
do n
ot u
se d
ata
in a
ny
seco
ndar
y fo
rm —
in o
ther
wor
ds, i
f a p
rodu
ct w
as n
ot o
rigin
ally
mea
sure
d in
kg,
it is
not
tak
en in
to a
ccou
nt —
whe
reas
we
conv
erte
d da
ta w
hen
nece
ssar
y.
TIMBER FLOW STUDY: EXPORT/IMPORT DISCREPANCY ANALYSIS
12 www.iied.org
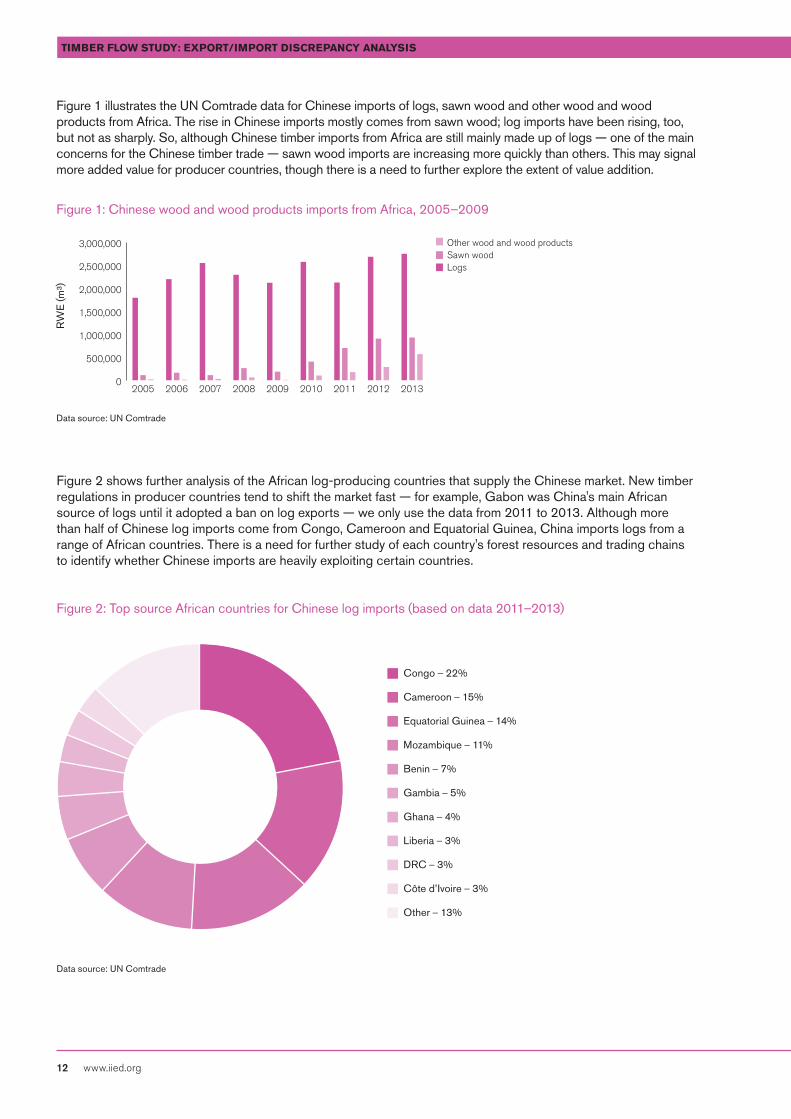
Figure 1 illustrates the UN Comtrade data for Chinese imports of logs, sawn wood and other wood and wood products from Africa. The rise in Chinese imports mostly comes from sawn wood; log imports have been rising, too, but not as sharply. So, although Chinese timber imports from Africa are still mainly made up of logs — one of the main concerns for the Chinese timber trade — sawn wood imports are increasing more quickly than others. This may signal more added value for producer countries, though there is a need to further explore the extent of value addition.
Figure 1: Chinese wood and wood products imports from Africa, 2005–2009
0
500,000
1,000,000
1,500,000
2,000,000
2,500,000
3,000,000 Other wood and wood productsSawn woodLogs
201320122011201020092008200720062005
Data source: UN Comtrade
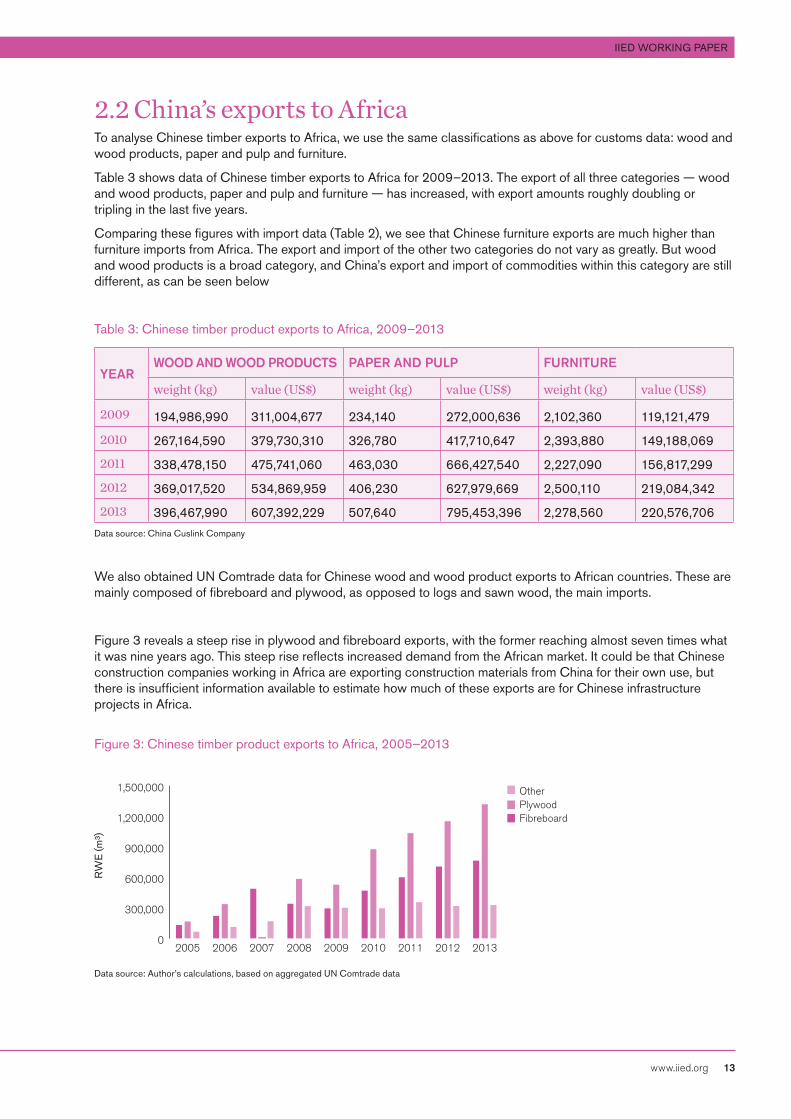
Figure 2 shows further analysis of the African log-producing countries that supply the Chinese market. New timber regulations in producer countries tend to shift the market fast — for example, Gabon was China's main African source of logs until it adopted a ban on log exports — we only use the data from 2011 to 2013. Although more than half of Chinese log imports come from Congo, Cameroon and Equatorial Guinea, China imports logs from a range of African countries. There is a need for further study of each country's forest resources and trading chains to identify whether Chinese imports are heavily exploiting certain countries.
Figure 2: Top source African countries for Chinese log imports (based on data 2011–2013)
Data source: UN Comtrade
Congo – 22%
Cameroon – 15%
Equatorial Guinea – 14%
Mozambique – 11%
Benin – 7%
Gambia – 5%
Ghana – 4%
Liberia – 3%
DRC – 3%
Côte d’Ivoire – 3%
Other – 13%
RW
E (m
³)
IIED WORKING PAPER
www.iied.org 13
2.2 China’s exports to AfricaTo analyse Chinese timber exports to Africa, we use the same classifications as above for customs data: wood and wood products, paper and pulp and furniture.
Table 3 shows data of Chinese timber exports to Africa for 2009–2013. The export of all three categories — wood and wood products, paper and pulp and furniture — has increased, with export amounts roughly doubling or tripling in the last five years.
Comparing these figures with import data (Table 2), we see that Chinese furniture exports are much higher than furniture imports from Africa. The export and import of the other two categories do not vary as greatly. But wood and wood products is a broad category, and China’s export and import of commodities within this category are still different, as can be seen below
Table 3: Chinese timber product exports to Africa, 2009–2013
YEARWOOD AND WOOD PRODUCTS PAPER AND PULP FURNITURE
weight (kg) value (US$) weight (kg) value (US$) weight (kg) value (US$)
2009 194,986,990 311,004,677 234,140 272,000,636 2,102,360 119,121,479
2010 267,164,590 379,730,310 326,780 417,710,647 2,393,880 149,188,069
2011 338,478,150 475,741,060 463,030 666,427,540 2,227,090 156,817,299
2012 369,017,520 534,869,959 406,230 627,979,669 2,500,110 219,084,342
2013 396,467,990 607,392,229 507,640 795,453,396 2,278,560 220,576,706Data source: China Cuslink Company
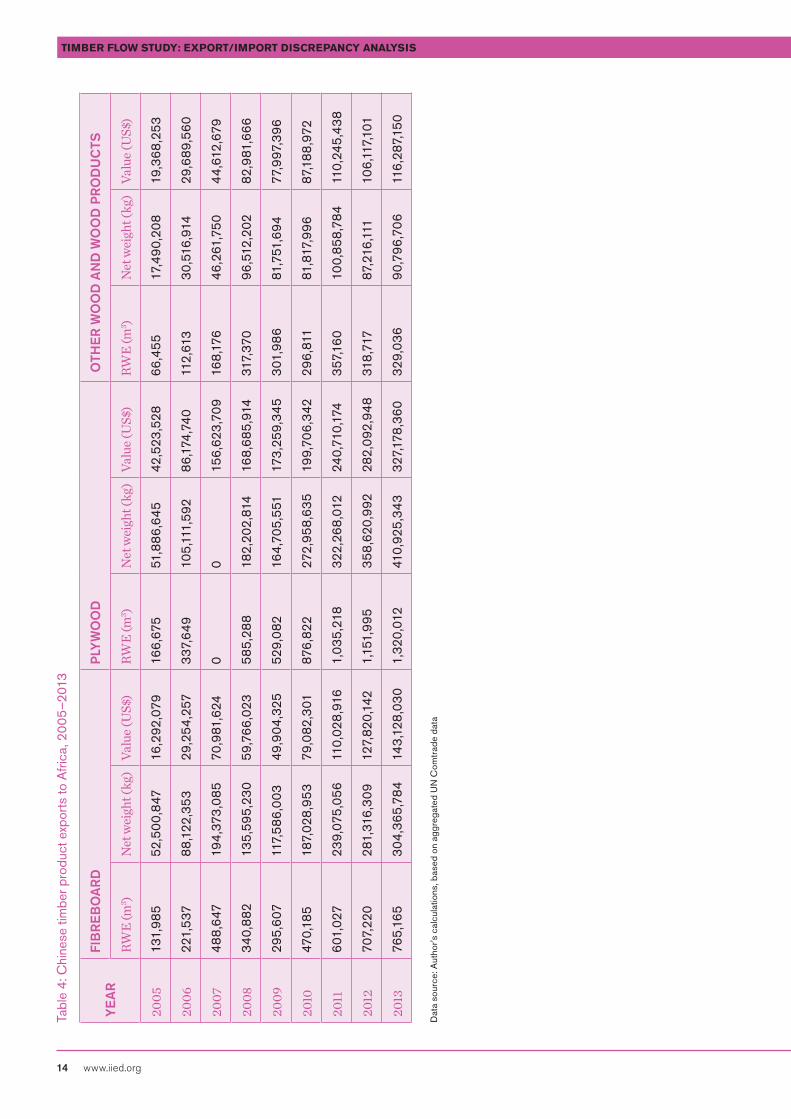
We also obtained UN Comtrade data for Chinese wood and wood product exports to African countries. These are mainly composed of fibreboard and plywood, as opposed to logs and sawn wood, the main imports.
Figure 3 reveals a steep rise in plywood and fibreboard exports, with the former reaching almost seven times what it was nine years ago. This steep rise reflects increased demand from the African market. It could be that Chinese construction companies working in Africa are exporting construction materials from China for their own use, but there is insufficient information available to estimate how much of these exports are for Chinese infrastructure projects in Africa.
Figure 3: Chinese timber product exports to Africa, 2005–2013
0
300,000
600,000
900,000
1,200,000
1,500,000
201320122011201020092008200720062005
OtherPlywoodFibreboard
Data source: Author’s calculations, based on aggregated UN Comtrade data
RW
E (m
³)
TIMBER FLOW STUDY: EXPORT/IMPORT DISCREPANCY ANALYSIS
14 www.iied.org
Tabl
e 4:
Chi
nese
tim
ber p
rodu
ct e
xpor
ts to
Afri
ca, 2
005
–201
3
YE
AR
FIB
RE
BO
AR
DP
LYW
OO
D O
THE
R W
OO
D A
ND
WO
OD
PR
OD
UC
TS
RWE
(m3 )
Net
wei
ght (
kg)
Valu
e (U
S$)
RWE
(m3 )
Net
wei
ght (
kg)
Valu
e (U
S$)
RWE
(m3 )
Net
wei
ght (
kg)
Valu
e (U
S$)
2005
131,
985
52,5
00,
847
16,2
92,0
7916
6,67
551
,886
,645
42,5
23,5
2866
,455
17,4
90,2
0819
,368
,253
2006
221,
537
88,1
22,3
5329
,254
,257
337,
649
105,
111,
592
86,1
74,7
4011
2,61
330
,516
,914
29,6
89,5
60
2007
488
,647
194,
373
,085
70,9
81,6
240
015
6,62
3,7
0916
8,1
7646
,261
,750
44,6
12,6
79
2008
340,
882
135,
595,
230
59,7
66,0
2358
5,28
818
2,20
2,81
416
8,6
85,9
1431
7,37
096
,512
,202
82,9
81,6
66
2009
295,
607
117,
586,
003
49,9
04,3
2552
9,08
216
4,70
5,55
117
3,2
59,3
4530
1,98
681
,751
,694
77,9
97,3
96
2010
470,
185
187,
028
,953
79,0
82,3
0187
6,82
227
2,95
8,6
3519
9,70
6,34
229
6,81
181
,817
,996
87,1
88
,972
2011
601,
027
239,
075,
056
110,
028
,916
1,03
5,21
832
2,26
8,0
1224
0,71
0,17
435
7,16
010
0,85
8,7
8411
0,24
5,43
8
2012
707,
220
281,
316,
309
127,
820,
142
1,15
1,99
535
8,6
20,9
9228
2,09
2,94
831
8,7
1787
,216
,111
106,
117,
101
2013
765,
165
304,
365,
784
143
,128
,030
1,32
0,01
241
0,92
5,34
332
7,17
8,3
6032
9,03
690
,796
,706
116,
287,
150
Dat
a so
urce
: Aut
hor’s
cal
cula
tions
, bas
ed o
n ag
greg
ated
UN
Com
trad
e da
ta

IIED WORKING PAPER
www.iied.org 15
3 China–Cameroon timber trade 3.1 China’s imports from CameroonAs illustrated by Figure 4, Chinese timber product imports from Cameroon multiplied by several times over 10 years. Cameroon used to export mostly to the EU, but China is fast becoming an important destination for Cameroonian timber.
The main timber-related products that China imports from Cameroon are logs and sawn wood, with the amount of logs exceeding sawn wood. In both respects, there are similar trends in China’s trade with Mozambique and DRC.
Figure 4: Chinese timber product imports from Cameroon, 2004–2013
0
100,000
200,000
300,000
400,000
500,000
600,000
700,000
800,000
2013201220112010200920082007200620052004
OtherSawn woodLogs
Note: Excludes hongmu log imports as they represent too small a fraction. See Table A 7 (Appendix 2) for these figures.Data source: UN Comtrade and China Cuslink Company
RW
E (m
³)
TIMBER FLOW STUDY: EXPORT/IMPORT DISCREPANCY ANALYSIS
16 www.iied.org
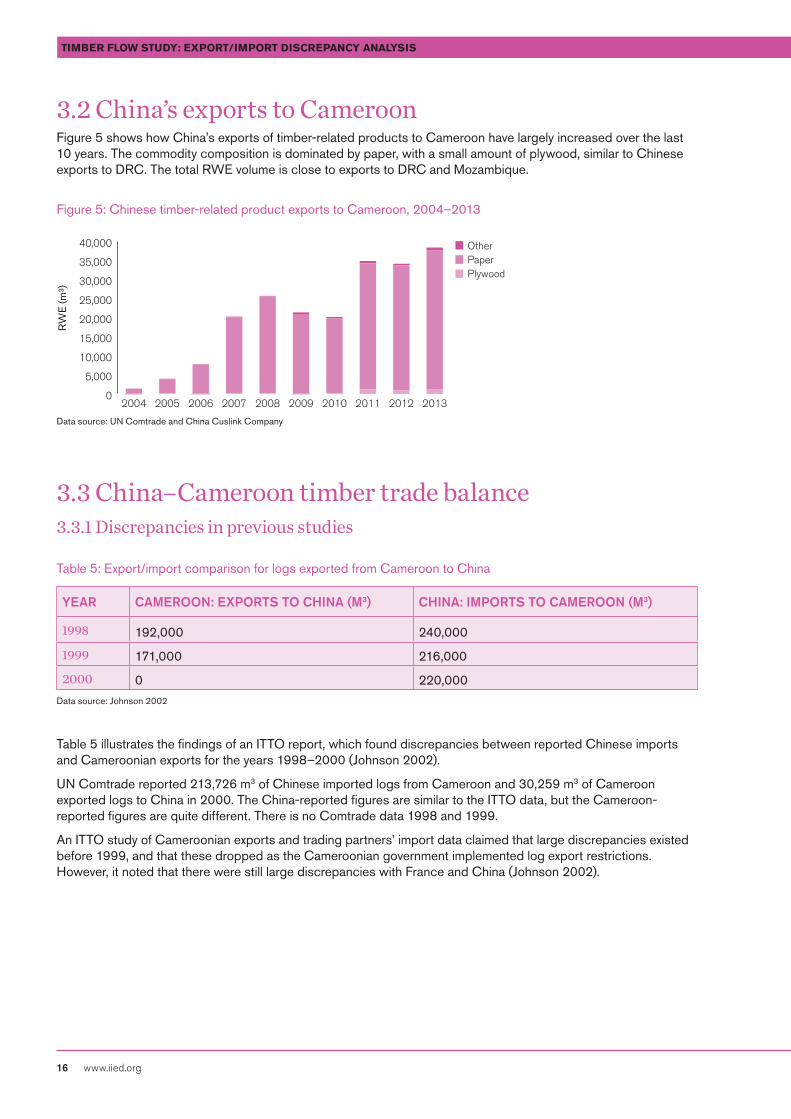
3.2 China’s exports to CameroonFigure 5 shows how China’s exports of timber-related products to Cameroon have largely increased over the last 10 years. The commodity composition is dominated by paper, with a small amount of plywood, similar to Chinese exports to DRC. The total RWE volume is close to exports to DRC and Mozambique.
Figure 5: Chinese timber-related product exports to Cameroon, 2004–2013
0
5,000
10,000
15,000
20,000
25,000
30,000
35,000
40,000
2013201220112010200920082007200620052004
OtherPaperPlywood
Data source: UN Comtrade and China Cuslink Company
3.3 China–Cameroon timber trade balance3.3.1 Discrepancies in previous studies
Table 5: Export/import comparison for logs exported from Cameroon to China
YEAR CAMEROON: EXPORTS TO CHINA (M3) CHINA: IMPORTS TO CAMEROON (M3)
1998 192,000 240,000
1999 171,000 216,000
2000 0 220,000Data source: Johnson 2002
Table 5 illustrates the findings of an ITTO report, which found discrepancies between reported Chinese imports and Cameroonian exports for the years 1998–2000 (Johnson 2002).
UN Comtrade reported 213,726 m3 of Chinese imported logs from Cameroon and 30,259 m3 of Cameroon exported logs to China in 2000. The China-reported figures are similar to the ITTO data, but the Cameroon-reported figures are quite different. There is no Comtrade data 1998 and 1999.
An ITTO study of Cameroonian exports and trading partners’ import data claimed that large discrepancies existed before 1999, and that these dropped as the Cameroonian government implemented log export restrictions. However, it noted that there were still large discrepancies with France and China (Johnson 2002).
RW
E (m
³)
IIED WORKING PAPER
www.iied.org 17
Volu
me
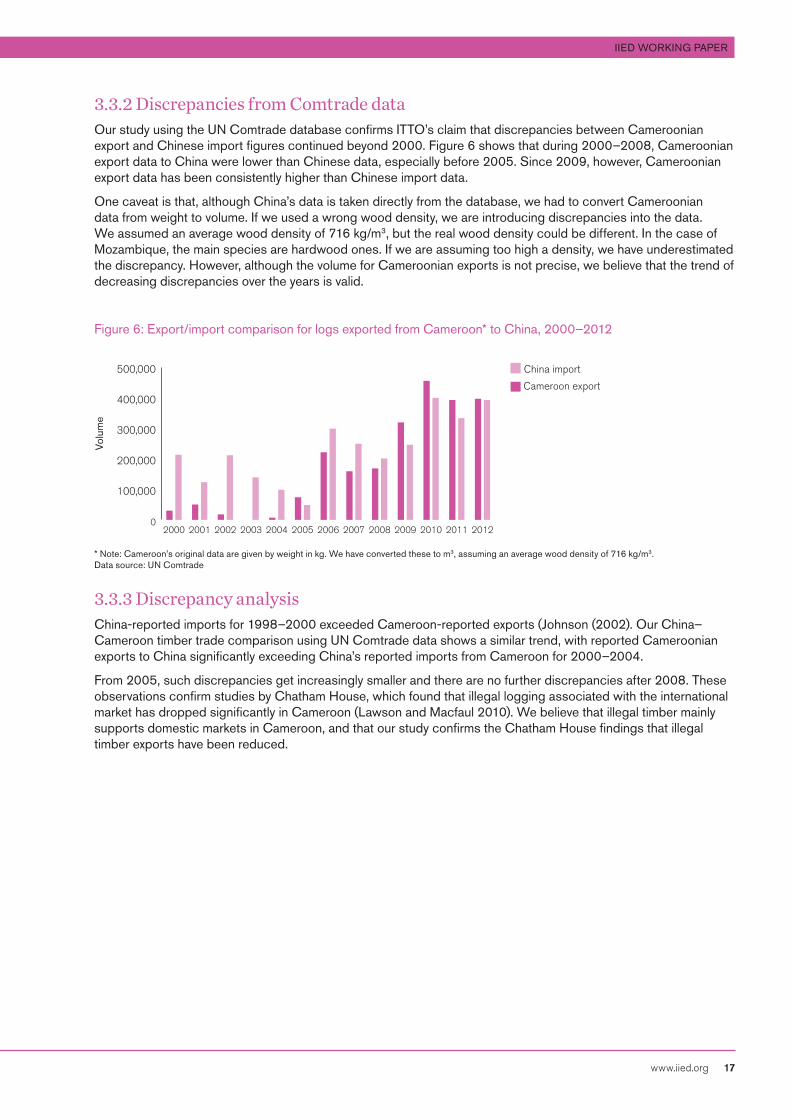
3.3.2 Discrepancies from Comtrade dataOur study using the UN Comtrade database confirms ITTO’s claim that discrepancies between Cameroonian export and Chinese import figures continued beyond 2000. Figure 6 shows that during 2000–2008, Cameroonian export data to China were lower than Chinese data, especially before 2005. Since 2009, however, Cameroonian export data has been consistently higher than Chinese import data.
One caveat is that, although China’s data is taken directly from the database, we had to convert Cameroonian data from weight to volume. If we used a wrong wood density, we are introducing discrepancies into the data. We assumed an average wood density of 716 kg/m3, but the real wood density could be different. In the case of Mozambique, the main species are hardwood ones. If we are assuming too high a density, we have underestimated the discrepancy. However, although the volume for Cameroonian exports is not precise, we believe that the trend of decreasing discrepancies over the years is valid.
Figure 6: Export/import comparison for logs exported from Cameroon* to China, 2000–2012
0
100,000
200,000
300,000
400,000
500,000 China import
Cameroon export
2012201120102009200820072006200520042003200220012000
* Note: Cameroon’s original data are given by weight in kg. We have converted these to m3, assuming an average wood density of 716 kg/m3. Data source: UN Comtrade
3.3.3 Discrepancy analysisChina-reported imports for 1998–2000 exceeded Cameroon-reported exports (Johnson (2002). Our China–Cameroon timber trade comparison using UN Comtrade data shows a similar trend, with reported Cameroonian exports to China significantly exceeding China’s reported imports from Cameroon for 2000–2004.
From 2005, such discrepancies get increasingly smaller and there are no further discrepancies after 2008. These observations confirm studies by Chatham House, which found that illegal logging associated with the international market has dropped significantly in Cameroon (Lawson and Macfaul 2010). We believe that illegal timber mainly supports domestic markets in Cameroon, and that our study confirms the Chatham House findings that illegal timber exports have been reduced.
TIMBER FLOW STUDY: EXPORT/IMPORT DISCREPANCY ANALYSIS
18 www.iied.org
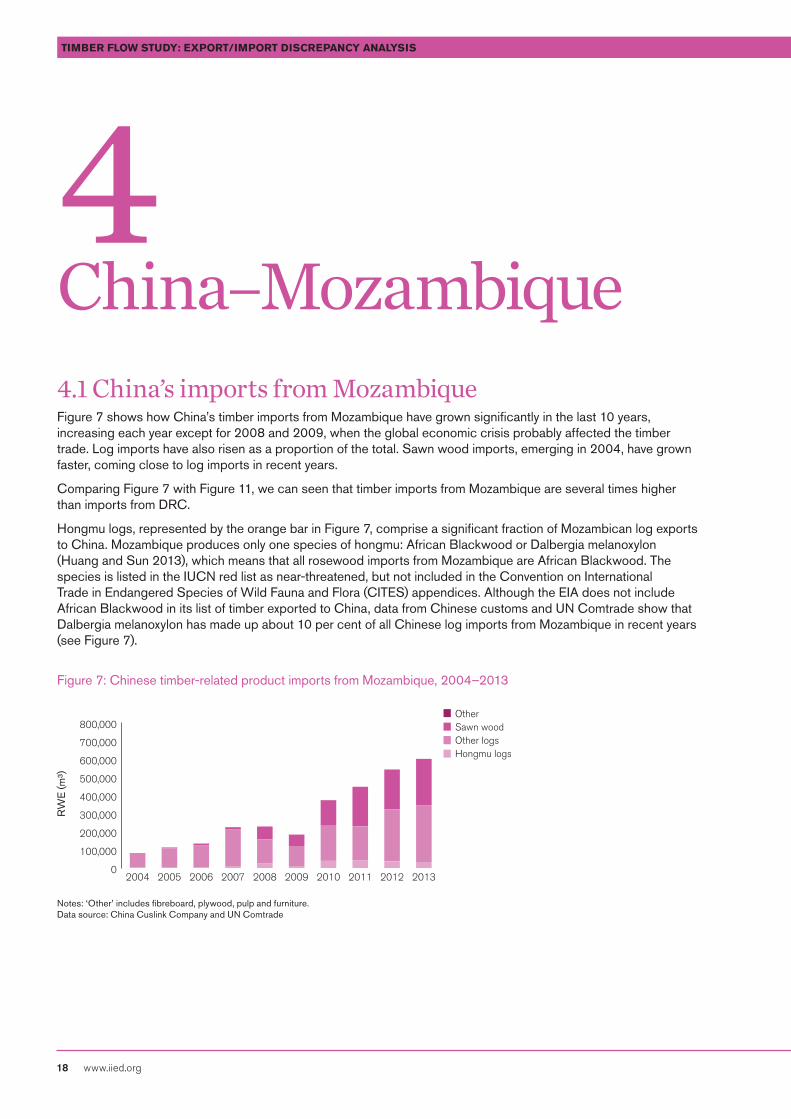
4 China–Mozambique 4.1 China’s imports from MozambiqueFigure 7 shows how China’s timber imports from Mozambique have grown significantly in the last 10 years, increasing each year except for 2008 and 2009, when the global economic crisis probably affected the timber trade. Log imports have also risen as a proportion of the total. Sawn wood imports, emerging in 2004, have grown faster, coming close to log imports in recent years.
Comparing Figure 7 with Figure 11, we can seen that timber imports from Mozambique are several times higher than imports from DRC.
Hongmu logs, represented by the orange bar in Figure 7, comprise a significant fraction of Mozambican log exports to China. Mozambique produces only one species of hongmu: African Blackwood or Dalbergia melanoxylon (Huang and Sun 2013), which means that all rosewood imports from Mozambique are African Blackwood. The species is listed in the IUCN red list as near-threatened, but not included in the Convention on International Trade in Endangered Species of Wild Fauna and Flora (CITES) appendices. Although the EIA does not include African Blackwood in its list of timber exported to China, data from Chinese customs and UN Comtrade show that Dalbergia melanoxylon has made up about 10 per cent of all Chinese log imports from Mozambique in recent years (see Figure 7).
Figure 7: Chinese timber-related product imports from Mozambique, 2004–2013
0
100,000
200,000
300,000
400,000
500,000
600,000
700,000
800,000
2013201220112010200920082007200620052004
Sawn woodOther
Other logsHongmu logs
Notes: ‘Other’ includes fibreboard, plywood, pulp and furniture.Data source: China Cuslink Company and UN Comtrade
RW
E (m
³)
IIED WORKING PAPER
www.iied.org 19
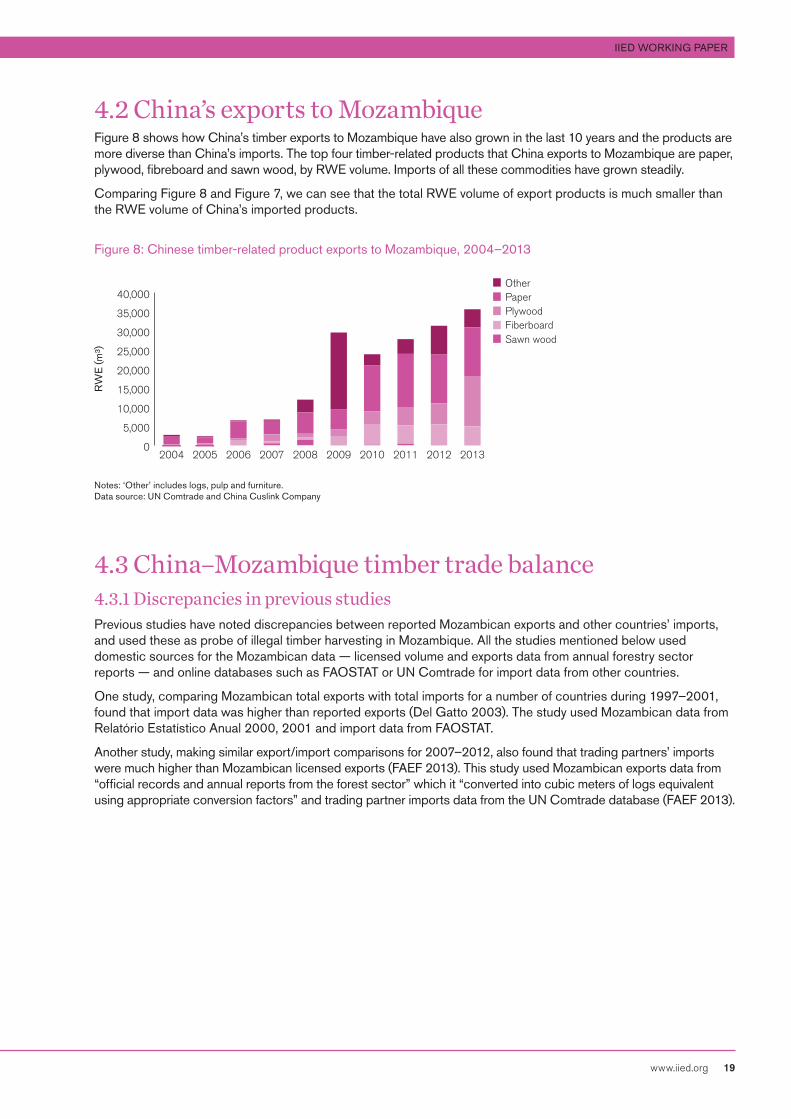
4.2 China’s exports to MozambiqueFigure 8 shows how China’s timber exports to Mozambique have also grown in the last 10 years and the products are more diverse than China’s imports. The top four timber-related products that China exports to Mozambique are paper, plywood, fibreboard and sawn wood, by RWE volume. Imports of all these commodities have grown steadily.
Comparing Figure 8 and Figure 7, we can see that the total RWE volume of export products is much smaller than the RWE volume of China’s imported products.
Figure 8: Chinese timber-related product exports to Mozambique, 2004–2013
0
5,000
10,000
15,000
20,000
25,000
30,000
35,000
40,000
2013201220112010200920082007200620052004
PaperOther
PlywoodFiberboardSawn wood
Notes: ‘Other’ includes logs, pulp and furniture.Data source: UN Comtrade and China Cuslink Company
4.3 China–Mozambique timber trade balance4.3.1 Discrepancies in previous studiesPrevious studies have noted discrepancies between reported Mozambican exports and other countries’ imports, and used these as probe of illegal timber harvesting in Mozambique. All the studies mentioned below used domestic sources for the Mozambican data — licensed volume and exports data from annual forestry sector reports — and online databases such as FAOSTAT or UN Comtrade for import data from other countries.
One study, comparing Mozambican total exports with total imports for a number of countries during 1997–2001, found that import data was higher than reported exports (Del Gatto 2003). The study used Mozambican data from Relatório Estatístico Anual 2000, 2001 and import data from FAOSTAT.
Another study, making similar export/import comparisons for 2007–2012, also found that trading partners’ imports were much higher than Mozambican licensed exports (FAEF 2013). This study used Mozambican exports data from “official records and annual reports from the forest sector” which it “converted into cubic meters of logs equivalent using appropriate conversion factors” and trading partner imports data from the UN Comtrade database (FAEF 2013).
RW
E (m
³)
TIMBER FLOW STUDY: EXPORT/IMPORT DISCREPANCY ANALYSIS
20 www.iied.org
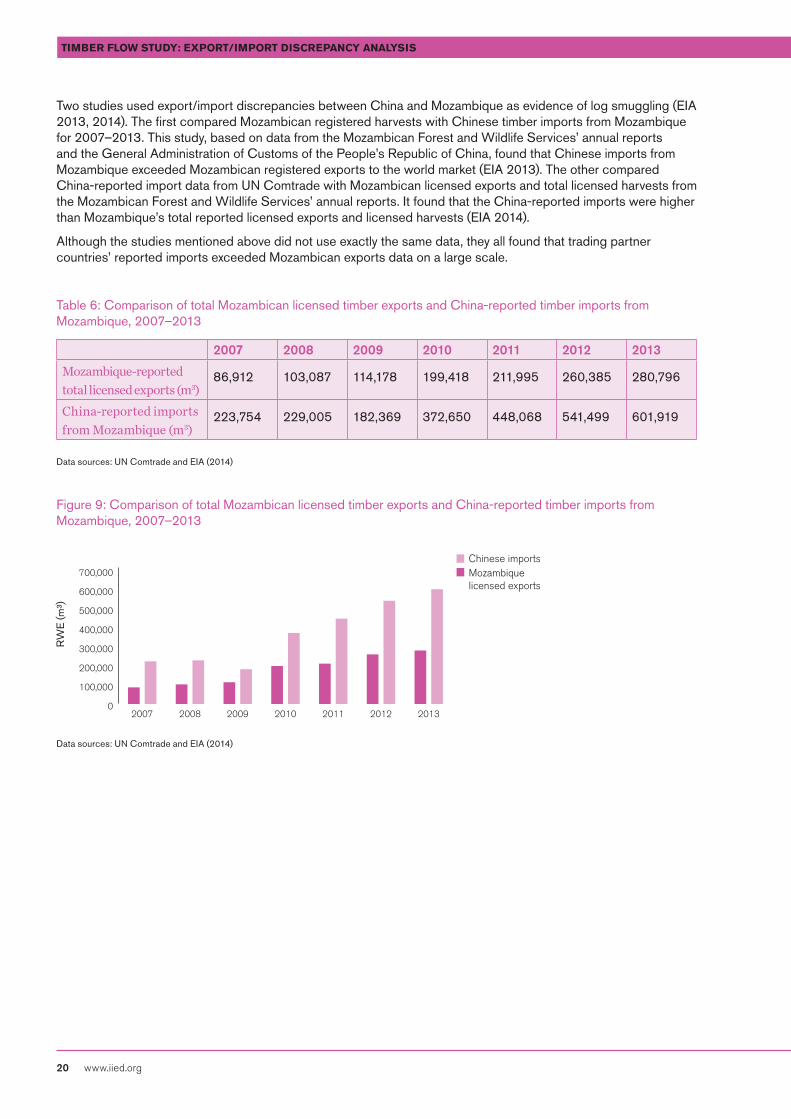
Two studies used export/import discrepancies between China and Mozambique as evidence of log smuggling (EIA 2013, 2014). The first compared Mozambican registered harvests with Chinese timber imports from Mozambique for 2007–2013. This study, based on data from the Mozambican Forest and Wildlife Services’ annual reports and the General Administration of Customs of the People’s Republic of China, found that Chinese imports from Mozambique exceeded Mozambican registered exports to the world market (EIA 2013). The other compared China-reported import data from UN Comtrade with Mozambican licensed exports and total licensed harvests from the Mozambican Forest and Wildlife Services’ annual reports. It found that the China-reported imports were higher than Mozambique’s total reported licensed exports and licensed harvests (EIA 2014).
Although the studies mentioned above did not use exactly the same data, they all found that trading partner countries’ reported imports exceeded Mozambican exports data on a large scale.
Table 6: Comparison of total Mozambican licensed timber exports and China-reported timber imports from Mozambique, 2007–2013
2007 2008 2009 2010 2011 2012 2013
Mozambique-reported total licensed exports (m3)
86,912 103,087 114,178 199,418 211,995 260,385 280,796
China-reported imports from Mozambique (m3)
223,754 229,005 182,369 372,650 448,068 541,499 601,919
Data sources: UN Comtrade and EIA (2014)
Figure 9: Comparison of total Mozambican licensed timber exports and China-reported timber imports from Mozambique, 2007–2013
0
100,000
200,000
300,000
400,000
500,000
600,000
700,000
2013201220112010200920082007
Chinese importsMozambique licensed exports
Data sources: UN Comtrade and EIA (2014)
RW
E (m
³)
IIED WORKING PAPER
www.iied.org 21
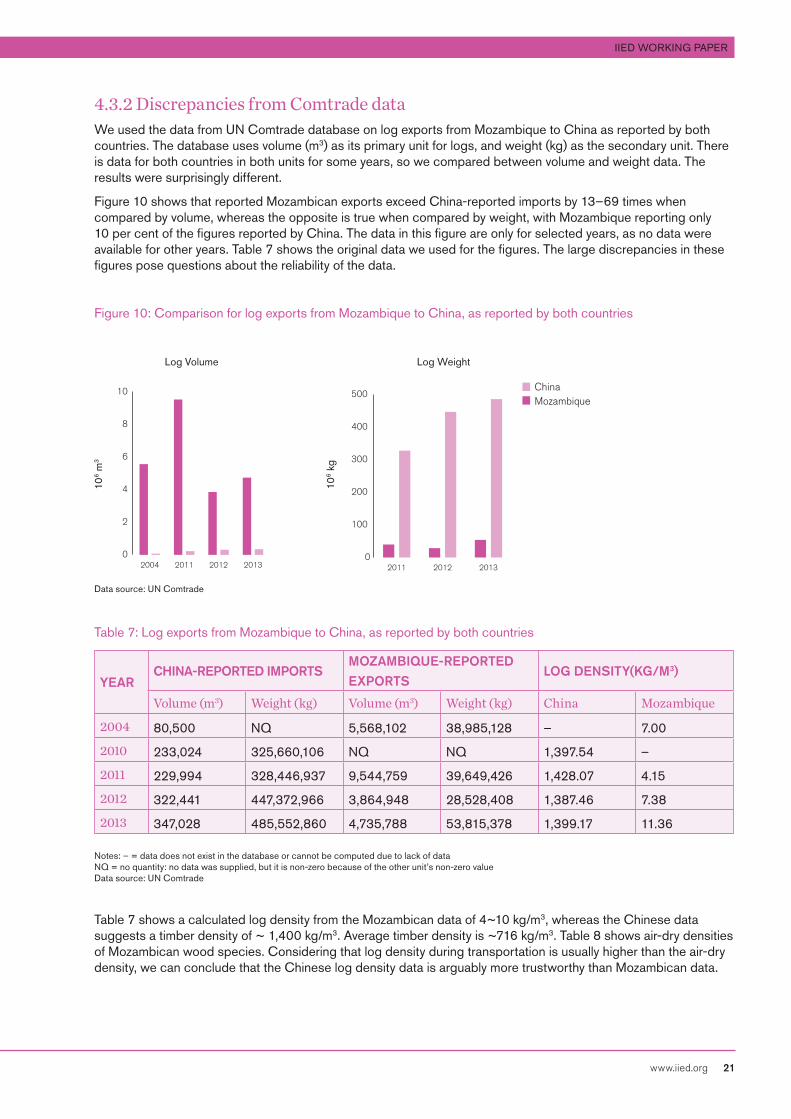
4.3.2 Discrepancies from Comtrade dataWe used the data from UN Comtrade database on log exports from Mozambique to China as reported by both countries. The database uses volume (m3) as its primary unit for logs, and weight (kg) as the secondary unit. There is data for both countries in both units for some years, so we compared between volume and weight data. The results were surprisingly different.
Figure 10 shows that reported Mozambican exports exceed China-reported imports by 13–69 times when compared by volume, whereas the opposite is true when compared by weight, with Mozambique reporting only 10 per cent of the figures reported by China. The data in this figure are only for selected years, as no data were available for other years. Table 7 shows the original data we used for the figures. The large discrepancies in these figures pose questions about the reliability of the data.
Figure 10: Comparison for log exports from Mozambique to China, as reported by both countries
ChinaMozambique
0
2
4
6
8
10
20132012201120040
100
200
300
400
500
201320122011
ChinaMozambique
0
2
4
6
8
10
20132012201120040
100
200
300
400
500
201320122011
Data source: UN Comtrade
Table 7: Log exports from Mozambique to China, as reported by both countries
YEARCHINA-REPORTED IMPORTS
MOZAMBIQUE-REPORTED
EXPORTSLOG DENSITY(KG/M3)
Volume (m3) Weight (kg) Volume (m3) Weight (kg) China Mozambique
2004 80,500 NQ 5,568,102 38,985,128 – 7.00
2010 233,024 325,660,106 NQ NQ 1,397.54 –
2011 229,994 328,446,937 9,544,759 39,649,426 1,428.07 4.15
2012 322,441 447,372,966 3,864,948 28,528,408 1,387.46 7.38
2013 347,028 485,552,860 4,735,788 53,815,378 1,399.17 11.36 Notes: – = data does not exist in the database or cannot be computed due to lack of data NQ = no quantity: no data was supplied, but it is non-zero because of the other unit’s non-zero value Data source: UN Comtrade
Table 7 shows a calculated log density from the Mozambican data of 4~10 kg/m3, whereas the Chinese data suggests a timber density of ~ 1,400 kg/m3. Average timber density is ~716 kg/m3. Table 8 shows air-dry densities of Mozambican wood species. Considering that log density during transportation is usually higher than the air-dry density, we can conclude that the Chinese log density data is arguably more trustworthy than Mozambican data.
106
m3
106
kg
Log WeightLog Volume
TIMBER FLOW STUDY: EXPORT/IMPORT DISCREPANCY ANALYSIS
22 www.iied.org
Table 8: Wood density of species that Mozambique typically exports to China
BOTANICAL NAME COMMON NAME OTHER NAME COUNTRY OF ORIGIN DENSITY
(kg/m3) 229,994 328,446,937 9,544,759 39,649,426
Afzelia quanzensis chanfuta – Mozambique 775
Combretum imberbe monzo mondzo Mozambique 1,229
Dalbergia melanoxylon blackwood mpingo Mozambique, Zambia 1,280
Millettia stuhlmannii panga panga jambirre Mozambique, Tanzania 848
Pterocarpus angolensis kiaat umbila Mozambique, Tanzania, Zambia 642
Swartzia madagascarensis pau ferro – Mozambique, Tanzania 1,024 Data source: www.protea-timbers.co.za/density.htm
Tables 9 and 10 show reported export/import figures for Mozambique’s timber trade with Japan and Portugal. As with China, we found that in both cases Mozambique’s reported volume is usually higher and the weight is much lower, where data exists for comparison. We also calculated log density and included these in the table. As with China, log densities calculated from Mozambican data are much lower than average wood density. These findings suggest that the data discrepancies arise because of problems with Mozambican data.
Table 9: Mozambican log exports to Japan, as reported by both countries
YEARMOZAMBIQUE EXPORTS JAPAN IMPORTS LOG DENSITY (KG/M3)
m3 kg m3 kg By Mozambique By Japan
2003 32,549 NQ 39 29,250 NQ 750.00
2004 119 NQ 271 203,250 NQ 750.00
2005 NQ 126,000 421 978,183 NQ 2,323.48
2011 13,934 627 15 48,984 0.04 3,265.60
2012 9,558 95,240 103 NQ 9.96 NQ
2013 18 30,000 54 NQ 1,666.67 NQ Notes: – = data does not exist in the database or cannot be computed due to lack of data NQ = no quantity: no data was supplied, but it is non-zero because of the other unit’s non-zero value Data source: UN Comtrade
Table 10: Mozambican log exports to Portugal, as reported by both countries
YEARMOZAMBIQUE EXPORTS PORTUGAL IMPORTS LOG DENSITY (KG/M3)
m3 kg m3 kg Mozambique Portugal
2003 NQ NQ 45 79,200 – 1,760.0
2004 20,042 21,790 20 20,790 1.1 1,039.5
2006 – – 21 20,000 – 952.4
2008 NQ NQ 32 18,000 – 562.5
2011 273 1,350 NQ NQ 4.9 Notes: – = data does not exist in the database or can not be computed due to lack of data NQ = no quantity: no data was supplied, but it is non-zero because of the other unit’s non-zero value Data source: UN Comtrade

IIED WORKING PAPER
www.iied.org 23
One potential explanation for the high volume and low weight in Mozambican data is tax avoidance, but taxes are collected in Mozambique based on timber volume, not weight (EIA 2014). The Mozambican data on UN Comtrade seems to over-report timber volume, which would lead to higher taxes. Quotas allocated to concessioners by Mozambican government are also measured in volume, not weight, so over-reporting timber volumes does not save logging quotas for concessioners, either. As over-reporting export volumes favours neither the timber concessioners nor the exporters, the abnormally large volume data remains a mystery.
4.3.3 Discrepancy analysisWe have shown that comparisons using Comtrade data are flawed due to the unreliability of Mozambican export data.
Interpretations of trade discrepancies are never straightforward, and many factors can result in persistent discrepancies. These include unit and conversion issues, log scaling methods, HS code classification, under-invoicing and smuggling.
Long-term discrepancies over many years may appear to be suspicious, but ruling out the first three factors will require several cases of tracing timber products from Mozambique to China while keeping records of its announced amount. This would require negotiation.
Several previous studies compared Chinese imports with Mozambique’s exports, according to the from annual reports from the forestry sector. Although they all found that Chinese imports exceeded Mozambican exports, they interpreted the discrepancies in different ways. The studies all used slightly different data and made comparisons over different periods, but they all found that Mozambican exports were lower than either total world imports or Chinese imports from Mozambique.
Recognising that many factors may contribute to trade discrepancies, one study believed the discrepancy offers compensate proof of illegal trade and illegal timber production studies already carried out in Mozambique (Del Gatto 2003). Another also recommended caution in interpreting reasons for such discrepancies, suggesting they could be due to reporting problems (FAEF 2013). The EIA reports (2013, 2014) were the most assertive in connecting discrepancies with log smuggling. Although the EIA conclusions may seem bold, they do present consistent discrepancies observed over a long term, which suggest undocumented trade.
TIMBER FLOW STUDY: EXPORT/IMPORT DISCREPANCY ANALYSIS
24 www.iied.org
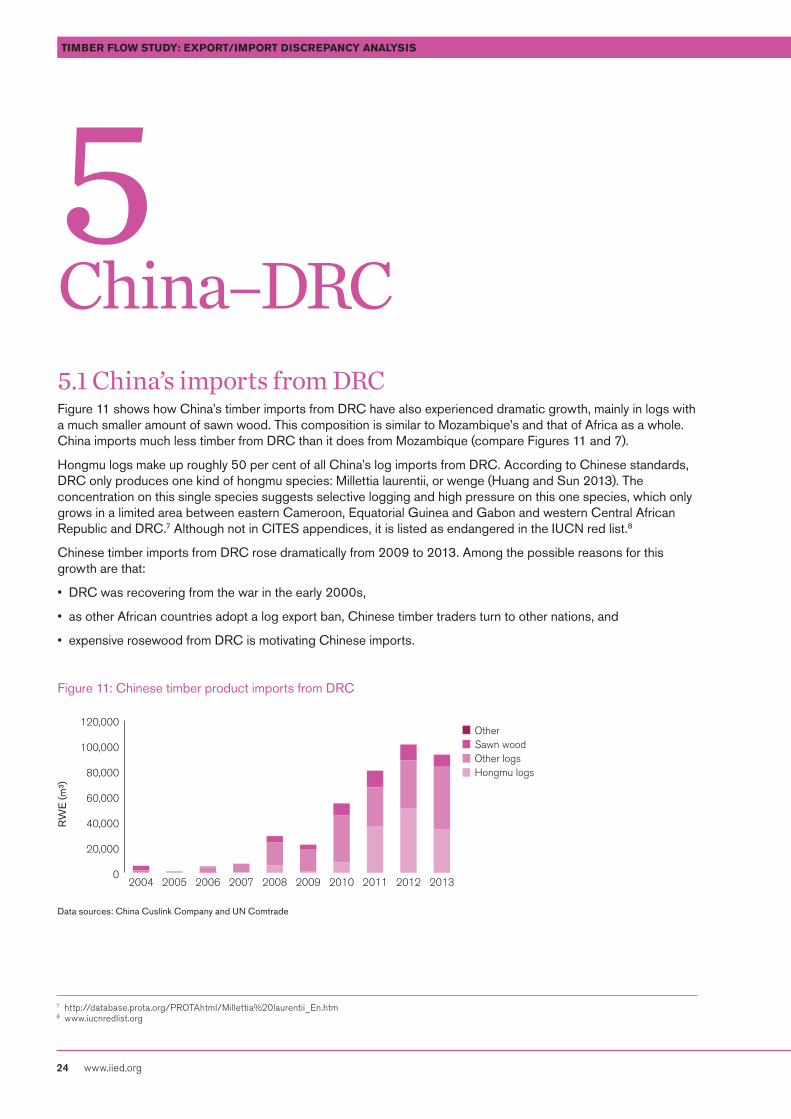
5 China–DRC 5.1 China’s imports from DRCFigure 11 shows how China’s timber imports from DRC have also experienced dramatic growth, mainly in logs with a much smaller amount of sawn wood. This composition is similar to Mozambique’s and that of Africa as a whole. China imports much less timber from DRC than it does from Mozambique (compare Figures 11 and 7).
Hongmu logs make up roughly 50 per cent of all China’s log imports from DRC. According to Chinese standards, DRC only produces one kind of hongmu species: Millettia laurentii, or wenge (Huang and Sun 2013). The concentration on this single species suggests selective logging and high pressure on this one species, which only grows in a limited area between eastern Cameroon, Equatorial Guinea and Gabon and western Central African Republic and DRC.7 Although not in CITES appendices, it is listed as endangered in the IUCN red list.8
Chinese timber imports from DRC rose dramatically from 2009 to 2013. Among the possible reasons for this growth are that:
• DRC was recovering from the war in the early 2000s,
• as other African countries adopt a log export ban, Chinese timber traders turn to other nations, and
• expensive rosewood from DRC is motivating Chinese imports.
Figure 11: Chinese timber product imports from DRC
0
20,000
40,000
60,000
80,000
100,000
120,000
2013201220112010200920082007200620052004
Sawn woodOther
Other logsHongmu logs
Data sources: China Cuslink Company and UN Comtrade
7 http://database.prota.org/PROTAhtml/Millettia%20laurentii_En.htm 8 www.iucnredlist.org
RW
E (m
³)
IIED WORKING PAPER
www.iied.org 25
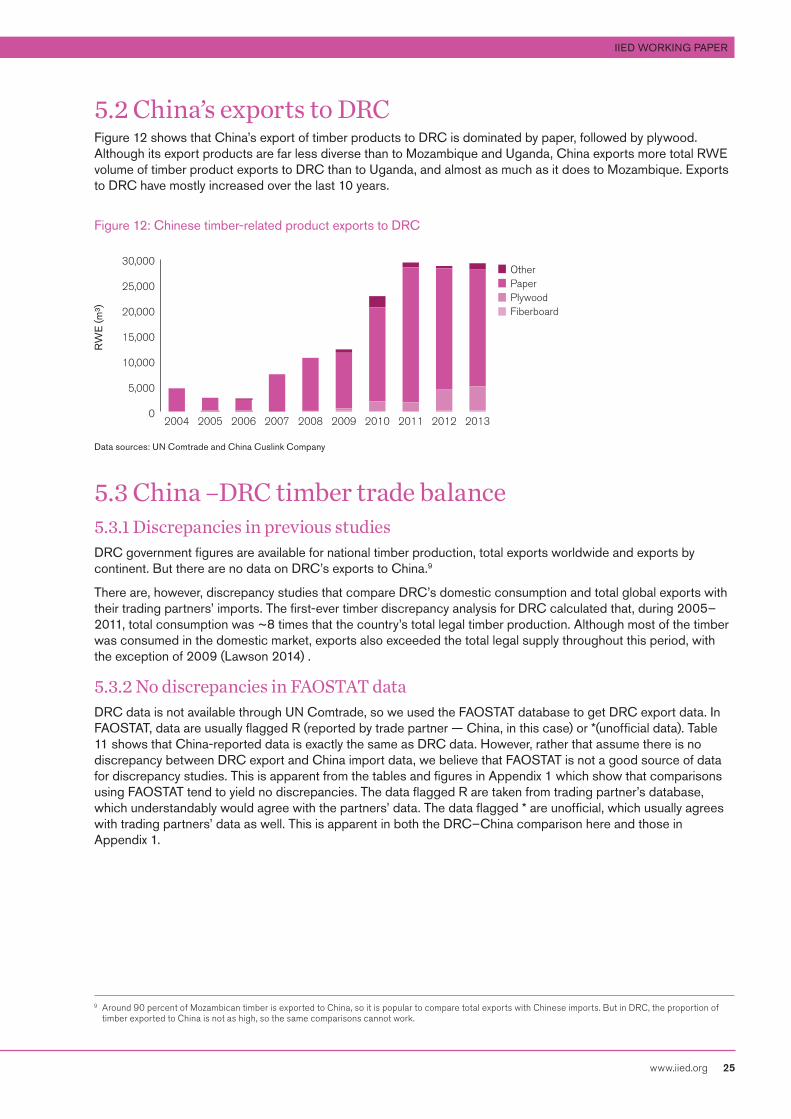
5.2 China’s exports to DRCFigure 12 shows that China’s export of timber products to DRC is dominated by paper, followed by plywood. Although its export products are far less diverse than to Mozambique and Uganda, China exports more total RWE volume of timber product exports to DRC than to Uganda, and almost as much as it does to Mozambique. Exports to DRC have mostly increased over the last 10 years.
Figure 12: Chinese timber-related product exports to DRC
0
5,000
10,000
15,000
20,000
25,000
30,000
2013201220112010200920082007200620052004
PaperOther
PlywoodFiberboard
Data sources: UN Comtrade and China Cuslink Company
5.3 China –DRC timber trade balance5.3.1 Discrepancies in previous studiesDRC government figures are available for national timber production, total exports worldwide and exports by continent. But there are no data on DRC’s exports to China.9
There are, however, discrepancy studies that compare DRC’s domestic consumption and total global exports with their trading partners’ imports. The first-ever timber discrepancy analysis for DRC calculated that, during 2005–2011, total consumption was ~8 times that the country’s total legal timber production. Although most of the timber was consumed in the domestic market, exports also exceeded the total legal supply throughout this period, with the exception of 2009 (Lawson 2014) .
5.3.2 No discrepancies in FAOSTAT dataDRC data is not available through UN Comtrade, so we used the FAOSTAT database to get DRC export data. In FAOSTAT, data are usually flagged R (reported by trade partner — China, in this case) or *(unofficial data). Table 11 shows that China-reported data is exactly the same as DRC data. However, rather that assume there is no discrepancy between DRC export and China import data, we believe that FAOSTAT is not a good source of data for discrepancy studies. This is apparent from the tables and figures in Appendix 1 which show that comparisons using FAOSTAT tend to yield no discrepancies. The data flagged R are taken from trading partner’s database, which understandably would agree with the partners’ data. The data flagged * are unofficial, which usually agrees with trading partners’ data as well. This is apparent in both the DRC–China comparison here and those in Appendix 1.
9 Around 90 percent of Mozambican timber is exported to China, so it is popular to compare total exports with Chinese imports. But in DRC, the proportion of timber exported to China is not as high, so the same comparisons cannot work.
RW
E (m
³)
TIMBER FLOW STUDY: EXPORT/IMPORT DISCREPANCY ANALYSIS
26 www.iied.org
Table 11: Log exports from DRC to China, 1999–2012
YEARDRC EXPORTS TO CHINA CHINA IMPORTS FROM DRC
Volume (m3) Flag Volume (m3)
1999 69 R 69
2000 0 - 0
2001 134 R 134
2002 1,090 R 1,090
2003 510 R 510
2004 1,596 R 1,596
2005 1,303 R 1,303
2006 0 - 0
2007 3,000 * 3,000
2008 7,000 * 7,000
2009 6,750 * 6,652
2010 85,831 * 85,831
2011 78,158 * 78,158
2012 215,752 * 215,752 Data source: FAOSTAT database
5.3.3 Analysis using DRC domestic dataSince there is no official data from DRC accounting for the country’s timber exports to China, we could not make the comparison for China alone with DRC. We therefore compiled Asia imports from UN Comtrade, which we compared with DRC’s total exports to Asia.
Reported imports by all Asian countries exceeded DRC-reported exports for 2010 and 2011. According to the Asian countries, timber imports from DRC grew more than 10 times from 2009 to 2010, whereas DRC reported no growth in exports to Asia for the same period.
Table 12: Comparison of China and all Asian countries’ timber imports from DRC, 2005–2011
YEARCHINA IMPORTS
FROM DRC (0)
ASIA IMPORTS
FROM DRC (1)
DRC EXPORTS TO
ASIA (2)
DRC TOTAL
EXPORTS (3)
2005 1,081.8 3,676 9,780
2006 4,736 10,919 16,750 471,604
2007 7,084 14,836 35,021 479,645
2008 28,820 45,156 50,128 449,983
2009 21,829 35,821 46,207 330,401
2010 54,351 420,031 46,207 367,679
2011 80,046 425,707 111,938 403,400 Note: Timber products are logs and sawn wood; figures are in RWE (m3)Data sources: 0 UN Comtrade1 UNComtrade data (sum of all Asian countries reported imports from DRC)2 de Wasseige et al. (2010) 3 de Wasseige et al. (2010)
IIED WORKING PAPER
www.iied.org 27
5.3.4 DRC analysisBecause DRC’s data are unavailable through UN Comtrade, we were only able to compare exports and imports using FAOSTAT data, which showed no discrepancies. We have found that FAOSTAT is not a good database for discrepancy studies. The comparisons in Appendix 1 for Mozambique, Cameroon and Uganda using FAOSTAT data all show either less discrepancy than those using UN Comtrade data or no discrepancy at all. The FAOSTAT data from these four countries are almost always flagged with R (trading partner data) or * (unofficial).
The DRC export data we could obtain (de Wasseige et al. 2010, Lawson 2014 ) were for total exports to the global market or to Asia, so we could not make direct comparisons between DRC export data to China and Chinese import data from DRC. Instead, we compared China-reported imports with aggregate imports to all Asian countries and DRC exports to all Asian countries. We found that reported Asian imports from DRC exceeded DRC-reported exports for 2010 and 2011; in fact, reported Chinese imports alone exceeded DRC’s total reported exports to all Asian countries.
Illegal logging in DRC is reported to still be rife (Lawson 2014). Our discrepancy study could not make direct DRC–China comparisons, and found that China-reported imports exceeded DRC’s exports to Asia market in one year only. Although this discrepancy suggests that DRC’s timber exports to China appear suspicious, we do not feel that our comparisons provide enough direct evidence of illegal logging.
DRC is in the EU’s VPA process. With its export market shifting towards China, ensuring of the legality of the emerging market becomes more important.
TIMBER FLOW STUDY: EXPORT/IMPORT DISCREPANCY ANALYSIS
28 www.iied.org
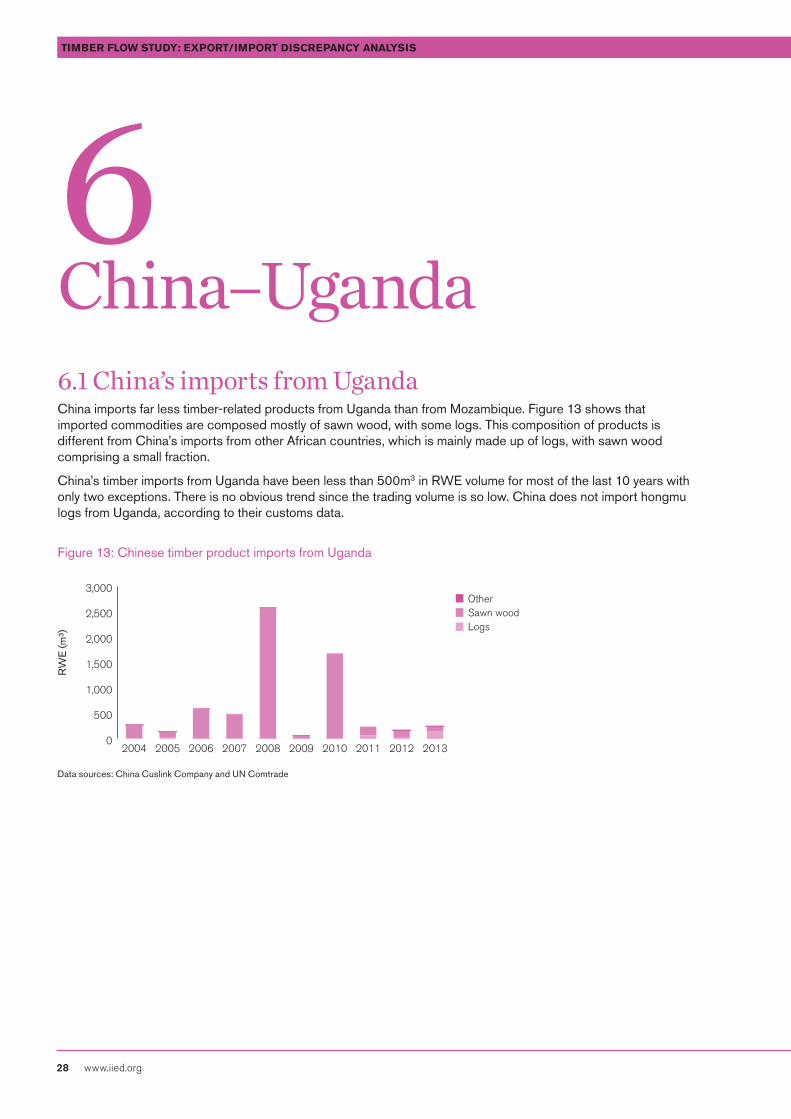
6 China–Uganda6.1 China’s imports from UgandaChina imports far less timber-related products from Uganda than from Mozambique. Figure 13 shows that imported commodities are composed mostly of sawn wood, with some logs. This composition of products is different from China’s imports from other African countries, which is mainly made up of logs, with sawn wood comprising a small fraction.
China’s timber imports from Uganda have been less than 500m3 in RWE volume for most of the last 10 years with only two exceptions. There is no obvious trend since the trading volume is so low. China does not import hongmu logs from Uganda, according to their customs data.
Figure 13: Chinese timber product imports from Uganda
0
500
1,000
1,500
2,000
2,500
3,000
2013201220112010200920082007200620052004
OtherSawn woodLogs
Data sources: China Cuslink Company and UN Comtrade
RW
E (m
³)
IIED WORKING PAPER
www.iied.org 29
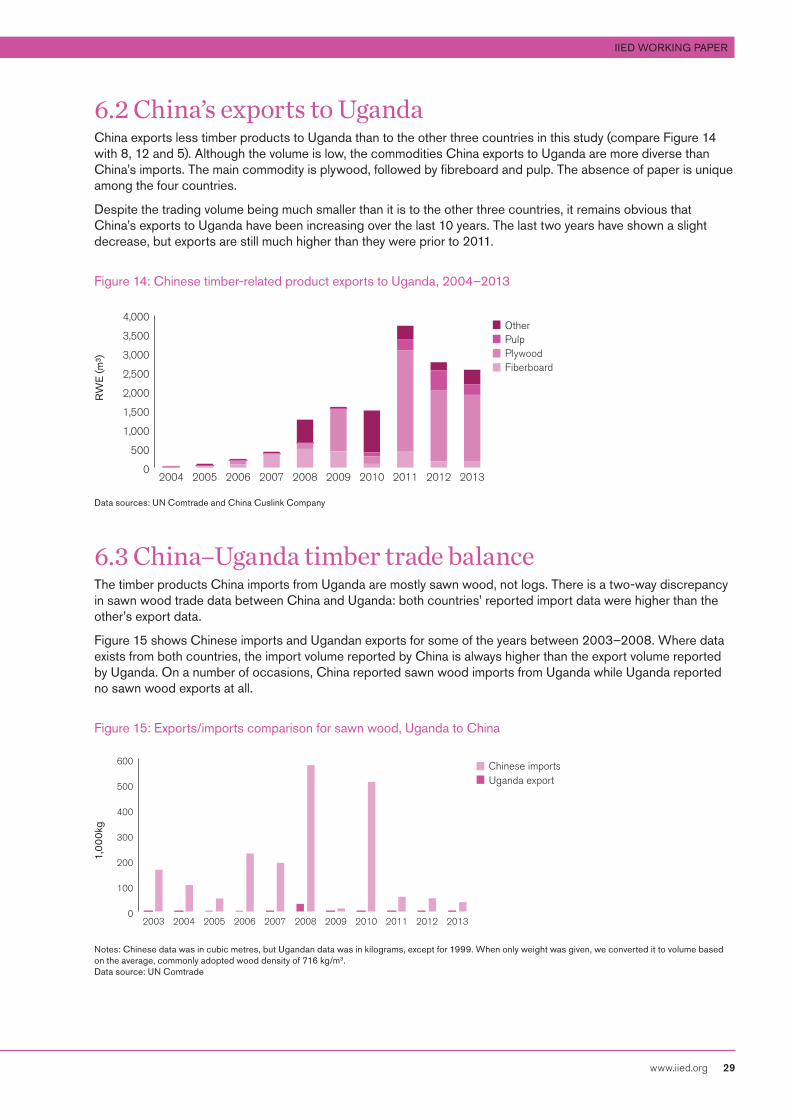
6.2 China’s exports to UgandaChina exports less timber products to Uganda than to the other three countries in this study (compare Figure 14 with 8, 12 and 5). Although the volume is low, the commodities China exports to Uganda are more diverse than China’s imports. The main commodity is plywood, followed by fibreboard and pulp. The absence of paper is unique among the four countries.
Despite the trading volume being much smaller than it is to the other three countries, it remains obvious that China’s exports to Uganda have been increasing over the last 10 years. The last two years have shown a slight decrease, but exports are still much higher than they were prior to 2011.
Figure 14: Chinese timber-related product exports to Uganda, 2004–2013
0
500
1,000
1,500
2,000
2,500
3,000
3,500
4,000
2013201220112010200920082007200620052004
PulpOther
PlywoodFiberboard
Data sources: UN Comtrade and China Cuslink Company
6.3 China–Uganda timber trade balanceThe timber products China imports from Uganda are mostly sawn wood, not logs. There is a two-way discrepancy in sawn wood trade data between China and Uganda: both countries’ reported import data were higher than the other’s export data.
Figure 15 shows Chinese imports and Ugandan exports for some of the years between 2003–2008. Where data exists from both countries, the import volume reported by China is always higher than the export volume reported by Uganda. On a number of occasions, China reported sawn wood imports from Uganda while Uganda reported no sawn wood exports at all.
Figure 15: Exports/imports comparison for sawn wood, Uganda to China
0
100
200
300
400
500
600
20132012201120102009200820072006200520042003
Chinese importsUganda export
Notes: Chinese data was in cubic metres, but Ugandan data was in kilograms, except for 1999. When only weight was given, we converted it to volume based on the average, commonly adopted wood density of 716 kg/m3.Data source: UN Comtrade
RW
E (m
³)1,
00
0kg
TIMBER FLOW STUDY: EXPORT/IMPORT DISCREPANCY ANALYSIS
30 www.iied.org
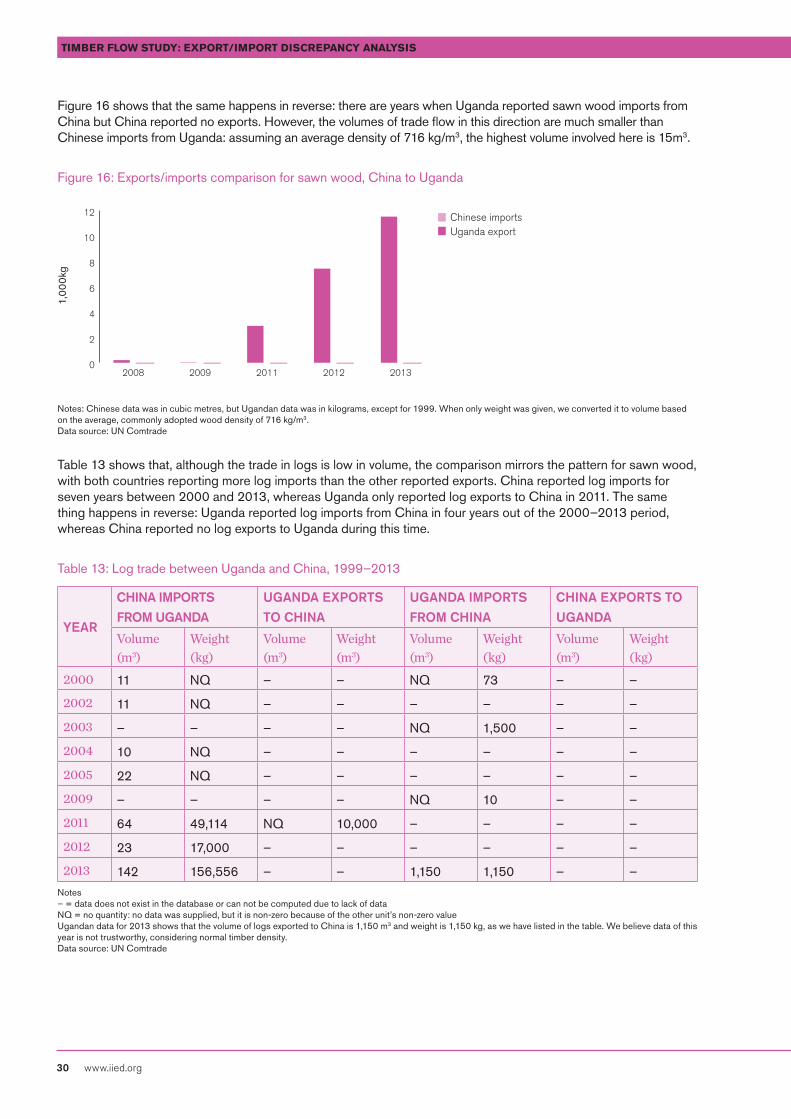
Figure 16 shows that the same happens in reverse: there are years when Uganda reported sawn wood imports from China but China reported no exports. However, the volumes of trade flow in this direction are much smaller than Chinese imports from Uganda: assuming an average density of 716 kg/m3, the highest volume involved here is 15m3.
Figure 16: Exports/imports comparison for sawn wood, China to Uganda
0
2
4
6
8
10
12
20132012201120092008
Chinese importsUganda export
Notes: Chinese data was in cubic metres, but Ugandan data was in kilograms, except for 1999. When only weight was given, we converted it to volume based on the average, commonly adopted wood density of 716 kg/m3.Data source: UN Comtrade
Table 13 shows that, although the trade in logs is low in volume, the comparison mirrors the pattern for sawn wood, with both countries reporting more log imports than the other reported exports. China reported log imports for seven years between 2000 and 2013, whereas Uganda only reported log exports to China in 2011. The same thing happens in reverse: Uganda reported log imports from China in four years out of the 2000–2013 period, whereas China reported no log exports to Uganda during this time.
Table 13: Log trade between Uganda and China, 1999–2013
YEAR
CHINA IMPORTS
FROM UGANDA
UGANDA EXPORTS
TO CHINA
UGANDA IMPORTS
FROM CHINA
CHINA EXPORTS TO
UGANDA
Volume (m3)
Weight (kg)
Volume (m3)
Weight (m3)
Volume (m3)
Weight (kg)
Volume (m3)
Weight (kg)
2000 11 NQ – – NQ 73 – –
2002 11 NQ – – – – – –
2003 – – – – NQ 1,500 – –
2004 10 NQ – – – – – –
2005 22 NQ – – – – – –
2009 – – – – NQ 10 – –
2011 64 49,114 NQ 10,000 – – – –
2012 23 17,000 – – – – – –
2013 142 156,556 – – 1,150 1,150 – –Notes – = data does not exist in the database or can not be computed due to lack of data NQ = no quantity: no data was supplied, but it is non-zero because of the other unit’s non-zero value Ugandan data for 2013 shows that the volume of logs exported to China is 1,150 m3 and weight is 1,150 kg, as we have listed in the table. We believe data of this year is not trustworthy, considering normal timber density. Data source: UN Comtrade
1,0
00
kg

IIED WORKING PAPER
www.iied.org 31
6.3.1 Discrepancy analysisThe volume of China’s timber trade with Uganda is lower than its trade with the other three countries, and its imports from Uganda are mostly sawn wood, not logs.
Our export/import comparisons using Comtrade data found that exports from both countries tend to be lower than the imports reported by the other: China reported higher imports of sawn wood than Uganda’s reported exports; whereas Uganda’s reported exports has no corresponding export reports from China. Most reported Chinese log imports had no corresponding Ugandan export reports, and vice versa.
Comparisons using FAOSTAT data showed similar trends to Mozambique and China, which only showed matched exports and imports.
It is hard to say whether we observed discrepancies in the case of Uganda. Although the scale of timber trading is much smaller than for the other three countries, fluctuations could also have a bigger effect on smaller numbers.
TIMBER FLOW STUDY: EXPORT/IMPORT DISCREPANCY ANALYSIS
32 www.iied.org
7 Conclusions and implications7.1 Findings on China–Africa timber trade basics and trade balance studyAlthough Chinese imported timber products from Africa are mainly logs, as China’s timber imports increase, sawn wood imports are increasing fastest — seven-fold whereas logs increased by only ~50 per cent in the last nine years. This might mean that African countries enjoy a higher value addition as more countries implement log export bans.
Chinese timber exports to Africa mostly consist of fibreboard and plywood, which has increased by nine-fold in the last nine years. That some exporting companies are also construction companies confirms that a proportion of these exports are from Chinese companies taking on projects in Africa.
Statistically, Cameroon is the second-largest timber source country exporting to China (accumulated from 2011¬–2013). But at the same time, Cameroon is famous as a timber transit country. China’s imports from Cameroon mostly consist of logs and sawn wood. Imports experienced a slight drop in the early 2000s, rising to exceed imports for 2000 in 2010. This drop coincides with a smaller trade discrepancy between China and Cameroon, which also coincides with improvements in timber legality in Cameroon. We believe that this trend indicates that Chinese imports from Cameroon have been increasingly sourced from licensed sources since the early 2000s.
Accumulating from 2011 to 2013, Mozambique is Africa’s fourth-largest timber exporting country to China. China’s imports from Mozambique, mostly logs and sawn wood, increased by ~7 times in the last 10 years. Sawn timber has risen from almost nothing to about half the RWE volume of total imports, which is encouraging.
However, about 10 per cent of Chinese log imports from Mozambique in recent years has been made up of Dalbergia melanoxylon, a near-threatened species on the IUCN red list. Our efforts to identify discrepancies in the reported log trade from both countries have been hindered by untrustworthy Mozambican data. However, previous timber discrepancy studies for the China–Mozambique timber trade using Mozambican total licensed export data from Forestry Sector annual reports showed a long-standing large discrepancy, which points to log smuggling.
China–DRC timber trade has enjoyed a fast growth from virtually nothing in the early 2000s to being among the top 10 African countries exporting timber to the Chinese market. About 30–50 per cent of log imports from DRC to China in the last three years consist of a single species, Millettia laurentii, also listed as endangered in the IUCN red list. Because UN Comtrade data is unavailable, we studied China–DRC timber trade discrepancies using data from the FAOSTAT database. The comparison results show mostly no discrepancies, but we believe this comparison is not reliable: FAOSTAT data for DRC are flagged as either unofficial or taken from the trading partner’s data, in this case, Chinese data. To compare, we checked DRC domestic data on exports to the world and regional markets. These data show that the total Asian countries’ imports from DRC exceeded DRC’s reported timber exports to Asia in 2010 and 2011. China’s imports alone exceeded DRC’s exports to all of Asia in 2010.
IIED WORKING PAPER
www.iied.org 33
Such sporadic discrepancy is not enough evidence to suggest anything, but partner countries’ imports have long exceeded DRC’s total exports figures (Lawson 2014), which suggest that the illegal timber trade is rife in DRC.
The trade volume of Chinese timber-product imports from Uganda is much lower than the volume of imports from the other three countries. The commodity was mostly sawn wood rather than logs, which usually dominates Chinese imports. Comparing Chinese and Ugandan import/export data, we found that neither country reported their log exports to the other, whereas both reported the import of logs from the other. However, there are complex reasons for trade discrepancies, and this may only indicate illegal trade when it persists and takes place on a large scale. Because of this two-way discrepancy, we do not attempt to conclude that we have found trade discrepancies.
Although we identified the top 10 Chinese companies involved in the timber product trade between China and Africa and China and each of the four countries in this study, such company information is not 100 per cent accurate. Smaller companies tend to import through agents or bigger companies, and do not appear on the list. We will therefore leave this particular analysis for the future, when we have a more accurate importing list from interviews.
7.2 China should be more involved in combating illegal timberThe EU and US play leading roles in sustainable development. EU timber regulations and the amended US Lacey Act, both prohibit illegally sourced timber. The EU FLEGT Action Plan Voluntary VPAs also encourage production countries’ efforts to regulate the timber industry. The regulations and VPSs work together to ensure the legal timner trade.
“When exporting countries enter into VPAs, they receive financing from the EU to implement modern systems to regulate forest practices, track forest products, and license their exports to the EU. The EU also generally gives these countries preferential access to EU markets that only allow the import of legal timber.” (Powers and Wong 2011)
As China imports more timber, it becomes increasingly important to incorporate China into efforts to tackle the illegal timber trade. Encouragingly, a 2014 study showed that China has made considerable progress in tackling illegal timber: it is developing a draft national timber legality verification system and a number of companies are also getting chain-of-custody certifications (Wellesley 2014). While there has been progress in this area, our study found evidence of illegalities in the timber trade between China and certain countries. We believe that more efforts are needed to regulate the timber trade between China and Africa.
7.3 Implications for future workOur study met the following obstacles but we believe they are not insurmountable. We were unable to identify the real timber importer companies, as those listed were often middlemen and not the true importers. Data reliability issues and multiple factors that contribute to discrepancies also meant that our discrepancy analysis failed to reach a definitive conclusion.
To understand the illegal timber trade, we will need to source more reliable data and rule out other factors. Our options for this include taking data from the national African customs agencies or tracing particular cases of timber trade (if possible) to examine the legal factors that result in discrepancies.
Our study found that China’s imports from Mozambique, Cameroon and DRC are increasing dramatically, and the preference is for logs. Imports from Mozambique and DRC are heavily loaded with hongmu logs, which could lead to selective logging in the source country. Mozambique’s hongmu species, Dalbergia melanoxylon, is listed as near threatened on the IUCN red list, and the DRC’s Millettia laurentii species is listed as endangered. We recommend further research on these species and their legal logging situation, if they are to be protected.
We believe our study made some interesting progress about different databases with regards to the companies and the timber discrepancies analysis. But for this to progress further, we need to continue with this work and overcome the data reliability problems.
TIMBER FLOW STUDY: EXPORT/IMPORT DISCREPANCY ANALYSIS
34 www.iied.org
8 ReferencesBrunner, J, Talbott, K and Elkin, C (1998) Logging Burma’s frontier forests: resources and the regime. World Resources Institute, Washington, DC.
Chen, H K (2008) Lost in transit: export and import protocols as contributors to discrepancies in international timber trade data. TRAFFIC International, Cambridge, UK.
Contreras-Hermosilla, A, Doornbosch, R and Lodge, M (2007) The economics of illegal logging and associate trade. Background paper for the Round Table on Sustainable Development Discussion on Illegal Logging, 8–9 January 2007.
Contreras-Hermosilla, A and Global Witness (2003) Emerging best practices for combating illegal activities in the forest sector. EMBLAH-FEHCAFOR-NICAMBIENTAL-ODI-FAO-Global Witness.
de Wasseige C et al. (eds) (2010) The forests of the Congo Basin – state of the forest 2010
de Wasseige C et al. (eds) (2013) The forests of the Congo Basin – state of the forest 2013.
Del Gatto, F (2003) Forest law enforcement in Mozambique — an overview. DNFFB and FAO.
Ekman, S, Huang, W and Langa, E (2013) Chinese trade and investment in the Mozambican timber industry: a case study from Cabo Delgado province. Working Paper 122. CIFOR, Bogor, Indonesia.
EIA (2013) First class connections, log smuggling, illegal logging, and corruption in Mozambique. EIA, Washington, DC. See www.eia-international.org
EIA (2014) First class crisis, China’s criminal and unsustainable intervention in Mozambique’s Miombo forests. EIA, Washington, DC. See www.eia-international.org
FAEF (2013) Assessment of harvested volume and illegal logging in Mozambican natural forest. Faculty of Agronomy and Forestry Engineering, Eduardo Mondlane University.
German, L A and Wertz-Kanounnikoff, S (2012) Sino-Mozambican relations and their implications for forests: a preliminary assessment for the case of Mozambique. Working Paper 93. CIFOR, Bogor, Indonesia.
Hoare, A (2015) Illegal logging and related trade the response in Cameroon. Energy, environment and resources department research paper. Chatham House, London.
Huang, W and Sun, X (2013) Tropical hardwood flows in China: case studies of rosewood and okoumé. See www.forest-trends.org
Huang et al. (2013) Who is importing forest products from Africa to China? An analysis of implications for initiatives to enhance legality and sustainability. Environment, Development and Sustainability, volume 15, issue 2, 339–354
ITTO (3 November 2003) ITTO identifies causes of trade data discrepancies. News release.
Johnson, S (2002) Documenting the undocumented. ITTO Tropical Forest Update, vol 12, no 1, 6–9.
Lawson, S and Macfaul, L (2010) Illegal logging and related trade: indicators of the global response. Chatham House, London.
Lawson, S (2014) Illegal logging in the Democratic Republic of the Congo. Chatham House, London.

IIED WORKING PAPER
www.iied.org 35
Powers, W and Wong, A (2011) Fairly trade the world’s timber. World Policy Papers. World Policy Institute, New York.
Sun, X (2014) Forest products trade between China and Africa: an analysis of import and export statistics. Forest Trends Report Series. See www.forest-trends.org
Sun, X, Ren, P and Van Epp, M (2014) Chinese views of African forests: evidence and perception of China–Africa links that impact the governance of forests and livelihoods. Natural Resource. Issue no 29. IIED, London.
Wellesley, L (2014) Trade in illegal timber: the response in China. Research paper. Chatham House, London.
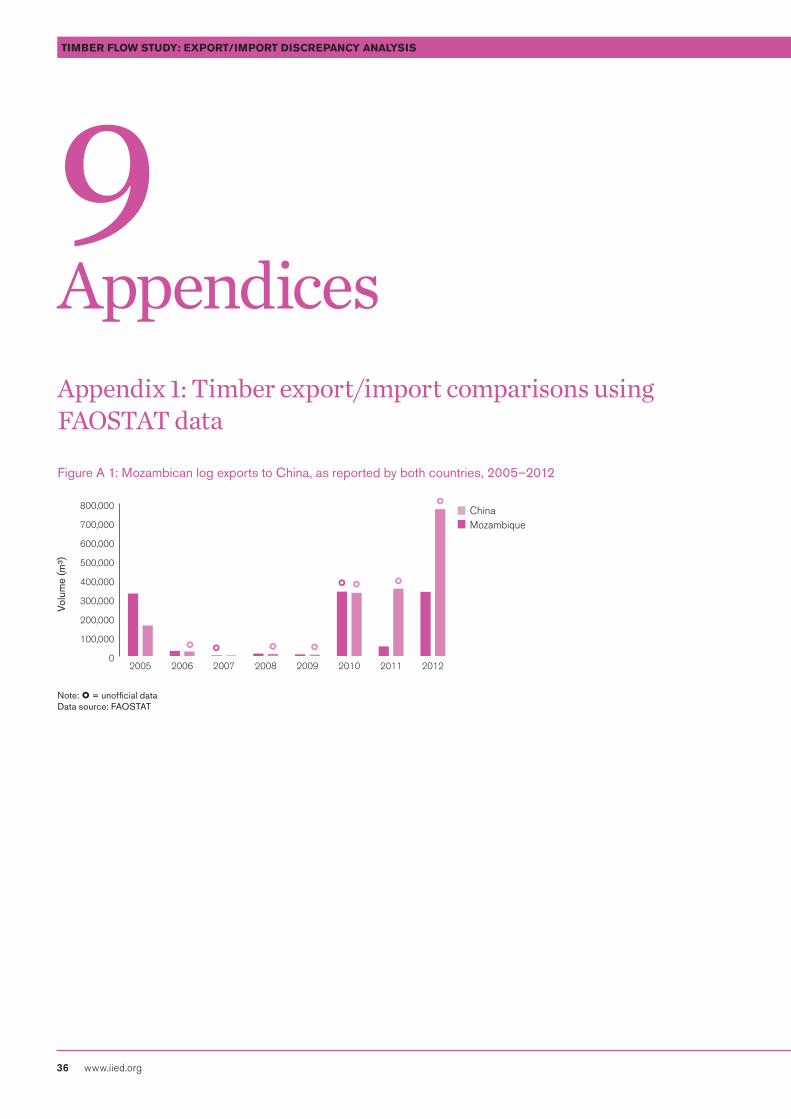
TIMBER FLOW STUDY: EXPORT/IMPORT DISCREPANCY ANALYSIS
36 www.iied.org
9 AppendicesAppendix 1: Timber export/import comparisons using FAOSTAT data
Figure A 1: Mozambican log exports to China, as reported by both countries, 2005–2012
0
100,000
200,000
300,000
400,000
500,000
600,000
700,000
800,000
20122011201020092008200720062005
ChinaMozambique
Note: = unofficial dataData source: FAOSTAT
Volu
me
(m³)
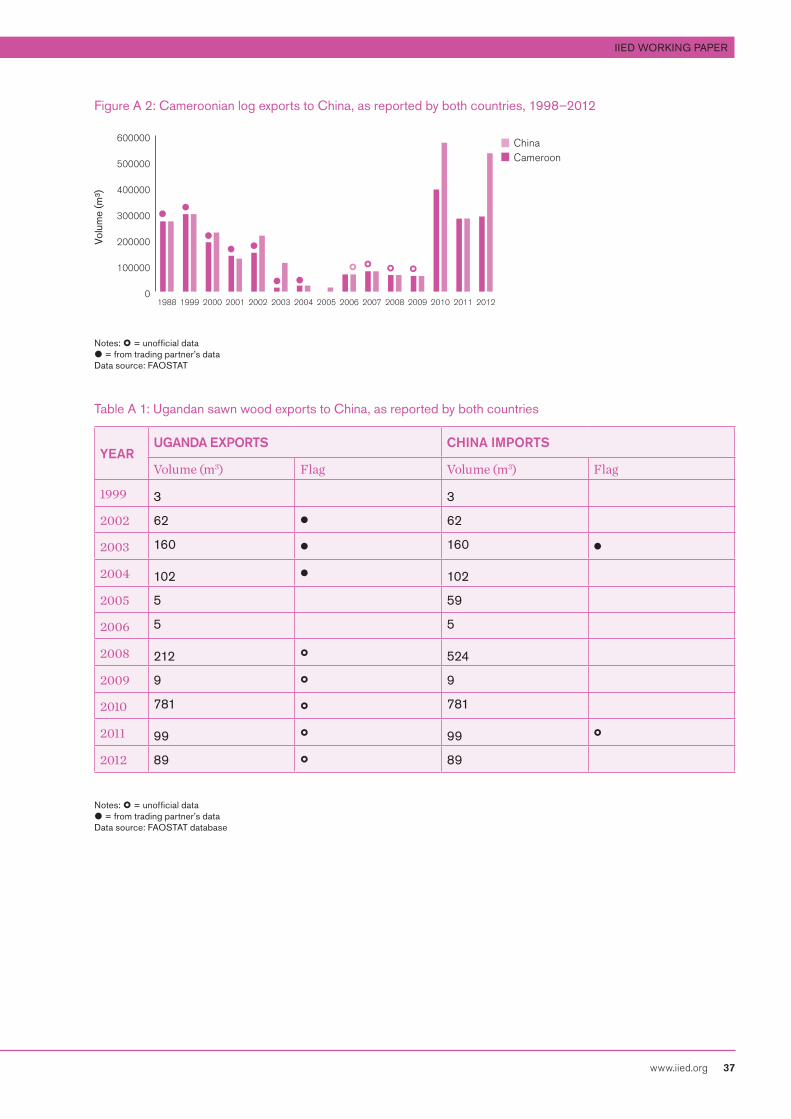
IIED WORKING PAPER
www.iied.org 37
Figure A 2: Cameroonian log exports to China, as reported by both countries, 1998–2012
0
100000
200000
300000
400000
500000
600000
201220112010200920082007200620052004200320022001200019991988
ChinaCameroon
Notes: = unofficial data = from trading partner’s data Data source: FAOSTAT
Table A 1: Ugandan sawn wood exports to China, as reported by both countries
YEARUGANDA EXPORTS CHINA IMPORTS
Volume (m3) Flag Volume (m3) Flag
1999 3 3
2002 62 62
2003 160 160
2004 102 102
2005 5 59
2006 5 5
2008 212 524
2009 9 9
2010 781 781
2011 99 99
2012 89 89
Notes: = unofficial data = from trading partner’s dataData source: FAOSTAT database
Volu
me
(m³)

TIMBER FLOW STUDY: EXPORT/IMPORT DISCREPANCY ANALYSIS
38 www.iied.org
Table A 2: Ugandan log exports to China, as reported by both countries
YEARUGANDA EXPORTS CHINA IMPORTS
Volume (m3) Flag Volume (m3) Flag
2000 10 R 10
2002 11 R 11
2004 8 R 8
2005 20 R 20
2011 59 * 59 *
2012 17 * 17
Data source: FAOSTAT database
Appendix 2: Original data used to calculate figures in the report
This appendix contains the original data we used to create some of the figures in this report. We have only included the data for figures where we felt this extra information may help the reader understand the proportion, because the number difference is so subtle it can be difficult to see without the original data.
Table A 3: Chinese timber-related product imports from Mozambique (data used in Figure 7)
YEARS
HONGMU LOGS (DALBERGIA MELANOXYLON) (RWE M3)
OTHER LOGS (RWE M3)
SAWN WOOD (RWE M3)
OTHER (RWE M3)
2004 5,146 75,354 741.60 2.28
2005 5,759 103,269 2,860.20 2.39
2006 1,957 124,531 6,445.80 2.60
2007 11,309 200,286 12,159.00 0.00
2008 27,226 130,287 71,492.40 0.30
2009 6,836 114,653 60,879.60 33.42
2010 39,315 193,709 139,626.00 15.68
2011 43,367 186,627 218,073.59 0.00
2012 36,557 285,884 219,058.19 2.00
2013 33,203 313,825 254,890.79 0.00 Data sources: China Cuslink Company and UN Comtrade
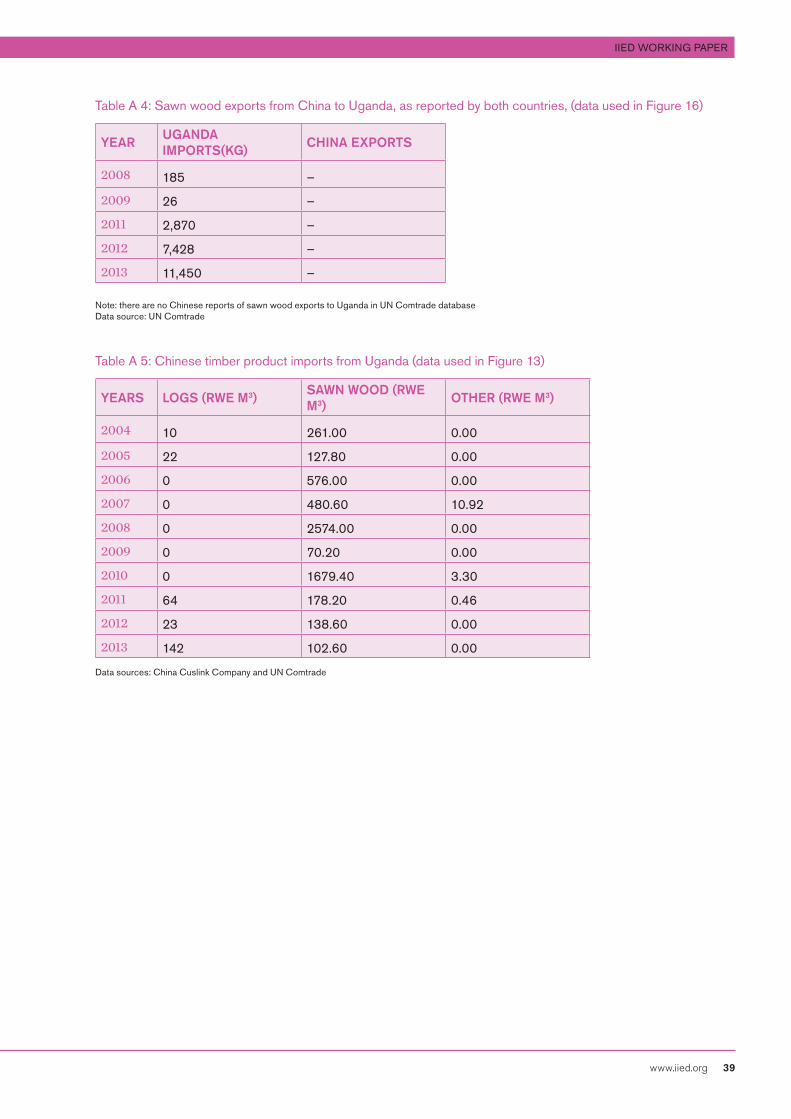
IIED WORKING PAPER
www.iied.org 39
Table A 4: Sawn wood exports from China to Uganda, as reported by both countries, (data used in Figure 16)
YEARUGANDA IMPORTS(KG)
CHINA EXPORTS
2008 185 –
2009 26 –
2011 2,870 –
2012 7,428 –
2013 11,450 – Note: there are no Chinese reports of sawn wood exports to Uganda in UN Comtrade databaseData source: UN Comtrade
Table A 5: Chinese timber product imports from Uganda (data used in Figure 13)
YEARS LOGS (RWE M3)SAWN WOOD (RWE M3)
OTHER (RWE M3)
2004 10 261.00 0.00
2005 22 127.80 0.00
2006 0 576.00 0.00
2007 0 480.60 10.92
2008 0 2574.00 0.00
2009 0 70.20 0.00
2010 0 1679.40 3.30
2011 64 178.20 0.46
2012 23 138.60 0.00
2013 142 102.60 0.00 Data sources: China Cuslink Company and UN Comtrade

TIMBER FLOW STUDY: EXPORT/IMPORT DISCREPANCY ANALYSIS
40 www.iied.org
Table A 6: Chinese timber product imports from DRC (data used in Figure 11)
YEARSHONGMU LOGS (MILLETTIA LAURENTII) (RWE M3)
OTHER LOG (RWE M3)
SAWN WOOD (RWE M3)
OTHER (RWE M3)
2004 75 1650 3,763.80 0.00
2005 207 531 343.80 0.00
2006 0 4297 439.20 0.11
2007 210 6676 198.00 0.00
2008 6,000 18,030 4,789.80 0.00
2009 1,353 16,732 3,742.20 1.44
2010 7,916 37,044 9,390.60 1.08
2011 36,148 30,886 13,008.60 3.17
2012 50,864 37,635 12,429.00 0.00
2013 33,887 49,509 9,473.40 0.00
Data sources: China Cuslink Company and UN Comtrade
Table A 7: Chinese timber product imports from Cameroon (data used in Figure 4)
YEARSHONGMU LOGS (RWE M3)
OTHER LOG (RWE M3)
SAWN WOOD (RWE M3)
OTHER (RWE M3)
2004 45 98,783 61,540.20 568.95
2005 0 48,842 22,478.40 1,883.03
2006 0 299,189 31,219.20 1,175.26
2007 12 249,582 17,641.80 418.86
2008 121 201,212 47,599.20 175.46
2009 154 246,286 29,599.20 698.65
2010 55 400,077 82,524.60 1,074.76
2011 1,108 332,593 117,925.20 853.13
2012 388 392,645 173,160.00 1,580.45
2013 455 434,606 172,575.00 1,105.59 Data sources: China Cuslink Company and UN Comtrade

IIED WORKING PAPER
www.iied.org 41
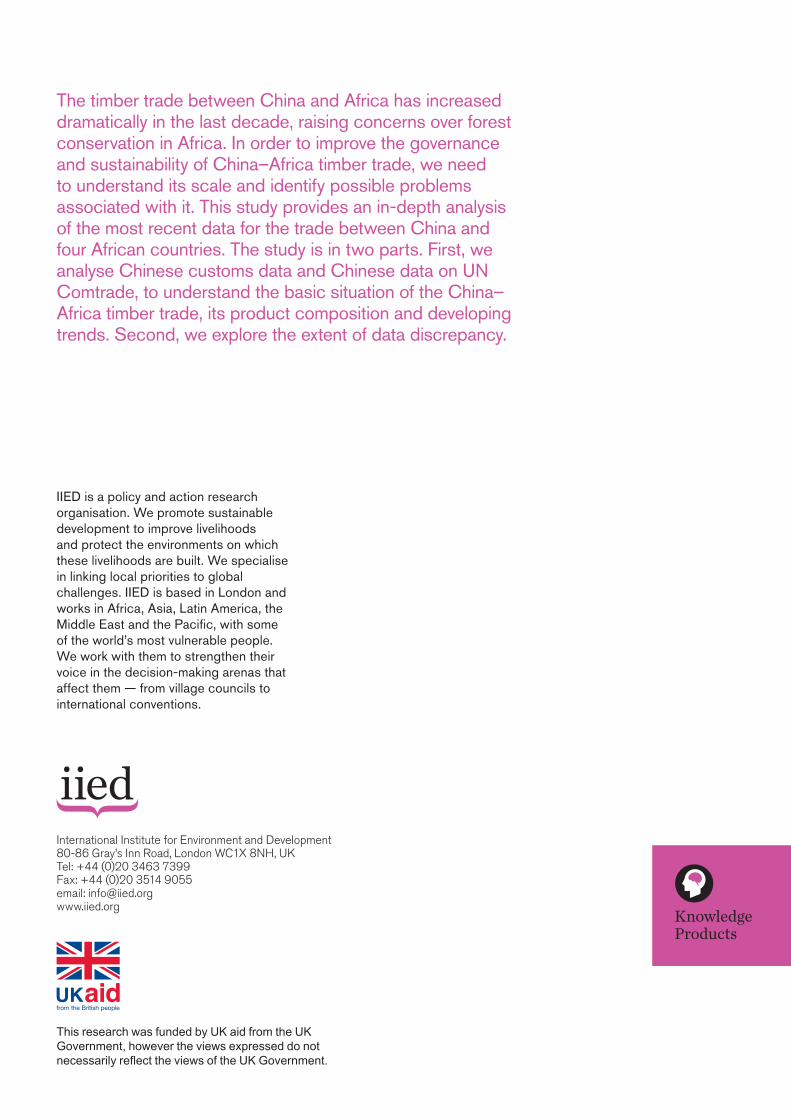
Knowledge Products
IIED is a policy and action research organisation. We promote sustainable development to improve livelihoods and protect the environments on which these livelihoods are built. We specialise in linking local priorities to global challenges. IIED is based in London and works in Africa, Asia, Latin America, the Middle East and the Pacific, with some of the world’s most vulnerable people. We work with them to strengthen their voice in the decision-making arenas that affect them — from village councils to international conventions.
International Institute for Environment and Development 80-86 Gray’s Inn Road, London WC1X 8NH, UK Tel: +44 (0)20 3463 7399 Fax: +44 (0)20 3514 9055 email: [email protected] www.iied.org
This research was funded by UK aid from the UK Government, however the views expressed do not necessarily reflect the views of the UK Government.
The timber trade between China and Africa has increaseddramatically in the last decade, raising concerns over forestconservation in Africa. In order to improve the governanceand sustainability of China–Africa timber trade, we needto understand its scale and identify possible problemsassociated with it. This study provides an in-depth analysisof the most recent data for the trade between China and four African countries. The study is in two parts. First, we analyse Chinese customs data and Chinese data on UN Comtrade, to understand the basic situation of the China–Africa timber trade, its product composition and developing trends. Second, we explore the extent of data discrepancy.