Embed Size (px)
Citation preview

Tropical Grasslands
(2004) Volume 38, 100 –111 100
Tiller dynamics in bahia grass (
Paspalum notatum
): an analysis of responses to nitrogen fertiliser rate, defoliation intensity and season
M. HIRATA
AND
W. PAKIDING
Grassland and Animal Production Division, Faculty of Agriculture, Miyazaki University, Miyazaki, Japan
Abstract
Responses of tiller dynamics in bahia grass(
Paspalum notatum
) to nitrogen fertiliser, defolia-tion and season were analysed using 4-years datafrom swards under 2 nitrogen rates [50 (LN) and200 (HN) kg/ha/yr]
×
3 cutting heights aboveground level [2 (LH), 12 (MH) and 22 (HH) cm].
Total tiller density was ranked LH>MH>HH,and HN>LN in LH treatments. Tiller appearancerate (TAR) was high in June (early summer) orApril–May (mid- to late spring), and oftencharacterised by a trend of LH>MH
≈
HH in thefirst 2 years and LH<MH<HH thereafter. Tillerdeath rate (TDR) started to increase in February(late winter) or March–May (spring), peaked inMay (late spring) or June–August (summer), anddecreased thereafter.
Nitrogen rate and defoliation intensity had aneffect on TAR by influencing the rate of sitefilling in mid-spring to late autumn, which in turndepended on the degree to which actual tillerdensity deviated from the density expected fromthe standard relationships where more tillers werecarried under higher defoliation intensity (lowertiller weight) and higher nitrogen rate. Seasonhad an effect on TAR by affecting leaf appear-ance rate (LAR), which increased in thewarmer months and by affecting the rate of sitefilling in mid-spring to late autumn (April–May>June>July–November). Season influenced
TDR with higher death rates in the warmermonths, and defoliation intensity influenced TDRby varying the magnitude of response of TDR totemperature (LH
≈
MH<HH).The study shows how responses of tiller
dynamics in bahia grass to management andseason can be mechanistically explained andmodelled to improve our knowledge. The modelsdeveloped in the study are useful for future devel-opment of an integrated model simulating canopydynamics of bahia grass swards.
Introduction
Canopy structure of a sward plays an importantrole in many quantitative and qualitative aspectsin pasture production and utilisation. Canopystructure is not static and changes with time andsward management factors such as fertiliser rateand defoliation frequency and intensity. Studyingstructural (
e.g.
tiller density, number of live anddead leaves per tiller, size of leaves and stem) andmorphogenetic (
e.g.
tiller appearance and death,leaf appearance, death and detachment, leafextension) variables of sward canopy is effectivein understanding the mechanisms underlying suchdynamics in canopy structure (Lemaire 1988;Chapman and Lemaire 1993; Lemaire andChapman 1996; Lemaire and Agnusdei 2000).
Bahia grass (
Paspalum notatum
), a sod-forming, warm-season perennial, is widespread inthe southern USA and Central and SouthAmerica (Skerman and Riveros 1989), and is alsogrown in the low-altitude regions of south-western Japan for grazing and hay. In previouspapers, we reported dynamics in structural andmorphogenetic variables in bahia grass swardcanopies under grazing (Pakiding and Hirata1999, 2001, 2002b; Hirata and Pakiding 2001,2002a, 2002b) and under different nitrogen ferti-liser rates and cutting intensities (Hirata 2000;Pakiding and Hirata 2003a, 2003b, 2003c). Someof these studies analysed mechanisms underlying
Correspondence: Dr Masahiko Hirata, Division of Grass-land Science, Faculty of Agriculture, University of Miyazaki,Miyazaki 889-2192, Japan. E-mail: [email protected]
At the time of the study, WP was a student at the UnitedGraduate School of Agricultural Sciences, Kagoshima Uni-versity, Japan, being on study leave from Faculty of AnimalHusbandry, Hasanuddin University, Indonesia.
06/04 - 4 Hirata&Pakiding Page 100 Friday, June 11, 2004 8:32 AM
Tiller dynamics in bahia grass
101
the variation in canopy structure (tiller density,number of live and dead leaves per tiller, laminalength) with season and management, by model-ling morphogenetic variables (tiller appearanceand death, leaf appearance, death and detach-ment, leaf extension) in relation to meteoro-logical, vegetational and managerial variables.However, mechanisms behind the dynamics intiller density were not analysed fully enough toproduce a model which could successfully pre-dict responses to management (Hirata 2001).
In this study, we further analysed the responsesof tiller dynamics in bahia grass to nitrogen rate,defoliation intensity and season. The aims of thestudy were to strengthen the mechanistic basis forexplaining variations in tiller appearance rate(TAR) and tiller death rate (TDR) with manage-ment and season, and to deepen our under-standing of tiller dynamics in bahia grass.
Materials and methods
The study site and experimental treatments
The study was conducted from April 1996–February 2000 in an established sward of Pensa-cola bahia grass at the Faculty of Agriculture,University of Miyazaki, southern Kyushu, Japan(31°50
′
N, 131°24
′
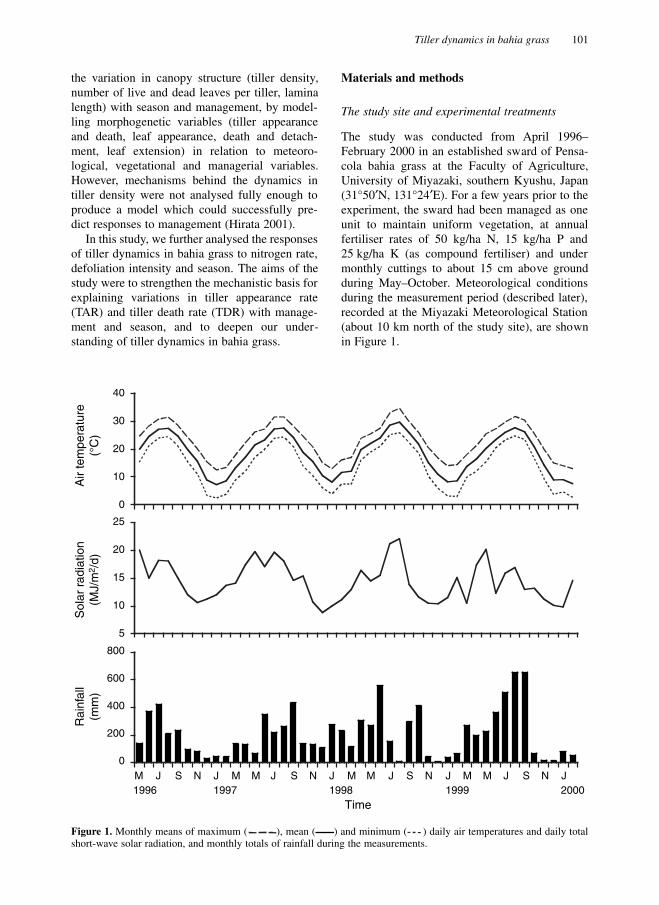
E). For a few years prior to theexperiment, the sward had been managed as oneunit to maintain uniform vegetation, at annualfertiliser rates of 50 kg/ha N, 15 kg/ha P and25 kg/ha K (as compound fertiliser) and undermonthly cuttings to about 15 cm above groundduring May–October. Meteorological conditionsduring the measurement period (described later),recorded at the Miyazaki Meteorological Station(about 10 km north of the study site), are shownin Figure 1.
Figure 1.
Monthly means of maximum ( ), mean ( ) and minimum ( ) daily air temperatures and daily totalshort-wave solar radiation, and monthly totals of rainfall during the measurements.
Time
Sol
ar r
adia
tion
(MJ/
m2 /
d)R
ainf
all
(mm
)A
ir te
mpe
ratu
re(°
C)
800
600
400
200
0
2000
40
30
20
10
0
25
20
15
10
5
1996 1997M J S N J M M M M M MJ J J J J JS N S N S N
1998 1999
06/04 - 4 Hirata&Pakiding Page 101 Friday, June 11, 2004 8:32 AM

102
M. Hirata and W. Pakiding
In early April 1996, six 1.0 m
×
1.2 m plotswere laid out on a 10 m
×
2 m area of the sward(arranged in a row with spacing of 0.5 m), and 6treatments consisting of 2 nitrogen fertiliser rates(LN and HN)
×
3 defoliation heights (LH, MHand HH) were randomly allotted to the plots.There were thus no replications of the treatments.The nitrogen rates for LN and HN were 50 and200 kg/ha/yr, respectively. In addition tonitrogen, each plot received 44 kg/ha/yr P and83 kg/ha/yr K. The sources of N, P and K wereammonium sulphate, superphosphate and potas-sium sulphate, respectively. The fertilisers wereapplied as equal dressings in mid-April, earlyJuly and early September. The plots were cutduring May–October at 15-d intervals in 1996and at monthly intervals in the following years.The defoliation heights for LH, MH and HHwere 2, 12 and 22 cm above ground level, respec-tively. The inter- and outer-plot areas received nilfertiliser and were defoliated similarly to LH.
Measurements
Three 20 cm
×
20 cm permanent quadrats wereestablished in each plot, with 20–40 cm bordersaround the quadrats. All live tillers within thequadrats were tagged on May 30, 1996 with awire ring (9 mm in diameter) with a colouredbead at their base and grouped as the originaltillers, which were of different, unknown ages.Subsequent taggings were conducted at monthlyintervals, when all quadrats were examined, anynew tillers were tagged and the rings wereremoved from dead tillers. The number of newtillers tagged and the number of rings removedfrom dead tillers were recorded, from whichmonthly TAR and TDR were calculated as thedaily rates relative to the total tiller density at thebeginning of the monthly period. Beads of adifferent colour were used at each tagging. Thetillers were classified as dead when all parts werecompletely dried.
The tillers were classified into the following16 age categories (cohorts) according to theperiod of their initiation, with the first categorybeing the original tillers,
i.e.
, formed beforeMay 30, 1996 (pre-measurement). Theremaining 15 categories were tillers initiated inthe following seasons: summer 1996 (May 31–August 31), autumn 1996 (September 1–November 27), winter 1996–1997 (November28–February 28), spring 1997 (March 1–May
30), summer 1997 (May 31–August 29), autumn1997 (August 30–December 1), winter 1997–1998 (December 2–March 2), spring 1998(March 3–May 31), summer 1998 (June 1–September 3), autumn 1998 (September 4–November 30), winter 1998–1999 (December 1–March 1), spring 1999 (March 2–May 30),summer 1999 (May 31–August 30), autumn 1999(August 31–November 23), and winter 1999–2000 (November 24–February 28).
Leaf appearance rate (LAR) was measuredfrom April 1997 to December 1999 for 20 tillersin each treatment, using a tagging technique(Pakiding and Hirata 2001; 2003b). LARs beforeApril 1997 and after December 1999 were esti-mated from air temperature using equationsdeveloped by Pakiding and Hirata (2003b).
The rate of site filling (F
S
, tillers/leaf), definedas the rate at which axillary buds develop intotillers (visible without dissection) in relation tothe rate at which leaf axils are formed (Davies1974; Thomas 1980), was calculated as:
F
S
= R’
tiller,app
/ R
leaf,app
(1)
where R’
tiller,app
is TAR (tillers/tiller/d) andR
leaf,app
is LAR (leaves/tiller/d). The rate of sitefilling was estimated for April–November (mid-spring–late autumn), because LAR in the othermonths (December–March) was usually less than0.03 leaves/tiller/d which equals production of <1leaf per month.
Measurements of herbage mass commenced inAugust 1996. Immediately before each tagging,herbage mass above ground level within eachquadrat was estimated using an electronic capaci-tance probe (PastureProbe
TM
, Mosaic SystemsLtd, New Zealand) (Hirata
et al.
1993). Calibra-tion equations were developed at each measure-ment time by cutting samples from adjacentswards subjected to cutting heights ranging from2–30 cm. Herbage mass in June and July 1996 wasestimated from meteorological data using mass–meteorology relationships during 1997–1999.
Tiller weight was calculated by dividingherbage mass by total tiller density (sum ofdensities of all tiller cohorts).
Results and discussion
Herbage mass and tiller density
Herbage mass was higher in summer (June–August) and autumn (September–November)
06/04 - 4 Hirata&Pakiding Page 102 Friday, June 11, 2004 8:32 AM

Tiller dynamics in bahia grass
103
than in winter (December–February) and spring(March–May), with larger seasonal variationunder higher defoliation height (Figure 2). Theincrease in nitrogen rate and defoliation heightalmost always increased herbage mass (LN<HNand LH<MH<HH).
Tiller density at the first tagging (May 30,1996) tended to be higher in HN treatments thanin LN treatments (Figure 3). This is probablyattributable to the facts that the sward was initiallydeficient in nitrogen and the nitrogen treatmentcommenced in mid-April,
i.e.
, 1.5 months beforethe first measurements (tagging); a high nitrogenrate stimulated tillering of the bahia grass until thefirst measurements. There was no visual differ-ence in the vegetation among the 6 plots whenthey were established (early April 1996).
In the first 1 or 2 years, total tiller density inLH treatments increased, with a steeper increasein HN than in LN (Figure 3). On the contrary, totaltiller density in MH and HH treatments decreased,showing steeper decreases in HH treatments thanin MH treatments. Thereafter, in the third andfourth years, total tiller density in all treatmentsmaintained annually constant values, showingseasonal fluctuations consisting of an increase inApril–May (mid- to late spring) and a subsequentdecrease in June–September (early summer–earlyautumn). From the second half of the first yearonward, total tiller density was rankedLH>MH>HH, and HN>LN in LH treatments.These results reinforce earlier observations that
tiller density of bahia grass increased as defolia-tion height decreased from 22 to 2 cm (Hirata1993) and when nitrogen fertiliser was applied atthe defoliation height of 2 cm (Pakiding andHirata 2002a). Beaty
et al.
(1977) also reportedhigher tiller densities of bahia grass at highernitrogen rates in swards defoliated at 2.5 and7.5 cm, though the densities were not differentbetween the 2 cutting heights.
The density of original tillers (formed beforethe first measurements) decreased with time andaccounted for 20.5, 18.2, 31.6, 53.8, 24.5 and34.8% of the final total tiller density in LN/LH,HN/LH, LN/MH, HN/MH, LN/HH and HN/HH,respectively (Figure 3). Among the 15 cohortsformed after the first measurements, tillersappearing in autumn 1996 and spring 1997, 1998and 1999 showed relatively high densities in LHtreatments, and those appearing in the 3 springsshowed higher densities in the other treatments.
Standard relationship between tiller density and tiller weight
The relationship between tiller density and tillerweight in summer–autumn of the fourth year(June–November 1999) was defined as thestandard density:weight relationship under themanagement systems imposed. The fourthyear was selected because the responses of totaltiller density to the treatments appeared to havealmost ended by this year (Figure 3), and the
Figure 2.
Seasonal means of herbage mass. Six columns in each season indicate LN/LH, HN/LH, LN/MH, HN/MH,LN/HH and HN/HH from left to right (LN=low nitrogen; HN=high nitrogen; LH=low height; MH=medium height;HH=high height of cutting). Vertical bars show standard errors of the means (no s.e. values for summer 1996).
2000Time
He
rba
ge
ma
ss
(g
/m2 D
M)
1000
800
600
400
200
0
1996Su Au Wi Sp Su Au Wi Sp
1997Su Au Wi Sp Su Au Wi
1998 1999
06/04 - 4 Hirata&Pakiding Page 103 Friday, June 11, 2004 8:32 AM

104
M. Hirata and W. Pakiding
summer–autumn period was selected becausebahia grass tillers are fully green during thisperiod (Hirata and Pakiding 2002a). There werenegative linear relationships between log (tillerdensity) and log (tiller weight) (Figure 4).HN treatments showed a significantly greaterintercept and a significantly steeper slope (bothP<0.001) than LN treatments. The equations thusindicate that the number of tillers carried on a unitarea of land increased as tiller weight decreased,with higher numbers on HN treatments thanLN treatments in a tiller weight range below493 mg/tiller DM [log (tiller weight)<2.69].
These standard relationships between tillerdensity and tiller weight are the reverse (in termsof x- and y-axes) of the well-known self-thinningrule (Yoda
et al.
1963), and enable us to calculateexpected tiller density from an arbitrary tillerweight value of 27–355 mg/tiller DM [1.43 < log(tiller weight) < 2.55]:
N = 10
(4.355 – 0.376 log W)
(for LN treatments) (2a)N = 10
(4.726 – 0.514 log W)
(for HN treatments) (2b)where N and W are tiller density (tillers/m
2
) andtiller weight (mg/tiller DM), respectively.
Figure 3.
Density of tillers in different age cohorts (different seasons of initiation). Tiller cohorts are stacked in order oftheir age (the oldest at the bottom and the youngest at the top); pre-measurement ( ), summer 1996 ( ), autumn1996 ( ), winter 1996–1997 ( ), spring 1997 ( ), summer 1997 ( ), autumn 1997 ( ), winter 1997–1998( ), spring 1998 ( ), summer 1998 ( ), autumn 1998 ( ), winter 1998–1999 ( ), spring 1999 ( ), summer1999 ( ), autumn 1999 ( ), winter 1999–2000 ( ). LN=low nitrogen; HN=high nitrogen; LH=low height;MH=medium height; HH=high height of cutting. Vertical bars show standard errors of the means of total tiller density.
2000
Til
ler
de
ns
ity
(N
o/m
2)
10000
8000
6000
4000
2000
0
10000
8000
6000
4000
2000
0
10000
8000
6000
4000
2000
0
LN/LH HN/LH
LN/MH HN/MH
LN/HH HN/HH
MJ S N J MMJ S N J M MJ S N J MMJ S N J1996 1997 1998 1999 2000
MJ S N J MMJ S N J M MJ S N J MMJ S N J1996 1997 1998 1999
Time
06/04 - 4 Hirata&Pakiding Page 104 Friday, June 11, 2004 8:32 AM

Tiller dynamics in bahia grass
105
Figure 4.
Relationship between log (tiller density) andlog (tiller weight) during summer and autumn in thefourth year (June–November 1999). Regression lines are:log N=4.355
−
0.376 log W (r=
−
0.986, P<0.001) for LNtreatments [LN/LH ( ), LN/MH ( ) and LN/HH ( )];log N=4.726–0.514 log W (r=
−
0.983, P<0.001) for HNtreatments [HN/LH (
▼
), HN/MH (
●
) and HN/HH (
▲
)];where N and W are tiller density and tiller weight, respec-tively. LN=low nitrogen; HN=high nitrogen; LH=lowheight; MH=medium height; HH=high height of cutting.
Rates of tiller appearance and death
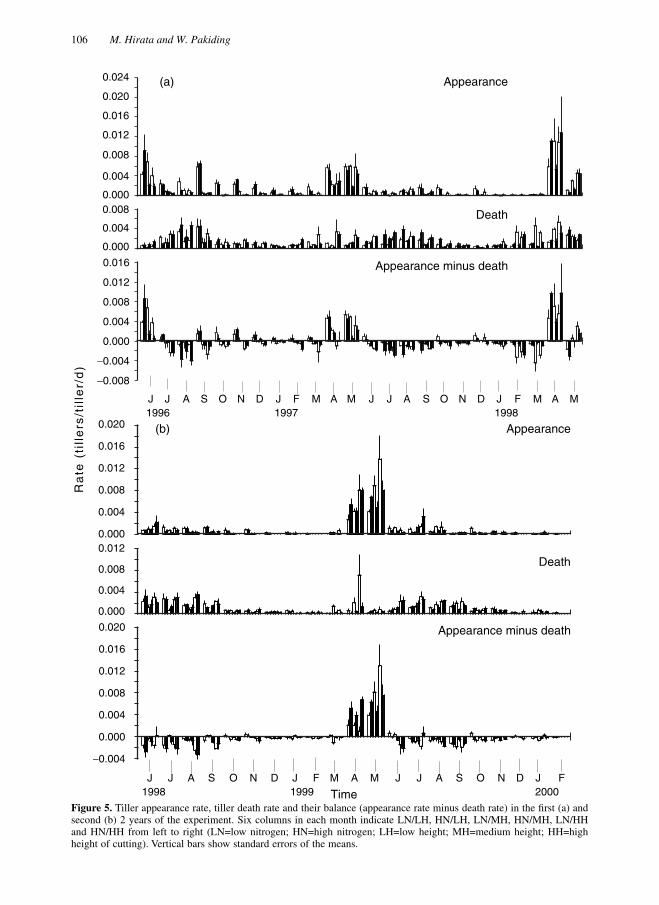
TAR was high in June (early summer) 1996, andin April and May (mid- and late spring) in thefollowing years (Figure 5). TAR was often char-acterised by a trend of LH>MH
≈
HH in the first 2years (1996 and 1997) and by a trend ofLH<MH<HH thereafter. The effect of nitrogenrate on TAR was smaller and less consistent.TDR started to increase in February (late winter)or March–May (spring), peaked in May (latespring) or June–August (summer), and decreasedthereafter. There appeared to be no consistenteffects of treatments on TDR. The balancebetween TAR and TDR was positive and high inJune 1996, and in April and May in the followingyears, except for May 1998. The balance tendedto be ranked LH>MH>HH in the first 2 years(June 1996 and April–May 1997) andLH<MH<HH in the following years (April–May1998 and 1999). In the other months, the balancewas usually close to zero or negative, except forLH treatments in the first year.
Modelling tiller appearance rate
Since TAR is determined as LAR
×
rate of sitefilling (Davies 1974; Thomas 1980), variation inTAR with season and treatments (Figure 5) canbe attributed to variation in LAR or variation inthe rate of site filling or both. TAR in relation toLAR showed 2 major seasonally differentpatterns (Figure 6).
In December–March (early winter to earlyspring), TAR was always close to zero with lowrates of leaf appearance (usually <0.03leaves/tiller/d,
i.e.
, <1 leaf per month), indicatingthat low LAR was a major factor limiting tillerappearance in this period. By contrast, in April–November (mid-spring to late autumn), TARvaried in relatively wide ranges (particularlyApril–June) with varying values in both LAR andrate of site filling (shown as a ratio ofTAR:LAR). TAR varied even at similar rates ofleaf appearance. Thus, TAR in this period wasregulated by both LAR and the rate of site filling.
Variation in LAR throughout the year(Figure 6) is attributable to variation in air tem-perature. In our previous studies, LAR in bahiagrass showed a close, positive association withair temperature (Pakiding and Hirata 2001;2003b), being stable across nitrogen rates anddefoliation intensities (Pakiding and Hirata2003b).
Variation in the rate of site filling in April–November was explained by the degree to whichactual tiller density deviated from the densityexpected from the standard relationships (Figure4, Equations 2a and 2b);
i.e.
, there were negativelinear relationships between the rate of site fillingand the actual:expected ratio in tiller density(Figure 7). These equations show that the rate ofsite filling was high when actual tiller densitywas lower than the density expected from thestandard relationships and decreased to zero asthe actual:expected ratio increased to 1.05–1.50(mean=1.19). Values of the rate of site filling atlow actual:expected ratios (
e.g.
N
A:E
=0.6) or thesteepness of the regression lines tended to beranked April–May>June>July–November, indi-cating that the rate of site filling was regulated byseason as well.
Thus, nitrogen rate and defoliation intensityhad an effect on TAR in April–November, initiallyby affecting tiller weight, then by varyingactual:expected ratio in tiller density, and finallyby influencing the rate of site filling. Nitrogen rate
Log (tiller weight) (mg/tiller DM)
Lo
g (
till
er
de
ns
ity
) (t
ille
rs/m
2)
4.2
4.0
3.8
3.6
3.4
3.21.0 1.5 2.0 2.5 3.0
06/04 - 4 Hirata&Pakiding Page 105 Friday, June 11, 2004 8:32 AM
106
M. Hirata and W. Pakiding
Figure 5.
Tiller appearance rate, tiller death rate and their balance (appearance rate minus death rate) in the first (a) andsecond (b) 2 years of the experiment. Six columns in each month indicate LN/LH, HN/LH, LN/MH, HN/MH, LN/HHand HN/HH from left to right (LN=low nitrogen; HN=high nitrogen; LH=low height; MH=medium height; HH=highheight of cutting). Vertical bars show standard errors of the means.
Ra
te (
till
ers
/til
ler/
d)
0.024
0.020
0.016
0.012
0.008
0.004
0.0000.008
0.004
0.000
0.016
0.012
0.008
0.004
0.000
−0.004
−0.008
J J A S O N D J F M A M J J A S O N D J F M A M1996 1997 1998
Appearance minus death
Death
Appearance(a)
0.020
0.016
0.012
0.008
0.004
0.0000.012
0.008
0.004
0.000
0.020
0.016
0.012
0.008
0.004
0.000
−0.004
J J A S O N D J F M A M J J A S O N D J F1998 1999 2000
Appearance minus death
Death
Appearance(b)
Time
06/04 - 4 Hirata&Pakiding Page 106 Friday, June 11, 2004 8:32 AM

Tiller dynamics in bahia grass
107
also affected the standard density:weight relation-ship where more tillers were carried under higherdefoliation intensity (lower tiller weight) andhigher nitrogen rate (Figure 4). Season had aneffect on TAR by affecting LAR throughout theyear through variation in air temperature, and byaffecting the rate of site filling in April–November(April–May>June>July–November). These mech-anics are more logical and robust than those in ourprevious study (Pakiding and Hirata 2003a), andmore appropriate for predicting responses of tillerappearance to management and season (Hirata2001).
TAR in bahia grass during the spring–autumnperiod was density-dependent (not shown as afigure) because of the density-dependence of therate of site filling (Figure 7). Bullock
et al.
(1994) also reported the density-dependence ofTAR in
Agrostis stolonifera
and
Lolium perenne
but smaller effects of management.
Modelling tiller death rate
Unlike TAR, variation in TDR (Figure 5) was notassociated with actual:expected ratio of tiller
Figure 6.
Relationships between tiller appearance rate and leaf appearance rate in different months. Treatments areLN/LH ( ), HN/LH ( ), LN/MH ( ), HN/MH (
▼
), LN/HH (
●
) and HN/HH (
▲
) (LN=low nitrogen; HN=highnitrogen; LH=low height; MH=medium height; HH=high height of cutting).
0.015
0.010
0.005
0.000
Til
ler
ap
pe
ara
nc
e r
ate
(ti
lle
rs/t
ille
r/d
) 0.015
0.010
0.005
0.0000.015
0.010
0.005
0.0000.015
0.010
0.005
0.000
December January February
March April May
June July August
September October November
0.00 0.06 0.12 0.18 0.00 0.06 0.12 0.18 0.00 0.06 0.12 0.18
Leaf appearance rate (leaves/tiller/d)
06/04 - 4 Hirata&Pakiding Page 107 Friday, June 11, 2004 8:32 AM

108
M. Hirata and W. Pakiding
Figure 7.
Relationships between rate of site filling and actual:expected ratio in tiller density in different months. Treat-ments are LN/LH ( ), HN/LH ( ), LN/MH ( ), HN/MH (
▼
), LN/HH (
●
) and HN/HH (
▲
) (LN=low nitrogen;HN=high nitrogen; LH=low height; MH=medium height; HH=high height of cutting). Regression lines are:F
S
=0.155
−
0.141N
A:E
(r=–0.583, P<0.05) for April; F
S
=0.141
−
0.123N
A:E
(r=–0.598, P<0.01) for May; F
S
=0.098
−
0.078N
A:E
(r=–0.661, P<0.001) for June; F
S
=0.032
−
0.023N
A:E
(r=–0.576, P<0.01) for July; F
S
=0.023
−
0.016N
A:E
(r=–0.449, P<0.05) for August; F
S
=0.079
−
0.076N
A:E
(r=–0.787, P<0.001) for September; F
S
=0.033
−
0.031N
A:E
(r=–0.624, P<0.01) for October; F
S
=0.067
−
0.064N
A:E
(r=–0.779, P<0.001) for November; where F
S
and N
A:E
are rate ofsite filling and actual:expected ratio of tiller density, respectively. Expected tiller densities were calculated from tillerweight using the standard relationships between tiller density and tiller weight (Figure 4, Equations 2a and 2b).
Ra
te o
f s
ite
fil
lin
g (
till
ers
/le
af)
April May
JulyJune
August September
October November
0.15
0.12
0.09
0.06
0.03
0.00
0.15
0.12
0.09
0.06
0.03
0.00
0.15
0.12
0.09
0.06
0.03
0.00
0.15
0.12
0.09
0.06
0.03
0.000.0 0.3 0.6 0.9 1.2 1.5 0.0 0.3 0.6 0.9 1.2 1.5
Actual expected ratio in tiller density
06/04 - 4 Hirata&Pakiding Page 108 Friday, June 11, 2004 8:32 AM

Tiller dynamics in bahia grass
109
density (not shown as a figure), indicatingdensity-independence of TDR. Such unimpor-tance of tiller density in the regulation of TDR inbahia grass contrasts with the results from
Agrostis stolonifera
and
Lolium perenne
(Bullock
et al.
1994).
Instead, TDR in each treatment increased asmean daily air temperature increased (Figure 8).The slope of the regression lines was higher in HH
than in LH and MH (P<0.10) within each nitrogenrate, although consistent effects of treatments onTDR were difficult to discern in Figure 5.
Thus, season had an effect on TDR mainlythrough variation in air temperature. Among thetreatments, only defoliation intensity had aneffect on TDR by affecting the magnitude ofresponse of TDR to temperature (LH
≈
MH<HH).Such a result on the effects of treatments on TDR
Figure 8. Relationships between tiller death rate and mean air temperature in different treatments (LN/LH, HN/LH,LN/MH, HN/MH, LN/HH and HN/HH) (LN=low nitrogen; HN=high nitrogen; LH=low height; MH=medium height;HH=high height of cutting). Regression lines are:R’tiller,death=–0.00037+0.00008T (r=0.603, P<0.001) for LN/LH; R’tiller,death=–0.00062+0.00010T (r=0.608, P<0.001) forHN/LH; R’tiller,death=0.00005+0.00004T (r=0.425, P<0.05) for LN/MH; R’tiller,death=–0.00039+0.00006T (r=0.731,P<0.001) for HN/MH; R’tiller,death=–0.00115+0.00013T (r=0.779, P<0.001) for LN/HH; R’tiller,death=–0.00123+0.00014T(r=0.817, P<0.001) for HN/HH; where R’tiller,death and T are tiller death rate and mean air temperature, respectively.Regressions for LN/MH, LN/HH and HN/HH exclude data when herbage mass is <300, <500 and <500 g/m2 DM,respectively (open circles).
Til
ler
de
ath
ra
te (
till
ers
/til
ler/
d)
0.008
0.006
0.004
0.002
0.000
0.008
0.006
0.004
0.002
0.000
0.008
0.006
0.004
0.002
0.000
Air temperature (°C)
LN/LH HN/LH
LN/MH HN/MH
LN/HH HN/HH
0 10 20 30 40 0 10 20 30 40
06/04 - 4 Hirata&Pakiding Page 109 Friday, June 11, 2004 8:32 AM
110 M. Hirata and W. Pakiding
partly agrees with our previous results thatlongevity of bahia grass tillers decreased withincreasing nitrogen rate and defoliation height(Pakiding and Hirata 2003a).
In LN/MH, LN/HH and HN/HH, however,dependence of TDR on temperature was detectedonly when data with low herbage masses (<300,<500 and <500 g/m2 DM, respectively) wereexcluded (Figure 8). Further analysis is needed toclarify the reason for this relationship.
Conclusions
Tiller dynamics in bahia grass were influenced bynitrogen fertiliser rate, defoliation intensity andseason. Nitrogen rate and defoliation intensityhad an effect on TAR by influencing the rate ofsite filling in mid-spring to late autumn, which inturn depended on the degree to which actual tillerdensity deviated from the density expected fromthe standard relationships, where more tillerswere carried under higher defoliation intensity(lower tiller weight) and higher nitrogen rate.Season had an effect on TAR by affecting LARthroughout the year (through air temperature;Pakiding and Hirata 2001; 2003b) and byaffecting the rate of site filling in mid-spring tolate autumn (April–May>June>July–November).Season had an effect on TDR through variation inair temperature, and defoliation intensity affectedTDR by varying the magnitude of response ofTDR to temperature (LH≈MH<HH). The currentstudy shows how responses of tiller dynamics inbahia grass to management and season can bemechanistically explained and modelled toimprove our knowledge. The models developedin this study are useful for future development ofan integrated model simulating canopy dynamicsof bahia grass swards.
Acknowledgement
WP wishes to thank the Japanese Ministry ofEducation, Science, Sports and Culture for finan-cial support in his postgraduate study.
References
BEATY, E.R., ENGEL, J.L. and POWELL, J.D. (1977) Yield, leafgrowth, and tillering in bahiagrass by N rate and season.Agronomy Journal, 69, 308–311.
BULLOCK, J.M., HILL, B.C. and SILVERTOWN, J. (1994) Tillerdynamics of two grasses – response to grazing, density andweather. Journal of Ecology, 82, 331–340.
CHAPMAN, D.F. and LEMAIRE, G. (1993) Morphogenetic andstructural determinants of plant regrowth after defoliation.Proceedings of the XVII International Grassland Congress,Palmerston North and Rockhampton, 1993. pp. 95–104.
DAVIES, A. (1974) Leaf tissue remaining after cutting andregrowth in perennial ryegrass. Journal of AgriculturalScience, Cambridge, 82, 165–172.
HIRATA, M. (1993) Response of bahiagrass (Paspalum notatumFlügge) sward to cutting height. 3. Density of tillers, stolonsand primary roots. Journal of Japanese Society of GrasslandScience, 39, 196–205.
HIRATA, M. (2000) Effects of nitrogen fertiliser rate and cuttingheight on leaf appearance and extension in bahia grass(Paspalum notatum) swards. Tropical Grasslands, 34, 7–13.
HIRATA, M. (2001) A preliminary model of tiller densitydynamics in bahiagrass (Paspalum notatum Flügge) swards.Grassland Science, 47, 513–515.
HIRATA, M., HIGASHIYAMA, M., KIKUCHI, M. and LIU, S.(1993) Estimation of herbage mass of bahiagrass (Paspalumnotatum Flügge) swards with an electronic capacitancemeter. Bulletin of the Faculty of Agriculture, Miyazaki Uni-versity, 40, 83–89.
HIRATA, M. and PAKIDING, W. (2001) Tiller dynamics in abahia grass (Paspalum notatum) pasture under cattlegrazing. Tropical Grasslands, 35, 151–160.
HIRATA, M. and PAKIDING, W. (2002a) Dynamics in tillerweight and its association with herbage mass and tillerdensity in a bahia grass (Paspalum notatum) pasture undercattle grazing. Tropical Grasslands, 36, 24–32.
HIRATA, M. and PAKIDING, W. (2002b) Dynamics in laminasize in a bahia grass (Paspalum notatum) pasture undercattle grazing. Tropical Grasslands, 36, 180–192.
LEMAIRE, G. (1988) Sward dynamics under different manage-ment programmes. Proceedings of the 12th GeneralMeeting of the European Grassland Federation, Dublin,1988. pp. 7–22.
LEMAIRE, G. and CHAPMAN, D. (1996) Tissue flows in grazedplant communities. In: Hodgson, J. and Illius, A.W. (eds) TheEcology and Management of Grazing Systems. pp. 3–36.(CABI Publishing: Wallingford).
LEMAIRE, G. and AGNUSDEI, M. (2000) Leaf tissue turnoverand efficiency of herbage utilization. In: Lemaire, G.,Hodgson, J., de Moraes, A., Carvalho, P.C. de F. andNabinger, C. (eds) Grassland Ecophysiology and GrazingEcology. pp. 265–287. (CABI Publishing: Wallingford).
PAKIDING, W. and HIRATA, M. (1999) Tillering in a bahia grass(Paspalum notatum) pasture under cattle grazing: resultsfrom the first two years. Tropical Grasslands, 33, 170–176.
PAKIDING, W. and HIRATA, M. (2001) Leaf appearance, deathand detachment in a bahia grass (Paspalum notatum) pastureunder cattle grazing. Tropical Grasslands, 35, 114–123.
PAKIDING, W. and HIRATA, M. (2002a) Tolerance of bahiagrass(Paspalum notatum Flügge) to defoliation. GrasslandScience, 48, 100–104.
PAKIDING, W. and HIRATA, M. (2002b) Canopy dynamics in abahiagrass (Paspalum notatum Flügge) pasture under cattlegrazing: structural components responsible for variations inherbage mass. Grassland Science, 48, 311–316.
PAKIDING, W. and HIRATA, M. (2003a) Effects of nitrogen fer-tilizer rate and cutting height on tiller and leaf dynamics inbahiagrass (Paspalum notatum Flügge) swards: tiller appear-ance and death. Grassland Science, 49, 193–202.
PAKIDING, W. and HIRATA, M. (2003b) Effects of nitrogenfertilizer rate and cutting height on tiller and leaf dynamicsin bahiagrass (Paspalum notatum Flügge) swards: leafappearance, death and detachment. Grassland Science, 49,203–210.
06/04 - 4 Hirata&Pakiding Page 110 Friday, June 11, 2004 8:32 AM

Tiller dynamics in bahia grass 111
PAKIDING, W. and HIRATA, M. (2003c) Effects of nitrogenfertilizer rate and cutting height on tiller and leaf dynamicsin bahiagrass (Paspalum notatum Flügge) swards: leafextension and mature leaf size. Grassland Science, 49,211–216.
SKERMAN, P.J. and RIVEROS, F. (1989) Tropical Grasses.(FAO: Rome).
THOMAS, H. (1980) Terminology and definitions in studies ofgrassland plants. Grass and Forage Science, 35, 13–23.
YODA, K., KIRA, T., OGAWA, H. and HOZUMI, K. (1963)Intraspecific competition among higher plants. XI. Self-thinning in overcrowded pure stands under cultivated andnatural conditions. Journal of Biology, Osaka City University,14, 107–129.
(Received for publication July 5, 2002; accepted September 4, 2003)
06/04 - 4 Hirata&Pakiding Page 111 Friday, June 11, 2004 8:32 AM