Embed Size (px)
Citation preview

Tilburg University
The Impact of Bank Consolidation on Commercial Borrower Welfare
Karceski, J.; Ongena, S.R.G.; Smith, D.C.
Publication date:2000
Link to publication
Citation for published version (APA):Karceski, J., Ongena, S., & Smith, D. C. (2000). The Impact of Bank Consolidation on Commercial BorrowerWelfare. (CentER Discussion Paper; Vol. 2000-87). Tilburg: Finance.
General rightsCopyright and moral rights for the publications made accessible in the public portal are retained by the authors and/or other copyright ownersand it is a condition of accessing publications that users recognise and abide by the legal requirements associated with these rights.
- Users may download and print one copy of any publication from the public portal for the purpose of private study or research - You may not further distribute the material or use it for any profit-making activity or commercial gain - You may freely distribute the URL identifying the publication in the public portal
Take down policyIf you believe that this document breaches copyright, please contact us providing details, and we will remove access to the work immediatelyand investigate your claim.
Download date: 17. Jul. 2018

Centerfor
Economic Research
No. 2000-87
THE IMPACT OF BANK CONSOLIDATION ONCOMMERCIAL BORROWER WELFARE
By Jason Karceski, Steven Ongena and David C. Smith
September 2000
ISSN 0924-7815

The Impact of Bank Consolidation on Commercial Borrower Welfare
Jason Karceski
University of [email protected]
Steven Ongena
Tilburg University and [email protected]
David C. Smith∗
Board of Governors of the Federal Reserve [email protected]
First draft: March 15, 2000Current draft: August 3, 2000
∗ Corresponding author. Mailing address: 20th and C Streets NW, Mailstop 19, Washington, D.C. 20551. The views of this paper are the
authors’ and do not reflect those of the Board of Governors or its staff. We thank Hans Degryse, Mark Flannery, Michael Ryngaert,Marc Zenner, and workshop participants at the 2000 CEPR Summer Conference, Norwegian School of Management BI, and TilburgUniversity for providing helpful comments. Ongena received partial support for this research from the Fund for Economic Research atNorges Bank.

The Impact of Bank Consolidation on Commercial Borrower Welfare
Abstract
We estimate the impact of bank merger announcements on borrowers’ stock prices for publicly-tradedNorwegian firms. In addition, we analyze how bank mergers influence borrower relationship terminationbehavior and relate the propensity to terminate to borrower abnormal returns. We obtain four main results.First, on average borrowers lose about one percent in equity value when their bank is announced as a mergertarget. Small borrowers of target banks are especially hurt in large bank mergers, where they lose an averageof about three percent. Second, bank mergers lead to higher relationship exit rates for three years after a bankmerger, and small bank mergers lead to larger increases in exit rates than large mergers. Third, target borrowerabnormal returns are positively related to pre-merger exit rates, indicating that firms that find it easier to switchbanks are less harmed when their bank merges. Fourth, we find weak evidence that target borrowers withlarge merger-induced increases in exit rates are more negatively affected by bank merger announcements,suggesting that target borrowers are forced out of relationships and suffer welfare losses as a result of bankmergers.
JEL code: G21, C41
Keywords: bank relationships, bank mergers, market power.
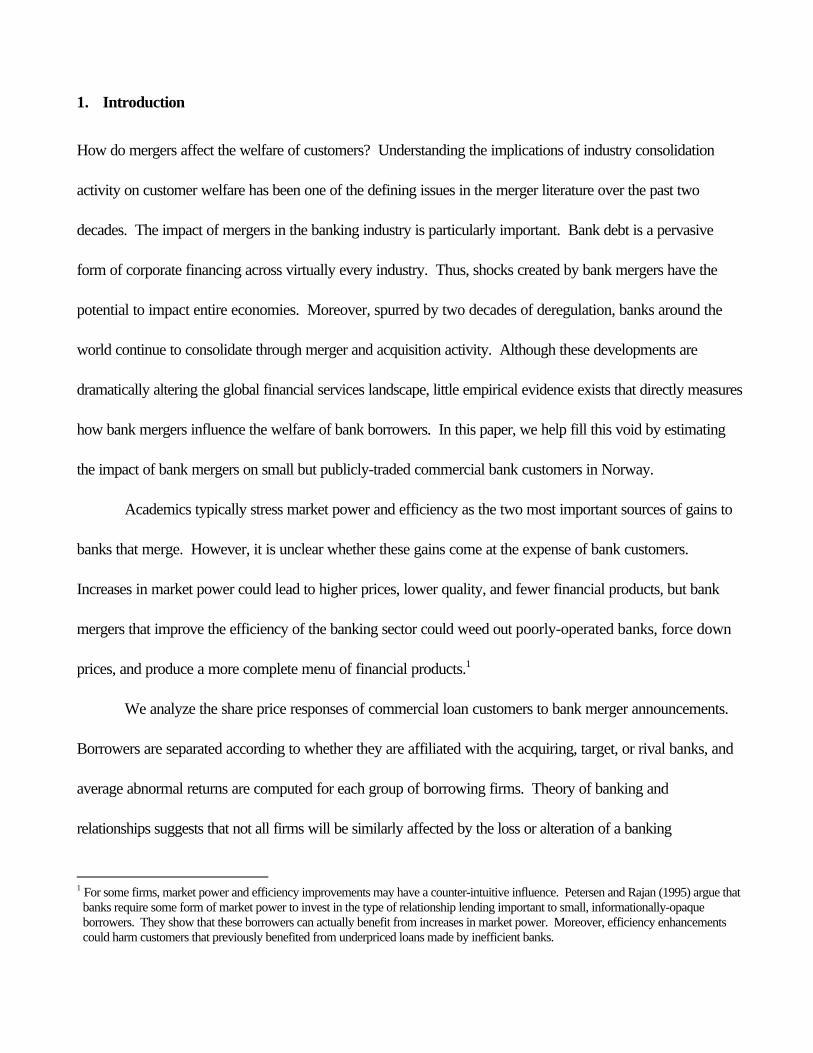
1. Introduction
How do mergers affect the welfare of customers? Understanding the implications of industry consolidation
activity on customer welfare has been one of the defining issues in the merger literature over the past two
decades. The impact of mergers in the banking industry is particularly important. Bank debt is a pervasive
form of corporate financing across virtually every industry. Thus, shocks created by bank mergers have the
potential to impact entire economies. Moreover, spurred by two decades of deregulation, banks around the
world continue to consolidate through merger and acquisition activity. Although these developments are
dramatically altering the global financial services landscape, little empirical evidence exists that directly measures
how bank mergers influence the welfare of bank borrowers. In this paper, we help fill this void by estimating
the impact of bank mergers on small but publicly-traded commercial bank customers in Norway.
Academics typically stress market power and efficiency as the two most important sources of gains to
banks that merge. However, it is unclear whether these gains come at the expense of bank customers.
Increases in market power could lead to higher prices, lower quality, and fewer financial products, but bank
mergers that improve the efficiency of the banking sector could weed out poorly-operated banks, force down
prices, and produce a more complete menu of financial products.1
We analyze the share price responses of commercial loan customers to bank merger announcements.
Borrowers are separated according to whether they are affiliated with the acquiring, target, or rival banks, and
average abnormal returns are computed for each group of borrowing firms. Theory of banking and
relationships suggests that not all firms will be similarly affected by the loss or alteration of a banking
1 For some firms, market power and efficiency improvements may have a counter-intuitive influence. Petersen and Rajan (1995) argue thatbanks require some form of market power to invest in the type of relationship lending important to small, informationally-opaqueborrowers. They show that these borrowers can actually benefit from increases in market power. Moreover, efficiency enhancementscould harm customers that previously benefited from underpriced loans made by inefficient banks.

2
relationship. Consequently, we examine the variation in abnormal returns across borrower and merger
characteristics, including a measure of how easily borrowers can switch bank relationships. Using a time-series
of bank relationship data and hazard function estimators, we calculate the propensity for a borrower to
terminate a bank relationship. If bank mergers result in increases in bank market power, then a firm with a high
propensity to switch bank relationships may be less susceptible to merger-induced reductions in borrower
welfare.
Our analysis produces four main results. First, corporate borrowers of target banks experience an
average abnormal return of –0.99 percent upon the merger announcement, while borrowers of acquiring and
rival banks experience no significant decline. Small target borrowers perform worse on average than large
target borrowers, particularly when the merger involves two large banks. Second, bank mergers cause
relationship exit rates to increase, but most of this increase is due to the influence of small bank mergers. Third,
a target borrower with a high propensity for switching bank relationships experiences a higher abnormal return
than one with a low propensity to switch. This suggests that lower switching costs and the availability of
substitute forms of financing shield some target borrowers from the adverse impact of bank mergers. Fourth,
we find weak (marginally significant) evidence that merger-induced increases in target borrower exit rates are
associated with lower abnormal returns. This may suggest that some target borrowers are pushed out of
relationships after a bank merger and suffer welfare losses accordingly.
Previous studies of the impact of mergers on industry competitiveness have analyzed three different
proxies for customer welfare. The first is the stock price reaction of rival firms to merger announcements within
an industry. This measure assumes that positive (negative) stock price reactions by rivals indicate a post-

3
merger decline (increase) in the competitiveness of the industry.2 Emphasizing the impact on rivals of a merger
is problematic because the relationship between rivals and their customers is not necessarily a zero-sum game.
For example, Jayaratne and Strahan (1997) and Calomiris and Karceski (2000) argue that large efficiency
gains within the banking industry partially accrue to customers so that zero or positive abnormal returns to rival
banks need not imply that customers are worse off. The second proxy is the change in product prices after a
merger.3 Using a data set of small Italian firms, Sapienza (1999) finds that loan rates fall after small in-market
bank mergers but rise after large bank mergers. Although changes in product prices provide clearer signals
about customer welfare, price is not the only product attribute that consumers care about. Service, quality,
selection, and availability are additional product dimensions that influence customer satisfaction. The third
proxy is the frequency that customers switch products. Post-merger increases in product switching may
indicate reduced customer satisfaction or that merged firms effectively drive out customers. For example,
Sapienza (1999) finds that exit rates for small borrowers of target banks increase after a bank merger and that
post-merger termination is unrelated to borrower profitability. Her interpretation is that management of newly-
merged banks effectively kick out some small borrowers. On the other hand, higher post-merger relationship
termination rates need not imply that customers are adversely affected. For example, the U.S. Department of
Justice Merger Guidelines interprets a high switching rate by customers as a signal of a competitive market or
the presence of close product substitutes.
By utilizing borrowing firm abnormal returns and exit rates, we attempt to address the shortcomings of
each of these three proxies. If markets are efficient, then abnormal returns provide direct signals about whether
2 Eckbo (1983, 1985), Stillman (1983), and Eckbo and Wier (1985) generally conclude that rivals do not benefit from mergers and interpret
this as evidence that mergers do not facilitate monopoly rents. James and Wier (1987) document a similar result for the bankingindustry.
3 Kim and Singal (1993) and Chevalier (1995) show that mergers in the airline and supermarket industries lead to price increases and arguethat increased market power dominates efficiency gains in these two sectors. Moreover, Prager and Hannan (1998) show that depositrates fall as a result of U.S. bank mergers that occasion substantial increases in local market concentration.

4
bank mergers help or hurt shareholders of borrowing firms. These abnormal returns also capture the net
welfare impact of the bank merger, including the influence of all expected changes in price, quality, service, and
availability on the borrower. Moreover, by relating borrower stock price responses to merger-induced
changes in switching behavior, we can establish whether increased exit rates enhance or reduce borrower
value.
To conduct our analysis, we collect data on Norwegian bank mergers from 1983 to 1996. Data from
Norway offer several distinct advantages. First, we can easily observe the identities of a set of firm-bank
relationships through time. In the U.S. and many other countries, such information is either confidential or
difficult to obtain. Second, because the relationship information is for exchange-listed firms, we can measure
stock price changes around bank merger announcements. Studies using relationship data from privately-held
firms cannot estimate abnormal returns. Third, commercial debt in Norway comes almost exclusively from
banks, and the majority of borrowers in our sample maintain only one bank relationship at any given time. In
addition, U.S. banking bears a closer resemblance to Norwegian banking than it does to the keiretsu-based
lending relationships in Japan or the house-bank relationships in Germany.4 Thus, Norway offers a setting
where bank relationships should be important to firms in ways that are directly comparable to the U.S.
The rest of the paper proceeds as follows. Section 2 describes the data sources and provides some
background about bank merger activity in Norway. Section 3 examines the stock price impact of bank merger
announcements on borrowers of merging and rival banks. Section 4 models the termination behavior of
borrowing firms and relates the propensity to terminate to borrower abnormal returns. Section 5 concludes.
4 Banks in Germany and Japan can exert substantial control over firm decision-making through equity interests and proxy voting rights.For descriptions of how the welfare of banks and borrowers are related in these countries, see Hoshi, Kashyap, and Scharfstein (1991),Kang and Stulz (2000), and Gorton and Schmid (1999). Norwegian banking regulation prohibits a bank from taking an equity position ina non-financial firm greater than 1% of the bank’s asset value.

5
2. Background and Data
The evolution of Norwegian banking over the last two decades has evolved along a path similar to U.S.
banking. Between 1983 and 1987, Norwegian regulatory authorities lifted interest rate and loan quantity
controls, relaxed branching restrictions, allowed for more flexible forms of bank capital, and opened Norway
to competition from foreign and newly-created domestic banks.5 Deregulation resulted in intensified
competition among Norway's banks and led to expansionary lending policies. In an effort to grow, banks
began to merge. Bank mergers continued through the late 1980s and early 1990s, fueled in part by rescue
efforts during a four-year financial crisis that began in 1988.6 By 1993, the crisis had subsided, but new
regulations under the European Union (EU) and European Economic Area (EEA) enabled banks to expand
freely across borders. Such liberalization measures continued to pressure Norwegian banks to increase their
scale through consolidation.
Our data set includes a set of bank merger announcements, a historical record of bank relationships for
firms listed on the Oslo Stock Exchange (OSE), and financial and stock price information on OSE-listed banks
and firms. We collect all merger announcements made from 1983 to 1996 by banks with commercial
customers in Norway. Our sources for the announcements are two Norwegian newspapers, Aftenposten and
Dagens Næringsliv, and various periodicals archived on the Dow Jones Interactive system. We match the
announcements with annual information on firm-bank relationships. Firms listed on the OSE are required each
year to report their “primary” bank relationships in the publication . We use the time
5 In 1984, regulatory officials allowed foreign banks to establish wholly-owned subsidiary banks in Norway. Seven international banks
responded (1994 Annual Report for the Banking, Insurance, and Securities Commission of Norway). Authorities also approved thecreation of a new domestic commercial bank for the first time since 1961. Between 1984 and 1986, a total of four new domesticcommercial banks were created in Norway (1995 Annual Report for the Banking, Insurance, and Securities Commission of Norway).
6 See Ongena, Smith, and Michalsen (1999) for a detailed description of the Norwegian banking crisis.

6
series of these relationships compiled by Ongena and Smith (2000). Kierulf’s Handbook and OSE databases
provide all accounting and stock price information on sample firms and banks.
Table 1 provides an annual overview of the total number of banks and OSE-listed firms, bank
consolidation activity, the number of relationship terminations, and bank industry concentration in our sample.
The Appendix lists the identity of the merging banks, the announcement dates, the number of borrowers
associated with the acquirer and target, and other merger attributes. Each year we track an average of 21
banks and 115 OSE firms that have relationships with at least one bank (each firm maintains a relationship with
an average of 1.33 banks). The banks include all Norwegian commercial banks, large Norwegian savings
banks, international banks operating in Norway, and international banks operating outside of Norway that have
reported relationships with our sample firms. Our borrowing firms represent 95 percent of all non-bank OSE-
listed firms and account for an even larger fraction of total market capitalization. We collect information on 39
bank merger announcements, 23 of which were eventually completed. Across the 39 mergers, we obtain 520
acquirer borrower observations, 78 target borrower observations, and 3,571 rival borrower observations. On
average, 4.5 percent of existing bank relationships are terminated annually, but roughly double that amount are
added as new relationships each year. By U.S. standards, bank relationships in Norway are concentrated, but
not so relative to other Nordic countries.7 To formally measure industry concentration, we calculate a
Herfindahl-Hirschman Index (HHI) based on the proportion of total relationships maintained by each sample
bank. During our sample period, the level of HHI ranges from 1,961 to 3,262. The U.S. Department of
Justice Merger Guidelines considers any HHI above 1,800 as signifying a highly concentrated market.
7 On average, 75 percent of sample firms maintain a relationship with at least one of Norway’s two largest commercial banks, Christiana
Bank og Kreditkasse or Den norske Bank. Measured in 1997 assets, the four-firm bank concentration ratio in Norway is 45 percent,compared with 85 percent in Sweden, 71 percent in Finland, and 90 percent in Denmark (Kredittilsynets tilraadning tilFinansdepartementet, 3/18/99).

7
Summary statistics for acquiring and target banks and their OSE-listed borrowing firms are presented
in Table 2. The median-sized acquiring bank (40.9 billion Kroner or about $5.8 billion in total assets) is more
than five times as large as the median-sized target bank (7.5 billion Kroner or about $1 billion). For acquiring
(target) banks, 14 (41) percent have assets between $100 million and $1 billion, 50 (55) percent have assets
between $1 billion and $10 billion, and 36 (4) percent have assets greater than $10 billion (not reported in
Table 2). Compared to borrowers of target banks, the borrowers of acquiring banks are larger (median annual
sales of 683 million Kroner versus 361 million Kroner), more profitable (median operating income to book
value of assets of 5.29 versus 3.11), older (median age of 64 years versus 46 years), and more likely to
maintain multiple bank relationships (the fraction with multiple bank relationships is 0.52 versus 0.36). The
firms in our sample are small compared to U.S. stocks traded on the NYSE but much larger than the Italian
firms studied by Sapienza (1999).8 Since many Norwegian firms maintain only one bank relationship at a time,
it is reasonable to expect that losing a Norwegian bank relationship due to a bank merger is a material event for
a borrowing firm.9 In contrast, the average firm in Sapienza’s (1999) Italian data set maintains nine bank
relationships, making it less likely that the loss of any single Italian bank relationship would have any significant
adverse impact on the firm.
3. The Wealth Impact of Bank Merger Announcements
In this section, we examine the stock price response of borrowers to announcements that their banks are
merging, sorting these firms by borrower size, merger size, and bank affiliation (acquirer, target, or rival).
8 Based on 1996 NYSE market capitalization breakpoints, 59 percent of our borrowing firms are in the smallest size decile, 33 percent are
in the next four size deciles, and 8 percent are larger than the median-sized NYSE firm. Median sales for Sapienza’s (1999) Italianborrowers are about $8 million compared with median sales of $58 million for borrowing firms in our Norwegian data set.
9 On average, 74 percent of our sample firms maintain a relationship with only one bank, 17 percent maintain a relationship with twobanks, 7 percent maintain three bank relationships, and only 2 percent maintain four or more bank relationships.

8
Patterns in bank abnormal returns resulting from mergers are well documented in the literature.10 Studies have
found that bank abnormal returns vary according to whether the bank is the acquirer, target, or a rival, as well
as by the bank’s size and strategic focus. There is good reason to believe that borrower abnormal returns will
also vary by these characteristics. For instance, efficiency considerations may dictate that merged banks take
on the strategic focus of acquired banks (see Peek and Rosengren (1998) and Walraven (1997)). Therefore,
a merger can harm some target borrowers by simply altering the lending policies of the target bank. Moreover,
Peek and Rosengren (1996), Berger, Scalise, Saunders, and Udell (1998), and Strahan and Weston (1998)
show that bank financing often tends to be characterized by a “size effect in lending,” where small banks cater
to small borrowers and large banks cater to large borrowers. These studies show that large mergers are
followed by increases in lending to large firms, while small mergers are associated with increased lending to
small firms. Where a size effect in lending exists, small borrowers face the possibility of being “squeezed out”
by mergers that substantially increase bank size.
3.1 Estimating individual security and portfolio abnormal returns
We estimate daily abnormal returns using market model regressions. To reduce problems associated with
contemporaneously correlated errors, we form equally-weighted portfolios of firms sharing a common event
date.11 We regress the daily returns on event portfolio j, rjt, on a measure of the market return, rmt, and a set of
daily event dummies, δ jkt, that take the value of one when day t is inside the event window and zero otherwise,
10 For example, see James and Wier (1987), Cornett and De (1991), Houston and Ryngaert (1994), Becher (1999), DeLong (1999), Kane
(1999), and Houston, James, and Ryngaert (2000). Berger, Demsetz, and Strahan (1999) provide a recent overview of the literature onthe gains to banks in mergers and Cybo-Ottone and Murgia (2000) present recent event study evidence using European data.
11 Another motivation for forming event portfolios is that the distribution of the number of borrowers associated with each merger event isuneven. For example, in the merger between Bergen Bank and Den norske Creditbank announced on October 5th 1989, there are 23 OSE-listed firms associated with the target. In contrast, we have 15 bank merger events where the target bank has only one OSE-listedborrower. Consequently, if we equally weight each target borrower observation, the Bergen Bank/Den norske Creditbank merger wouldreceive more weight than fifteen other mergers combined.

9
jtk
jktjkimtiji
jjt rr εδγβα +++= ∑∑−=
+−=
7
7
3
3
, t = -157, -169, ..., 107. (1)
Dates inside the event window are indexed by k. Our event window contains 15 trading days (three weeks).
The coefficients jkγ measure daily abnormal returns during the event period. The market model is estimated
over a 265-day period starting 157 days before the event and ending 107 days after the event. We consider
three proxies for the market return—a value-weighted index of all OSE stocks, an equally-weighted OSE
index, and a world market index.12 Results are similar using each of these benchmarks, so we report statistics
for only the value-weighted OSE index. Because non-traded stocks are fairly common on the OSE, we
include three lead and three lagged market returns to correct for non-synchronous trading (see Scholes and
Williams (1977)).
Cumulative abnormal returns (CARs) are computed as sums of daily abnormal return estimates jkγ̂ .
We report CARs for three different event windows, the announcement day by itself [AR(0)], an eight-day
period up to and including the announcement day [CAR(-7,0)], and the seven-day period after the
announcement day [CAR(+1,+7)].13 In discussing our results, we emphasize the abnormal returns leading up
to and including the announcement day, i.e. AR (0) and CAR(-7,0), but also report the post-announcement
CARs for completeness. We use a seemingly unrelated regression (SUR) framework for reporting average
abnormal returns across events.14
12 The world market index is a value-weighted portfolio of Datastream total return indices for the U.S., Japan, U.K., and Germany.13 To date, bank merger event studies have focused on the share responses of banks, but the literature has not come to a consensus
agreement on which event window best captures the real economic effect. For example, James and Wier (1987) use AR(-1), AR(0),CAR(-1,0), CAR(-4,0), CAR(-15,0), and CAR(-15,+15); Cornett and De (1991) consider each day from –15 to +15; Houston andRyngaert (1994) use an event window that starts four days prior to the first announcement of an intention to merger and ends on themerger agreement date; Becher (1999) uses CAR(-30,+5); and Kane (1999) uses AR(0).
14 See Thompson (1985). We form portfolios for a particular category (such as the 21 events that involve target borrowers) by stackingthe event regressions from equation (1) into an N x 1 matrix, where N is the number of events included in the portfolio. Each portfolioCAR estimate is a weighted average of the individual event abnormal returns with weights proportional to the inverse of the variance ofthe event residuals. Although not reported, calculating average CARs by equally-weighting event abnormal returns yields similar results.
10
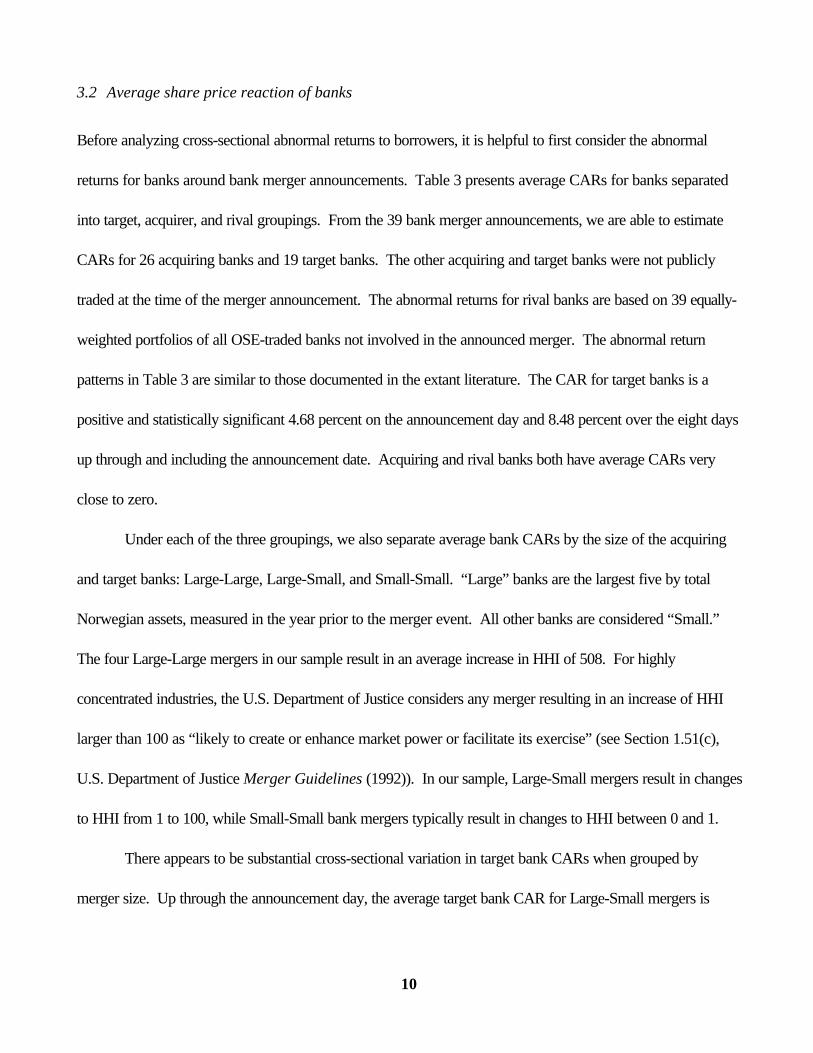
3.2 Average share price reaction of banks
Before analyzing cross-sectional abnormal returns to borrowers, it is helpful to first consider the abnormal
returns for banks around bank merger announcements. Table 3 presents average CARs for banks separated
into target, acquirer, and rival groupings. From the 39 bank merger announcements, we are able to estimate
CARs for 26 acquiring banks and 19 target banks. The other acquiring and target banks were not publicly
traded at the time of the merger announcement. The abnormal returns for rival banks are based on 39 equally-
weighted portfolios of all OSE-traded banks not involved in the announced merger. The abnormal return
patterns in Table 3 are similar to those documented in the extant literature. The CAR for target banks is a
positive and statistically significant 4.68 percent on the announcement day and 8.48 percent over the eight days
up through and including the announcement date. Acquiring and rival banks both have average CARs very
close to zero.
Under each of the three groupings, we also separate average bank CARs by the size of the acquiring
and target banks: Large-Large, Large-Small, and Small-Small. “Large” banks are the largest five by total
Norwegian assets, measured in the year prior to the merger event. All other banks are considered “Small.”
The four Large-Large mergers in our sample result in an average increase in HHI of 508. For highly
concentrated industries, the U.S. Department of Justice considers any merger resulting in an increase of HHI
larger than 100 as “likely to create or enhance market power or facilitate its exercise” (see Section 1.51(c),
U.S. Department of Justice Merger Guidelines (1992)). In our sample, Large-Small mergers result in changes
to HHI from 1 to 100, while Small-Small bank mergers typically result in changes to HHI between 0 and 1.
There appears to be substantial cross-sectional variation in target bank CARs when grouped by
merger size. Up through the announcement day, the average target bank CAR for Large-Small mergers is

11
substantially higher than the average CARs for the other two merger sizes. For example, the average target
bank CAR(-7,0) for Large-Small mergers is 12.98 percent, compared with –2.76 percent for Large-Large
mergers and –0.30 percent for Small-Small mergers. Unfortunately, we have valid target bank return data for
only one Large-Large merger, so the abnormal return estimate for this segment of banks is imprecise. In
addition, this merger was announced simultaneously with an earnings warning from bank management and a
credit warning from Standard & Poor’s.15
3.3 Average share price reaction of borrowers
As illustrated in the Appendix, many of the bank mergers in our sample involve only a few, if any, publicly-
traded target borrowers because the target banks are often small. Moreover, although acquiring borrower
observations are spread evenly throughout the data set, target borrowers are not. Out of the 78 target
borrower observations, 54 are associated with four Large-Large merger events. The small sample of targets
outside of the Large-Large mergers limits the statistical power of some of the tests. However, our sample
compares favorably to other studies of borrower stock price reactions to news concerning bank’s durability.
For example, in their study of borrowers’ reactions to bank announcements of distress, Slovin, Sushka, and
Polonchek (1993) establish their main result that corporate borrowers are bank stakeholders whose welfare is
tied to their affiliated bank’s durability using a sample of one bank and 29 borrowers.
Table 4 reports the average event portfolio CARs for borrowing firms that maintain relationships with
merging and rival banks. “Small” (“Large”) borrowers are those ranked below (at or above) median sales in
15 On October 5th 1989, Bergen Bank announced an agreement to acquire Den norske Creditbank to form the largest bank in Norway. On
the same day, Den norske Creditbank released an interim earnings announcement detailing increases to estimated losses on loans andguarantees (see “Den norske Creditbank reports interim results,” PR Newswire, 10/05/89). Moreover, S&P CreditWatch put bothbanks on their surveillance list as “negative,” warning that “the merger comes at a time when each bank is seeking to recover from aperiod of financial difficulties with credit losses at very high levels by international standards” (see “S&P puts Bergen Bank Corp. on
, 10/06/89). Investors were also apparently disappointed that governmentregulators thwarted plans for Bergen Bank to merge with the healthier Christiania Bank og Kreditkasse instead of Den norske Creditbank(see “Two big banks in Norway agree to negotiate merger,” Wall Street Journal, 10/06/89).

12
the year prior to the bank merger announcement. Announcement-day CARs indicate that on average,
borrowers of acquiring and rival banks experience little share price reaction, while target borrowers experience
a statistically significant decline in value of 0.99 percent. The average effect on target borrowers is mainly
driven by the reaction of small target borrowers in Large-Large mergers. These borrowers experience an
abnormal return of –2.90 percent on the day the merger is announced. Small target borrowers fare better in
Small-Small mergers, averaging 5.50 percent over the (-7,0) event window, and appear not to be harmed by
Large-Small mergers. Merger size influences large target borrowers in a much different way than small target
borrowers. Large target borrowers are unaffected by Large-Large bank mergers, but experience an average
CAR(-7,0) of –5.53 percent for Small-Small mergers, though we have only two observations for that category.
The abnormal returns to acquiring bank borrowers remain close to zero across all firm and bank size
categories, and rival bank borrower abnormal returns are economically and statistically negligible.
The target borrower results provide some insight into the importance of the size effect in lending. The
abnormal return patterns are consistent with Berger et al. (1998) who find that lending to small customers
increases after mergers between small banks and falls after large bank mergers. Strahan and Weston (1998)
also show that lending to small customers rises after small bank mergers, but find no decrease in lending after
large mergers. Peek and Rosengren (1996) and Berger and Udell (1996) find that acquisitions by large banks
lead to a reduction in lending to smaller corporate customers. However, our results do not indicate that small
firms borrowing from small banks suffer when a larger rival acquires their bank. Instead, small target
borrowers are hurt in Large-Large mergers but appear to benefit from Small-Small bank mergers.
To summarize the empirical results thus far, borrowing firms of acquiring and rival banks experience
average abnormal returns close to zero, but target borrower equity value falls by an average of one percent

13
when banks announce their intent to merge. This reduction in borrower welfare occurs as target banks
experience significantly positive announcement returns. Moreover, target borrower abnormal returns vary
according to borrower size and merger size. Small borrowers of target banks experience an average price
decline of 1.67 percent across all mergers, but when the merger involves two large banks, the average
abnormal return decline is 2.90 percent.
4. Borrower Welfare and the Propensity to Switch
Merger-induced changes in strategy, personnel, or location could impair valuable lending relationships that have
been cultivated over time, but the damage done to a borrowing firm from relationship disruption ultimately
depends on how easy (costly) it is for the firm to switch banking relationships. If bank mergers are damaging
to firms, borrowers with low switching costs should experience higher merger-induced abnormal returns than
borrowers with high switching costs. Fama (1985), Sharpe (1990), and Rajan (1992) argue that switching
costs are lower for firms with alternative sources of financing or that can easily communicate their value to a
new lender.
So far, we have sorted borrower abnormal returns by bank affiliation, borrower size and merger size--
variables found to be relevant in the bank merger literature. In this section, we investigate the influence of
switching behavior on borrower welfare. We estimate the termination behavior of borrowers using a hazard
function that depends on the duration of a bank relationship and other firm- and relationship-specific
characteristics. From this hazard model, we calculate a borrower’s “termination propensity,” which serves as
a proxy for borrower switching costs. Abnormal returns are regressed on firm characteristics, merger
characteristics, and termination propensity to analyze the influence of switching costs on borrower welfare.

14
Our analysis is complicated by the fact that a bank merger itself can have a direct effect on relationship
termination rates. Bank mergers may serve as a natural time to re-evaluate lending relationships, and the
welfare consequences of merger-induced changes in termination behavior are unclear. For instance, as
Sapienza (1999) argues, higher post-merger exit rates by borrowers could indicate that new bank management
forces some borrowers out and that these borrowers are injured accordingly. Conversely, if the services at the
merged bank decline or become more costly, exit rates could increase as firms with low switching costs leave
for a more favorable alternative. In the former case, those forced to leave the bank are worse off than those
remained. In the latter case, borrowers that leave the bank are better off than those that stay. To address this
issue empirically, we examine how a merger’s influence on termination rates is related to borrower abnormal
returns.
4.1 Estimating switching behavior
We model borrower termination behavior using proportional hazard models.16 We use hazard functions to
estimate the probability that a firm will switch banks, conditional on the incumbent relationship surviving through
some date t. Greenbaum, Kanatas, and Venezia (1989), Sharpe (1990), and Rajan (1992) argue that
switching costs will be related to the amount of time a firm has spent in a bank relationship. The proportional
hazard function conveniently summarizes the connection between relationship duration and the likelihood of
terminating the relationship, and allows for other explanatory variables to independently influence the switching
decision. Our specification assumes that the time spent in a bank relationship can be described by a Weibull
distribution. The Weibull is common to hazard rate specifications because it allows for switching likelihood to
depend monotonically on duration through a single parameter, α. When α > 1 (< 1), the distribution is said to
16 Kalbfleisch and Prentice (1980) and Lancaster (1990) thoroughly discuss hazard rate estimation.
15
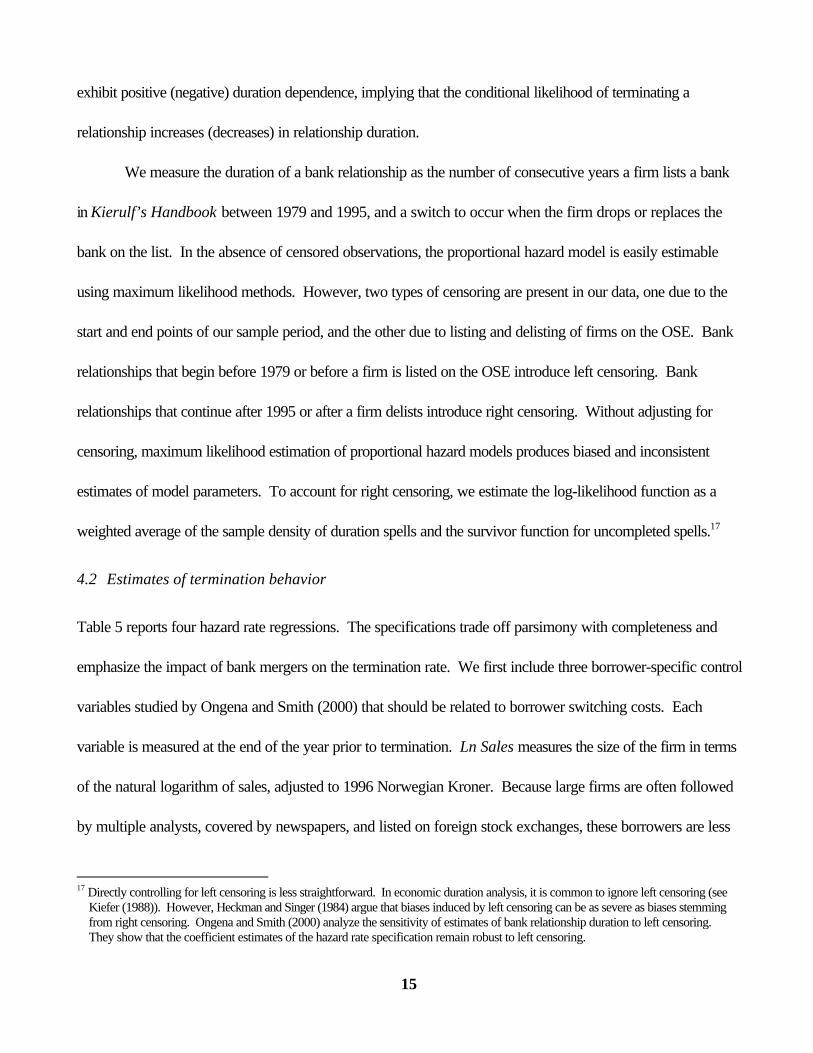
exhibit positive (negative) duration dependence, implying that the conditional likelihood of terminating a
relationship increases (decreases) in relationship duration.
We measure the duration of a bank relationship as the number of consecutive years a firm lists a bank
in Kierulf’s Handbook between 1979 and 1995, and a switch to occur when the firm drops or replaces the
bank on the list. In the absence of censored observations, the proportional hazard model is easily estimable
using maximum likelihood methods. However, two types of censoring are present in our data, one due to the
start and end points of our sample period, and the other due to listing and delisting of firms on the OSE. Bank
relationships that begin before 1979 or before a firm is listed on the OSE introduce left censoring. Bank
relationships that continue after 1995 or after a firm delists introduce right censoring. Without adjusting for
censoring, maximum likelihood estimation of proportional hazard models produces biased and inconsistent
estimates of model parameters. To account for right censoring, we estimate the log-likelihood function as a
weighted average of the sample density of duration spells and the survivor function for uncompleted spells.17
4.2 Estimates of termination behavior
Table 5 reports four hazard rate regressions. The specifications trade off parsimony with completeness and
emphasize the impact of bank mergers on the termination rate. We first include three borrower-specific control
variables studied by Ongena and Smith (2000) that should be related to borrower switching costs. Each
variable is measured at the end of the year prior to termination. Ln Sales measures the size of the firm in terms
of the natural logarithm of sales, adjusted to 1996 Norwegian Kroner. Because large firms are often followed
by multiple analysts, covered by newspapers, and listed on foreign stock exchanges, these borrowers are less
17 Directly controlling for left censoring is less straightforward. In economic duration analysis, it is common to ignore left censoring (see
Kiefer (1988)). However, Heckman and Singer (1984) argue that biases induced by left censoring can be as severe as biases stemmingfrom right censoring. Ongena and Smith (2000) analyze the sensitivity of estimates of bank relationship duration to left censoring.They show that the coefficient estimates of the hazard rate specification remain robust to left censoring.

16
likely to have problems credibly communicating their value to potential new investors than small firms.
Profitability is the ratio of firm earnings before interest and taxes to the book value of assets, included as a
proxy for the level of internal cash flows. Firms with higher internal cash flows should be less dependent on any
one bank’s financing, making switching easier. Multiple Relationships is a dummy variable that equals one if a
firm maintains more than one simultaneous bank relationship and zero otherwise. Firms with multiple bank
relationships have more than one potential source of inside bank financing and therefore face lower switching
costs.
Next, we include variables relevant to bank merger activity and the level of market concentration.
Annual ∆HHI, measured as the change in HHI (divided by 100) in the year prior to termination, captures the
impact of changes in market concentration on all firms, including those not involved in a merger. Merger is a
dummy variable indicating whether or not a bank merger has occurred during a borrower’s relationship with its
bank. We use two definitions for Merger that make different assumptions about how long bank mergers have
an effect on exit rates. Merger < ∞ (used in Models (1) and (2) in Table 5) takes the value of one when a
bank merger occurs at any point during the relationship, allowing mergers to influence any future decisions
made about terminating a relationship. Merger ≤ 3 (used in Models (3) and (4)) takes the value of one when a
merger occurs in the three-year period prior to termination, so bank mergers only affects exit rates in the
subsequent three years. Both researchers and practitioners have argued that three years is a reasonable
gestation period for restructuring to occur following a bank merger (see Berger et al. (1998), pp. 196-197).
We include two interaction variables that allow the impact of Merger to vary by size of the borrower
and merger. Large Firm is a dummy variable that equals one when a firm’s market capitalization is greater
than or equal to the median-sized firm, measured by sales in the year prior to termination. ∆HHI is the specific

17
change in market concentration created by the merger, divided by 100. When ∆HHI *Merger and Merger
are both included in the specification, the coefficient on Merger estimates the impact of small mergers on the
hazard rate (since Small-Small mergers have ∆HHI very close to zero). Similarly, when we interact Large
Firm with Merger and ∆HHI *Merger, the coefficient on the stand-alone variable Merger reflects the impact
of the merger on small borrowers in small mergers.
Holding duration constant, the likelihood of ending a bank relationship decreases in firm size and is
higher for multiple-bank firms. The estimate of α is greater than one, implying that the likelihood of switching
banks increases in the duration of the relationship. Similar to Ongena and Smith (2000), these results suggest
that the propensity to terminate is higher for small firms, firms with multiple bank relationships, and firms in
relatively long-lived relationships. Annual ∆HHI enters all regressions with a positive and statistically significant
coefficient, implying that increases in market concentration induce all sample firms to switch more often.
However, Annual ∆HHI is not significant when we explicitly incorporate time variation into the exogenous
variables.18
In Models (1) and (2), Merger < ∞ has a positive but statistically insignificant impact on the estimated
hazard rate, indicating that over the entire span of a bank relationship small bank mergers have little effect on
exit rates. However, large mergers significantly reduce switching rates. For example, using Model (2), a
borrower who is never involved in a bank merger but is otherwise average has a 5.10 percent chance of
terminating a relationship in any given year. Following a large bank merger, this termination likelihood declines
to 2.94 percent. When we limit the impact of the merger to three years (Models (3) and (4)), we find that
small mergers significantly increase the likelihood that a firm will leave its bank. But as the size of the bank
merger increases, firms become less likely to leave. For instance, using Model (4), an average firm not

18
involved in a merger faces a switching probability of 4.67 percent per year. This likelihood increases to 15.66
percent after a small merger, but increases to only 5.26 percent after a large merger. Interactions with the
Large Firm variable produce no statistically significant effects. Taken together, the hazard models suggest that
borrowers involved in smaller bank mergers switch more often than those in large bank mergers.
4.3 Borrower welfare and switching behavior
Table 6 reports regressions that investigate the cross-sectional variation in individual borrower abnormal
returns. The cross-sectional regressions include explanatory variables that measure a firm’s dependence on its
incumbent bank’s financing and the size of the merger in terms of its impact on bank market concentration. The
specifications also split forecasted hazard rates into a pre-merger component that includes the influence of firm,
relationship, and market-wide variables on termination behavior, and a component that incorporates merger-
induced changes to the hazard rate. For each regression, the dependent variable is the borrower CAR
generated from the market model in equation (1) on a firm-by-firm basis. For targets, we report results using
three different measures of the dependent variable, CAR(-7,0), AR(0), and CAR(+1,+7). For acquirer and
rival borrowers, we report only the CAR(-7,0) results.
The regressions include up to seven explanatory variables, grouped into three categories. The first
category contains three firm-specific control variables, ln Sales, Profitability, and Multiple Relationships,
motivated in Section 4.2 as proxies for a firm’s dependence on financing from its bank. The second category
contains two merger-specific control variables, including ∆HHI to capture merger size and ∆HHI*Large Firm
to measure the differential impact of merger size on small versus large firms. The third category contains two
variables based on Model (4) of Table 5 to generate firm-level forecasts of the hazard rate. Termination
18The estimates we report could be biased if the paths of the explanatory variables are correlated with bank relationship duration. To
correct for potential biases, we re-estimated all hazard rate models using a methodology that allows for time variation in the explanatoryvariables (see Petersen (1986)). With the exception of Annual ∆HHI, all other estimates remain robust.

19
Propensity captures the estimated pre-merger switching rate and proxies for how easily a borrower can switch
bank relationships. It is calculated by setting each variable (ln Sales, Profitability, Multiple Relationships,
Annual ∆HHI) and relationship duration equal to the specific borrower’s values in the year prior to the
announcement and Merger equal to zero. ∆Termination Propensity captures the merger-induced change in
switching rates and is estimated as the difference between Termination Propensity and the forecasted post-
merger hazard rate that sets Merger equal to one and includes the relevant values for ∆HHI and Large Firm.
Because the firm-specific and merger-specific control variables also appear in the forecast models for
Termination Propensity and ∆Termination Propensity, their inclusion is meant to measure any additional
impact that merger size has on borrower welfare that is unrelated to the propensity to terminate.
For the (-7,0) event window, Models (1), (2), (7), and (8) of Table 6 suggest that when target
borrowers and acquiring borrowers have multiple bank relationships, their abnormal returns are higher. These
models also show that small acquiring borrowers and more profitable target borrowers experience higher
abnormal returns as well. With the inclusion of ∆HHI and ∆HHI*Large Firm, the negative sign on ln Sales
highlights the result from Table 4 that small firms perform better than large firms in Small-Small bank mergers.
However, none of the firm-specific control variables are significant for announcement-day returns (Models (3)
and (4)).
In contrast, the effect of merger-specific variables on target borrower abnormal returns is more robust
across model specifications. Consistent with Table 4, target borrower abnormal returns are negatively related
to the merger-induced change in market concentration. Furthermore, small target borrowers are harmed more
than large target borrowers in large bank mergers. The coefficient of –1.62 on ∆HHI in Model (2) means that
a change in ∆HHI of 5 (i.e., moving from a typical Small-Small to Large-Large merger) reduces the abnormal

20
return on small firms by 8.10 percent, while the estimate of 0.71 on ∆HHI*Large Firm means that the
abnormal return on large firms falls by only 4.55 percent.
Although not reported, we estimate cross-sectional models that include the abnormal return of each
borrower’s affiliated bank as well as the abnormal return of the entire Norwegian banking industry as
explanatory variables. We do this to see if there is a link between the welfare of the borrowing firm and its
incumbent bank when a bank merger is announced. On average, target banks experience positive abnormal
returns and target borrowers experience negative abnormal returns upon the announcement of a bank merger,
so we would like to see if target borrowers lose the most when target banks gain the most. The coefficient
estimates on both bank CAR variables are statistically insignificant for CAR(-7,0) and AR(0) for both target
and acquiring borrowers, so these cross-sectional tests do not permit us to conclude that target banks gain at
the expense of their borrowers.
Table 6 indicates that borrower switching behavior can influence abnormal returns. For target
borrowers, Termination Propensity enters with a positive coefficient that is statistically significant for both
CAR(-7,0) and AR(0), implying that firms with lower switching costs earn higher abnormal returns than firms
with higher switching costs. The coefficient estimate of 1.56 in Model (2) means that moving from a target
borrower with a termination propensity at the 25th percentile (1.32 percent, see Table 2) to one with a
forecasted hazard rate at the 75th percentile (3.81 percent) increases the estimated CAR (-7,0) by 3.88
percent. The coefficient on ∆Termination Propensity for the target borrower regressions is –0.25 and
marginally significant (p-value equals 13 percent) in Model (4). Moving from a target firm at the 25th
percentile value of ∆Termination Propensity (-1.28 percent) to the 75th percentile (10.26 percent) translates
to a decrease in abnormal returns of 2.89 percent. Thus, although less statistically convincing, the estimates on

21
∆Termination Propensity suggest that, at the margin, merger-related increases in the propensity to terminate a
relationship work to decrease borrower abnormal returns. This result supports the idea that the more a bank
merger causes a borrower’s termination propensity to increase, the more the borrower is harmed. The signs of
the coefficients on Termination Propensity and ∆Termination Propensity carry over to acquiring borrowers,
though the magnitudes of these estimates are smaller and statistically insignificant.19
To summarize, we find that firms become more likely to terminate a relationship in the three-year
period after a merger, particularly when the merger involves two small banks. Target borrowers with higher
pre-merger propensities to terminate bank relationships are more insulated from the negative welfare
consequences of bank mergers. Finally, the target borrower loses more equity value when the bank merger
causes a large increase in its exit rate.
5. Conclusion
We directly estimate the impact of bank mergers on customer welfare by analyzing the share price reactions of
corporate borrowers in Norway to the announcement that their banks are merging. We also analyze the
influence of bank mergers on the switching behavior of borrowers and relate the borrower’s propensity to
terminate a bank relationship to its announcement-day abnormal return. The Norwegian firms in our study are
small by U.S. standards (about 60 percent of them would be in the smallest size decile based on 1996 NYSE
market capitalization breakpoints) but are large compared to the privately-held firms examined by Sapienza
(1999). Our firms operate in an environment where bank credit is the predominant form of commercial debt
19 To verify the robustness of the cross-sectional regressions reported in Table 6, we change the model specifications in a number of ways,
including (1) removing ln Sales, Profitability, and Multiple Relationships, (2) adding the CAR of the borrower’s affiliated bank andthe CAR of the rival bank portfolio (to proxy for bank industry effects), and (3) using other hazard models such as Models (1)-(3) inTable 5, their time-varying counterparts as described in footnote 18, and hazard models that explicitly distinguish between acquiring andtarget borrowers.

22
finance, and most firms receive credit from only one bank. In many other respects, the institutional setting in
Norway is similar to the U.S.
We find four main empirical results. First, the average abnormal stock price response of borrowers of
acquiring and rival banks is close to zero at the announcement of a bank merger, but target borrowers
experience an average stock price decline of one percent. Moreover, abnormal returns are lowest (-2.90
percent) for small borrowers of the target when two large banks merge. Since target banks experience positive
abnormal returns (4.68 percent) on the merger announcement day, it raises the suspicion that target banks are
somehow taking advantage of their borrowers during mergers. However, when the target bank CAR is
included in the cross-sectional regressions of target borrower abnormal returns, the coefficient is not statistically
different from zero, implying that target banks are not gaining at the explicit expense of their borrowers. The
fact that small borrowers of target banks are harmed in Large-Large bank mergers but fare well in Small-Small
bank mergers is consistent with the idea that borrowers are injured by a change in strategic focus of the newly-
merged bank (see Berger, et al. (1998), Peek and Rosengren (1996), and Strahan and Weston (1998)).
Patterns in borrower abnormal returns are not consistent with a standard market power story of merger gains
to banks. In particular, borrowers of acquiring and rival banks do not appear to suffer upon the announcement
of a large bank merger.
Second, borrowing firms tend to terminate bank relationships more often in the three-year period after
a bank merger, especially when the merger is small. When bank mergers occur, both banks and borrowers
may consider these events as opportune times to re-evaluate and perhaps terminate their existing relationships.
Third, target borrowers that switch banks often are less negatively affected by bank merger

23
announcements, indicating that relationship disruption caused by bank mergers has less of an adverse effect on
firms that switch banks often. We interpret a borrower’s pre-merger hazard rate as a proxy for the firm’s
switching costs. Thus, target borrowers with lower switching costs are not harmed as much when a bank
merger is announced.
Fourth, we find weak (marginally statistically significant) evidence that target borrowers whose exit
rates increase substantially due to a bank merger have lower abnormal returns. This provides a measure of
support for Sapienza’s (1999) claim that borrowers of target banks are more likely to be “severed” after their
bank merges, harming these borrowing firms in the process.

24
References
Becher, D. A., 1999, The valuation effects of bank mergers, forthcoming in Journal of Corporate Finance.
Berger, A. N., A. Saunders, J. M. Scalise, and G. F. Udell, 1998, The effects of bank mergers andacquisitions on small business lending, Journal of Financial Economics 50, 187-229.
Berger, A. N., and G. F. Udell, 1996, Universal banking and the future of small business lending, in A.Saunders and I. Walters (eds.), Financial System Design: The Case for Universal Banking,Homewood, IL: Irwin Publishing.
Berger, A. N., R. S. Demsetz, P. E. Strahan, 1999, The consolidation of the financial services industry: causes,consequences, and implications for the future Journal of Banking and Finance 23, 135-194.
Calomiris, C. W., and J. Karceski, 2000, Is the bank merger wave of the 1990s efficient?: Lessons from ninecase studies, in S. N. Kaplan (ed.) Mergers and Productivity, Chicago: University of Chicago Press.
Chevalier, J. A., 1995, Do LBO supermarkets charge more? An empirical analysis of the effects of LBOs onsupermarket pricing, Journal of Finance 50, 1095-1112.
Cornett, M. M., and S. De, 1991, Common stock returns in corporate takeover bids: Evidence from interstatebank mergers, Journal of Banking and Finance 15, 273-295.
Cybo-Ottone, A., and M. Murgia, 2000, Mergers and shareholder wealth in European banking, Journal ofBanking and Finance 24, 831-859.
DeLong, G. L., 1999, Stockholder gains from focusing versus diversifying bank mergers, forthcoming inJournal of Financial Economics.
Eckbo, B. E., 1983, Horizontal mergers, collusion, and stockholder wealth, Journal of Financial Economics11, 241-273.
Eckbo, B. E., 1985, Mergers and the market concentration doctrine: Evidence from the capital market,Journal of Business 58, 325-349.
Eckbo, B. E., and P. Wier, 1985, Antimerger policy under the Hart-Scott-Rodino Act: A Reexamination ofthe market power hypothesis, Journal of Law and Economics 28, 119-149.
Fama, E. F., 1985, What’s different about banks?, Journal of Monetary Economics 15, 5-29.
Greenbaum, S. I., G. Kanatas, and I. Venezia, 1989, Equilibrium loan price under the bank-client relationship,Journal of Banking and Finance 13, 221-235.

25
Gorton, G. and F. A. Schmid, 1999, Universal banking and the performance of German firms, forthcoming inJournal of Financial Economics.
Heckman, J. J., and B. Singer, 1984, Econometric duration analysis, Journal of Econometrics 24, 63-132.
Hoshi, T., Kashyap, A., Scharfstein, D., 1991, Corporate structure, liquidity and investment: evidence fromJapanese industrial groups, Quarterly Journal of Economics 106, 33-60.
Houston, J. F., C. M. James, and M. D. Ryngaert, 1999, Where do merger gains come from? Bank mergersfrom the perspective of insiders and outsiders, forthcoming in Journal of Financial Economics.
Houston, J. F., and M. D. Ryngaert, 1994, The overall gains from large bank mergers, Journal of Bankingand Finance 18, 1155-1176.
James, C. M., and P. Wier, 1987, Returns to acquirers and competition in the acquisition market: The case ofbanking, Journal of Political Economy 95, 355-370.
Jayaratne, J., and P. E. Strahan, 1997, Entry restrictions, industry evolution, and dynamic efficiency: Evidencefrom commercial banking, Staff Report 22, Federal Reserve Bank of New York.
Kalbfleisch, J. D., and R. L. Prentice, 1980, The Statistical Analysis of Failure Time Data, New York:John Wiley and Sons.
Kane, E. J., 1999, Incentives for banking megamergers: What motives might central-bank economists inferfrom event-study evidence?, forthcoming in Journal of Money, Credit, and Banking.
Kang, J. K. and R. Stulz, 2000, Do Banking Shocks Affect Borrowing Firm Performance? An Analysis of theJapanese Experience, Journal of Business 73, 1-23.
Kiefer, N. M., 1988, Econometric duration data and hazard functions, Journal of Economic Literature 26,646-679.
Kim, E. H., and V. Singal, 1993, Mergers and market power: Evidence from the airline industry, AmericanEconomic Review 83, 549-569.
Lancaster, T., 1990, The Econometric Analysis of Transition Data, Cambridge, U.K.: CambridgeUniversity Press.
Ongena, S., and D. C. Smith, 2000, The duration of bank relationships, forthcoming in Journal of FinancialEconomics.

26
Ongena, S., D. C. Smith, and D. Michalsen, 1999, Distressed relationships: Lessons from the Norwegianbanking crisis (1988-1991), University of Florida working paper.
Peek, J., and E. S. Rosengren, 1996, Small business credit availability: How important is size of lender?, in A.Saunders and I. Walters (eds.), Financial System Design: The Case for Universal Banking,Homewood, IL: Irwin Publishing.
Peek, J., and E. S. Rosengren, 1998, Bank consolidation and small business lending: It's not just bank size thatmatters, Journal of Banking and Finance 22, 799-820.
Petersen, T., 1986, Fitting parametric survival models with time-dependent covariates, Applied Statistics 35,281-288.
Petersen, M. A., and R. G. Rajan, 1995, The effect of credit market competition on lending relationships,Quarterly Journal of Economics 110, 407-443.
Prager, R. A., and T. H. Hannan, 1998, Do substantial horizontal mergers generate significant price effects?Evidence from the banking industry, Journal of Industrial Economics 46, 433-452.
Rajan, R. G., 1992, Insiders and outsiders: the choice between informed and arm’s length debt, Journal ofFinance 47, 1367-1400.
Sapienza, P., 1999, The effects of banking mergers on loan contracts, Northwestern University working paper.
Sharpe, S. A., 1990, Asymmetric information, bank lending and implicit contracts: A stylized model ofcustomer relationships, Journal of Finance 45, 1069-1087.
Scholes, M., and J. T. Williams, 1977, Estimating betas from nonsynchronous data, Journal of FinancialEconomics 5, 309-327.
Slovin, M. B., M. E. Sushka, and J. A. Polonchek, 1993, The value of bank durability: Borrowers as bankstakeholders, Journal of Finance 48, 289-302.
Stillman, R., 1983, Examining antitrust policy towards horizontal mergers, Journal of Financial Economics11, 225-240.
Strahan, P. E., and J. P. Weston, 1998, Small business lending and the changing structure of the bankingindustry, Journal of Banking and Finance 22, 821-845.
Thompson, R., 1985, Conditioning the return-generating process on firm-specific events: A discussion of eventstudy methods, Journal of Financial and Quantitative Analysis 20, 151-168.

27
U.S. Department of Justice, 1992, Department of Justice and Federal Trade Commission HorizontalMerger Guidelines, from http://www.antitrust.org/law/US/mg.html.
Walraven, N., 1997, “Small business lending by banks involved in mergers, ” Federal Reserve Board workingpaper.

Table 1Annual overview of sample consolidation activity and relationship turnover, 1983-1996.The total number of sample banks includes all banks with connections to firms listed on the Oslo Stock Exchange (OSE). Proposed bank mergers includeall announced intentions by sample banks to merge, while completed bank mergers are those that are successfully completed. Sources for these datainclude newspaper articles from Dagens Næringsliv, Aftenposten, and those compiled through Dow Jones Interactive, annual reports of the Banking,Insurance, and Securities Commission (BISC) of Norway, and Kierulf's Handbook . Firms reporting bank relationships includes all OSE firms that reportat least one bank relationship in Kierulf's Handbook . The Herfindahl-Hirschman Index (HHI) is based on the number of relationships each bankmaintains with sample firms at the end of the year.
Year
Total numberof sample
banks
Proposedbank
mergers
Completedbank
mergers
Firms reportingbank
relationships
Total numberof
relationships
Number ofnew
relationships
Number ofrelationshipsterminated
Industryconcentration as
measured by HHI
1983 24 1 1 115 166 5 5 2,049
1984 27 1 1 140 189 7 5 2,003
1985 26 0 0 138 183 6 1 1,990
1986 26 2 2 133 177 17 16 1,961
1987 23 2 2 125 168 14 10 2,034
1988 19 1 1 113 156 18 12 2,266
1989 18 4 2 111 143 11 6 3,258
1990 17 7 5 100 134 14 7 3,230
1991 17 1 1 106 141 14 9 2,905
1992 17 4 3 101 133 16 5 3,262
1993 18 3 1 106 138 10 4 3,134
1994 20 1 0 113 150 14 5 2,984
1995 19 4 2 98 130 10 6 2,939
1996 8 1
Ave. 20.8 2.8 1.6 115.3 154.5 12.0 7.0 2,616.5

Table 2Summary statistics on sample merging banks and borrowing firms maintaining relationships with merging banks.This table reports summary statistics for merging banks and customers listed on the Oslo Stock Exchange (OSE). All statistics are from the year endingprior to the merger and are collected from Kierulf’s Handbook, OSE databases, or company annual reports. Complete financial information is availablefor 26 acquiring banks, 21 target banks, 495 customers of acquiring banks, and 69 customers of target banks. Asset values, sales, and market values arestated in millions of 1995 Norwegian Kroner. One US dollar is roughly equivalent to 7 Norwegian Kroner. Profitability is the ratio of operating incometo book value of assets, stated in percentage terms. Age is the time elapsed between the firm’s founding date and the year of measurement. MultipleBank Relationships equals one when a firm maintains more than one bank relationship and zero otherwise. Leverage is the book value of debt dividedby the sum of market value of equity and book value of debt, stated in percentage terms. Market-to-book is the ratio of market value of equity plus bookvalue of debt divided by the book value of assets. Termination Propensity is the average forecasted likelihood that a firm leaves a relationshipconditional on survival through the year prior to the merger, assuming that the firm is not involved in a merger. ∆Termination Propensity is theforecasted addition to Termination Propensity assuming that the firm is involved in a bank merger. The forecasts are generated using the estimatesfrom Model (4) of Table 5.
Acquirers Targets
Mean Median25th
Percentile75th
Percentile Mean Median25th
Percentile75th
Percentile
BanksMarket Value of Equity 2,395 1,304 1,269 2,203 523 323 183 476Book Value of Assets 69,094 40,911 29,079 116,891 17,121 7,547 6,488 20,806
Borrowing FirmsMarket Value of Equity 1,028 310 73 1,187 768 163 68 457Sales 2,450 683 163 3,211 2,509 361 48 1,031Profitability (%) 5.09 5.29 0.00 10.08 0.25 3.11 -0.07 6.69Age in years 61 64 21 89 60 46 17 85Multiple Bank Relationships 0.52 1.00 0.00 1.00 0.36 0.00 0.00 1.00Leverage (%) 60.3 63.8 46.6 78.9 53.3 57.8 37.3 80.4Market-to-book 1.33 1.19 1.01 1.47 1.33 1.23 0.97 1.61Termination Propensity (%) 3.54 2.39 1.29 4.69 2.75 2.40 1.32 3.81∆Termination Propensity (%) 15.02 9.60 0.00 20.81 5.01 0.00 -1.28 10.26

Table 3Cumulative abnormal returns for banks listed on the OSE.Percentage cumulative abnormal returns (CARs) OSE-listed banks are calculated for trading days around theannouncement of a proposed merger using the value-weighted index of all Oslo Stock Exchange (OSE) stocks asthe benchmark market portfolio. Coefficient and standard error estimates are based on a seemingly unrelatedregression specification that restricts the CARs to be equal across events in a given category. We include 3 lagsand leads of the market index to control for non-synchronous trading. “Large” banks are the top five of thebanks ranked according to total Norwegian banking assets in the year before the event. All other banks areconsidered “Small.” Significance levels for CARs are based on χ2-tests.
Category# of
EventsAR (0)
CAR(-7,0)
CAR(+1,+7)
Acquiring banks 26 0.31 -0.06 -0.03
Large - Large Bank 2 -0.29 2.20 -5.31*Large - Small Bank 16 -0.07 0.18 -0.22Small - Small Bank 8 0.61 -0.64 -0.59
Target banks 19 4.68*** 8.48*** -1.52
Large - Large Bank 1 0.17 -2.76 -21.33***Large - Small Bank 14 6.21*** 12.98*** 0.21Small - Small Bank 4 1.64 -0.30 3.82
Averages of rival banks 39 0.04 0.22 -0.18
Large - Large Bank 4 0.06 0.61 -1.23*Large - Small Bank 18 0.12* 0.39* 0.18Small - Small Bank 17 -0.00 0.13 -0.39*
*** Significant at 1%. ** Significant at 5%. * Significant at 10%.

Table 4Cumulative abnormal returns for borrowing firms.Percentage cumulative abnormal returns (CARs) are calculated for trading days around announcements ofproposed bank mergers using the value-weighted index of all OSE stocks as the benchmark market portfolio.Coefficient and standard error estimates are based on a seemingly unrelated regression specification (SUR) thatrestricts CARs to be equal across N event portfolios. An event portfolio is an equally-weighted portfolio ofborrowing firms sharing a common merger announcement. We include three lags and leads of the market indexto control for non-synchronous trading. “Large” banks are the top five banks ranked according to totalNorwegian banking assets in the year before the event. All other banks are “Small.” Large (Small) firms are inthe top (bottom) 50% of the firms ranked according to sales in the year before the event. Due to missing salesfigures, not all sample firms can be placed into a size category. Significance levels for CARs are based on χ2-tests.
Category Average# of EventPortfolios
# ofFirms
AR (0)
CAR(-7,0)
CAR (+1,+7)
Borrowers of acquiringbanks
31 520 0.280.13
0.84
Large firms 28 298 0.19 0.10 0.01Large - Large Bank 4 76 0.15 0.90 -0.39Large - Small Bank 17 212 0.08 -0.47 0.32Small - Small Bank 7 10 0.71 0.80 -2.51
Small firms 28 211 0.15 0.41 1.31Large - Large Bank 4 43 -1.44 -1.28 -1.21Large - Small Bank 17 150 -0.00 -0.19 1.99Small - Small Bank 7 18 1.72 3.53 3.27
Borrowers of target banks 21 78 -0.99* 0.05 2.03
Large firms 10 32 -0.27 -1.23 3.78**Large - Large Bank 4 26 0.06 -0.00 3.17Large - Small Bank 4 4 -0.97 -2.31 2.13Small - Small Bank 2 2 -2.06 -5.53 8.67**
Small firms 16 41 -1.67** 0.51 0.40Large - Large Bank 4 28 -2.90*** -3.39 0.21Large - Small Bank 3 3 0.34 -0.04 -0.39Small - Small Bank 9 10 -0.30 5.50 0.67
Borrowers of rival banks 39 3,571 0.03 -0.36 -0.26
Large firms 39 1,685 -0.01 -0.40 0.05Large - Large Bank 4 100 0.39 -0.09 1.78Large - Small Bank 18 714 -0.21* -0.21 0.42Small - Small Bank 17 871 0.14 -0.67** -0.40
Small firms 39 1,744 0.08 -0.27 -0.63*Large - Large Bank 4 128 0.62 -0.79 -0.90

Large - Small Bank 18 766 -0.07 -0.26 -0.44Small - Small Bank 17 850 0.17 -0.30 -0.85*
*** Significant at 1%. ** Significant at 5%. * Significant at 10%.

Table 5Weibull specifications of bank relationship termination rate by borrowing firms.Models estimate the likelihood of bank relationship termination conditional on relationship duration and a set offirm and merger variables using a proportional hazard Weibull model. All estimates are adjusted for rightcensoring. ln Sales is the log of end-of-year sales, deflated by the Norwegian CPI. Profitability is the ratio ofearnings before interest and taxes to the book value of assets. Multiple Relationships takes the value of onewhen a firm maintains multiple bank relationships, and zero when a firm maintains a relationship with a singlebank. Annual ∆HHI measures the annual change in concentration in the market for bank relationships in termsof the Herfindahl-Hirschman Index (divided by 100). Merger<∞ takes the value of one if the bank of theborrowing firm merges at some point during the relationship, and is zero for relationships not involved in a bankmerger. Merger≤ 3 takes the value of one if a bank merger occurs in one of the three years prior to relationshiptermination, and is zero otherwise. ∆HHI measures the change in the concentration in the market for bankrelationships resulting from a given completed merger in terms of the Herfindahl-Hirschman Index (divided by100). Large Firm takes the value of one when the firm belongs to the top 50% of firms, ranked annually bysales, and zero otherwise. The parameter α measures duration dependence. An estimate of α >1(α <1) implies positive (negative) duration dependence. Standard errors are reported in parentheses. Thenumber of observations is 383.
Dependent Merger <∞ Merger ≤ 3Variable (1) (2) (3) (4)
Intercept -2.788*** -3.008*** -2.948 *** -2.958 ***(0.371) (0.426) (0.172) (0.197)
ln Sales -0.073*** -0.037 -0.067 *** -0.066 **(0.027) (0.037) (0.023) (0.026)
Profitability 0.278 0.441 0.400 0.422(0.644) (0.487) (0.577) (0.585)
Multiple Relationships 0.304* 0.337** 0.401 *** 0.403 ***(0.162) (0.165) (0.145) (0.147)
Annual ∆HHI 0.068* 0.064* 0.065 *** 0.067 ***
(0.022) (0.037) (0.022) (0.022)Merger 0.487 0.591 1.209 *** 1.200 ***
(0.364) (0.392) (0.130) (0.155)
∆HHI * Merger -0.223*** -0.207*** -0.214 *** -0.172 **
(0.042) (0.060) (0.047) (0.069)Merger * Large Firm -0.343 0.023
(0.212) (0.197)
∆HHI * Merger * Large Firm 0.026 -0.092
(0.085) (0.104)
α̂ 1.427 † 1.427 † 1.545 † 1.546 †
(0.135) (0.135) (0.162) (0.162)Median Duration 15.59 15.75 12.99 13.03
(1.76) (1.79) (1.14) (1.14)
LogL(θ) -242.958 -241.474 -232.180 -231.852

† α=1 can be rejected at 1%. *** Significant at 1%. ** Significant at 5%. * Significant at 10%.

Table 6Cross sectional estimation of cumulative abnormal returns: borrowing firms of target, acquiring and rival banks.The dependent variable is the Cumulative Abnormal Return (in percent) for individual borrowing firms based on regressions using the value-weighted indexof all Oslo Stock Exchange (OSE) stocks as the benchmark market portfolio. ln Sales is the log of end-of-year sales, deflated by the Norwegian CPI.Profitability is the ratio of earnings before interest and taxes to the book value of assets. Multiple Relationships takes the value of one when a firmmaintains multiple bank relationships, and zero when a firm maintains a relationship with a single bank. ∆HHI measures the proposed change in the bankrelationship concentration in terms of the change in the Herfindahl-Hirschman Index (divided by 100). Large Firm takes the value of one when the firmbelongs to the top 50% of firms, ranked by sales, in the year before the event, and zero otherwise. Termination Propensity is the forecasted hazard rate inthe year prior to the merger announcement calculated using the estimates from Model (4) in Table 5, the values of the variables from the year prior to themerger, and with Merger set to zero. ∆Termination Propensity measures the change in the hazard rate by setting Merger equal to one and incorporatingthe merger-specific information from Model (4) of Table 5. There are 69 target, 495 acquiring, and 3,223 rival borrower observations. Standard errors arereported in parentheses.
Borrower Affiliation Target Acquirng Rival
Dependent Variable CAR(-7,0) AR(0) CAR(+1,+7) CAR(-7,0) CAR(-7,0)(1) (2) (3) (4) (5) (6) (7) (8) (9) (10)
Intercept 2.99(2.80)
2.24(3.15)
-1.48(1.83)
0.13(1.73)
-2.58(2.64)
-4.07(3.31)
1.59(1.55)
2.93(1.98)
0.34(0.61)
0.51(0.74)
ln Sales -0.49(0.43)
-0.31(0.41)
0.02(0.26)
0.04(0.23)
0.54(0.31)
* 0.59(0.30)
** -0.43(0.22)
* -0.51(0.24)
** -0.12(0.07)
-0.13(0.08)
Profitability 0.10(0.06)
* 0.09(0.06)
0.02(0.02)
0.03(0.03)
-0.08(0.09)
-0.09(0.09)
0.05(0.06)
0.05(0.06)
0.01(0.01)
* 0.01(0.01)
Multiple Relationships 5.16(2.38)
** 3.11(2.20)
0.06(1.40)
-0.54(1.24)
-0.34(3.03)
-0.57(3.04)
2.13(1.27)
* 2.59(1.33)
* 0.13(0.42)
0.27(0.57)
∆HHI -1.00(0.35)
*** -1.62(0.55)
*** -0.47(0.20)
** -1.02(0.35)
*** 0.30(0.36)
0.52(0.61)
0.00(0.32)
-0.33(0.42)
-0.26(0.23)
-0.27(0.23)
∆HHI * Large Firm 0.72(0.48)
0.71(0.46)
0.55(0.23)
** 0.55(0.22)
** 0.16(0.72)
0.15(0.72)
0.15(0.34)
0.12(0.34)
0.20(0.37)
0.20(0.35)
Termination Propensity 1.56(0.76)
** 0.79(0.46)
* -0.08(0.66)
0.56(0.54)
-0.06(0.14)
∆Termination Propensity -0.25(0.22)
-0.25(0.16)
0.11(0.18)
-0.16(0.11)
Adjusted-R2 0.09 0.11 0.03 0.08 -0.03 -0.06 0.00 0.00 0.00 0.00

*** Significant at 1%. ** Significant at 5%. * Significant at 10%.

AppendixAcquiring and target bank identity, merger event dates, merger characteristics, the number of firms with relationships to merging banks in the year of theannouncement, and changes in measures of market concentration as a result of proposed merger.Event dates correspond to the earliest day of speculation about the merger or, in the case of undetected speculation, the day a public announcement wasmade. The table contains only those merger announcements involving banks with connections to firms listed on the Oslo Stock Exchange between 1979and 1996. Banks for which we have stock price data are indicated in boldface. “SpB” refers to Sparebanken, or savings bank. ∆HHI measures theincrease in the concentration of OSE firm bank relationships assuming the merger is consummated merger, measured by the change in the Herfindahl-Hirschman Index. For Merger Size, a bank is Large if it is one of the top five banks in Norway, by total Norwegian bank assets. All other banks areSmall. LL is a Large-Large merger, or merger between a Large acquirer and Small target, LS is a Large-Small merger, and SS is a Small-Small merger.The number of acquiring and target bank borrowers refers to the number of OSE-listed firms maintaining a relationship with each bank in the year prior tothe merger announcement. Firms are listed as target bank borrowers only if they do not simultaneously maintain a relationship with the acquiring bank.
#Acquiring Bank (New BankName) Target Bank
Event Date
MergerSize ∆HHI
MergerCompleted?
Number ofAcquiring
BankBorrowers
Number ofTarget BankBorrowers
1 Christiania Bank ogKreditkasse
Fiskernes Bank 11/11/83 LS 0 Yes 43 0
2 Fellesbanken (SpB ABC) SpB Oslo-Akershus 11/05/84 SS 1 Yes 1 1
3 Chemical Bank Horizon Bancorporation 05/02/86 SS 0 Yes 5 0
4 Chemical Bank Texas Commerce Bancshares 12/15/86 SS 3 Yes 5 1
5 Forretningsbanken (FokusBank)
Vestlandsbanken and BøndernesBank
01/22/87 SS 6 Yes 7 1
6 Fokus Bank Buskerudbanken 03/12/87 LS 7 Yes 9 1
7 SpB Nord (SpB Nord-Norge) Tromsø Sparebank 09/28/88 SS 1 Yes 0 1
8 Bergen Bank Rogalandsbanken 05/24/89 LS 28 No 34 1
9 Bergen Bank (Den norske Bank) Den norske Creditbank 10/05/89 LL 887 Yes 34 23
10 Finansbanken Kjøbmandsbanken 10/24/89 SS 0 No 1 0
11 SpB ABC (SpB NOR) SpB Østlandet 12/18/89 LS 5 Yes 4 1
12 Christiania Bank ogKreditkasse
Sunnmørsbanken 01/19/90 LS 52 Yes 52 1

13 Fokus Bank Tromsbanken 01/25/90 LS 0 Yes 10 0
14 Christiania Bank ogKreditkasse
Sørlandsbanken 04/05/90 LS 0 Yes 52 0
15 Fokus Bank Sørlandsbanken 04/06/90 LS 0 No 10 0
16 Fokus Bank Rogalandsbanken 04/21/90 LS 10 Yes 10 1
17 Oslobanken Finansbanken 05/09/90 SS 0 No 0 1
18 SpB NOR Finansbanken 08/23/90 LS 0 Yes 0 1
19 Chemical Bank Manufacturers Hanover 06/07/91 SS 0 Yes 1 0
20 Oslobanken Den Norske Hypotekforening 09/10/92 SS 0 No 2 0
21 SpB NOR Den Norske Hypotekforening 10/01/92 LS 0 Yes 2 0
22 Christiania Bank og Kreditkasse Fokus Bank 10/06/92 LL 620 No 40 8
23 Bergens Skillingsbank Norges Hypotek Institutt 10/08/92 SS 0 Yes 0 2
24 Den norske Bank Oslobanken 04/23/93 LS 72 Yes 57 1
25 SpB NOR Fokus Bank 11/09/93 LL 37 No 3 10
26 Christiania Bank og Kreditkasse Fokus Bank 11/10/93 LL 486 No 37 9
27 Oslo Handelsbanken Finansbanken 09/07/94 SS 0 No 0 1
28 Christiania Bank ogKreditkasse
Norgeskreditt 05/19/95 LS 0 Yes 42 0
29 SpB NOR Norgeskreditt 06/14/95 LS 0 No 6 0
30 SpB Nord-Norge Nordlandsbanken 06/26/95 SS 0 No 0 1
31 Fokus Bank Industri & SkipsBanken 11/21/95 LS 0 No 7 0
32 Fokus Bank Bolig & Næringsbank 01/29/96 LS 0 No 7 0
33 Industri & Skipsbanken Finansbanken 03/21/96 SS 0 Yes 0 2
34 Fokus Bank Bergens Skillingsbank 04/24/96 LS 0 No 7 0
35 SpB Nord-Norge(Sparebankgruppen)
SpB Rogaland, SpB Vest, and SpBMidt-Norge)
06/04/96 SS 1 No 2 0
36 SpB Vest Bergens Skillingsbank 06/07/96 SS 0 No 1 0

37 Svenska Handelsbanken S-E-Banken 09/23/96 SS 0 No 2 0
38 Sparebankgruppen Bolig & Næringsbank 09/31/96 LS 0 No 2 0
39 S-E-Banken Unibank 12/23/96 SS 0 No 0 1