Embed Size (px)
Citation preview


2
• Overall a pleasing performance under tough circumstances
• Strategic actions have led to a strong balance sheet
• Global economic crisis negatively impacted trading volumes
• European logistics was under significant pressure while Southern
African operations performed well in weak markets
• Tight credit criteria and, to a lesser extent reduced demand,
impacted motor retailing and distribution
• Restructuring of vehicle businesses successfully implemented
• Improved performance by Regent group in H2
• Excellent operational cash flow generation
Operational featuresOperational featuresOperational features

3
Continuing operationsContinuing operations
• Final dividend of 120 cents per share (total 200 cents)• Debt/equity ratio down from 81% to 50%
7% Revenue R52 219m
16% Operating profit R2 453m (operating margin 4,7%)
13% HEPS 698 cents
43% Cash generated by operations R5 187m
20% EPS 503 cents

REVIEW OF THE FINANCIAL RESULTS For the year ended 30 June 2009REVIEW OF THE FINANCIAL RESULTS REVIEW OF THE FINANCIAL RESULTS For the year ended 30 June 2009For the year ended 30 June 2009

Income StatementIncome StatementIncome Statement
5
Revenue contribution per division
2009 2008
Decline mainly attributable to Dealerships and Distributorships Revenue from services increased 3% to R21,7 billion
Continuing Operations (Rm) 2009 2008 % Change
Revenue 52 219 55 927 -6,6%
33%
5%
17%
14%
5%
26%
InsuranceDealershipsDistributorshipsCar Rental & TourismInternational LogisticsSA Logistics
31%
5%19%
15%
25%
5%

6
11%
13%
20%
14%
13%
29% 15%
8%
26%
13%
14%
24%
Margin decrease mainly in Dealerships and Distributorships - aggregate operating profit contribution down to 31% from 41%
Continuing Operations (Rm) 2009 2008 % Change
Revenue 52 219 55 927 -6,6%
Operating profit 2 453 2 923 -16,1%
Operating margin 4,7% 5,2%
Operating profit contribution per division
2009 2008
Income StatementIncome StatementIncome Statement
InsuranceDealershipsDistributorshipsCar Rental & TourismInternational LogisticsSA Logistics
7
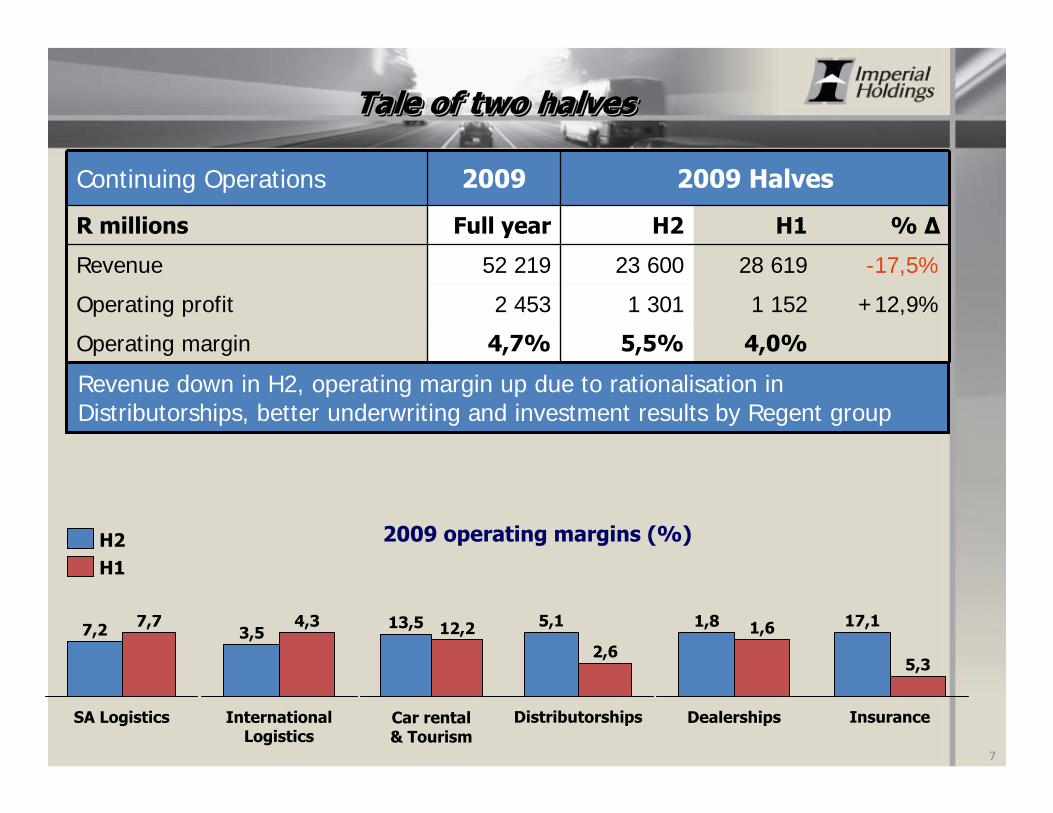
Continuing Operations 2009 2009 Halves
R millions Full year H2 H1 % Δ
Revenue 52 219 23 600 28 619 -17,5%
Operating profit 2 453 1 301 1 152 +12,9%
Operating margin 4,7% 5,5% 4,0%
Revenue down in H2, operating margin up due to rationalisation in Distributorships, better underwriting and investment results by Regent group
SA Logistics
7,77,2
H1H2 2009 operating margins (%)
International Logistics
4,33,5
Car rental & Tourism
12,213,5
Distributorships
2,6
5,1
Dealerships
1,61,8
Insurance
5,3
17,1
Tale of two halvesTale of two halvesTale of two halves

8
1. Foreign exchange gains include R394 million (2008:R150 million) on capital repatriated from European operations
Continuing Operations (Rm) 2009 2008 % Change
Revenue 52 219 55 927 -6,6%
Operating profit 2 453 2 923 -16,1%
Foreign exchange gains & forex derivatives 3921 146
Exceptional items and property recoupments (356)2 70
Income StatementIncome StatementIncome Statement

9
1. Foreign exchange gains include R394 million (2008:R150 million) on capital repatriated from European operations
2. 2009 comprise:
- Goodwill impairment (194)
- Loss on sale of Eqstra shares (217)
- Profit on sale of properties 75
- Other (20)
Total (356)
Continuing Operations (Rm) 2009 2008 % Change
Revenue 52 219 55 927 -6,6%
Operating profit 2 453 2 923 -16,1%
Foreign exchange gains & forex derivatives 3921 146
Exceptional items and property recoupments (356)2 70
Income StatementIncome StatementIncome Statement

10
1. Net financing cost comprise: 2009 2008
- Net loss/(gain) on hedges & swaps 61 (41)
- Net interest paid 862 848
Total 923 807
Continuing Operations (Rm) 2009 2008 % Change
Revenue 52 219 55 927 -6,6%
Operating profit 2 453 2 923 -16,1%
Foreign exchange gains & forex derivatives 392 146
Exceptional items and property recoupments (356) 70
Negative fair value adjustments 0 (496)
Net financing costs1 923 807
Income StatementIncome StatementIncome Statement

11
The swing in Ukhamba is attributed to gains on Eqstra unbundling in 2008 and lower contributions from investments, particularly Dawn and Eqstra in 2009
Including: 2009 2008
Imperial Bank 126 208
Ukhamba (25) 132
Continuing Operations (Rm) 2009 2008 % Change
Revenue 52 219 55 927 -6,6%
Operating profit 2 453 2 923 -16,1%
Foreign exchange gains & forex derivatives 392 146
Exceptional items and property recoupments (356) 70
Negative fair value adjustments 0 (496)
Net financing costs 923 807
Income from associates and joint ventures 107 278
Income StatementIncome StatementIncome Statement

12
Continuing Operations (Rm) 2009 2008 % Change
Revenue 52 219 55 927 -6,6%
Operating profit 2 453 2 923 -16,1%
Foreign exchange gains & forex derivatives 392 146
Exceptional items and property recoupments (356) 70
Negative fair value adjustments 0 (496)
Net financing costs 923 807
Income from associates and joint ventures 107 278
Income tax expense 502 707
Effective tax rate 32% 39%
Income StatementIncome StatementIncome Statement

13
Continuing Operations (Rm) 2009 2008 % Change
Revenue 52 219 55 927 -6,6%
Operating profit 2 453 2 923 -16,1%
Foreign exchange gains & forex derivatives 392 146
Exceptional items and property recoupments (356) 70
Negative fair value adjustments 0 (496)
Net financing costs 923 807
Income from associates and joint ventures 107 278
Income tax expense 502 707
After tax profit 1 171 1 407 -16,8%
Income StatementIncome StatementIncome Statement

14
Total Operations (Rm) 2009 2008 % Change
Revenue 52 219 55 927 -6,6%
Operating profit 2 453 2 923 -16,1%
Foreign exchange gains & forex derivatives 392 146
Exceptional items and property recoupments (356) 70
Negative fair value adjustments 0 (496)
Net financing costs 923 807
Income from associates and joint ventures 107 278
Income tax expense 502 707
After tax profit 1 171 1 407 -16,8%
Discontinued operations:
- After tax profit from trading operations 24 349
- Fair value adjustments on discontinuance 484 (2 269)
Net profit/(loss) for the period 1 679 (513)
Income StatementIncome StatementIncome Statement

15
Total Operations (Rm) 2009 2008 % Change
Revenue 52 219 55 927 -6,6%
Operating profit 2 453 2 923 -16,1%
Foreign exchange gains & forex derivatives 392 146
Exceptional items and property recoupments (356) 70
Negative fair value adjustments 0 (496)
Net financing costs 923 807
Income from associates and joint ventures 107 278
Income tax expense 502 707
After tax profit 1 171 1 407 -16,8%
Discontinued operations:
- After tax profit from trading operations 24 349
- Fair value adjustments on discontinuance 484 (2 269)
Net profit/(loss) for the period 1 679 (513)
Attributable to Imperial shareholders 1 518 (870)
Attributable to minorities 161 357
Income StatementIncome StatementIncome Statement

16
Rm
European Logistics
AMH
SA Logistics
Regent cell captive
Regent other
NAC
Other (including MCC and Tourvest in 2008)
Income Statement minority earnings
Increased from June 2008 Decreased from June 2008 Flat compared to June 2008
Significant minorities’ share of earningsSignificant minoritiesSignificant minorities’’ share of earningsshare of earnings

Balance SheetBalance SheetBalance Sheet
17
1. PPE and Transport fleet reduced by approximately R400m due to currency translation of International logistics assets
2. Increase in vehicles for hire in 2009 results from R259 million reclassification of AMH leasing fleet
Rm Jun 2009
Jun 2008
% change Dec 2008
Property, plant and equipment 5 9761 5 681 +5% 6 025
Transport fleet 3 4831 3 465 +1% 3 722
Vehicles for hire 1 6532 1 286 +29% 1 472

18
1. Decrease in Investment in associates and JVs results from reclassification of Imperial Bank to Assets held for sale
2. Reduction in other non-current assets results from reduction in the equity portfolios of insurance business and the sale of Eqstra shares. Includes intangibles of R901m and investments and loans of R1 136m
Rm Jun 2009
Jun 2008
% change Dec 2008
Property, plant and equipment 5 976 5 681 +5% 6 025
Transport fleet 3 483 3 465 +1% 3 722
Vehicles for hire 1 653 1 286 +29% 1 472
Investments in associates & JVs 7901 2 017 -61% 2 388
Other non-current assets 3 0392 4 632 -34% 4 104
Balance SheetBalance SheetBalance Sheet

19
1. Reduction in net working capital results from:• Inventories R850m• Receivables R1 188m• Payables (R727m)Net decrease R1 311m
2. Cash increased due to proceeds from discontinued operations, reduction of insurance equity portfolio and working capital reduction
Rm Jun 2009
Jun 2008
% change Dec 2008
Property, plant and equipment 5 976 5 681 +5% 6 025
Transport fleet 3 483 3 465 +1% 3 722
Vehicles for hire 1 653 1 286 +29% 1 472
Investments in associates & JVs 790 2 017 -61% 2 388
Other non-current assets 3 039 4 632 -34% 4 104
Net working capital 1 8871 3 198 -41% 3 499
Cash and cash equivalents 4 6552 3 148 +48% 3 160
Balance SheetBalance SheetBalance Sheet

20
Rm Jun 2009
Jun 2008
% change Dec 2008
Property, plant and equipment 5 976 5 681 +5% 6 025
Transport fleet 3 483 3 465 +1% 3 722
Vehicles for hire 1 653 1 286 +29% 1 472
Investments in associates & JVs 790 2 017 -61% 2 388
Other non-current assets 3 039 4 632 -34% 4 104
Net working capital 1 887 3 198 -41% 3 499
Cash and cash equivalents 4 655 3 148 +48% 3 160
Associate held for sale 1 5441 - - -
Discontinued net assets held for sale 4912 2 083 -76% 838
Balance SheetBalance SheetBalance Sheet
1. Carrying value of our 49,9% stake in Imperial Bank
2. Reduced by sale of Tourvest, Safair receipts and collection of CVH assets

21
Rm Jun 2009
Jun 2008
% change Dec 2008
Property, plant and equipment 5 976 5 681 +5% 6 025
Transport fleet 3 483 3 465 +1% 3 722
Vehicles for hire 1 653 1 286 +29% 1 472
Investments in associates & JVs 790 2 017 -61% 2 388
Other non-current assets 3 039 4 632 -34% 4 104
Net working capital 1 887 3 198 -41% 3 499
Cash and cash equivalents 4 655 3 148 +48% 3 160
Associate held for sale 1 544 - - -
Discontinued net assets held for sale 491 2 083 -76% 838
Assets 23 518 25 510 -8% 25 208
Total shareholders’ interest 10 361 10 416 -1% 10 600
Interest bearing borrowings 9 794 11 599 -16% 11 064
Other liabilities 3 363 3 495 -4% 3 544
Equity and liabilities 23 518 25 510 -8% 25 208
Balance SheetBalance SheetBalance Sheet

Changes in total shareholders’ interestChanges in total shareholdersChanges in total shareholders’’ interestinterest
22
Description June 2009
Total shareholders’ interest on 30 June 2008 10 416
Net profit attributable to Imperial shareholders 1 518
Dividends paid to Imperial shareholders (689)
Net decrease in minorities (224)
Movement in foreign currency translation reserve (547)
Movement in share based equity (82)
Other (31)
Total shareholders’ interest at 30 June 2009 10 361*
* Total shareholders’ interest would have been R480 million less had the capital repatriation from European operations not been done

Interest bearing debtInterest bearing debtInterest bearing debt
23
Rm Jun 2009 Jun 2008 % change
Corporate bonds 7 301 7 686 -5%
Commercial paper 1 336 1 618 -17%
Overdrafts and overnight funding 173 912 -81%
Other ¹ 984 1 383 -29%
Gross debt 2 9 794 11 599 -16%
Cash and cash equivalents 4 655 3 148 +48%
Net Debt 5 139 8 451 -39%
1. Secured and unsecured loans, floor plans, capitalised finance leases, instalment sale agreements and loans from minorities
2. Excludes R441 million of non-redeemable, non-participating preference shares3. R10,3 billion unutilised banking facilities available

GearingGearingGearing
24
Net debt to equity (%) Jun 2009 Dec 2008 Jun 2008
Target range 60 - 80 60-80 80 - 100
Net debt/equity ratio 50 76 81
Short term debt as a % of gross debt 22 24 30

25
• Shareholders capital managed with great care
• Switching to higher return industries and a lighter asset orientation
• Pursuing decreased risk and cyclicality of operational earnings
• Notwithstanding major restructuring that was required and tough market
conditions since 2007 we continued paying dividends, albeit at a lower level due
to credit and industry circumstances
• Concurrently we protect our balance sheet and have decreased gearing
• Strong liquidity and cashflows throughout restructuring
• We have significant unutilised facilities
• The board will protect our Baa3 investment grade credit rating if
circumstances turn negative and will take appropriate action
Balanced capital managementBalanced capital managementBalanced capital management

Cash FlowCash FlowCash Flow
26
Rm 2009 2008 % change
Discontinued operations 566 2 056
Tax and finance costs paid (1 700) (2 822) -40%
Net cash flow from operating activities 4 053 2 867 +41%
Net (acquisitions)/disposal of businesses (340) (135)
Expansion capital expenditure (640) (1 595) +60%
Replacement capital expenditure (1 115) (1 017) -10%
Investments, equities and loans 741 680
Shareholder remuneration and hedge costs (1 009)2 (909)
Net decrease in debt 3 108 3 015
Free cash flow 2 938 1 850
Cash conversion ratio 221% 139%
Proceeds/(expenditure) on discontinued assets 1 4181 3 123
1. Tourvest R1 003m, Safair R337m and other fixed assets proceeds R78m 2. Distributions R765 (‘08:R832m), hedge cost premium R137m (’08: R67m) & minorities R107m
+1%5 689Cash generated by operations 5 753
Continuing operations 5 187 3 633 +43%

Divisional overviewDivisional overviewDivisional overview

Operating income (Rm)Operating income (Rm)Operating income (Rm)
28
Geographical segmentation: Continuing operationsGeographical segmentation: Continuing operations
423(17%)
186(8%)
1 844(75%)
457(16%)
141(5%)
2 325(79%)
20092009 20082008Rest of the worldRest of AfricaSouth Africa

29
31%
5%
25%
5%
19%
15%
RevenueRevenue Operating profitOperating profit
11%
13%
20%
14%
29%
13%
International Logistics
4,0%
MarginsMargins
InsuranceDealershipsDistributorshipsCar RentalSA LogisticsInternational Logistics
Divisional statisticsDivisional statisticsDivisional statistics
SA Logistics
7,5%
Car Rental and Tourism
12,8%
Distributorships
3,7%
Dealerships
1,7%
Insurance
11,1%

Logistics Logistics Logistics

International Logistics (ZAR)International Logistics (ZAR)International Logistics (ZAR)
31
-3%
4 686
2009 H2
2008
8 253
2009
8 046
3 360
2009 H1
Revenue (Rm)Revenue (Rm)
403
-21%
20082009
320
202
118
Operating profit (Rm)Operating profit (Rm)
2008
4,9%
2009
4,0%
H2
4,3%
H1
3,5%
Operating marginsOperating margins
41%41%28%28%

International Logistics (EURO)International Logistics (EURO)International Logistics (EURO)
32
768
-15%
378
2009 H2
20082009
651
273
2009 H1
Revenue (Euro millions)Revenue (Euro millions)
38
-32%
20082009
26
17
9
Operating profit (Euro millions)Operating profit (Euro millions)
2008
5,0%
2009
4,0%
H1
4,5%
H2
3,3%
Operating marginsOperating margins
47%47%28%28%
R/R/€€ eexchange ratesxchange rates•• 30 June 2009 : R10.8830 June 2009 : R10.88•• 2009 average 2009 average : R12.35 : R12.35 •• 2008 average : R10.752008 average : R10.75

33
• Business remained profitable under severe H2 conditions
• Decline in international demand for steel, industrial chemicals and automotive
products impacted negatively on business volumes. We responded by
implementing aggressive cost cutting measures
• Container facilities and the bulk inland waterway shipping business were the
most impacted. Short term charters cancelled and port leasing contracts
adjusted to manage costs
• Contract logistics, liquid bulk shipping and bulk facilities were more resilient
• Due to weak trading in road transport, goodwill of such businesses was impaired
International LogisticsInternational LogisticsInternational Logistics

34
2009 H1
+1%
5 308
2009 H2
2008
9 733
2009
9 831
4 523
Revenue (Rm)Revenue (Rm)
700
+5%
20082009
738
411
327
Operating profit (Rm)Operating profit (Rm)
Operating marginsOperating margins
20%20%15%15%
H2 2008
7,2%
2009
7,5%
H1
7,7%7,2%
Southern African LogisticsSouthern African LogisticsSouthern African Logistics

35
• Revenue and operating profit up
• Tough trading since October 2008 due to slowdown in manufacturing, mining,
fuel, commodities, construction and imports and exports
• Distribution of FMCG also declined in the second half
• The 9 day national strike in April 2009 negatively impacted second half results
• Valuable new contracts won
• Fleet in Zimbabwe being modernised
• A fourth subdivision housing asset light businesses created
Southern African LogisticsSouthern African LogisticsSouthern African Logistics

Car Rental and TourismCar Rental and TourismCar Rental and Tourism

Car Rental and TourismCar Rental and TourismCar Rental and Tourism
37
2009 H1
-3%
1 337
2009 H2
2008
2 712
2009
2 618
1 281
Revenue (Rm)Revenue (Rm)
365
-8%
20082009
336
163
173
Operating profit (Rm)Operating profit (Rm)
Operating marginsOperating margins
6%6%4%4%
Average fleet 15 608 (2008: 15 319)Average fleet 15 608 (2008: 15 319)
H2 2008
13,5%
2009
12,8%
H1
12,2%13,5%

38
• Decline in international inbound volumes
• Europcar rebranding successful
• Tempest low cost positioning is working
• U-Drive acquisition contributed positively to the results
• Autopedigree was under significant pressure
• Unchanged contribution from Tourism businesses assisted by the IPL cricket
tournament and Lions rugby tour
• Coach fleet expanded for 2010 and beyond
• Moeketsi Mosola, former CEO of SA Tourism, appointed to head up Tourism
Division
Car Rental and TourismCar Rental and TourismCar Rental and Tourism

DistributorshipsDistributorshipsDistributorships

DistributorshipsDistributorshipsDistributorships
40
2009 H1
-13%
7 061
2009 H2
2008
15 056
2009
13 112
6 051
Revenue (Rm)Revenue (Rm)
744
-34%
20082009
491182
309
Operating profit (Rm)Operating profit (Rm)
Operating marginsOperating margins
70%70%14%14%
•• 17 outlets closed17 outlets closed•• Rationalisation cost R30 millionRationalisation cost R30 million•• Total Imperial Group sold 53 241 new Total Imperial Group sold 53 241 new
and 47 925 used cars in SAand 47 925 used cars in SA
H2
5,1%
2008
4,9%
2009
3,7%
H1
2,6%

41
• Excellent performance in H2 despite tough market conditions
• Rationalisation will yield R100m annualised saving
• Stronger Rand increasing our competitiveness
• Increased contribution from parts and service
• Australian dealerships profitable before R25m VAT recovery
• Good performance from NAC despite weak general aviation market. Lower
forward order book for 2010
• Good performance from Imperial Autoparts
DistributorshipsDistributorshipsDistributorships

DealershipsDealershipsDealerships

DealershipsDealershipsDealerships
43
2009 H2
-13%
2008
2009 H1
19 181
2009
16 691
7 195
9 496
Revenue (Rm)Revenue (Rm)
423
279
128
151
2009 2008
-34%
Operating profit (Rm)Operating profit (Rm)
Operating marginsOperating margins
24%24%
23 unprofitable outlets closed23 unprofitable outlets closed
15%15%
2008
2,2%
2009
1,7%
H1
1,6%1,8%
H2

44
• Operating margin of 1,7% achieved under tough circumstances
• Total market decline of 23% in H2 vs H1. Lagged market in passenger and light
commercials due to dealership closures
• Our medium and heavy commercial vehicles sales outperformed the market
• Stricter lending criteria by banks was main cause of lower sales, despite rate cuts
• 8% higher revenue from servicing
• Loss in Jurgens due to a decline in caravan sales and trailer startup costs
• Beekman Canopies performed well despite lower light commercial vehicle sales
• UK and Swedish dealerships profitable
• Profit on property sale of R51m (2008:R47m) not included in operating profit
• New flagship dealerships generally performing well
DealershipsDealershipsDealerships

Regent groupRegent groupRegent group

46
Revenue (Rm)Revenue (Rm)
227
2009
315
+39%
2008
77
238
Operating profit (Rm)Operating profit (Rm)
209%209%
Operating profit splitOperating profit split
H2
238
133
105 175
140
45
182
H1
77
2009
315
2008
227
707
Underwriting resultInvestment income
1 393
1 454
2 594
+10%
2009 H2
2009 H1
2008
2 847
2009
4%4%
Regent groupRegent groupRegent group

47
• Underlying business starting to show strength
• Gross premium increased 10% - good performance in Botswana and commercial
vehicles
• Underwriting result in motor comprehensive remained weak
• Merger contributes R35m annualised savings
• Steady build-up in monthly premium credit life book
• Cell captive business of R30m was consolidated in 2nd half
• Overall investment return was down due to weak equity market in the first half.
Equities reduced to 17% of total investible funds at year end
• R250m additional capital invested in Regent group
• David Gnodde appointed CEO of Regent Group
Regent groupRegent groupRegent group

48
People development and social investmentPeople development and social investmentPeople development and social investment
• Leadership skills and technical training are key drivers
• Management programmes also important to achieve our transformation goals
• R24m invested in second state-of-the-art technical training centre
• Capacity of more than 800 apprentices per year
• Imperial Ukhamba Community Development Trust actively supports three
under-privileged schools in Gauteng
• 3 300 learners
• Close co-operation with Gauteng education department
• Over R 11m spent since inception
• People development and transformation now an executive portfolio under
Berenice Francis

Strategy and prospectsStrategy and prospectsStrategy and prospects

50
• Restructuring resulted in strong balance sheet
• Steps taken to right-size motor operations in line with demand expectation
• Expansion of logistics, tourism and financial services will follow, enhancing
the balance of our portfolio
• Internationally, expansion will be aligned to Imperial Logistics International
• Opportunities in Europe are beginning to emerge
• Regent group can now be more outwardly focused after period of
consolidation
• We will also consider growth opportunities in industries adjacent to our
current activities
Strategic intentStrategic intentStrategic intent

51
• In-principle agreement reached with Nedbank
• sale of our 49,9% share for R1 775m
• cooperation to promote vehicle finance through Imperial dealerships
• Financial services synergies will be maintained
• Group relieved of future funding obligations enhancing our cash flows
• Financing arrangements within dealerships will not change
Imperial BankImperial BankImperial Bank

52
• Business conditions to remain tough despite early signs of recovery in
global economies
• SA and European logistics conditions will remain difficult
• Vehicle sales will remain weak
• Dealerships and Distributorships to benefit from rationalisation and cost
cutting
• Good performance in Car Rental and Tourism in H2 expected
• Insurance underwriting result to be maintained and investment returns
will improve
• Performance will benefit from balance sheet strength, rationalisation and
rebalanced portfolio which positions us well in the current market
ProspectsProspectsProspects

Thank youThank youThank you