Embed Size (px)
Citation preview

www.tigerbrands.com
TIGER BRANDS LIMITEDRESULTS PRESENTATION
for the year ended 30 September 2014

AGENDA

Peter MatlareChief Executive Officer

Exports and InternationalGrains Consumer BrandsNigeriaGroup
A CREDIBLE SET OF RESULTS
• Results underpinned by solid fundamentals
• Achieved despite challenging trading conditions
• Dangote Flour Mills (Nigeria)– Results impacted by asset impairments
– Challenges remain but encouraging signs of improvement
• Grains– Admirable performance in the face of significant competitor and cost pressures
• Groceries– Solid volume growth, supported by a focus on manufacturing efficiencies
• Tiger Brands International and Exports– Continues to deliver strong performance and entrench its African footprint
4

Exports and InternationalGrains Consumer BrandsNigeriaGroup
A SOLID PERFORMANCE
• Group turnover 11% to R 30.1 billion
• Operating profit 15% to R 3.6 billion
• Operating margin to 11.8%
• HEPS 15% to 1 804 cents
• Total Dividend 9% to 940 cents
5

Exports and InternationalGrains Consumer BrandsNigeriaGroup
GOOD TURNOVER GROWTH
R27.0 bn Pricing inflation Volume Forex
R30.1 bn5%
4%
2%
22,5
23,5
24,5
25,5
26,5
27,5
28,5
29,5
30,5
September 2013Turnover
Pricing inflation Volume Forex September 2014Turnover
R'b
illio
n
11% Organic Growth
TurnoverGrowth
Pricing inflation
TotalVolume
Forex
Domestic 10% 6% 4% -
Exports and International
16% 1% 7% 8%
Nigeria 11% - (3%) 14%
TOTAL GROUP 11% 5% 4% 2%
6

Exports and InternationalGrains Consumer BrandsNigeriaGroup
Y-o-Y % change 2012 2013 2014 2015
Global 3.4 3.3 3.3 3.8
Advanced markets 1.2 1.4 1.8 2.3
Emerging markets 5.1 4.7 4.4 5.0
SS-Africa 4.4 5.1 5.1 5.8
South Africa 2.5 1.9 1.4 2.3
Global Economic Growth
• Global GDP growth – 3.3%
• Uneven economic performance
• Slowdown in emerging markets– Brazil, Russia, China
Sub-Saharan Africa
• GDP growth – 5%
• Still an exciting opportunity
• But potential downside risks
South Africa
• Anaemic growth – 1.5%
• Households increasingly financially vulnerable
Y-o-y % change 2013 2014 2015
Kenya 5.6 5.3 6.2
Nigeria 6.3 7.0 7.3
Ethiopia 9.7 8.2 8.5
Cameroon 4.6 5.1 5.2
ECONOMIC GROWTH PROSPECTS
Source: IMF, World Economic Outlook, October 2014
7

Exports and InternationalGrains Consumer BrandsNigeriaGroup
A BALANCED APPROACH
• Harnessed brand equity – leveraged off the stable of iconic brands
• Keen price management– Balancing above-inflation cost push with constrained household disposable income
• Drive for manufacturing efficiencies and astute cost management– Organisational agility a cornerstone
• Resilience of the Tiger Brands team– In the face of intensifying competitor activity and adverse economic headwinds
Tight trading conditions required a balanced approach… a focus on market positioning, organisational agility and resilience
8

Exports and InternationalGrains Consumer BrandsNigeriaGroup
A PLATFORM FOR GROWTH
• Benefits of investments in brands
• Drive for innovation bearing fruit
• Cost management initiatives gaining traction
• Established footprint on the African continent
• Creating a platform for growth and new opportunities
9

Funke IghodaroChief Financial Officer

Exports and InternationalGrains Consumer BrandsNigeriaGroup
INCOME STATEMENT FOR THE YEAR ENDED 30 SEPTEMBER
R’m 2014 2013 % Change
Turnover 30 072.0 27 003.5 11%
Operating income before IFRS 2 3 661.4 3 217.0 14%
IFRS 2 Charges (105.4) (134.2) 21%
Operating income 3 556.0 3 082.8 15%
Operating margin (%) – After IFRS 2 Charges 11.8% 11.4%
Income from investments 1.5 17.0
Net financing cost (402.7) (378.8) (6%)
Income from Associates 596.9 515.1 16%
Income before tax and abnormal items 3 751.7 3 236.1 16%
Income tax expense (886.3) (833.5) (6%)
Income after tax before abnormal items 2 865.4 2 402.6 19%
11

Exports and InternationalGrains Consumer BrandsNigeriaGroup
INCOME STATEMENT FOR THE YEAR ENDED 30 SEPTEMBER
R’m 2014 2013 % Change
Income after tax before abnormal items 2 865.4 2 402.6 19%
Abnormal items (net of taxation) (1 001.6) (5.5)
Non-controlling interests 126.5 118.9 6%
Profit from continuing operations 1 990.3 2 516.0 (21%)
Discontinued operation 29.9 60.7 (51%)
Profit from total operations 2 020.2 2 576.7 (22%)
HEPS (cents) 1 815.7 1 628.6 11%
- Continuing operations 1 804.4 1 574.3 15%
- Discontinued operation 11.3 54.3 (79%)
EPS (cents) 1 261.6 1 612.9 (22%)
- Continuing operations 1 242.9 1 574.9 (21%)
- Discontinued operation 18.7 38.0 (51%)
12

Exports and InternationalGrains Consumer BrandsNigeriaGroup
TURNOVER BY OPERATING SEGMENT
R’mSeptember
2014 September
2013 % Change
Domestic operations 22 373.2 20 250.7 10%
Grains 10 948.6 10 052.7 9%
Milling and Baking 8 043.0 7 243.3 11%
Other Grains 2 905.6 2 809.4 3%
Consumer Brands 11 424.6 10 198.9 12%
Groceries 3 968.7 3 238.6 23%
Snacks & Treats 2 054.5 1 924.0 7%
Beverages 1 107.9 1 020.3 9%
VAMP 1 896.2 1 736.3 9%
Out of Home 437.1 402.7 9%
HPCB 1 960.2 1 877.0 4%
Domestic intergroup sales - 0.9
International operations 7 698.8 6 752.8 14%
Exports and International (Excluding Nigeria) 4 578.7 3 944.0 16%
Nigeria 3 120.1 2 808.8 11%
Total turnover 30 072.0 27 003.5 11%
13

Exports and InternationalGrains Consumer BrandsNigeriaGroup
CONTRIBUTION TO TURNOVER
2014
Milling and Baking
28%
OtherGrains
10%
Groceries 12%
Snacks and Treats 7%
Beverages 4%
VAMP 6%
OOH 1%
HPCB 7%
Exports & International
15%
Nigeria 10%
2013
2014 Turnover: R30.1 billion 2013 Turnover: R27.0 billion
Nigeria10%
Exports & International
15%
HPCB7%
OOH1%
VAMP6%
Beverages4%
Snacks And Treats7%
Other Grains
10%
Milling and Baking
27%
Groceries13%
14

Exports and InternationalGrains Consumer BrandsNigeriaGroup
OPERATING INCOME BEFORE IFRS2 CHARGES
R’mOperating Income % Operating Margins
2014 2013 Change 2014 2013
Domestic operations 3 252.2 3 026.2 7% 14.5% 14.9%
Grains 1 918.9 1 689.7 14% 17.5% 16.8%
Milling and Baking 1 596.5 1 399.9 14% 19.8% 19.3%
Other Grains 322.4 289.8 11% 11.1% 10.3%
Consumer Brands 1 375.8 1 345.9 2% 12.0% 13.2%
Groceries 320.4 295.1 9% 8.1% 9.1%
Snacks & Treats 309.4 305.0 1% 15.1% 15.9%
Beverages 126.6 106.4 19% 11.4% 10.4%
VAMP 130.8 119.7 9% 6.9% 6.9%
Out of Home 90.1 80.4 12% 20.6% 20.0%
HPCB 398.5 439.3 (9%) 20.3% 23.4%
Other operating charges (42.5) (9.4) - -
International operations 409.2 190.8 114% 5.3% 2.8%
Exports and International 691.1 574.8 20% 15.1% 14.6%
Nigeria (281.9) (384.0) 27% (9.0%) (13.7%)
Operating income 3 661.4 3 217.0 14% 12.2% 11.9%
15

Exports and InternationalGrains Consumer BrandsNigeriaGroup
CONTRIBUTION TO OPERATING INCOME BEFORE IFRS2 AND OTHER OPERATING CHARGES
Milling and Baking
43%
Other Grains 9%
Groceries ; 9%
Snacks and Treats ; 8%
Beverages 3%
VAMP 4%
OOH 2%
HPCB 11%
Exports & International;
19%
Nigeria ; (8%)
2014
Milling and Baking ; 44%
Other Grains 9%
Groceries ; 9% Snacks and
Treats ; 9%
Beverages 3%
VAMP 4%
OOH 2%
HPCB 14%
Exports & International;
18%
Nigeria ; (12%)
2013
2014 Operating income: R3.7 billion 2013 Operating income: R3.2 billion
16

Exports and InternationalGrains Consumer BrandsNigeriaGroup
RECONCILIATION BETWEEN PROFIT FOR THE YEAR ANDHEADLINE EARNINGS
2014 2013 % Change
Continuing operations
Net profit: 1 990.3 2 516.0 (21%)
Adjusting itemsGross
amount
Non controlling
interestTax
Impairment- DFM 953.9 (46.1) (56.8)
Impairment - Other 67.7 - -
Derecognition of assets 40.1 - (11.2)
Other (6.2) (13.1) 14.1
Abnormal items 1 055.5 (59.2) (53.9) 942.4
Less non-adjusting items (36.4)
Other Headline items (7.0) (1.0)
Headline earnings - Continuing 2 889.3 2 515.0 (15%)
Discontinued operation
Net profit: 29.9 60.7 (51%)
Loss on sale of PPE - 9.7
Fair value (gain)/loss (11.8) 16.3
Headline earnings - Discontinued 18.1 86.7 (79%)
Total Headline Earnings 2 907.4 2 601.7 12%
17
Exports and InternationalGrains Consumer BrandsNigeriaGroup
RECONCILIATION BETWEEN PROFIT FOR THE YEAR ANDHEADLINE EARNINGS (continued)
2014 2013 % Change
Total Headline earnings 2 907.4 2 601.7 12%
Weighted average number of shares 160 127 228 159 754 722
Headline earnings per share - Total 1 815.7 1 628.6 11%
Headline earnings per share - Continuing 1 804.4 1 574.3 15%
Headline earnings per share - Discontinued 11.3 54.3 (79%)
Diluted number of shares 164 150 637 163 827 535
Diluted headline earnings per share 1 771.2 1 588.1 12%
Continuing operations 1 760.2 1 535.2 15%
Discontinued operation 11.0 52.9 (79%)
18

Exports and InternationalGrains Consumer BrandsNigeriaGroup
GROUP BALANCE SHEET AS AT 30 SEPTEMBER
R’m 2014 2013
Assets
Property, plant and equipment 5 867.6 5 498.7
Goodwill and intangible assets 4 526.7 5 424.6
Investments 3 422.5 3 413.3
Net deferred tax asset 27.8 -
Current Assets 9 568.0 8 852.6
Assets held-for-sale - 1 280.7
23 412.6 24 469.9
Equity and Liabilities
Ordinary Shareholders Equity 13 177.4 12 787.1
Non-controlling Interests 769.8 1 028.4
Net Debt 3 489.2 4 470.0
Non-current Liabilities 626.4 806.2
Current Liabilities 5 349.8 4 679.6
Liabilities associated with assets held-for-sale - 698.6
23 412.6 24 469.9
19

Exports and InternationalGrains Consumer BrandsNigeriaGroup
KEY STATISTICS
2014 2013
Net (Debt)/Cash (Rm) (3 489.2) (4 470.0)
Net Debt/Equity % 25.0 32.4
Working capital per R1 turnover (cents) 22.1 23.2
Net interest cover (times) 9.0 8.0
Operating income margin % (after IFRS2 charges) 11.8 11.4
Effective tax rate % (before abnormal items and associates) 28.1 30.6
RONA 24.6 24.6
Net working capital days 88 91
Stock days 69 76
Debtor days 43 44
Creditor days 24 29
20
Exports and InternationalGrains Consumer BrandsNigeriaGroup
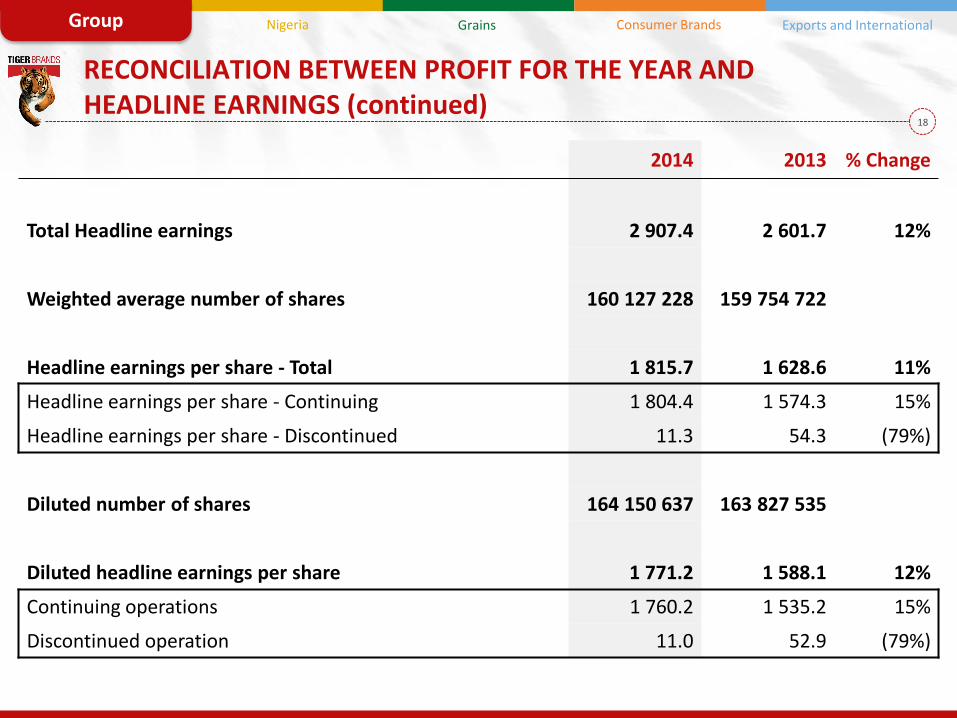
CASH FLOW STATEMENT FOR THE YEAR ENDED 30 SEPTEMBER
R’m 2014 2013
Cash operating profit 4 541.2 4 311.3
Working Capital (348.0) (337.2)
Cash generated from operations 4 193.2 3 974.1
Net Financing cost/Investment income (119.0) (108.6)
Tax paid (967.3) (986.2)
Cash available from operations 3 106.9 2 879.3
Dividends paid (1 467.2) (1 426.1)
Capital Expenditure (982.9) (727.6)
Acquisitions (74.1) (2 554.0)
Disposals – Agrosacks (net of debt transferred on disposal of business) 430.2 -
Debt - DFM Acquisition - (1 498.8)
Other Items 93.8 50.0
Net cash movement for the year 1 106.7 (3 277.2)
Exchange rate translation (125.9) (189.4)
Transfer to held-for-sale (Agrosacks) - 178.2
Opening balance (4 470.0) (1 181.6)
Closing balance (3 489.2) (4 470.0)
21

Exports and InternationalGrains Consumer BrandsNigeriaGroup
CAPITAL EXPENDITURE AND COMMITMENTS
R’m 2014 2013
Capital expenditure 982.9 727.6
- Replacement 555.2 540.3
- Expansion 427.7 187.3
Capital commitment 978.0 780.3
- Contracted 244.5 372.2
- Approved 733.5 408.1
22

Noel DoyleBusiness Executive

Exports and InternationalGrains Consumer BrandsNigeriaGroup
TIGER BRANDS IN NIGERIA – OVERVIEW
• Whilst F2014 performance was disappointing, there has been significant progress at DFM
⁻ The execution of operational initiatives resulted in progressively reduced losses
⁻ Management transition strengthened depth of experience in Nigeria FMCG environment
⁻ Stabilising of existing core allowing for progress in developing new category entry strategy and developing ideal route to market for existing core
• Continued optimisation of Deli Foods
• UAC results providing a stable platform for both the opportunities and challenges ahead
24

Exports and InternationalGrains Consumer BrandsNigeriaGroup
DFM – CONTINUED IMPROVEMENTS AS KEY OPERATIONAL INITIATIVES DELIVER
(1,4)
(1,1)
(0,9)
(0,7)
(1,6)
(1,4)
(1,2)
(1,0)
(0,8)
(0,6)
(0,4)
(0,2)
-
Q1 Q2 Q3 Q4
N’billion
Operating losses before interest, non recurring items and forex gains
25

Exports and InternationalGrains Consumer BrandsNigeriaGroup
DFM - THE SIGNIFICANT OPERATIONAL AND STRATEGIC INITIATIVES COMMITTED TO ARE ALL ON TRACK
CompletedIn progress for
completion in F2015
• Positive volume momentum
• Achieved benchmark extraction rates
• Mothballing of facilities
• Alternative wheat sourcing
• Expansion of silo capacity
• Launch of new consumer offerings in
⁻ Flour
⁻ Pasta
⁻ Noodles
• Finalisation of business case for new category entries
26
Exports and InternationalGrains Consumer BrandsNigeriaGroup
UAC FOODS – INTENSE COMPETITIVE LANDSCAPE
• Pleasing progress in market penetration, particularly in the East region
• Market pricing impacts ability to recover costs
• New entrants intensified competitive offerings
• Snacks capacity upgrade successfully executed
27

Exports and InternationalGrains Consumer BrandsNigeriaGroup
TIGER BRANDS IN NIGERIA - OUTLOOK
• Medium term outlook very positive
• F2015 likely to be the most challenging of recent years in FMCG
⁻ Election year
⁻ Instability in the North
⁻ Potential pressure on the Naira due to falling oil revenues
• DFM will invest significantly in brand investment and innovation, anticipating a reduction in F2015 losses
• UAC and Deli Foods face challenges in extremely competitive categories
28

Noel DoyleBusiness Executive

Exports and InternationalNigeria Consumer BrandsGrainsGroup
OVERVIEW – STRENGTH OF BRAND PORTFOLIO REFLECTEDIN THE RESULTS
• Price increases slowed growth somewhat but balanced by margin enhancement
• Enhanced margin management enabled by lower volatility in soft commodity pricing in H2
• Intense pricing competition between customers
• Consumers search for value remains a key market dynamic in all categories
• Maize and Rice grew volume in H2 after a disappointing H1
• Marketing investment increased by 25% for the full year
H1 H2 FY
% Change YOY % % %
Volume (tons) 4 2 3
Net sales 9 9 9
EBIT 10 17 14
EBIT Margins +0.2 +1.3 +0.7
30
Exports and InternationalNigeria Consumer BrandsGrainsGroup
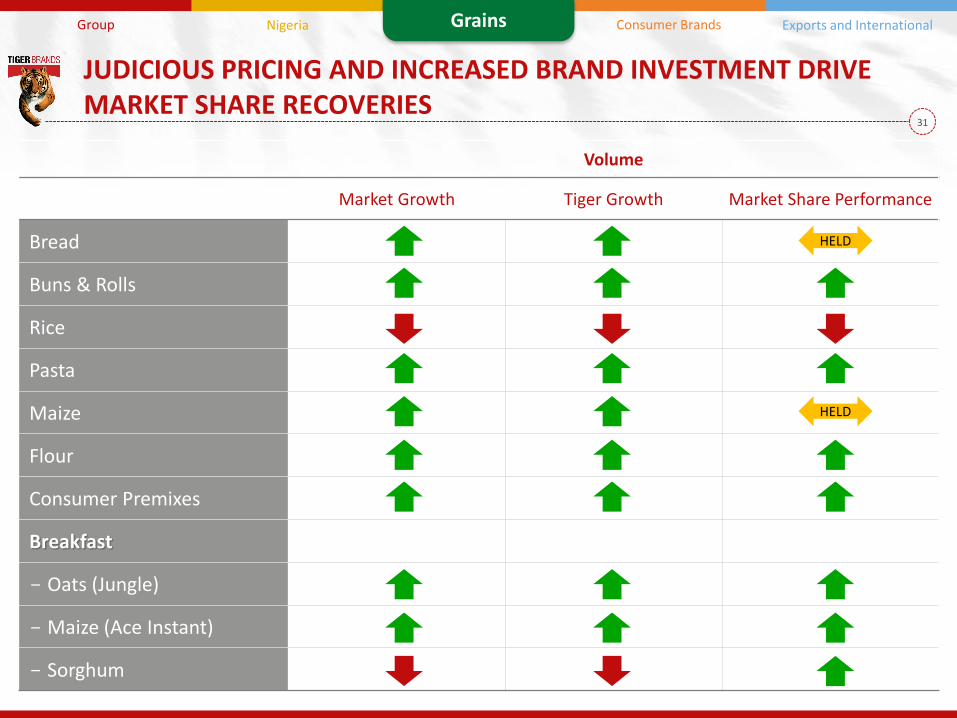
JUDICIOUS PRICING AND INCREASED BRAND INVESTMENT DRIVEMARKET SHARE RECOVERIES
Volume
Market Growth Tiger Growth Market Share Performance
Bread
Buns & Rolls
Rice
Pasta
Maize
Flour
Consumer Premixes
Breakfast
- Oats (Jungle)
- Maize (Ace Instant)
- Sorghum
HELD
HELD
31

Exports and InternationalNigeria Consumer BrandsGrainsGroup
MILLING AND BAKING – WHEAT AND MAIZE
• Categories remain challenging and growth in DOB’s and regional brands reflects consumer search for value
• Good operating profit growth driven bywheat performance
• Both categories focused on relentless execution indistribution and market responsive pricing whichdrove good volume growth
• Wheat benefited from innovation in both industrialand consumer premixes
• Internal efficiencies enhanced margins
• Improved Ace quality positively received
• Maize volumes grew for first time in 6 years
32

Exports and InternationalNigeria Consumer BrandsGrainsGroup
MILLING AND BAKING – BAKERIES
• Operating income growth pleasing despite
significant cost push
• Albany retains market leadership in an
increasingly active and competitive market
• Innovation and range extension in buns and
rolls increase Albany’s market leadership in
this segment
Solid volume performance in the Grains Engine room
33

Exports and InternationalNigeria Consumer BrandsGrainsGroup
MILLING AND BAKING – SORGHUM CEREALS, BEVERAGESAND ACE INSTANT
• Porridge remains an area of focus with
significant innovation in the category
• Ace Instant and Morvite deliver good volume
growth of 16% and 12% respectively
• Rate of long term volume decline in sorghum
beverages slowed
Double digit volume growth in Ace & Morvite drive Cereals performance
34

Exports and InternationalNigeria Consumer BrandsGrainsGroup
OTHER GRAINS – RICE, PASTA AND OATS
• Rice market remains intensely competitive and margin pressures remain
– Volume growth in H2
– Tastic & Aunt Caroline retain market leadership
• Pasta
– Pleasing growth in operating income
– Positive margin correction in H2
– Good market share gains in growing market
• Jungle
– Pleasing growth in operating income underpinned by good volume growth
– Continued execution of strategy focused on innovation
35

Exports and InternationalNigeria Consumer BrandsGrainsGroup
CONCLUSION
• Results reflect strength of brands notwithstanding difficult
consumer environment
• Good success in F14 in balancing the volume vs margin
levers for long term sustainability of the brands
Outlook
• Focus on in-market execution, marketing investment and
operational efficiencies continues
• The outlook remains challenging with intensified
competition for shrinking disposable income
Summary
36

Grattan KirkBusiness Executive

Exports and InternationalNigeria Grains Consumer BrandsGroup
GROCERIES
• Strong volume growth of 15.4%
• Raw material cost increases recovered in H2
• Market share gains across all major categories
• Brands well positioned to deliver growth
• New management team in place
• Continued drive for operational efficiency and innovation
Volume recovery strategy in H1 followed by margin improvement in H2 enhances profitability
Sales R 3 968.7m +23%
EBIT R 320.4m +9%
38

Exports and InternationalNigeria Grains Consumer BrandsGroup
SNACKS AND TREATS
• Market leader in sugar confectionery (43%)
• Number 2 position retained in total confectionery (25%)
• Focus on core brands and innovation continuesto deliver results
• Judicious price management in highly competitive market segment
• Gums and Jellies plant commissioned at a costof R160m
• Relentless focus on operating efficiencies andcost reduction
Significant input cost pressure dampens growth
Sales R 2 054.5m +7%
EBIT R 309.4m +1%
39

Exports and InternationalNigeria Grains Consumer BrandsGroup
BEVERAGES
• Market leadership positions retained in
– Sports drinks (52.0%)
– Liquid concentrates (31.5%)
• 28% increase in marketing spend
• Factory consolidation into Roodekop delivers tangible benefits and positions business forfurther growth
• Innovation meets consumer needs
Profitable volume growth supported by manufacturing efficiencies
Sales R 1 107.9m +9%
EBIT R 126.6m +19%
40

Exports and InternationalNigeria Grains Consumer BrandsGroup
VALUE ADDED MEAT PRODUCTS AND CANNED MEATS
• Gains in market share
• Robust rate of innovation delivers top-line growth
• Material cost push ahead of inflation results in some margin compression
• Extremely well managed costs
• Pleasing growth from Canned meats
Solid profit performance in a declining category
Sales R 1 896.2m +9%
EBIT R 130.8m +9%
41

Exports and InternationalNigeria Grains Consumer BrandsGroup
OUT OF HOME
• New customer acquisition strategypays dividends
• Improved product and channel mix
• Growth across food services and restaurants
• Leverage Tiger basket into new channels
Strong profit performance with positive leverage
Sales R 437.1m +9%
EBIT R 90.1m +12%
42

Exports and InternationalNigeria Grains Consumer BrandsGroup
OUTLOOK
• Consumer is likely to remain under pressure
• We will continue to
– Invest in our Brands and in our people
– Supply chain optimisation remains a key focus area
• Relentless focus on innovation
• Fixation on cost control
• Judicious price management
• Driving efficiencies to maximise operating profits
43

Neil BrimacombeBusiness Executive
Exports and InternationalNigeria Grains Consumer BrandsGroup
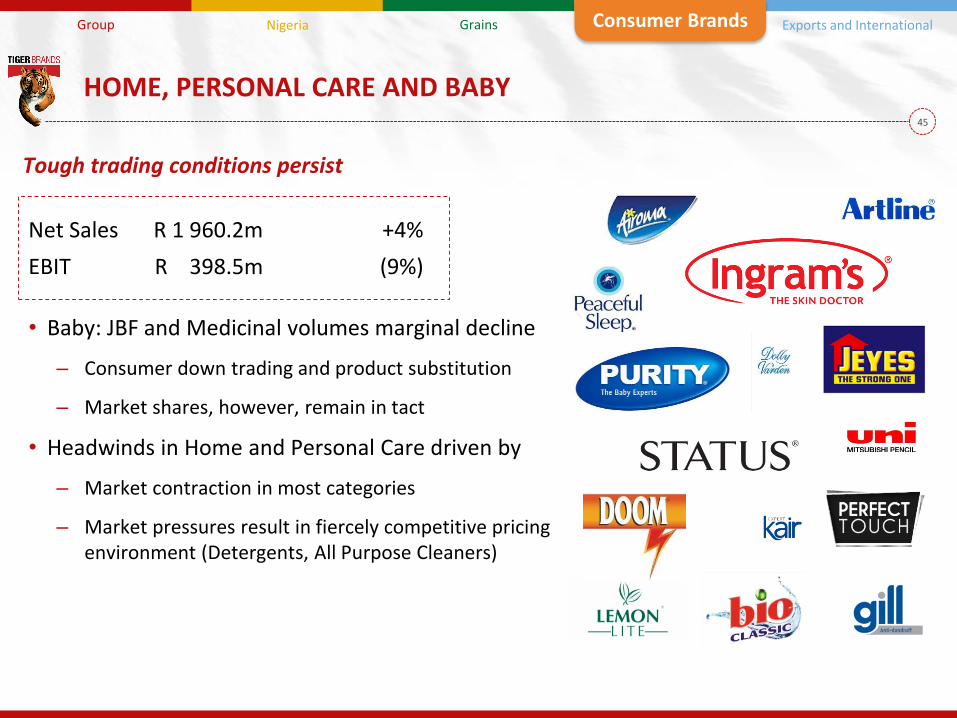
HOME, PERSONAL CARE AND BABY
• Baby: JBF and Medicinal volumes marginal decline
– Consumer down trading and product substitution
– Market shares, however, remain in tact
• Headwinds in Home and Personal Care driven by
– Market contraction in most categories
– Market pressures result in fiercely competitive pricing environment (Detergents, All Purpose Cleaners)
Tough trading conditions persist
Net Sales R 1 960.2m +4%
EBIT R 398.5m (9%)
45

Exports and InternationalNigeria Grains Consumer BrandsGroup
HOME, PERSONAL CARE AND BABY
• Top line Growth driven by Pest and Air Care
– DOOM and Airoma relaunches see good traction
– ATL support and optimised pricing
– Focus on consumer value and single unit pricing (taking lead away from banded packs)
• EBIT impacted by defence of Surface cleaners and especially Laundry Care
Home Care: Aggressive Competition
Net Sales R 648.8m 12%
EBIT R 75.5m (18%)
46

Exports and InternationalNigeria Grains Consumer BrandsGroup
HOME, PERSONAL CARE AND BABY
• Continued growth on key skin brands
– Ingram's (Independents’ distribution)
– Dolly Varden (price points)
• Hair Care category declines
• Deodorants and Face Care under pressure in competitive markets
• Pleasing innovation traction
– Ingram’s Moisture Plus and roll-on deodorants
– STATUS STRONG - high efficacy Roll-on
Personal Care: Categories under pressure
Net Sales R 564.2m (3%)
EBIT R 112.8m (20%)
47

Exports and InternationalNigeria Grains Consumer BrandsGroup
HOME, PERSONAL CARE AND BABY
• Category inflation affecting Baby Nutrition market volumes
– Down trading to home prepared meals
– Purity Cereals continue to grow volumeshare long term and short term - market leader
– Launch of Pouches - format innovation
• Baby Medicinal segment volumes contract
– Toiletries continue to reflect long termvolume market share gain
– Innovation drives growth
Baby Category: Market Contracts
Net Sales R 747.2m +4%
EBIT R 210.2m +2%
48

Exports and InternationalNigeria Grains Consumer BrandsGroup
HOME, PERSONAL CARE AND BABY
• Tough trading conditions
• Product rationalisation
• Emphasis on innovation execution
• Management of critical price points
Outlook
• Highly competitive environment to persist
• HPCB remains an important investment vector for Tiger Brands
• Emphasis on re-investment in and rebuilding of our core business
In Summary
49

Neil BrimacombeBusiness Executive

Consumer BrandsNigeria Grains Exports and InternationalGroup
TIGER BRANDS INTERNATIONAL (EXCLUDING NIGERIA)
• Exports
– Rest of Africa: Excellent performance
– Davita: Good performance
– L&AF: Significantly improved performance
• East Africa
– Kenya: Excellent performance
– Ethiopia: Satisfactory
• Central Africa
– Cameroon: Exceptional performance
Key Themes
1. Availability and visibility
2. Investment in facilities, people and brands
3. Continued strong partner relationships
Tiger Brands International (excluding Nigeria)
Net Sales R 4 578.7m +16%
EBIT R 691.1m +20%
On shore manufacturing Export territories
Mali
Gh
ana
Niger
Nigeria
Gabon
Sudan
Ethiopia
Kenya
DRC
Tanzania
ZambiaAngola
Zimbabwe
NamibiaBotswana
SouthAfrica
Chad
EQ
51

Consumer BrandsNigeria Grains Exports and InternationalGroup
TIGER BRANDS INTERNATIONAL - EXPORTS (INCLUDING DAVITA)
Rest of Africa Exports : Growth drivers
• Exceptional growth in Southern African countries
• Pleasing growth momentum in key categories viz: C&I, Rice, Pasta, Snacks & Treats, Personal Care
• Slight margin compression due to domestic cost push
• Sustained Brand Investment
Challenges
• Price competitiveness outside of SADC region
Tiger Brands Exports: Excellent Growth
Net Sales R 1 846.5m +21%
EBIT R 423.6m +16%
Zimbabwe, Zambia, Mozambique
52

Consumer BrandsNigeria Grains Exports and InternationalGroup
TIGER BRANDS INTERNATIONAL - DAVITA
Davita Growth drivers
• Benny and Davita record strong performances
• Strong performance from Mozambique and Nigeria
• Strong growth from far West African countries up to quarter 3 before the Ebola outbreak
• Pleasing progress on throughput and efficiencies
Challenges
• Low cost PSD entrants particularly in East Africa
Good Performance
53

Consumer BrandsNigeria Grains Exports and InternationalGroup
TIGER BRANDS INTERNATIONAL - LANGEBERG & ASHTON FOODS
Key points
• Overall slight volume decline
• Significant improvements in manufacturing productivity
• Performance further enhanced by weak ZAR
• China demonstrates significant growth and further expansion potential
Significantly Improved Performance
Net Sales R 1 440.1m +9%
EBIT R 60.4m +43%
54

Consumer BrandsNigeria Grains Exports and InternationalGroup
TIGER BRANDS INTERNATIONAL - EAST AFRICA (HACO TB AND EATBI)
Kenya growth drivers
• Strong export sales to Ethiopia and Uganda
• Performance driven by strong BIC salesbut slower growth in HPC
• Market penetration initiatives continue togain traction
• Innovation progress
– Hand & Body
– Hair Care
Very Good Performance
Net Sales R 803.6m +11%
EBIT R 103.6m +13%
55

Consumer BrandsNigeria Grains Exports and InternationalGroup
TIGER BRANDS INTERNATIONAL - EATBI, ETHIOPIA
Ethiopia drivers/ challenges
• Ethiopia trading challenges
• Slower performance in Home/ Personal Care in H2
• Encouraging market penetration initiatives
• Progress on fixing and optimising but much work remains
Tough trading conditions
56

Consumer BrandsNigeria Grains Exports and InternationalGroup
TIGER BRANDS INTERNATIONAL - CENTRAL AFRICA
Growth drivers
• Excellent volume and share growth in all core categories
• Strong innovation pipeline – Hair care entry with Miadi brand gaining traction
• Chad volumes continue to positively contribute
• Strong brand support sustained
• Excellent progress on market penetration
Cameroon: Exceptional Performance
Net Sales R 659.1m +28%
EBIT R 103.5m +39%
57

Consumer BrandsNigeria Grains Exports and InternationalGroup
TIGER BRANDS INTERNATIONAL
• International expansion remains key growth vector
• Continue to drive growth in core business: availability and visibility
• Continued investment in facilities, people, brands
• Acquisitions remain a key theme
Strong set of results
58

Peter MatlareChief Executive Officer
Exports and InternationalGrains Consumer BrandsNigeriaGroup
Looking ahead…a platform for growth
• South African businesses
– Investment in people and brands
– A focus on innovation
– Driving efficiencies
– Prudent cost management
• International businesses
– DFM turnaround remains a key priority
– Emerging market acquisitions and greenfield opportunities where they make sense
While global consumer confidence remains muted, Tiger Brandswill continue to build on its strong brands, its positive momentum
and relentless execution against strategy
60