Embed Size (px)
Citation preview

0
INORGANIC ELECTROLYTES
by
M. Domeniconi>- K. KlinedinstCL N. Marincic
Cr _ C. SchlaikjerR. Staniewicz
L. Swette
Contract No. N00014-76-C--0524
From INTERIM REPORT
FrmJanuary 1976 to October 1977
Submitted to
OFFICE OF NAVAL RESEARC.'HArlington, Virginia
Apploved f~ l"
~L~1W tIE~LI IiINCORPORATED
NORGANIC ECRL YTES,
by
Arlinn Vinia
WataMarinchitt 015.Itae~ 0i
R.lt AVILnrIV Ee
680044IL3tIN0# S76-C-024ET
Am Janv~ o 07 hc xo 11
ABSTRACT'
A variety of subjects under the, eneral heading of "InorganicElectrolytes" have been investigated during the course of this program.
These are presented as" six separate studies summarized below.
'PART I. ANALYSES OF THE HAZARD POTENTIALS OF VARIOUS REACTION MODESAND MATERIALS INCIDENTAL TO THE OPERATION OF Li/SOCI CELLS
The hazards associated with the operation of Li/SOC12 cells arise upondisruption of the cell case by external physical damage, corrosion or
internal over-pressurization. Only the last mechanism was examined in this
study. Over-pressurization can proceed i, a gradual manner resulting
finally in failure of the cell case and the release of active cell mate-rials, or the over-pressurization can occur rapidly resulting in violent
!V. =disintegration of the cell. The mechanisms of over-pressurization can be,-, separated into two general categories according to the source of pressure;
(1) thermal mechanisms and (2) gas generation mechanisms.
Thermal mechanisms operate by vaporization and thermal expansion pri-marily, and the thermal sources may be external to the cell or internal.
The internal thermal sources may be electronic short circuits, ohmicpolarization effects, or exothermic chemical combination reactions (e.g.,
between the cell reactants, Li + SOC12 ; or between reactants and products
or other materials, Li + SO2, SOC 2 + Li N etc.). Any thermal source that
does not raise the cell temperature above the boiling point of thionylchloride produces a relatively low pressure increase (N15 lb/in. g), but
could result in failure of the case in a prismatic cell configuration.
Further heating to near the melting point of lithium would generate
pressures in the range of 150 lb/in.2g - 200 Ib/in. g. Any thermalsource that raises the cell temperature above the melting point of lithium
could initiate any one of several exothermic chemical combination reactions
resulting in explosive over-pressurization. Other exothermic chemical
reactions, that do not involve lithium metal, probably can occur over awide temperature range and are initiated or inhibited by other factors
which have not been established.
Gas generation mechanisms of over-pressurization may be based onchemical sources or electrochemical sources. An electrochemical source is
the gaseous discharge product, SO2. Chemical sources could be gaseous
thermal decomposition products (e.g., the decomposition of SOC 2 producingso2 and Cl2 or gaseous chemical reaction products (e.g., SOCI 2 + S
212 + . It appears that only the electrochemical generation of
22.iii
I0
gas is likely to occur, and this does not create significant pressure
except during deep discharge of the cell.
lI summary, the most hazardous conditions are generated by the two
categories of exothermic chemical combination reactions. Materials that
react directly with lithium (SOCj2, SO2, S) are in a metastable state that
is relatively safe below the mrelting point of lithium. The other types
of chemical combinations (involving Li2S or Li3N with SOC1 2) may occur at
ambient temperature and present the greatest hazard potential.
. PART II. PRELIMINARY SURVEY OF ALTERNATIVE ANODE MATERIALSCOMPATIBLE WITH OXYCHLORIDE CATHOLYTES.
The elements considered as alternatives to the lithium anode were
aluminum, zinc, magnesium and calcium. Zinc, magnesium and calcium showed
no signs of corrosion in the solvents. The aluminum, although it remained
bright and shiny, gave rise to gelatinous precipitates. Magnesium and zinc
exhibited relatively low open circuit voltages, approximately 1.8V and
1.35V, respectively. Calcium had an opezvcircuit voltage of 2.6V to 2.8V
but exhibited some discharge reaction limitations.
The alloys tested were aluminum based materials that were developed
for the NUSCAL battery. Thege were various combinations of Al with Zn,
Sn, Mg, In, Ga and Hg. Ndie of these alloys was stable in thionyl chloride
and all showed low open circuit voltages (approximately IV).
In summary, of the various materials investigated, only calcium
appears to be w~rth examining further as an alternative to the lithium
anode./
PART III. PRELIMINARY SURVEY OF ALTERNATIVE CATHOLYTESFOR IMPROVED LITHIUM CELL PERFORMANCE
Alternatives to both the electrolyte salt (LiAlCI4 ) and the solvent/
oxidant (SOCI2) were investigated. The electrolyte salt investigated was
based on substitution of the Lewis Acid, SO3, for AlCl 3 , to form LiSO 3Cl.
The suitability of this material was to be examined in four solvents,
POC13, SOC12, so2C12 and $205C12. Various problems were encountered in
preparing and dissolving the lithium chlorosulfonate which were not resolved
during the course of the program. The only cell with sufficiently conductive
electrolyte to be operated electrochemically (based on POCl 3) gave ambiguous
results.
iv
Alternative solvent/oxidants investigated were S205C12 and nitrobenzene.
Pyrosulfuryl chloride has a boiling point of 152 0C (compared t' 79 0C for
thionyl chloride), reacts with sulfur (which could be advantageous in re-
moving discharge product sulfur), and does not react with lithium. However,
S205S12 did not dissolve sufficient LiAlCl to form a usefully conductive
electrolyte solution. Substitution of LiSO Cl did not substantially alter3
the solubility or conductivity.
Nitrobenzene appears more attractive and may be useful as an organic
j cosolvent. This material was found to dissolve more than 1 mole/liter ofI LiAlCl4 and showed an open circuit of 3.5V vs. lithium and the ability to
42sustain a current of approximately 0.5 mA/cm2 above lV. Thus nitrobenzene
may be a potentially useful solvent/oxidant.
I PART IV. RESERVE MODE CONFIGURATIONS OF THE Li/SOCl2 CELLi2
Two reserve mode configurations of the Li/SOCl2 cell were investigated,
(1) a low rate semi-reserve electrolyte cell, and (2) a high rate reserve
electrolyte cell. In the semi-reserve concept the cell contains thionyl
chloride and the electrolyte salt (LiAlCl4 ) is held in reserve. There are>4
several advantages to this configuration; the thionyl chloride alone is
sufficiently non-conductive so that the cell cannot be made to explode by
short-circuiting, there is less severe passivation (voltage delay) and
V probably less self-discharge.
In the high rate configuration, lithium chloride is omitted and only
AlCl3 (the Lewis acid) is used together with thionyl chloride. The entire
electrolyte solution must be held in reserve to prevent self-discharge of
the lithium. The lithium chloride film which normally would protect lithium
from direct reaction with SOC1 2 is removed by the aluminum chloride. How-
ever, corrosion of lithium by this mechanism is slow enough to allow a fast
discharge after activation, as would be suitable in some applications
(e.g., torpedo propulsion). Because the discharge product LiCl (which
44 normally deposits in the cathode pores) is soluble in this electrolyte,
high rate discharge is possible without premature clogging of the cathode.j Rates up to 70 iT!A/cm were achieved with simultaneous delivery of more than
three times the capacity obtained in standard electrolyte. Polarization
losses were severe at these rates, but the observed cell voltage (approxi-
mately 2.8V) may still be sufficient for short-run applications.
v

PART V. DETERMINATION OF THE DISCHARGE REACTION MECHANISMSIN Li/SOC 2 CELLS*
21.
Qualitative observations and chemical analyses have verified that LiCi,
S, SO2, LiSO3 and Li2SO4 are products of the discharge reaction in Li/SOCl2cells. The objective of this studywas to establish the reaction stui-chiometry. Two approaches were used: (1) chemical analyses of the dischargeproducts by collection an61 analysis of gaseous materials, and analysis ofthe materials contained in the electrolyte and cathode; and (2) controlledpotential coulometry of thiunyl'chloride in a supporting solvent (POCI3).
The results of the chemical analyses indicate that at room temperatureand above the predominant reaction is:
4Li + 2SOC12 4LiCl + S + SO2 (a)
The quantity of Li2SO3 foimed was generally about 1% of the theoretical
amount predicted by the reaction:
SLi + 3soc42 6LiCl + 2S + Li2SO3 (b)
This finding was supported by the coulometric analysis, in which thionylchloride was observed to yield 2.00 equivalents/mole, as predicted by (a),
and not 2.67, as predicted by (b).
The analysis of the stoichiometry of the reaction below room
temperature has not been completed.
PART VI. INVESTIGATION OF INORGANIC LIQUID OXIDANTS ASCATHODE REACTANTS FOR SEA WATER BATTERIES
Various inorganic liquid oxidants were investigated for use as cathodereactants in place of AgCl in the AgCl/Mg sea water battery. Theliquidoxidants (S02C12, SOC1 2, POC1 3, S2C121 SC1 2 ) were fed to the back side ofa porous carbon electrode in contact with an aqueous electrolyteiand
discharged vs. various magnesium alloy anodes (supplied by NUSC)I Thebest performance was obtained with sulfuryl chloride in general in par-
ticular. SO2C12 containing 1M NaAlCl 4 vs. MTA 75 alloy (7% thallium, 5%aluminum), wIth 3.5% NaCl electrolyte. This couple exhibited an open
circuit voltage of 2.96V and sustained a 100 ohm load at 2.50V (compared
to 1.6V for AgCl).
vi

The reactive species involved may be decomposition products formed
on contact with water, sucTh as H2SO4 in the case of sulfuryl chloride.
Investigation of the direct use of such decomposition products, in place
of the oxyhalides, was not completed on this program.
A
S'4
vi
vi,jA
ACKNOWLEDGMENT
We would like to acknowledge the initial work done in the areas of
alternate anodes, alternate catholytes, semi-reserve electrolyte cells,
and sea water batteries by Dr. James J. Auborn, formerly of GTE Laboratories,
-nd the assistance in coordinating all the tasks by Mr. Francis G. Murphy,
Program Manager.
Some of the work presented in this report was not performed specifically
A_ for this contract (e.g., Sec. I - Analyses of Hazard Potentials; Sect. V -
Peaction Mechanisms), but has been included because of its relevance to theoverall Li/SOCI2 cell development program. In this regard, we would also
3 ike to acknowledge the assistance received from Mr. Franz Goebel (GTE/
S7lvania - Communication Systems Division) in short circuit testing and
clectrolyte-SO2 analyses.
ix

TABLE OF CONTENTS
Section Page
I Analyses of the Hazard Potentials of Various ReactionModes and Materials Incidental to the Operation ofLi/SOCl2 Cells 1
1. Introduction 1
1.1 CVjectives 1
kv 1.2 Technical Approach 1
2. Technical P-esentation: Investigation of theSources of Internal Cell Pressure 3
2.1 Thermal Mechanisms of Pressurization 3
2.1.1 Exteriil Thermal Sources 3
2.1.2 Internal Thermal Sources 5
2.2 Gas Generation Mechanisms of Pressurization 27
2.2.1 Chemical Sources 27
2.2.2 Electrochemi,!al Suorces: GaseousDischarge Products 31
3. Summary, Conclusions and Recommendations 39
II Preliminary Survey of Alternative Anode MaterialsCompatible with Oxychloride Catholytes 41
W 1. Introduction 41
1.1 Objectives 41
1.2 Technical Approach 41
2. Technical Presentation 43
2.1 Alternative Anodes: Elements 43
2.1.1 Experimental Procedure 43
2.1.2 Results and Discussion 44
2.2 Alternative Anodes: Alloys 49
2.2.1 Experimental Procedure 4)
2.2.2 Results and Discussion 49
3. Summary, Conclusions and Recommendations 51
gX
TABLE OF CONTENTS (Continued)
Section Page
III Preliminary Survey of Alternative Catholytes for
Improved Lithium Cell Performance 53
1. Introduction 53
1.1 Objectives 53
1.2 Technical Approach 53
2. Technical Presentation 59
2.1 Alternative Solvent/Oxidants 59
2.1.1 Experimental Procedure 59
2.1.2 Results and Discussion 59
2.1 Alternative Electrolyte Solutes 60
2.2.1 Experimental Procedure 60
2.2.2 Results and Discussion 61
3. Summary, Conclusions and Recommendations 63
IV Reserve Mode Configurations of the Li/SOCl 2 Cell 65
1. Introduction 65
1.1 Objectives 65
1.2 Technical Approach 65
2. Technical Presentation 67
2.1 Semi-Reserve Electrolyte Cells 67
2.2 High-Rate Reserve Electrolyte Cells 67
2.2.1 Experimental Procedure 67
2.2.2 Results and Discussion 68
3. Summary, Conclusions and Recommendations 71
V Determination of the Discharge Mechanisms inLi/SOC 2 Cells 73
1. Introduction 73
1.1 Objectives 73
1.2 Technical Approach 74
xii

TABLE OF CONTENTS (Continued)
Section Page
2. Technical Presentation 79
2.1 Experimental Procedure 79
2.2 Results 85
2.3 Discussion 89
3. Summary, Conclusions and Recommendations 93
VI Investigation of Inorganic Liquid Oxidants as CathodeReactants for Sea Water Batteries 95
1. Introduction 95
1.1 Objectives 951.2 Technical Approach 96
2. Technical Presentation 97
2.1 Experimental Procedure 97
2.2 Results and Discussion 97
3. Summary, Conclusions and Recommendations 101
VII References 103
xiii
LIST OF ILLUSTRATIONS
Figure Page2
P1 SOC 2 Vapor Pressure vs. Reciprocal Temperature
2 Remote Short Circuit Test Fixture and ElectrodeConfigurations 7
I 3 2000-Ah Cell Short Circuit Test (0.012 Ohms) 18
4 Temperature Profile of a Cathode Limied Prismatic TestCell During Discharge at 10A (2 mA/cm ) 21
5 Maximum Profile Temperature and Voltage vs. Time forPrismatic Test Cell 22
6 Free Energy Changes for Reactions of Li with SO2, S,and SOC 2 23
7 SOCI 2 Thermal Decomposition Thermodynamics 29
8 Free Energy Change for the Reaction 2 SOC1 2 + 3 S- 2 S2 C12 + SO2 30
9 Apparatus for Collecting SO2 Expelled from DischargingCells 33
10 SO Solubility in Standard Electrolyte vs. l/T 34
11 SO2 Solubility in Standard Electrolyte vs. T 3312 Anode Limited SO2 Test Cell 36
13 Cathode Limited SO2 Test Cell 36
14 Order of Chloroacids and Chlorobases in PGCl3(1) 1M Solution, (2) 10-4M Solutions 5
15 High Rate Li/SOCl2 Cell. Effect of Solute Ratios andConcentr tions of Discharge at Current Density of70 mA/cm4 69
16 Open Circuit Potential of a Li/S0C1 2 F Ceail vs. Temperature 77
17 Controlled Potential Electrolysis 80
18 SO2 in SOCl 2 , Infrared Spectrum 83
19 Beer's Law Plot SO in $0C12 83
20 Vapor Pressure Vessel Configuration 84
21 %Cell Capacity Accounted for Based on 7 Li + 4 SOC123/2 S2Ci2 + Li 2 SO4 + 5 LiCl 86
22 Pressure-Temperature Behavior, SOCI with SO 88
23 Pressure-Temperature Behavior, Electrolyte fromDischarged Cell 88
24 Pressure-Temperature Behavior, Electrolytc fromDischarged Cell 89
xv

LIST OF TABLES
Table Page
1-A Short Circuit Testing: Li Foil land/or Ca~rbon) vs. ExmetSubstrate (Power Source- 2000 Ahr Li Cell) 10
I-B Short Circuit Testing: Li Foil vs. 0.025 in. Diameter NiWires (Power Source- 2000 Ahr Li/SOCl2 Cell) 12
I-C Short Circuit Testing: Li Foil v'. Single Ni Pin (or Carbon)(Power Source-Lead/Acid Battery 2V or 4V) 13
I-D Short Circuit Testing: Li Foil vs. 0.025 in. Diameter NiK: Wires or Ni Rod (Power Source-Hiqh Power DC Power Supply) 14
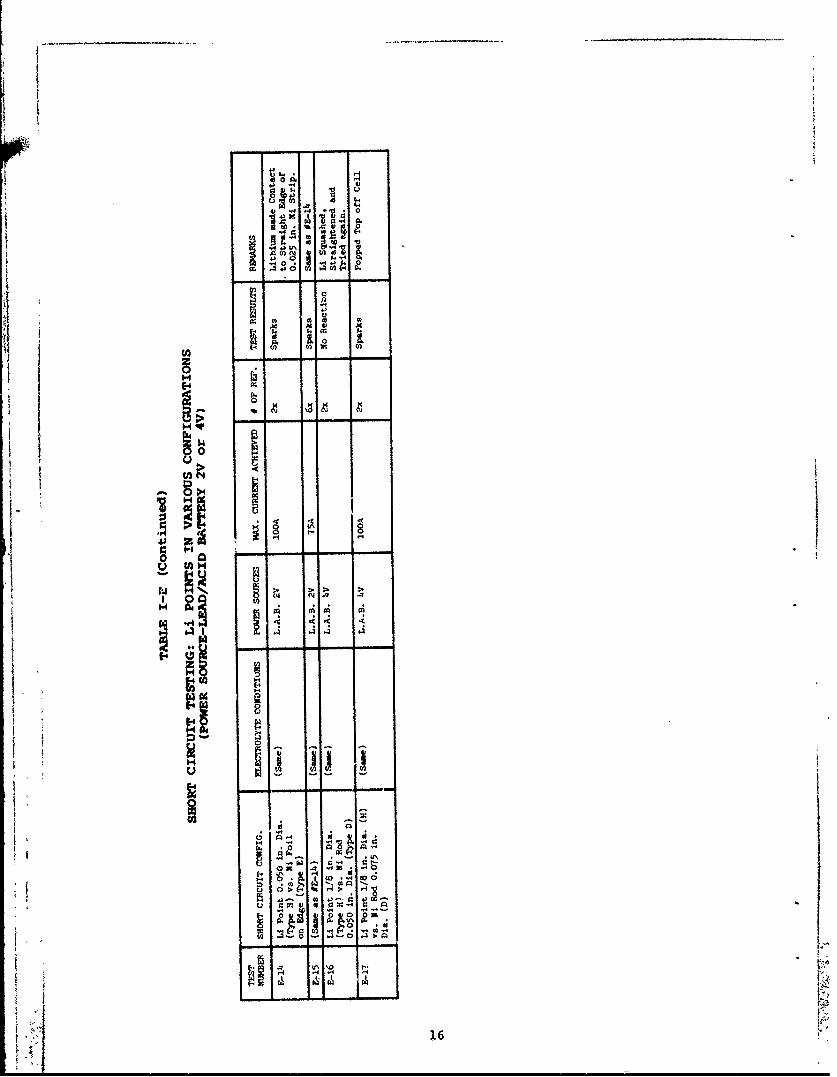
I-E Short Circuit Testing: Li Points in Various Configurations(Power Source-Lead/Acid Battery 2V or 4V) 15
II Characteristics by Possible Anoe Metals (Ranked byDecreasing Value) 42
III Electrochemical Characteristics of Ca Anodes: Polarizationfrom Open Circuit vs. Current Density 46
IV Electrochemical Characteristics of Ca Anodes: Cell Voltagevs. Current Density 47
V Melting Points and Boiling Points of Various Solvents 54
VI Donor Numbers (DN) and Dielectric Constants (c) of- Various EPD-Solvents 55
X. VII Equivilents Per Mole of SOCI2 and Open CircuitPotentials Predicted by Cell React~ons 76
VIII Samples of SOCI with Carbon, SO-, S, and LiAlCl4IVY" Used in Pressuri Vessel Tests 84
Ix Controlied Potential Coulometry of SOC12 in aSupporting Electrolyte at 3.30V 85
X Performance of MTA Magnesium Alloy vs. SulfurylChloride (Aqueous NaCl) 98
Xi Performance of MTA Magnesium Alloy vs. VariousCathode Reactants in 3.5% Aqueous NaCl 98
xvi-,
I. ANALYSES OF THE HAZARD POTENTIALS OF VARIOUS REACTION MODES ANDMATERIALS INCIDENTAL TO THE OPERATION OF Li/SOC 2 CELLS
1. INTRODUCTION
1.1 OBJECTIVES
Li/SOC 2 cells of recent construction are all hermetically enclosed
within stainless steel cases. Consequently the hazards associated with
the storage, handling, and discharge of the cells (exclusive of the elec-
trical hazards of large arrays of cells, common to all systems) can occur
only by disruption of the cell case. Cell case failure could be caused by
external physical damage, corrosion, or internal over-pressurization.
Corrosion failure of the case is virtually eliminated through the use of
304L or 316L stainless steel, and the effects of physical damage are mostlypredictable and controllable by proper handling; consequently, these mech-
anisms of cell case failure were not specifically analysed in this study.Internal overpressurization has been the only observed mode of cell case
failure, and this mechanism was the principal subject of investigation inthis study. The objective of this study, then, was to ascertain the ap-
proximate relative risk associated with various known and hypothetical
mechanisms of pressure generation within a sealed lithium/thionyl chloride
cell.
1.2 TECHNICAL APPROACH
Mechanisms of pressure generation within the cell were postualted on
the basis of: 1) materials and reactions that are known to occur in
Li/SOC 2 cells; and 2) materials and reactions that might occur, or that
have been suggested by other investigators to occur, in Iui/SOC12 cells.
The mechanisms of pressure generation were separated into two cate-
gories according to the source of pressure: 1) thermal mechanisms, which
operate primarily by vaporization of the solvent and thermal expansion of
vapors and gases; and 2) gas generation mechanisms.
The technical approach was to perform a literature survey collecting
4 qualitative and quantitative information and thermodynamic data on thepostulated reactions, in order to evaluate the potential risks. Experi-
Y mental verification was attempted in some cases for which the available
information was inadequate for an approximate calculation or a qualitative
judgement.
2. TECHNICAL PRESENTATION: INVESTIGATION OF THE SOURCES OF INTERNALCELL PRESSURE
2.1 THERMAL MECHANISMS OF PRESSURIZATION
2.1.1 External Thermal Sources
2.1.1.1 Analytical Procedure - External thermal sources can be separated
into two ranges: 1) room temperature to about 800C, representing the normal
environmental limit; and 2) above 80 0C, representing accidental exposure
to excessive heat or incineration. Above the melting point of lithium
(1800C) the pressure generation mechanism will be altered drastically toan internal source (exothermic chemical combination reactions) as will be
discussed in Section 2.1.2.3
Below the melting point of lithium the pressure generated will consistof vaporization of thionyl chloride according to the following equation, by
Arii: l12
logi0P = 7.60844 - 1648.21/T (1)
(where P is in millimeters of mercury and T is in degrees Kelvin)
and by thermal expansion of any entrapped air according to the ideal
gas law:
P = (nR/V)T (2)
The approximate pressure to be anticipated has been calculated for an in-
crease in cell temperature upto the boiling point of thionyl chloride (79 C)
and up to the melting point of lithium (180°C).
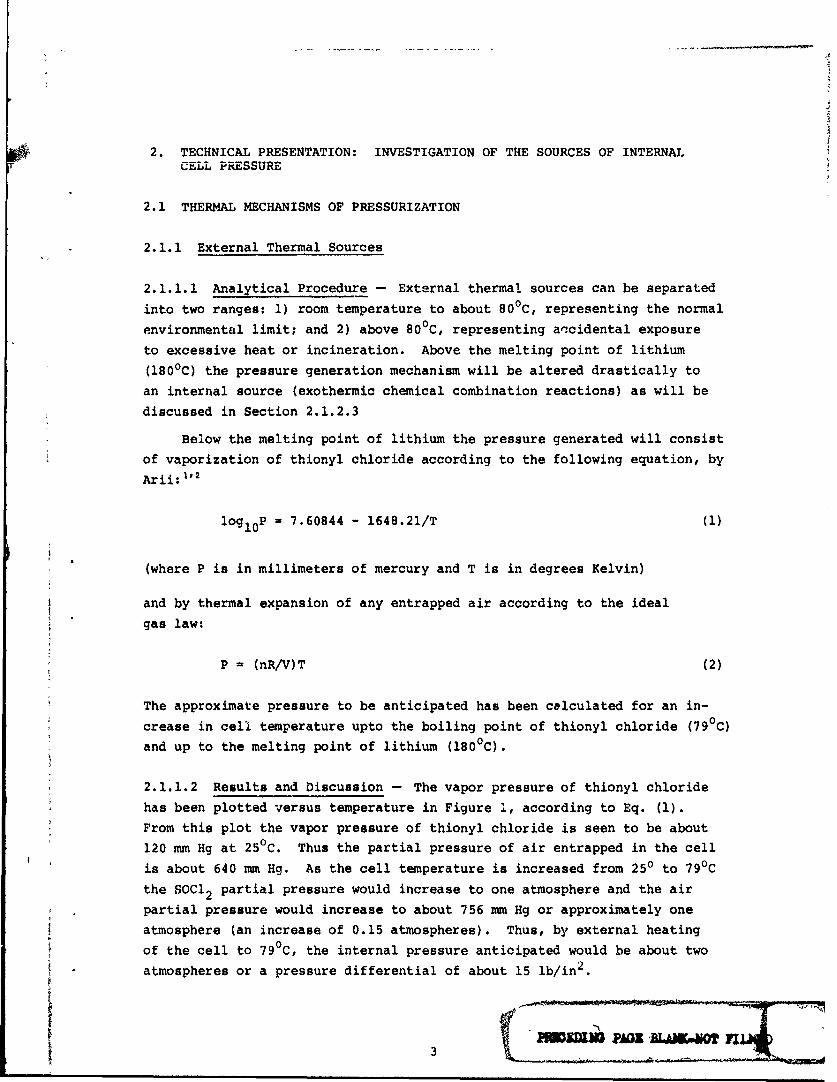
2.1.1.2 Results and Discussion - The vapor pressure of thionyl chloride
has been plotted versus temperature in Figure 1, according to Eq. (1).From this plot the vapor pressure of thionyl chloride is seen to be about
120 mm Hg at 25 0C. Thus the partial pressure of air entrapped in the cell
is about 640 mm Hg. As the cell temperature is increased from 250 to 790C
the SOCd2 partial pressure would increase to one atmosphere and the air*partial pressure would increase to about 756 mm Hg or approximately one
atmosphere (an increase of 0.15 atmospheres). Thus, by external heating
of the cell to 790C, the internal pressure anticipated would be about two
atmospheres or a pressure differential of about 15 lb/in2 .
3PAEBM O?1
1000
N
1100-
78.8 70 60 50 40 20 [C]
10 1 1l I 1 1 l T I 1 ,2.8 2.9 3.0 3.1 3.2 3.3 3.4 3.5
1/T ['K x 1031
Figure 1. SOCl 2 Vapor Pressure vs. Reciprocal Temperature
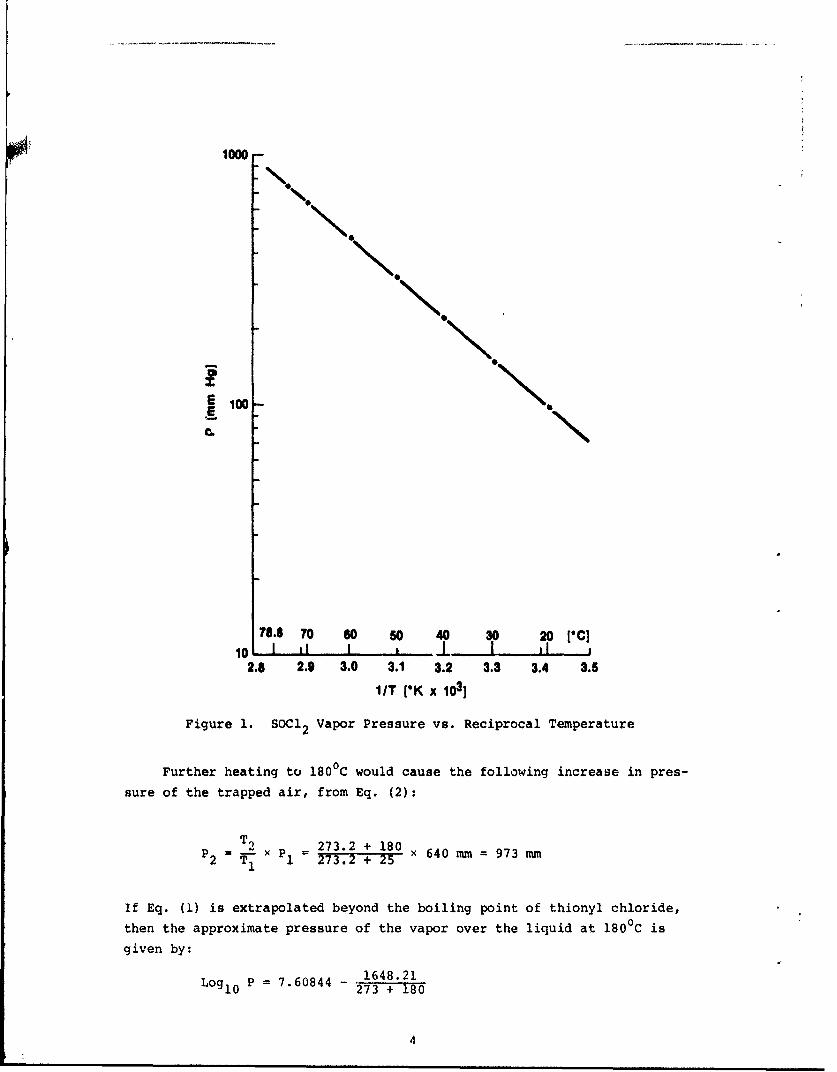
Further heating to 180 0C would cause the following increase in pres-
sure of the trapped air, from Eq. (2):
TI 273.2 + 180P2
= T X P1 = 273.2 + 25 x 640 mm = 973 mm
If Eq. (1) is extrapolated beyond the boiling point of thionyl chloride,
then the approximate pressure of the vapor over the liquid at 180 0C is
given by:
Log10 P = 7.60844 - 1648.21
4

Thus P = 9333 mm or over 12 atmospheres. The combined total pressure is210,310 m or about 200 lb/in . The differential between the internal pres-
.2sure and the atmosphere is 200 - 14.7 = 185.3 lb/in ; this is reduced
slightly by the presence of the electrolyte salt.
It is clear that serious deformation of a prismatic cell case would
result from heating to slightly below the melting point of lithium. A2small cylindrical cell such as AA can withstand over 6500 lb/in , so that
such a cell could be heated to 180 0C without significant risk in terms
of vaporization of the solvent and thermal expansion of gases. The pos-
sible consequences of secondary effects due to heating will be considered
in Section 2.2.
2.1.2 Internal Thermal Sources
2.1.2.1 Electronic Short Circuits
2.1.2.1.1 Experimental Procedure - The term "short circuit" generally
means unintentional electronic contact between the anode and cathode of acell. There are three aspects of short circuiting to be considered:
1) arcing during partial contact, 2) local contact resistance heating and3) ohmic polarization heating.
jArcing occurs during initiation of contact and when contact is broken.After contact is established resistance heating may occur. Arcing is con-
sidered to be potentially hazardous if lithium metal is involved. The
resistance will be highest during partial contact and the hnat generatedin the area of the arc may be sufficient to spot-melt the lithium and
initiate an exothermic combination reaction (of the types that will bediscussed in Section 2.1.2.3). Similarly, the contact resistance heating
tproduced by the passage of a large amount of current through a small contact
area might also be hazardous if lithium metal is in the contact area.
Either of the above short circuit modes would be expected to become critical
rapidly. An arc will either initiate an instantaneous explosion or extin-
guish harmlessly; likewise contact resistance heating will produce meltingand terminate either in an explosion or "burning off" of the contact in a
matter of seconds.
If the short circuit contact has a low resistance, because of goodcontact in a large enough area, the mechanism will shift from localized
rapid heating to slower generalized heating of the cell as a consequence
5

of the sustained high discharge rate and the internal resistance of thecell (i 2R). The time to reach a critical temperature would be expected to
expand from seconds to minutes in this case because of the thermal inertia
of the cell. The effects of low-resistance short circuit heating will bethe same as described for an external thermal source; i.e., vaporizationof the thionyl chloride and expansion of the vapors and gases to approxi-
mately 200 lb/in 2 , up to the melting point of lithium. Cells of prismaticconfiguration would be expected to sustain deformation and/or failure of
the case with venting of the electrolyte (if pressure venting were not
provided) before reaching the melting temperature of lithium. Cells ofcylindrical configuration, on the other hand, would be expected to allow
a higher temperature excursion on short circuit since they will withstand
greater intern4l pressure, possibly allowing the temperature to reach themelting point of lithium, depending on the configuration of the electrodes
and heat transfer characteristics.
In order to ascertain the magnitude of the hazard potential of the
first two aspects of short circuiting, arcing and contact resistanceheating, a special apparatus was designed in which short circuits of variousconfigurations and power densities could be produced in a small reactor
separated from the power source. In this way the full power of lithium/
thionyl chloride battery (or other power source) could be safely passedthrough the controlled short circuit in the reactor, and any violent reac-
tions produced were reduced to containable magnitude. The reactor consistedof two electrical contacts, one stationary and one moveable by remote opera-
tion, in a small glass vessel as shown in Figure 2. In designing the testsan effort was made to produce short circuits of plausible configuration
involving lithium. Most of the tests were meant to simulate one type of
short circuit most easily identified as a real possibility, namely, a fila-ment of the cathode substrate (nickel expanded mesh) penetrating the sep-arator and contacting the lithium. These tests were performed with the
short circuit contact either completely submerged in thionyl chloride or
partially wetted. Other configurations less likely to occur were alsotested, such as a carbon-to-lithium short and contact between a cathodeframe and a filament of lithium (the latter situation could only occur onaccidental reversal of the cell and plating of dendritic lithium). The
short circuit current and voltage were read directly on meters or, forsome of the later tests, monitored on a high speed recorder.
6

POWER SOURCE 1a) 2 kAhr LI/SOCI2Coll
b] 2V or 4V P ./Acid Buttery
TEST c] Lambda FilteredCELL Power Supply
SWITCH
OSCILLOSCOPELITHIUM 0ANODE 0 -
COUNTER 0 mVELECTRODE -:" H RECORDER
U OSCILLO.SCOPE
ELECTROLYTE
ELECTRODE ARRANGEMENT
EXMET 0.025 In. die NI ROD NI Rod NI FOILNI WIRES d dia
0.075 In.
NICKEL iCONFIGURATION
TYPE A B C D E
LI FOIL CUP LI FOIL 0.00 0. 0 '.dla C CRO0.12 0.0In
LI ~ t LI f LI-
CONFIGURATION TUll
TYPE F a H I J K
Figure 2. Remote Short Circuit Test Fixture and Electrode Configurations
7

Ai, analysis of the consequences of a sustained short circuit (one that
does not burn off immediately) is difficult because of the many variables
involved. If the resistance of the contact area is near the design load
range of the cell, the cell will discharge harmlessly (except at the end
of discharge in some cases, as will be discussed in the next Section, 2.1.2.2).
If the resistance of the contact area is low enough, the discharge rate will
exceed the design rate of the cell and the consequences will depend upon tha
surface area of the electrodes, the capacity and state-of-charge of the cell,
the conductivity of the electrolyte, the heat transfer characteristics of
the cell configuration, the stress characteristics of the cell case, the
starting temperature, and probably other factors as well. Consequently, a
generalization about the effects of the short circuit, as well as experi-
mental investigation, is complicated in this case.
A D-size cell with concentric electrodes will not explode when ex-
ternally short circuited in the open environment at ambient temperature.
(The same is true for AA, C and DD size cells with concentric electrodes.)
It will exhibit an initial current in the range of 15A and stabilize at
3A or 4A. The current is limited by the low electrode surface area (approxi-
mately 40 cm2 ) and the resistivity of the electrolyte, and the temperature
rise is limited by the high thermal conductivity of the electrode configura-
tion; i.e., the lithium foil is in direct contact with the inside surface
of the cell case. If the same cell were thermally insulated or short cir-
cuited at a very high starting temperature, it would be expected to approach
the melting temperature of lithium and possibly explode.
A wound D-cell will explode when short circuited in the open environ-
ment at ambient temperature. This configuration has a high surface area
(300 to 400 cm2); the initial short circuit current reaches 40A to 60A and
stabilizes at 10A to 15A. The outer windings of the electrode structure
provide sufficient thermal insulation to allow the temperature of the inner
windings to reach the melting point of lithium. The maximum safe discharge
rate for a high surface area wound D-cell has been calculated and experi-
mentally confirmed3 to be 4A, at room temperature. It has also been
reported that a wound D-cell can be safely shorted at room temperature in
the open environment if the surface area is kept below about 150 cm2
(7 in. long electrodes).4 These examples give some indication of the com-
plex interplay of factors governing the hazard potential of various cell
configurations on short circuit, and the range of data available.
3
Any effect of a short circuit would be expected to be exaggerated for
the prismatic configuration due to the lower pressure capability of the cell
case. Fcr this reason various sustained short circuit experiments were
performed on prismatic cells on this program. A 2000 Ahr-cell, designed
for a 5A to 8A discharge rate, was short circuited externally through a
low resistant contact, and the cell voltage and current and the case pres-
sure and temperature were monitored. Three 100 Ahr prismatic cells were
subjected to internal short circuits: in one case a temporary barrier
between a small area of the anode and cathode was removed generating a
carbon-to-lithium short circuit; in two other celta, a metal ram was forced
between the anode and cathode frames generating a metal-to-metal short
circuit. In each test the viltage drop was monitored as a qualitativemeasure of the short circuit resistance and both pressure and cell case
temperature were monitored.
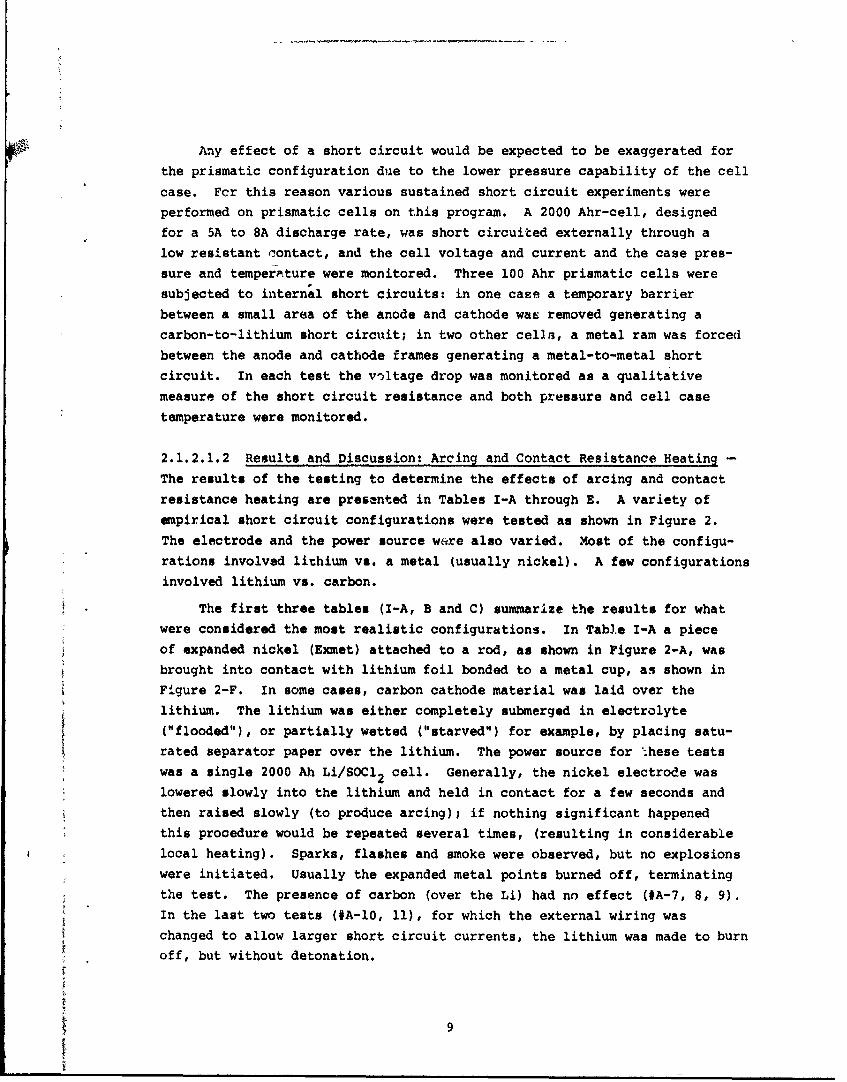
2.1.2.1.2 Results and Discussion: Arcing and Contact Resistance Heating -
The results of the testing to determine the effects of arcing and contact
resistance heating are presented in Tables I-A through E. A variety of
empirical short circuit configurations were tested as shown in Figure 2.
The electrode and the power source were also varied. Most of the configu-
rations involved lithium vs. a metal (usually nickel). A few configurations
involved lithium vs. carbon.
The first three tables (I-A, B and C) summarize the results for what
were considered the most realistic configurations. In Table I-A a pieceof expanded nickel (Exmet) attached to a rod, as shown in Figure 2-A, was
brought into contact with lithium foil bonded to a metal cup, as shown inFigure 2-F. In some cases, carbon cathode material was laid over thelithium. The lithium was either completely submerged in electrolyte
("flooded"), or partially wetted ("starved") for example, by placing satu-rated separator paper over the lithium. The power source for ':hese tests
was a single 2000 Ah Li/SOC 2 cell. Generally, the nickel electrode was
lowered slowly into the lithium and held in contact for a few seconds and
then raised slowly (to produce arcing); if nothing significant happened
this procedure would be repeated several times, (resulting in considerable
local heating). Sparks, flashes and smoke were observed, but no explosions
were initiated. Usually the expanded metal points burned off, terminating
the test. The presence of carbon (over the Li) had no effect (#A-7, 8, 9).In the last two tests (A-10, 11), for which the external wiring was
changed to allow larger short circuit currents, the lithium was made to burn
off, but without detonation.
9

- I -- - - - - - -e
1. 140 4: 8 c
.~ ~40to to
'o
, 'N xC
t H
U) Z) jl 4J
.1 H
04
00 0
OD m r
10

Table 1-B summarizes the tests in which small nickel wires were sub-stituted for the Exmet at the end of the contact rod, as shown in Figure 2-B.
This circle of wires was anticipated to withstand more arcing without burning
off. The rest of the set-up was similar to that described for the tests inTable 1-A. The lithium foil was thicker and the short circuit currents werehigher. Again sparks, flashes and smoke were observed, but no explosionswere initiated. In one case (#B), vaporization from overheating was suf-
ficient to blow off the demountable top of the cell, and in several casesthe lithium melted, but in no case was a violent reaction initiated.
For the tests summarized in Table I-C, the nickel rod terminating ina circle of small wires was changed to a nickel rod machined to terminatein a single short pin about 25 mils to 30 mils in diameter. The objectivewas to break the lithium surface and concentrate the power in a small area
while retaining sufficient conductivity to carry a large current without
burning off the contact. Simple tapering of the rod to a small point, asshown in Figure 2-C, was not suitable as indicated by the results of test#C-l. TI more reactive configuration was the short 25 mil pin shown in
Figure 2-D. Another significant change was the use of a lead/acid batteryin place of the 2000 Ahr Li/SOCd2 cell, both to increase the availablecurrent and to vary the applied potential. When one cell of the battery(2.1V) was used as the power source the current was in the range of 100A.Bright flashes were produced and the nickel pin was burned off, but no ex-plosions were initiated. When two cells of the lead/acid battery (4.2V)were used the current range was raised to about 200A. For this configura-tion, an explosion was initiated in test #C-5 and repeated in test #C-6.On the third repetition of this configuration (C#-7), the electrolyte washeated to 50°C before contact. On short circuit the nickel pin burned off
without producing an explosion. A repeat of this configuration (#C-8),again with electrolyte at 50°C, was tried with one cell of the battery (2.lV)to avoid burning off the pin. On the fourth contact the glass cell brokeand lithium combustion was initiated; i.e., the equivalent of a mild ex-plosion. The use of carbon cathode material in a sharp-edged or bluntconfiguration (Figure 2-J and K), in place of the nickel pin, did not allowpassage of any significant current.
The short circuit configurations used in this set of tests (Table I-C);
i.e., the special nickel pin configuration together with the use of a lead/acid battery, probably do not r-present realistic possibilities for a short
circuit in a Li/SOC 2 cell. However, consideration of all three sets ofdata (A, B and C) indicates that, although an internal short circuit of a
11

4) 4) :K 0 .ti4 o~4 4 4.)'X4 0. N 0 0
93 :p 94244) ou4.E- 0 0
0 40 1.H 14 . u.00 0 0 4) 0 0
CO 24424 '. 41 4- 002'> ~.2. 0 to~- to.
(14. 00 442 0 0 0
C4 3i 02 0 - .4-2 (f) m ;
C: 0 0'20 0 0 4
Cfl " E-.- l0 .
4iM4 r ~ 0H tO
"44
m 1
O~.p4
too
r.4C4
ta 1-0I.
0 0 42
.4 . IE 10..4
X 0 r- i4 ;F 40 0z
0214 t 2
in 0 4M0>0>0>00> 0> C
~ ~ *~.,a12

A, 0 40 %4 44, o
41-
'.4 4,w 4o.
0 0.4
* C O~g 4416d
11 40 ,
'-4 0
1A1
o4 0
00 00
-r4
v a%
W4.4 W"4W
0 ' C 0
131

4-01-40.0 4; au 0 0
' t0 4, IVCO .
0 4. , 0J Id 00u
1 OWCO toC V
40 0 0
4) J84CO 4
0.. >
"'0-4 -
4 o4
, (0
0%
414

a .~~S S .H1 4 ) 4
b~5. ;8 HOH4) 19
I M H0WO1-
0 4)3
a4 L)4 4) x
8 4)0
00 H
a a
0 A
- t
001 i
r4)
00
~ I16

critical configuration (i.e., a particular short metal fragment from thecathode repeatedly contacting the lithium anode in a very high power cell)may be unlikely to occur, there is some potential for an explosion to re-sult from an internal short, and due consideration must be given to thishazard potential in the design of large cells.
A number of other tests were performed to evaluate two somewhat moreremote possibilities of short circuits, representing possible events in aseries string of cells. The first of these is a short driven at highvoltage, representing the occurence of a critical internal short circuit
after installation of the cell in a series string. A high power dc supply
was used for these tests which unfortunately does not simulate a batterysince it is capable of extremely high current pulses (caused by discharge
of the filter capacitor of the power supply). These results are summarizedin Table I-D. Explosions were initiated more readily' but, surprisingly,they did not occur on first contact; rather s~me heating o the components
always occurred before an explosion was initiated.
The second less likely type of short circuit configutation evaluated
involved pointed lithium contacts (as opposed to a metal point contacting
a sheet of lithium). Such a situation might occur if a cell in a seriesstring reversed and lithium were plated forming dendrites; a dendrite mightthen penetrate the separator and short to the cathode. However, in earlier
testing it was shown that lithium-to-carbon shorts were too resistive to
produce a significant reaction. Consequently, only lithium-to-metal shorts
were tested, making this configuration even less realistic. These tests
are summarized in Table I-E. The power sources was again a lead/acid
battery. Explosions were obtained several times, particularly when two
cells of the battery were used. These results indicate that short circuits
involving a lithium point and a metal are highly reactive; these configura-
tions, however, are almost certainly not representative of a lithium dendrite-
to-carbon short circuit.
In sumary, several qualitative conclusions may be made regarding the
ericits of short circuit arcing and contact resistance heating:
L) An arc or spark between Li/SOCI 2 cell components does nounecessarily initiate an explosive reaction. Explosions can beproduced in particular configurations, but not nearly as readilyas might be anticipated.
2) Contact resistance heating alone appears more likely to terminateby burning off of the contact point than by explosion; the heatingproduced probably lowers the threshold for a subsequent spark-
induced explosion.
17

3) Spot-melting of lithium was observed to occur without initiation
of an explosion; an explosion could be produced more readily with
a short circuit involving a lithium point rather than lithium
foil, indicating that the high thermal conductivity of an anode
plate may significantly reduce the potential for an explosion on
short circuit in an actual celli
4) The influence of electrolyte conditions was not clearly established.
2.1.2.1.3 Results and Discussion: Sustained Short Circuits - A 2000-Ah
prismatic cell, designed for discharge at 5A to BA, was short circuited
externally through 0.012Q. The results of this test are shown in Figure 3.The cell sustained about 190A (at approximately 2.8V) for about 45 min. and
dropped to about 50A to 100A for another hour. The surface temperature
rose to approximately 900C and the pressure, near the end of discharge,rose to approximately 20 lb/in2g. An internal short circuit was apparently
generated after about 90 min. and relieved again after about 100 min. Aftertermination of the test the cell case was found to be quite distorted but
it did not burst or vent.
3.6
3.2 CURRNT 0
VOLTAGE
1.4 . 80.100
2.
18

Internal short circuits were produced in two 100 Ah cells as describedpreviously. The carbon-to-lithium short was initiated by removing a tem-porary barrier between a portion of the two electrodes. The contactarea was approximately 0.3 cm2. On initiation of the short the cell voltagedropped from 3.6V to 3.5V, indicating that a high resistance contact wasformed, as was found in spark testing previously (Table I-C). Consequently,the current drain was not excessive and the cell discharged near (or above)its design rate in a quite normal manner. The temperature rise was in-significant (10C), and theur was no indication of a pruosur6 increase.
The metal-to-metal internal short circuit was induced by forcing ametal ram between the anode and cathode frames of a 100 Ahr cell. Thevoltage dropped from 3.6V to 0.38V in four minutes, indicating extranelygood contact. The case temperature rose from 240 to 370C in the firstfour minutes. The test was continued for 39 min., at which time the tem-perature had leveled off at 500C. The maximum pressure increase was about
22 ib/in . A repeat of this test with another cell gave very similarresults.
The following qualitative conclusions may be made regarding sustained
short circuits:
1) Carbon-to-lithium shorts have quite high contact resistance andprobably allow only low rate discharge of the cell.
2) Li/S0C12 prismatic cells can withstand quite low resistance shortcircuits, external or internal, without failure of the case or
explosion. Distortion of the case under relatively low pressurewould be expectedl this might lead to additional internal shortcircuits and increased hazard potential.
3) The high current density characteristic of a short circuit has theeffect of terminating the discharge prematurely i.e., the cell
becomes completely polarized after delivering only 10% or even
loss, of its capacity.
2.1. 2.2 Polarization Effects
2.1.2.2.1 Analytical Procedure - The amount of heat produced on normaldischarge of a Li/SOCl2 cell is minimal. The enthalphy of the reactionhas been estimated from changes in the open circuit voltage versus tem-perature (from about -20° to 720C) according to:
AH-- nF(E-T ) (3)
19

where:
tH = enthalpy, Kcal/mole
n - no. of equivalents/mole
F - 23.06 Kcal/V-equivalent
E = cell open circuit potential at temperature T
T - temperature, degrees K
The open circuit potential was found to vary linearly with temperature over
this range, the value of MB/aT being +1.026 mV/degreel AH is then -77 Kcal/
equivalent.* Using this value, a "thermoneutral" voltage (VH) can be cal-
culated as:
- H 3.34 volts (4)
This is the operating potential at which the heat generated by iR loss isjust equal to that absorbed by the entropy change. Thus, for polarizationfrom open circuit (approximately 3.65V) to 3.34V, which is below the typicaldiscnarge voltage of about 3.4V, there should actually be a slight netcooling effect. In practice the tmperature of the cell tends to remain
constant during discharge at moderate rates (< 2 mA/cm2).
Near the end of discharge, cell polarization increases rapidly, witha corresponding increase in heat production. In the case of an anode limitedcell (i.e., a cell in which the capacity is determined by the mass oflithium), the voltage tends to drop sharply at the end of discharge and theperiod of high heat production is short. In a cathode limited cell thevoltage drop near the end of discharge is slower extending the period of
higher heat production. The temperature in a cathode limited cell mightrise to 400 or 50°C at the end of discharge. This is not a significant
change, as was discussed in Section 2.1.1. However, the concurrence ofthis temperature rise with the end of discharge has the secondary effectof expellin3 the dissolved S02 that was formed during the discharge. This
will be examined further in Section 2.2.2. In order to determine the thermalcharacteristics of a cathode limited cell on discharge, a 2000 Ahr cell was
designed to accomodate four thermocouples in the electrode stack and two onthe cell case. The cell was then discharged on constant load, equivalent
to 2 mA/cm 2 , down to 1.OV, and the temperature at the various locationswas monitored continuously.
*See Figure 16, Section V.
20

2.1.2.2.2 Results and Discussion - The temperature profile across thestack is shown in Figure 4 at various stages of the discharge. It can be
seen that there is a differential of 30 to 40C between the center of the
stack and the case at the tnd of discharge. The complete discharge curve
with the corresponding maximum cell temperature is shown in Figure 5. It
is apparent that the cell temperature is only a few degrees above ambient
throughout the discharge and fairly constant. While the operating potential
is above the "thermoneutral" voltage, the temperature rise due to iR loss
should theoretically be more than compensated for by the heat absorbed by
the cathode during the entropy change. The apparent heating observed in
probably due to poor heat conduction within the cathode. The temperature
rise begins at the end of the discharge plateau, when the cell voltage
drops below the "thermoneutral" voltage, and reaches a maximum of about
390 to 400C. (The cell was discharging on constant load so that the cur-
rent diminished with the voltage, and heat production thus gradually dis-
minished also.) This temperature rise in itself is not sufficient to cause
a problem by vaporization and expansion of thionyl chloride, as mentionedabove.
CELL TEMPERATURE40 - AT 1.76V
38
CELL TEMPERATUREAT 2.31V
1 2 3 4 5 6 [THERMOCOUPLE LOCATIONS]
1 CELL CELL STACK CELL
CASE CASE
Figure 4. Tem~perature Profile of a Cathodl Limited Prismatic Text CellDuring Discharge at 10A (2mA/cm
21

3.0A iAK LOAD
3. - 8-ODTEPRTR
3 0
CELL VOLTAGEw 2.0
1.0 MAX CELL CORE TIM. AND VOLTAGE VS.TIME OF PRISMATIC TEST CELL WHILE ONCONSTANT LOAD DISCHARGE AT 2mA/em 2
0 20 40 00 00 100 120 140 160 100 200
TIME ihi]
Figure 5. Maximum Profile Temperature and Voltage vs. Time forPrismatic Test Cell
It may be concluded that the heating that occurs at the end of die-
charge in a cathode limited cell has the potential hazard of releasing
discharge-product SO2from solution and slightly overpressurizing a pris-
matic type cell. This effect can be mitigated by ending the discharge at
3V or by using an anode-limited configuration.
2.1.2.3 Exothemic Chemical Combination Reactions
2.1.2.3.1 Reactions with Molten Lithium - Lithium metal should react
directly with various materialc that occur in the cell such as the solvent/
cathode reactant SOC 2, and discharge products such as sulfur and sulfurdioxide. The free energy changes ol such reactions have been calculated
and are compared in Figure 6. All three reactions should occur sponta-
neously with the release of large amounts of thermal energy.
f 22

The room temperature heats of reaction are as follows:
6 Li + SOCI 2 * Li 2 0 + Li 2 S + 2 LiCI (-394 Kcal/m) (5)
6 Li + 3 S + 3 Li 2S (-320 Kcal/m) (6)
6 Li + SO2 Li2 S + 2 Li2 0 (-321 Kcal/m) (7)
These reactions do not occur in actual cells because the lithium is alwayscovered by a protective layer of LiCl, This layer has been determined byinterfacial capacitance measurements (by Peled and Yamin5 ) to have a minimumthickness of about 2 nm to 4 rm. It is postulated that the LiCl acts as acationic conducting solid electrolyte and discharge of Li proceeds by trans-
port of Li+ through the LiCl.6 Thust the lithium is protected at all times
from direct reaction with other materials, on open circuit or on discharge.
However, if the cell temperature exceeds the melting temperature of lithium,
the protective layer is apparently not maintained, and any of the above
reactions may occur. The sudden release of large amounts of thermal energy
accompanying these reactions results in drastic overpressurization and
explosion of the cell.
.240
M ILI + W'U + lli
!-4 + LI1 + L120 + 2LICI.230
.. . SL .. IIi+3 , 3i.I
II
go no0 400 go0 Soo 70 30 900
TEMPERATURE ('Kj
Figure 6. Free Energy Changes for Reactions of Li with S02, 5, and SOCl2
23

Thus, it may be concluded that although direct reactions with lithiumdo not occur under ordinary circumstances, any mechanisms which can raise
the temperature of the cell to the melting point of lithium (180 C) present
a serious hazard potential.
2.1.2.3.2 Other Types of Chemical Reactions - A survey of other reactivematerials that might occur or be produced in a Li/SOC12 cell yielded hydrides
of Li or Ni, Li2S, and Li3N.
A brief consideration of the possibility of the occurence of nickelhydride, on the expanded nickel substrate of the electrodes, indicates that
it is not likely to be present in any significant quantity if at all. Ifthe expanded nickel were annealed in hydrogan, some hydrogen might be re-
tained as a hydride or a chemisorbed layer. The formation of a hydrideappears unlikely since the accumulated evidence indicates a very low sta-
bility for the nickel hydride (AGf NiH0 .5 , + 5.64 Kcal/mole R2; theunfavorable AGO results from a negative entropy of formation). That nickelhydride is exceptionally unstable is evidenced by a decomposition pressureof over 3000 atm at 25 C.7's Theie preparative conditions are not present
in ordinary hydrogen annealing of nickel and this strongly suggests thatthe nickel c.met is a single metallic phase. Chemisorption of a monolayer
or hydrogen on the nickel surface, on the other hand, is possible. However,
the expanded nickel would not present sufficient surface for the absorptionof any significant quantity of hydrogen nor would it be retained throughall the subsequent processing of the material in fabricating electrodes.
Lithium metal forms a well defined ionic hydride, LiH (a sodium chlo-ride type lattice consisting of Li+ and H_ ion)i the free energy of formation
is -16.16 Kcal/mole at 250C.7 It is highly reactive with water producingLiOH and H2, and it is reported to react vigorously with oxidizing agentswith "ome hazard of detonation with powerful oxidants. 9 Thus LiH might beexpected to react violently with thionyl chloride (and/or SO2). At least
two such reactions are possibilities:
2 SOC 2 + 2 LiH 2 HCl + SO2 + 2 LiCl + S (Hf - -158) 8)
2 SOCI 2 + 2 LiH * 2 H2 + so2 + S + LiCl (AHf - -24.8) (9)
Lithium hydride is prepared commercially by reacting molten lithium with
hydrogen gas at 725 0C and < 100 Torr pressure.' In a cell, lithimi hydridemight form an lithium by reaction with HCl in the electrolyte (HCl canbe generated by hydrolysis of the thionyl chloride on contact with moistI air):
24
Li + HCI LiCI + 1/2 H2 (AG = -69 Kcal/mole) (10)
2 Li + HCl -P. LiC1 + LiH (AGO -85.4 Kcal/mole) (11)
2 i+ +~ f i ii(G
Since both Li+ and H+ can be transported through the protective film of
LiC1 on the lithium, LiH might form under the Lie1 layer, protected from
immediate reaction with SOC12 , and thus accumulate. The quantity of LiHthat could be present by any mechanism, however, would be expected to belimited by two factors: 1) the amount of HCI in a sealed cell is extremely
4 limited (ppm range), and 2) any LiH formed would be expected to react
further with HC1 according to:
LiH + HC1 4 H + LiCl (AGO - -52.6 Kcal/mole) (12)
Comercially prepared lithium hydride powder (Pfaltz & Bauer, Inc.)
was exposed to thionyl chloride in the open atmosphere, in a dry argonatmosphere, at room temperature and at the boiling temperature of thionyl
chloride to determine its reactivity. There was no observable reactionunder any of the above conditions. It is concluded therefore, on boththeoretical and experimental grounds, that the occurrence or reaction ofLiH does not present a significant hazard potential.
Holleck, Turchan and Cogley have reported" that anhydrous Li2S reactsviolently with SOd 2 generating considerable heat, gas and elementel sulfur.
A possible reaction may be:
2 Li2S + 2 SOCI2 SO2 + 3S + 4 LiCl (AHf - -147.6 Kcal/mole) (13)
A.N. Day has reported that lithium and sulfur react at 178 °C (by DTA analysis),presumably to form Li2S." Apparently the lithium is covered by a layer oflithium sulfide which prevents further reaction until either the lithiummelts (1800C) or the Li2S dissolves in the molten sulfur, exposing thelithium surface. Lithium sulfide is not a discharge product and its presence
has Pot been detected in Li/SOCI2 Cells. Sulfur, which is a discharge pro-duct (formed at the cathode and soluble in the electrolyte upto about 1.1M),
would not be expected to react with the lithium because of the protectivefilm of LiCl on its surface. However, this film is formed by the directreaction of lithium and thionyl chloride and sulfur is formed along withthe lithium chloride:
4 Li + 2 SOC1 2 + S + SO2 + 4 LiCl (14)
25
A trace of sulfur has been reported in this film;12 consequently, it Wnaybe possible for some Li.S to form on the surface of the lithium. Thequantity would be expected to be very small, and none has been detected or
reported.
In order to determine the reactivity of Li2S, commerically preparedmaterial (Foote Mineral Company) was exposed to SOC12 . (The material wasgray rather than white. It is prepared by slowly adding H2S to finelydivided lithium in a coordinating solvent such as THF. The material is
dried at 200 0C, and subsequently sintered at a higher temperature to
decompose the residual solvent. The decomposition of the solvent pruducescarbon and gives the material its gray color.) The Li2S was insoluble inSOC1 2 and did not react at room temperature or at the boiling temperatureof SOCI2. The experiments were performed under dry argon and in the openatmosphere without effect. Thus the hazard potential of Li2S in contact
with SOC1 2 is probably minimal, but remains uncertain.
Lithium reacts directly with atmospheric nitrogen to form lithium
nitride:
3 Li + 1/2 N2 * Li3N (AGO - -37 Kcal/mole) (15)
This reaction occurs only very slowly in dry nitrogens however, the reactionproceeds readily in moist air and, once initiated, continues in dry nitrogen. 13
Evidence of this reaction has been observed in the form of purplish-black
spots on the surface of lithium stored in air at 1% to 4% relative humidity(dry room conditions). Although Li3N has not been reported to react withthionyl chloride, it might well be expected to; finely divided Li3N is
stated to be flammable in air.1 Li3N in also reported to react with sulfurto form cyclic sulfur imidest'
5
S + Li3N -* SN_ + S4N_ (16)
Two sources of Li3N were tested for reactivity with SOC12: 1) com-mercially prepared powder obtained from Polyresearch Corp. (98.9%) and,2) particles of lithium nitride removed from old lithium foil (dark spots1 mm to 2 mm in diameter on the surface of Lithium). The latter were groundto a powder in a dry argon atmosphere (1 ppm H20 dry box). NeitNer of thosematerials was soluble in thionyl chloride and showed no reactivity withSoC12 in the dry argon atmosphere. However, both materials, when added toSOCi2 in the normal atmosphere, reacted violently burning even in the vaporabove the liquid. Similarly, Li 3N powder exposed to the normal atmosphere
26

briefly (a few seconds), and then added to thionyl chloride in the dry argonatmosphere, also reacted violently. A larger piece of Li3N exposed to theatmosphere, unlike the ground powder, did not react with SOCd2. The mecha-nism of this reaction has'hot been established, but possibly the Li3N reactswith moisture tn the air to form a more reactive amide:
Li3 N + H20 * LiNH2 + Li20 (17)
Clearly, the reactivity of Li3N with SOCl2 presents a potential hazard sinceLi3N can form on the lithium under the normal assembly conditions. However,no real danger would be anticipated for any operations with a sealed cellexcept for the unusual circumstance of disassembly of a discharged cell,containinF residual lithium, in normal humid air.
In summary, the following conclusions may be made regarding the hazard
potential of these materials:
1. Ni2H, LiH and Li28 do not appear likely to occur in any significantquantity in the cell and LiH and Li2S were not found to be reactive
in SOC 2 . Based on other reports however, the reactivity of Li28
remains uncertain.,5. Li3N might form on lithium during cell assembly and thus could be
- present in a cell.' This material was found to be highly reactive
with SOC12 but only under the peculiar conditions of exposure to
moist air in a finely divided state. Lithium nitride would not
be expected to present a hazard in a sealed Li/SO1 2 cell.
2.2 GAS GENERATION MECHANISMS OF PRESSURIZATION
2 2.1 Chemical Sources
2.2. 1 11 Gaseus Thermal Decomposition Products - Two reactions by whichSOC 2 mirht be thermally dedomposd have been reported in the literature: 16,3
4 SOC12 + S2c 2 + 2 802+3 Cl2 (18)
2 SOCI2 + S02 + 2 Cl2 + S (19)
The decomposition has bcn reported to begin at temperatures as low as 1500Cand to be virtually complete by 440 0C.10 We have examined the thermodynamicsof these proposed thermal decompostion reactions. The free energy changes
27

accompanying these reactions have been calculated from readily available
published thermodynamic data and by the use of the MANLABS-NPL Materials
Data Bank. The resulting free energies of reaction have been plotted in
Figure 7. Both calculations show that the decomposition reaction leading
to the production of S2C12 ia more favorable than that leading to the pro-
duction of S. However, eeen that leading to S2Cl2 production does not
proceed spontaneously at temperatures below about 580 0C (according to the
data obtained from the available published literature) or about 690 C
(according to the data obtained from the MANLABS Data Bank). Further, even
above these temperatures, the decomposition reaction is endothermic.
It may be concluded that thermal decomposition of SOC 2 to produce
gaseous products does not present a hazard potential at any temperature of
operation or storage for a Li/SO1 2 cell.
2.2.1.2 Gaseous Chemical Reaction Products - The reaction of SOC 2 with
sulfur has been reported in a number of sources, '2 and since sulfur is a
discharge product and soluble up to L.lM in thionyl chloride this possi-
bility was examined:
2 SOU 2 + 3 S 2 S2C12 + s02 (20)
The reaction is reported to be catalyzed by A1Cl32 1 and by FeCd 3. 24 In
References 20 and 22 the experiments were carried out in glass tubes without
a catalyst. At 1000C, the S was found to dissolve in the SOC 2 to form aclear solution, but upon cooling it separated in the form of crystals. At
temperatures between 1500 and 180 0C, the SOC12 and S reacted to produceS02 and S2C12 . In Reference 24, it was reported that when pure SOCd 2 was
refluxea with sulfuL for 45 min, no sulfur chlorides were formed. However,
upon adding 200 ppm Fe (as FeCl 3 - 6 H20) and refluxing further, S2 C 2 wasformed (about 8% after refluxing for about 4 hr.)
As in the case of the thermal decomposition of SOC1 2, thermodynamic
calculations were performed in two ways. In the first case, the readilyavailable published thermodynamic data were used, while in the second case
the MANLABS-NPL Materials Data Bank was employed. The resulting free
energies of reaction have been plotted in Figure 8. The results of the
first calculation show that the S-SOCd2 reaction will proceed spontaneouslyat temperatures above about 120 0C, while the MANLABS data indicate that the
reaction will proceed spontaneously above 2900C. The experimental results
reported suggest that the free energy changes calculated using the published
28

t I
S III5 !
9-- - II, ~ i/I I
- r~I~1* I ii
U III = UI; I a
0 0
L *'4Sii I
V III I ~,Ij/7 N
ii ii'I
II /1 131 1 h
j~*~j~~Tp I 0
I IS S 9 #4 S *~I ~ Ap.
[Nou.ovuvIAwqj Os,
I.~1 29
4

*out
A~ A
300

Thermodynamic data are more accurate than those obtained by the use of the
ZMANLABS Data Bank. However, both calculation have indicated that the reac-tion proceeds endothermically once the mixture is heated beyond the required
temperature. 0 18.6 Kcal by the first calculation and AH°298 = 22.6teprtr. A29829
Xcal by the second calculation. On heating mixtures of sulfur and SOC12to a temperature where reaction may proceed, AH° would change somewhat, but
still likely remain positive. Thus, heat energy should be required to
sustain the reaction.
The following qualitative conclusions may be made:
1) The reaction shown in Eq.(20) has been observed to occur in thevicinity of 150 C, generating gaseous products.
2) The reaction may be catalyned at lower temperature by materials
occurring in the cell such as AlCl 3 and FeC13 (the concentration
of Fe is normally very low - a few ppm).
3) The conditions necessary to initiate the reaction between S and
SOC1 2 are approached only at the end of discharge (high concentra-tion of sulfur from the discharge zeaction, consumption of theSOCd 2 raising the level of the solute, AlCl4-, and any catalytic
impurities such as Fe, and an increasing temperature), but eventhen the temperature is unlikely to be sufficient to initate and
sustain the reaction. Conseguently, this mechanism of gas genera-tion is not considered to present a serious potential hazard for
any normal operating conditions.
2.2.2 Electrochemical Sources: Gaseous Discharge Products
2.2.2.1 Analytical Procedure - At ambient temperature and above, the pre-dominant reaction that occurs on discharge in a Li/SOC 2 cell appears to
be (the discharge mechanism will be diacussed in Section V):
4Li + 2 SO 2 4 LiCl + S + SO2 (21)
Thus a gaseous product is clearly formed on normal discharge of the cell.The rate is 0.933 moles of SO2 /100 Ah (0.6 g SO2 /Ahr). In order to determine
the relative potential hazard assoc!ated with this reaction, the solubilityof SO2 in thionyl chloride was determined, and the SO2 dissolved and expelled
by cells on discharge was monitored during the operation of 2000 Ah prismaticcells.
31

The solubility of sulfur dioxide gas in thionyl chloride was determinedaccording to the following procedure.
An Erlenmeyer flask was fitted with a sidearm bubbler through which SO2could be passed from a lecture bottle into SOC 2 contained within the flask.
The flask itself was contained within an oil or cold water bath by which
the SOC12 was maintained at a preselected temperature between 00 and 60 C.A glass wool-packed water-jacketed condenser was employed to prevent the
significant loss of SOM 2 during its saturation with SO2. Initially, the
flask was fitted with ground glass stoppers and weighed. Twice distilledSOC12 was then transferred (under argon) into the flask, the flask was re-
stoppered, and the volume of SOC12 was calculated from its density and
the gain in weight of the flask upon the addition of the SOC12. The con-
denser was then connected to the flask, and the SOC12 was saturated with
s52 as described above. The condenser was then removed, and the stoppered
flask containing the S02-saturated SOC 2 was weighed. Another condenserwas then connected to the flask, and dry argon was slowly bubbled into the
SOC1 2 as it was heated to reflux the liquid, thus driving off the previously
dissolved SO2. Finally, the condenser was removed, the flask was againstoppered, and the amount of SO2 previously contained in the saturated solu-
tion was determined gravimetrically.
so2 generation in cells on discharge was determined by monitoring thedischarge of 2000 Ah prismatic cells at room temperature. The cells were
2discharged on constant load equivalent to 1.8 mA/cm . Samples of electro-lyte were withdrawn periodically and the SO2 concentration was analysed by
quantitative infra-red spectroscopy. The cells were also connected to
chemical scrubbers containing 4M K2CO3 solution, to absorb any SO2 expelledat atmospheric pressure during the discharge. This was carried out by pass-ing dry nitrogen through the cell vent, as shown in Figure 9, and period-
ically analysing the scrubbers for chloride and sulfite. The SOC 2 emittedis equal to half the chloride content, and the quantity of SO2 collected
is equal to the total sulfite less half the chloride content.
2.2.2.2 Results and Discussion - Assuming regularity, the solubility of
the S02 (expressed as mole fraction, x) is related to the heat of solution(AH*oI) and the temperature (T, oK) by an equation of the form:
Ln x - -(AHSol/R)(l/T - =) (22)
32

(R is the ideal gas constant and is a proportionality factor.) Thus, overa sufficiently narrow temperature range, a plot of lnx vs. l/T should beapproximately linear. This was found to be the case for S02 in 1.SMLiAlCl 4 /SOC1 2 . A best fit (least squares) line is shown in Figure 10 cor-responding to the following equation:
(2.417 + 0.184) x 103nT - (0.863 1 0.613) (23)AT
For convenience, the same line has been replotted in Figure 11 expressed as
the molar solubility of 502 vs. T (°C). (The dotted lines are data forpure SOC1 2. ) From this curve it can be seen that the solubility of S02 inl.8M LiAlCl4/SOCl 2 at room temperature is about 3 moles/liter (approximately
0.2 g/cm 3 ). Lithium thionyl chloride cells are normally designed to containabout 2 cm3 of electrolyte/Ah. According to Eq. (21), about 1.36 cm3 ofSOC12/Ah would be consumed and about 0.6g of S02/Ah (l.37g/cm3 at 25'C)would be generated on discharge. This would leave about 0.64 cm3 of elec-trolyte/Ah and 0.436 cm3 of 802/Ah. The final concentration would be0.6g S02/1.076 cm3 or 8.7 moles/liter. Clearly, if Eq. (21) represents theonly reaction occurring above room temperature, the SO2 solubility in theelectrolyte would be exceeded some time after the midpoint of the discharge.The problem would be aggravated toward the end of discharge by the increasein temperature (discussed in Section 2.1.2.2.), reducing the 802 solubilityto perhaps less than 2 moles/liter.
NITROGEN FORCES ANY EMITTED
S02 INTO SCRUIERS
N 2 p
i AROLUIONI
f MAGNETIC STIRRERS
Figure 9. Apparatus for Collecting SO2 Expelled from Discharging Cells
33

4.0
i 3.0 - •%
; %% % "'>-%•
2 S_
%
+-0. a
1.01IF%
3 .0 3.1 3.2 3.3 3.4 3.5 3.6 3.7
% %
tliT ['KJ [x 1o J
Figure 10. 502 Solubility in Standard Electrolyte vs. l/T
t ti The results obtained for the discharge of the 2000 Ah cells are shown
~in Figure 12 for aii anode-limited cell and in Figure 13 for a cathode-limited~cell. These cells contained about 5000 cm3 of electrolyte, or 2.5 cm3 /Ah,
!which is a little more than usual. After about 1100 Ah of discharge,660g (482 cm3 ) of 502 should have been generated and 1500 cm3 of electrolyte
should have been consumed, net volume 4008 ml. This represents about 0.165g~~~of S/c3(2.5714). For the anode-limited cell, the end of discharge
!started at this point and noS2 wa eetdinte scrubber afte aout
1350 Ah total capacity. The analysis of the electrolyte for 502 showed,, ~a great deal of scatter, but the final concentration of SO2 was near ++S3.5 moles/liter (theoretical, 3.37 moles/liter). The cathode-limited cellL
30 3 3 34

10'II
T -
1 a
I 7 %
53
I 2\
0I III ...I
i ~TEMPERATURE [C
;. j Figure 11. 502 Solubility in Standard Electrolyte vs. T
1 35

0
3 - 0 12,..
010 9
2' - 0
-6 >
100
-~CAPACITY (Ahrsl
Figure 12. Anode Limited So2 Test Cell
42
3 EMTE 120
1. *FNCELL
w9
00300 120 18000
Fie 13WCthd 0"Limie OetCl
363

delivered more capacity. The end of discharge started around 1200 Ah andcontinued to about 1500 Ahr. SO2 was detected in the scrubber sometimeafter the 1200 Ah point, (2.88 moles S02/liter) as would be expected fromthe SO2 solubility data. The anaylsis of the electrolyte for S02 did notshow a good correlation with the theoretical SO2 production. This couldindicate that some other product such as Li2SO3 or SO was produced inaddition to SO2, but it would not explain why S02 was expelled after 1200 Ahat an apparent (measured) concentration of about 1 mole/liter (calculated,2.88M);even at the higher temperature at this point (approximately 400C)the solubility would still be about 2 moles/liter. Sulfur dioxide wasmeasured using the infrared absorption band at 1333 m-1, and a 0.1 mm cavityNaCl cell on a Perkin Elmer #621 spectrophotometer. Calibration curvesshowed good agreement with Beer's law throughout the measured range to0.10M. Standard curves were taken for every sample run, to correct for anyvariations in cell thickness. We thus have no explanation as to why SObegan to escape at 1200 Ahr to 1300 Ahr.
These results indicate that some SO2 pressure can be expected at theend of discharge. In a sealed cell the SO2 solubility will be higher thanat atmospheric pressure, and the discharge is usually terminated at about3V, reducing the magnitude of any temperature effects. This would only beof significance in cella of prismatic configuration, and significant pres-surization has never been observed. There is the potential hazard ofprismatic cell case deformation for high rate disch-arge below the 3V cut-off in cathode liml.ted cells.
37

3. SUMMARY, CONCLUSIONS AND RECOMMENDATIONS
The analyses of the thermal mechanisms of cell pressurization indicate
the following hazard potentials:
1) Any thermal sources that raises the cell temperature to about 80°C
(the normal environmental limit) will produce an interrnal pressure
of about 15 lb/in2 g. This would not have any effect in a cylin-drical cell design but could cause deformation of a prismaticcell case if a vent were not provided.
2) Any thermal source that raises the temperature of the cell, even
locally, to the melting point of Li (180°C), may initiate an
exothermic reaction between lithium and other cell reactants or
products. A particular kind of internal short circuit involvingarcing to lithium in a very large cell could be an adequate thermalsource to initiate an explosion. A low resistance short circuit
is probably not an adequate thermal source to initate an explosion,(except in special configurations like spiral wound electrodestructures) but would cause deformation of a prismatic cell case.
Theme potential hazards can be greatly minimized by proper cell
*design.
3) Of the reactive materials that might occur in the cell, LiH,Li28 and Li3N, only LI3N is likely to occur in any appreciable
amount. Li3N is potentially a hazard since it may form on lithium
that is not stored properly, and it was found to be highly reactivewith SOC12 at room temperature. However, reaction of Li3N with
SOCl2 only occurred after the peculiar circumstances of exposureto moist air in a finely divided state, and this is not expected
to be a realistic hazard in a sealed Li/SOCl2 cell.
The analyses of the gas generation mechanisms of pressurization indi-
cate the following hazard potentials:
1) Of the various gas generation mechanisms of pressurization,only the electrochemical generation of 82 on discharge pre-
sents a hazard potential. This problem is minimal for alow rate discharge that is terminated at 3V, or for anode
limited cells.
39

2) Heating of the cell by any means near the end of discharge (such
as discharging a cathode limited cell below 3V) reduces the solu-
bility of SO2 and presents some potential hazard of cell case
deformation for the prismatic configuration if no vent is provided.
It is recommended that the reaction of Li3N with SOCI 2 be investigatedfurther to establish the nature of the reactants and the mechanism of the
reaction. Although neither the reactivity of Li2S nor its occurrence in
the cell was established, it would also be advisable to further investigate
this material.
44
14

II. PRELIMINARY SURVEY OF ALTERNATIVE ANODE MATERIALSv iCOMPATIBLE WITH OXYCHLORIDE CATHOLYTES
1. INTRODUCTION
1.1 OBJECTIVES
Lithium metal has proved to be an excellent anode material in almostevery respect, and its advantages are generally well known. Its rostserious deficiency is its relatively low melting temperature of 180 C;the potential hazards related to this property have been discussed inSection I. In addition, lithium can exhibit severe passivation in 1.8MLiAlCl4/SOC1 2 after storage at elevated temperature, if various preventativemeasures are not taken.
It is not very likely that a material which is superior to lithiumin all respects will be found. However, if a metal or alloy with a highermelting temperature and perhaps better passivation characteristics can befound, some sacrifice of electrochemical performance may be acceptable
The objective of this study then was to examine various candidatematerials and ascertain their potential suitability as alternative anodematerials.
1.2 TECHNICAL APPROACN
Both metal alloys and elements were considered as candidate alternate
anode materials. The elements were selected from eleven possibilitiesaccording to the following characteristics: melting point, E° vs. Cl2,specific gravimetric capacity, and specific volumetric capacity. Thecandidate metals are shown rarkd by decreasing value for each charac-teristic in Table II. On this basis, Ca, Mg and Al were chosen for study.Beryllium was not considered, in spite of some very favorable charac-.eristics, because of its known tendency to passivate in nonaqueoussolvent, its scarcity, and the high toxicity of beryllium oxides. Zinc wasalso examined, but only superficially, in conjunction with the alloys.
The investigation of alloys as alternative anode materials was limitedto four aluminum alloys developed for the NUSCAL battery, based on theirready availability. These had the following compositions:
(1) Al, Zn (1.4%), Hg (0.019%)
(2) Al, Zn (3.52%), In (0.03%)
(3) Al, Zn (4.19%), Mg (0.46%), In -0.04%)
(4) Al, Mg (0,79%), Sn (0.13%), Ga (0.05%)
41

TABLE II
CHARACTERISTICS OF POSSIBLE ANODE METALS(RANKED BY DECREASING VALUE),
MELTING POINT E0 VS. Cl 2 (THEOR.) GRAVIMETRIC VOLUMETRICRANK CAPACITY CAPACITY
Metal (°C) Metal (Volts) Metal (Ah/g) Metal (Ah/cm3)
1 Be 1278.0 K 4.24 Be 5.948 Be 10.992
2 Ca 839.0 Na 4.00 Li 3.863 Al 8.043
3 4i 660.4 Li 3.95 Al 2.980 Ga 6.809
4 Mg 648.8 Ca 3.92 Mg 2.205 Zn 5.849
5 Zn 419.6 Mg 3.07 Ca 1.337 Cd 4.125
6 Pb 327.5 Be 2.31 Na 1.166 Mg 3.832
7 Cd 320.9 Al 2.18 Ga 1.153 Pb 2.936
8 Li 18.5 Zn 1.91 Zn 0.820 Li 2.062
9 Na 97.8 Cd 1.78 K 0.685 Ca 2.060
10 K 63.7 Pb 1.63 'd 0.477 Na 1.132
11 Ga 29.8 Ga 1.59 Pb 0.259 K 0.591
The suitability of these materials as alternatives to lithium vs.
SOC1 2 was established by determining their stability in thionyl chloride
(and sulfuryl chloride in some cases), their open circuit potentials vs.
C/SoC12 , and if possible, their discharge characteristics vs. C/SOd12.
The last task included investigation of suitable electrolytes.
42

2. TECHNICAL PRESENTATION
2.1 ALTERNATIVE ANODES: ELEMENTS
2.1.1 Experimental Procedure
In order to determine the stability of the selected metals in thesolvents, samples of Ca, Mg and Al (and Li, as a control) were exposedto both SOC1 2 and S02 C12 at 72 C for extended periods of time. The metal/solvent combinations were sealed in glass ampules, for visual observation,according to the following procedure: in a dry 4rgon atmosphere the metalswere first cleaned with emery paper to remove oxides and then inserted intothe ampules containing the solvents; the ampules were then stoppered tokeep out moisture, removed from the dry box, frozen in liquid nitrogen Andfused at the neck of the ampule. Samples thus prepared were stored in an
oven at 720C and observed periodically.
The sample of zinc was exposed to 1.8M LiAlCl 4/5OC12 at room tempera-ture for a relatively short period of time to measure the open circuitpotential.
Open circuit potentials of Al and Zn were measured by constructingccmplete cell* consisting of the metal and a carbon cathode in 1.8MLiAlCl4/SOCl2 enclosed in a glass tube. Ca and Mg were investigated byassembling complete "AA" configuration cells in stainless steel cans.These consisted of a carbon cathode and the metal foil separated by glassfiber paper. The assembled cells were enclosed in glass tubes (ratherthan welding a metal feedthrough/cover assembly). Various solutes wereinvestigati. as electrolytes for these cells, e.g., LiAlCl 4, NaAlCl4,Ca(AlCl 4 )2 and Ca(SbCl6)2 "
The polarization characteristics of cells were determined by connectingone of the electrodes to the "working electrode" terminal and the otherelectrode to both the "counter" and "reference electrode" terminals of apotentiostat (PAR 173). The cell was then polarized following a linearsweep signal (PAR 175 Universal Programmer) from open circuit to 0.OV ata rate of 50 mV/s to 100 mV/s. The resulting E vs. I curve was plotted onan X-Y recorder (Hewlett-Packard 7001A).
Discharges at constant load were carried out by applying a load re-sistor across the cell and monitoring the voltage on a strip chart recorder(Varian 5A).
4
! ; 43
2.1.2 Results and Discussion
After about three months of storage in SOC 2 and S02 C12 at 720C, both
lithium and calcium had turned slightly dull but magnesium showed no
obvious signs of reaction; there was no evidence of solvent decompositionfor any of these combinations. The aluminum retained its original surface
luster in both solvents but ultim.ately gelatinous precipitates formed in-
dicating corrosion of the Al. These precipitates had the same appearanceas aluminum chloride-sulfur dioxide or aluminum chloride-thionyl chloride
adducts, which were synthesized in separate erperiments. Thus the corrosion
process might follow one or more of the following reactions:
8Al + 13SOC12 1 6ALC13 . SO2 + A12C16 • SOC 2 + 6S (24)
2A1 + 3S02C12 2ALC1 3 . SO2 + SO2 (25)
SAl + 12S02C12 3A12C16 . SOM 2 + 9S02 + Al203 (26)
These adducts show remark.able high temperature stability. The AlCl3 • SO2
adduct is a colorless viscous liquid or gelatinous precipitate at ambient
temperature without excessive vapor pressure. The Al2C16 . SOC 2 adductis a yellow oil that can be distilled at 215 0C at one atmosphere pressurewithout decomposition. The high temperature stability of metallic aluminumin the presence of these adducts was not determined.
The initial open circuit potentials of the metals measured vs. C/SOC 2
(l.8M LiAlCl4 ) at room temperature are as follows:
Li 3.65VCa 2.85VMg 1.95VZn 1.35VAl 1.04V
Because of their favorable open circuit potentials, Ca and Mg were
investigated further. This entailed the development of solutes other thanLiAlCl4 , such as NaAlCl4 , Mg(AC'4)2 , Ca(SbCl 6) 2 , and Ca(AlCl4 )2 . Theconductivities of these solutions are similar to those based on LiAlCl 4:i.e.r in the range of 0-O to l02 -cm.
Solutions were prepared in the same manner as for LiAlCl4: i.e., a
Lewis acid such as AlCl3 or SbCl5 was dissolvFd in thionyl chloride or
sulfuryl chloride and the desired salt (anhydrous LiC1, NaCl, CaC1 2 or
MgCl2) was then added to form the complex. LiAlCl4 was easily soluble
44

up to 2.0 m/1 in both thionyl and sulfuryl chloride (the solubility ofLiAlCl 4 exceeds 4 m/1 in thionyl chloride). NaAlCl4 was similarly soluble
with ease up to 2.0M in SOC1 2 and approximately 1.0M in S0 2 C12 . Ca(SbCl 6 )2
was readily soluble in both thionyl and sulfuryl chlorides up to about
2 m/l. Ca(AlCl4 )2, however, went into solution very slowly (only aftercontinuous stirring for three days), and dissolved up to 1 m/1 in thionylchloride. The Mg salts were found to be relatively insoluble. Possibly
the MgCl 2 was not dried sufficiently since Peled and Straze have recentlyreported6 that Mg(AlCl4)2 in soluble up 0.5 m/1 in thionyl chloride.
An "AA" size Mg/SOCl2 cell, as described previously, was tested usingstandard electrolyte, 1.8M LiAlCl 4/SOCl2. Using a linear potential sweepin the range of 100 mV/s, the cell was polarized from its open circuit
(1.95V) down to 0V. The cell gave about 1 mA/cm2 at l.5V, about 5 mA/cm2
at L.OV, and a short circuit current density of about 15 mA/cm 2 (200 mA).
Calcium was tested in various electrolytes. The results are summarizedin Table III showing polarization from open circuit vs. current density,
and in Table IV showing actual cell voltage vs. current density; some re-sults for lithium are include! for comparison. Cells using Ca(SbCl6)2 "SOC 2 electrolytes gave the lowest performance. The best results wereobtained in 1.8M LiAlCl4 - 8OC1 2: the open circuit voltage was about 2.85V;at a polarization of approximately 1000 mV from opon circuit the currentdensity, for the better of the two cells tested, was 14.5 mA/cm2 . A
lithium cell at equivalent polarization, shows more than twice this rate.Ca anodes in NaAlCl4 - SOC 2 showed similar performance. Ca anodes in
sulfuryl chloride and NaAlC1 4 exhibited higher open circuit potentials(approximately 3.V), but did not perform as well as in thionyl chloride.Cells with Ca(AlCl,)2 - SOC12 electrolyte were not made during the courseof this program because of the initial difficulty in dissolving the solute,
as discussed above.
One of the cells with Ca(SbCl6 )2 - SOC12 electrolyte (05) was dis-
charged for several hours and maintained about 2V at about 2 mA/cm2 . Bothof the cells with LiAlCl 4 - SOC12 were discharged on constant load also.Cell #6 ran at about 1.5 mA/cm2 for about 50 hrs at 2V. Cell 7, in whichthe electrode spacing was closer, ran at 0.75 mA/cm2 and about 2.7V for35 hrs. Cells #8 and #9, with NaAlCl4 - SOCl 2 gave similar performance but
less capacity. The cell with the dilute electrolyte was discharged acrossa 2565a load at approximately 1 mA (0.075 mA/cm 2). It exhibited a very
flat voltage plateau at 2.65V and then rapidly dropped toward a secondplateau at 1V after approximately 230 hrs. The cell with the more con-centrated electrolyte was discharged across a 2620 load at approximately
45

E-44
4 0 a) %a
E-4
o~ %0 C4 in ) ) 0 ) r
.0^0 %0 U) 1O.4 e4 W) fn 0% M min P4 '4 M~ fq c in -v (1
E-40
H0 0 N) N W U) M 0 in N toN 0 134 IV m4.in in P4 4 N-
co r! 0i N 0 1N 0 )0m~ In U) w) 0 %D I* N 0 0
OF M N .4 .4
C 0 0.4aN 0F4
A4 n tn in in -v Lm o q% ko~~E' U) U) U) in ) U U I. in4
H 0M N m~ N N N N4 N N f% 4
11 C
H 14 4 H . -4 14 4
E4- N 1.
.4 to 4 m 4 U .4 .4 .4 .4 A 4 .4 M
~.3 C 0 i A z z
14 0 N4 N
.4.4
r4 N M Nw
~4

N. v P4 - 0 - 0f" 04 0 4 mf in N0 0
19o r 14
in I co 0 , N * Hal I N I I P4
&.M ~l l l inw % %04 wl 40 0 as 0% HIn
. . . .. + ! .. . .8~~~ ~1 0 - = 0
~i i.
rr4(
aH a a 0 a cc c
, a P4 N P- H 4 m
N N NA
4. . P4 w4 r4 I - a
N A N 0 NC 1 HN= I N
%0 ' o ' o ,
u ~ ~ u v vae0
P4M IN n -W -a%
147

II10 mA (0.72 mA/cm2) and exhibited a flat plateau at 2.65V, but dropped
below 2V after 23 hrs. The discharge voltage continued to drop slowly
below 0.5V after 88 hrs when the experiment was terminated. Both of thesecells delivered only about 0.23 Ahr above a 2V cut-off. Disassembly of
the discharged cells revealed a normally wet and active cathode structurewithout evidence of hardening or accumulation of discharge products. The
discharge products appeared to have precipitated out on the surface of thecalcium anode facing the cathode. This apparent passivation of the calcium
anode was not observed with cells using Ca(SbCl6 )2 electrolyte but the
cells were not specifically examined in this regard (cells using Ca(AlCl4)2,
unfortunately, were not investigated). Driscoll and Holleck 25 have reportedsimilar results for the discharge of calcium, also in LiAlCl4 -SOC12; i.e.,
the formation of a white crystalline precipitate on the surface of the
calcium and discharge capacities of about 50% of theoretical. In cells
with sodium or lithium tetrachloraluminate, it would be expected that thealkali metal ions, because of their higher mobility, would deposit as LiCor NaCl at the cathode and be replaced in the electrolyte by calcium ions:
2Ca + 4Na+ + 2SOC12 S + SO2 + 4NaCl + Ca2+ (27)
For the two cells with NaAlCl 4, the point of depletion of the Na+ ions
would correspond to 0.107 Ah for the 1 M NaAlCl4 , and to 0.0107 Ah for the0.lM NaAlCl4. Since both cells delivered about 0.230 Ah before passivation,there is no obvious correlation with the sodium ion concentration; rather
it would appear to be related to the thickness of the passiivating layer on
the calcium.
In separate experiments with reserve cell electrolytes, Ca was dis-charged in thionyl chloride containing only AlC1 3(2.3M). The calcium
showed an initial open circuit voltage of 3.5V vs. C/SOCd2 and sustained
a current density of about 19 mA/cm2 at 2.5V for about 10 min before anode
passivation; the calcium was mostly black with a small shiny spot in thecenter. A lithium anode in the same electrolyte (2.3M AlCl3 - SOC 2 ) ran
at about 70 mA/cm2 at 2.8V for 30 mini the discharge was terminated in
this case by clogging of the cathode. These results again suggest dif-ferences in the calcium/solution interface.
Peled6 has reported that the alkali and alkaline earth metals are
covered by a metal chloride layer at all times in thionyl chloride and
that electrochemical processes occur by migration of ions through this
solid electrolyte interphase. The transference number for the L+ cation
43
through LiC1 is 1.0. However, it is well known that the transferencenumber for Ca++ in CaCl2 (or Mg in MgCl2) is less than 1.0 and the trans-ference number for anions is greater than zero.26 Thus on discharge of aCa anode in SOC1 2 , part of the current would be carried through the solidelectrolyte interphase by the cations and part would bm carried by theanions. Such a mechanism would be anticipated to promote growth of thepassivation layer, 27 and may account for the increased polarization andultimate passivation of calcium anodes on dibcharge in thionyl chloride.
2.2 ALTERNATIVE ANODES: ALLOYS
2.2.1 Experimental Procedure
The NUSCAL-battery aluminum alloys were investigated by fabricating
small cells in demountable glass containers. The electrolyte was 1.8MLiAlCl 4 - SOCL 2. Storage and all measurements were at room temperature.Pure zinc (99.99%) and pure aluminum (99.99%) were examined in similar
cells. Zinc was examined because it is one of the alloyirg elementsa italso showed some favorable characteristics in Table II, and it was antici-
pated to be corrosion resistant since it is used as the line; in shipping
containers of SOI 2.
2.2.2 Results and Discussion
The open circuit potentials measured in 1.8M LiAlC14 - SOC12 are asfollows:
Al OCV vs. C/soC1 2 (V)
1) Al, Zn (1.47%), Hg (0.011) 1.10
2) Al, Zn (3.52%), In (0.03%) 1.11
3) Al, Zn (4.19%), Mg (0.46%), In (0.04%) 1.07
4) Al, Mg (0.79%), Sn (0.13%), Ga (0.05%) 1.04
5) Al, (99.99) 1.04
6) Zn, (99.99%) 1.35
Pure aluminum and all of the alloys exhibited substantial pitting afteronly two days of exposure to the electrolyte. The rate semed to slowdown after the initial rapid corrosion: however, all samples showed severe
corrosion after several months. Zinc did not show any obvious signs of
corrosion after three weeks of storage at room temperature (i.e., nodiscoloration of metal or solution and no precipitated material). Noattempt was made to discharge any of these cells.
49

3. SUMMARY, CONCLUSIONS AND RECOMMENDATIONS
Of the various metals and alloys tested, only calcium, magnesiumand zinc were sufficiently corrosion resistant to examine further. All
of these have higher melting temperatures than lithium, but only calcium
shows a high enough potential vs. C/SOC12 to be a potentially viablealternative to the lithium anode. The calcium anode may also be subjectto less activation inhibition ("voltage delay") than Li after storage atelevated temperature, 2 but it appears that, unlike lithium, calcium maypassivate on dischtirge due to differences in the anion transfer character-istics of the CaCi, solid electrolyte interphase on the calcium surface.
In summary, as an alternative anode material, calcium remains anintriguing possiblity. However, many aspects of the Ca/SOCl2 reactionmechanism remain unansweredi therefore, further investigation is recom-mended. It would be of particular interest to examine the solid electro-lyte interphase and the discharge character.tstics of calcium in Ca(AlCl4)2,Ca(FeCl 4)2 and other solutes in SOCd 2.
51
IIi!
I
III. PRELIMINARY SURVEY OF ALTERNATIVE CATHOLYTESFOR IMPROVED LITHIUM CELL PERFORMANCE
1. INTRODUCTION
1.1 OBJECTIVES
The lithium cell currently produced commercially by GTE Laboratoriesis based on thionyl chloride as the solvent/oxidant and LiAlCl4 as the
electrolyte solute. This has proved to be a very successful combination,
yielding a high energy density battery with excellent discharge charac-
teristics. The properties which could be the most productively improved
are the conductivity (2 x 10"2 -cm"I for Ir8M LiAlC14 - SOCI2), theboiling point (79 C for SOC12 ), the capacity for dissolving the discharge
reaction products (at 250C, sulfur = 1.63 m/1 of SOC1 2 anO 1.16 m/1 of
l.8M LiAlCl4 - SOC1 2 ; sulfur dioxide - 2.4 m/l of SOC1 2 and 3.0 m/l of
1.8M LiAlCl4 - SOC12 ; LiCl is insoluble in SOC1 2), and the extent ofvoltage delay after storage at elevated temperature.
The objective then was to investigate various a;ternatives to boththe solvent/9xidant and the solute to obtain an improved catholyte for the
lithium cell.
1.2 TECHNICAL APPROACH
The original investigations of the lithium cell were based on thesolvent POCl 3. One approach to finding alternative solvents has been to
simply explore related members of the phosphorous and sulfur oxyhalide
families. This approach has yielded the currently favored solvent SOCI2 .Other possibilities are listed in Table V. It can be seen that many of
the compounds containing fluorine have low boiling points; even he more
promising fluorine compounds may alsq decompose tq lower boiling com-
pounds (e.g., POFBr2 + POF3 and PSFBr2 * PSF3). POCl 3, SOCl 2 and SO2C42
have been investigated, and SOBr 2 is unstable. The remaining possibilities,
then, are S205C12, P203C14 and PSCl 3.
Another approach is to consider the fundamental solvent characteristics
of various solvents. The ability of a solvent to function as an electron
pair donor (EPD) toward a Lewis acid such as antimony pentachloride,SbCl1, has been represented by the negative heat of reaction of the EPD
solvent with SbCl 5 in a dilute solution of an inert cosolvent such as 1,2-dichloroethane and is quantitatively called the donor number (DN). Gutman
531

TABLE W
MELTING POINTS AND BOILING POINTSOF VARIOUS SOLVENTS
SOLVENT MELTING POINT (°C) BOILING POINT (°C)
SOF2 -110.5 -43.8
POF3 -68 -39.73ISOC2 -105 78.8
POCI 2 105.3
SOBr 2 -52 138POBr 3 56 189.5SOCiF -139.5 12.2
POFC12 -80.1 52.9
POFBr2 -117.2 110.1
SO2F2 -136 -55.4
SO2 C1 -54 69.1SO FC1 -125 72
So2FBr -86 41
S 205F2 -46 51
P20 3F4 -- 71
S205C12 -38 152.5
P203C14 -165 212
PSF 3 -148.8 -52.2
PSC13 -35 125
PSBr3 38 212
PSFBr 2 -75.2 125.3
and Mayer have tabulated donor numbors for various EPD solvents along with
their dielectric constants as represented in Table VI. 2 8 Those solventswith higher DN's and dielectric constants would be expected to dissolve a
larger number of electrolyte salts and yield electrolyte solutions withhigher conductivities. For example, POC1 3 is a much better EPD solvent
than SOC 2 , and it has been found that several more lithium salts are
soluble in POC 3 than in SOC 2.29
For every equivalent of charge passed in a cell, one mole of Li ions is
added to the electrolyte at the anode (Li - Li + + e-) and one mole is removed
at the cathode (Li+ + 1/2 SOC 2 + e 1/4 S + 1/4 SO2 + LiC1); thus some
54
I
TABLE VI
DONOR NUMBERS (DN) AND DIELECTRIC CONSTANTS (c) OF VARIOUS EPD-SOLVENTS
MELTIN " BOILIGSOLVENT DN £ POINT ( C) POINT( C)
1, 2-Dichloroethane - 10.1 -35.0 84.0
Sulphuryl chloride 0.1 10.0 -54.1 69.1
Benzene 0.1 2.3 5.5 80.1Thionyl chloride 0.4 9.2 -105.0 78.8
Acetyl chloride 0.7 15.8 -112.0 "51.0
Tetrachloroethylene carbonate 0.8 9.2
Benzoyl fluoride 2.0 22.7 n,155.0Benzoyl chloride 2.3 23.0 -1.0 197.2
Nitromethane 2.7 35.9 -29.0 101.0Dichloroethylene carbonate 3.2 31.6
Nitrobenzene 4.4 34.8 5.7 210.0
Acetic anhydride 10.5 20.7 -73.1 140.0
Phosphorus oxychlori4e 11.7 14.0 2.0 105.3Benzonitrile 11.9 25.2 -13.0 190.7
Selenium oxychloride 12.2 46.0 8.5 176.4
Acetonitrile 14.1 38.0 -45.0 81.6
Sulpholans 14.8 42.0 N22.0
Propanediol-1,2-carbonate 15.1 69.0 -48.8 240.0
Benzyl cyanide 15.1 18.4 -23.8 234.0
Ethylene sulphite 15.3 41.0 460.0(10 mm)iso-Butyronitrile 15.4 20.4 -71.5 103.9
Propionitrile 16.1 27.7 -92.9 97.35
Ethylenq carbonate 16.4 89.1 36.0Phenylphosphonic difluoride 16.4 27.9
Methylacetate 16.5 6.7 -98.1 57.0
n-Butyronitrile 16.6 20.3 -112.0 118.0
Acetone 17.0 20.7 -95.35 56.2
Ethyl acetate 17.1 6.0 -83.6 77.06
Water 18.0 81.0 0.0 100.0Phenylphosphonic dichloride 18.5 26.0 258.0
Diethyl ether 19.2 4.3 -116.2 34.6
Tetrahydrofuran 20.0 7.6 -65.0 ,64.0Diphenylphosphonic chloride 22.4 -
Trimethyl phosphate 23.0 20.6 197.2Tributyl phosphate 23.7 6.8 289.0
Dimethylf.'rmamide 26.6 36.1 -61.0 153.0
55

TABLE VI (Continued)
DONOR NUMBERS (DN) AND DIELECTRIC CONSTANTS (W) OF VARIOUS EPD-SOLVENTS
MELTING BOILINGSOLVENT DN e POINT (°C) POINT (°C)
N-methyl-c-caprolactam 27.1 -
N-methyl-2-pyrrolidone 27.3 - -17.0 197.0
N, N-Dimethylacetamide 27.8 38.9 -20.0 165.0
Dimethyl sulphoxide 29.8 45.0 18.45 189.0
N, N-Diethyformamide 30.9 - ,,177.0
N, N-Diethylacetamide 32.2 - "185.0
Pyridine 33.1 12.3 -42.0 115.5
Hexamethylphosphoricamide 38.8 30.0 7.0 x,100.0 (6 mm)
56
lithium salt must be dissolved or generated in the solvent to sustain theionic current through the electrolyte.
The Lewis Base EPD solvents, upon which inorganic lithium cells depend
for the cathode reaction, exhibit markedly different properties with dif-ferent salts. Devynck and Tremillon so applied a chloro-acid/chloro-base
theory to the oxychlorides POCI 3 and SeOCl 2 that is also applicable toother oxyhalide solvent systems and helps explain some of the chemistry.
Phosphorus oxychloride can be considered to be an ionic solvent with an
ionic product Ki = [P2C] [CI] = 10 - 19±0 _3 mol2 -2 at 250C. A scaleof chloroacidities in POC1 3 , determined by Devynck and Tremillonl0 is
shown in Figure 14. The solubility of basic electrolytes such as thealkali metal halides can be achieved through the addition of chloroacid
SO3, SbC1 5, BCl 3 or AlCl3 to yield a slightly acidic electrolytic solutioncapable of being reduced at a carbon cathode vs. an alkali metal anode.If these electrolyte solutions are made basic through the addition of a
/
chlorobase such as a tetralkyl amonium chloride, the anodes can no longer
be oxidized and the cells cease to function. We also suspect that theanode passivation is strongly dependent on the acidity of the electrolyte
salts.
0 0
C!)
4 "ClI M, ,
.C\Ps. 11 CMmekow
(1)4 !M Solution; tNCI.Et4o
Figure 14. Order of Chloroacids and Chlorobases in POI 3) 12 Sou n 0" Solutions.T TT

2. TECNICAL~ PREENTTIO
2.1 ALTERNATIVE SOLVENT/OXIDANTS
2.1.1 Experimental Procedure}I
Two solvents, pyrosulfuryl chloride and nitrobenzene, were selected
for preliminary investigation. Pyrosulfuryl chloride (S205C12 ) has a
boiling point of 152.5C and a melting point of -38°C. Nitrobenzene has
a boiling point of 210°C and a melting point of 5.70 C; thus, this material
would require a cosolvent to lower its freezing point to a more reasonable
value.
Pyrosulfuryl chloride was synthesized from carbon tetrachloride and
sulfur trioxide according to the following reaction:
CCl 4 (t) + 2 S03() 0 S205C12( ) + COCl2 (g) (28)
With both solvents attempts were made to dissolve LiAlCl4 to make
conductive solutions, and to build experimental cells.
2.1.2 Results and Discussion
Pyrosulfuryl chloride was refluxed over lithium with no apparent
corrosion or decomposition of te solvent. It was not possible to dis-
solve enough lithium chloride and aluminum chloride in S205C12 to yielda usefully conductive electrolyte solution in the solvent itself. Pyro-sulfuryl chloride is miscible with both thionyl chloride and sulfuryl
chloride, however, and might be used as an inorganic cosolvent with either
of these materials in an electrolyte solution. It cannot be used with the
aluminum chloride containing electrolytes, however. The addition of 25%
by volume S205C12 to a 1.8M solution of LiAlCl4 in thionyl chloride or a2.0M solution of LiAlCl4 in sulfuryl chloride results in the formatioD ofa gelatinous precipitate in the case of SOI 2, or a crystalline precipitate
in S02C12. These precipitates are probably not simply LiAlCl 4, but most
likely involve adducts of the solvents or their decomposition productswith aluminum chloride. An attempt was made to check the solubility of
elemental sulfur (10% by weight) in pyrosulfuryl chloride. No immediate
reaction was noted at room temperature, but bubbles of gas were evolvedat the mixture was heated and the solution changed from colorless to
yellow. Upon reaching the melting point of sulfur (1200C), the bubbling
59

stopped and the globule of rolten sulfur in the bottom of the solution
slowly dissolved. The reaction noted between sulfur and pyrosulfuryl
chloride is probably:
S205C12( ) + 2S(s) - S2C12(9M + So2 (g) + So3 (g) (29)
or
2S205 C12() + 5S(s) - 2S2C12(£) + 5SO 2 (g) (30)
This reaction between pyrosulfuryl chloride and elemental sulfur might be
used "in situ" in an inorganic electrolyte cell based on reductioni of
thionyl chloride or sulfuryl chloride to consume the elemental sulfur
formed during discharge and extend the life of the cathode.
Nitrobenzene was found to dissolve up to about 1.5 m/l of LiAlCl4.
A small lithium/carbon cell was built with this electrolyte using a glass
cell. The open circuit voltage was about 3.5V and the application of
various load resistors gave the following results:
CURRENT DESITY CELL VOLTAGE(mA/cm (V)
0.13 2.570.23 2.250.25 2.080.32 1.910.41 1.620.50 1.08OCV 3.32
Thus, it appears that the nitrobenzene was being reduced at the cathode.It should be pointed out that these are preliminary results and no attempt
to optimize this system was made.
2.2 ALTERNATIVE ELECTROLYTE SOLUTES
2.2.1 Experimental Procedure
Sulfur trioxide was investigated as a substitute Lewis acid for the
AlCl3 presently used to make the conductive lithium salt. Sulfur trioxide
is a very strong Lewis acid and can be used to solubilize lithium chloride
in phosphorus oxychloride. The reaction proceeds as follows to form
lithium chlorosulfonate:
LiCl + SO3 - LiSO3C1 (31)3
60

This material is soluble in phosphorus oxychloride and renders the solution
ionically conducting. Unfortunately, sulfur trioxide is also a strong
oxidant and will oxidize thionyl chloride. We have demonstrated, however,
that ilfuryl chloride and sulfur trioxide are completely miscible and do
not react. Initial attempts to form alkali metal or alkaline earth metal
chlorosulfonates in sulfuryl chloride solutions by reaction of the
respective chlorides and sulfur trioxide were not successful. An appro-
priate cosolvent may have to be used or other measures taken to insure
ionic conductivity in SO2C12/SO3 solutions. Simple compatibility studiesindicated that solutions of SO3 in SO2C12 are not reactive toward lithium
metal and this solution therefore might form the basis for a much morepowerful soluble depolarizer than sulfur dioxide or even thionyl chloride
itself.
An attempt was made to synthesize approximately 1M LiSO 3Cl in each
of four inorganic solvent systems (phosphorus oxychloride, POC13 thionyl
chloride, SOC12 sulfuryl chloride, SO2C12; and pyrosulfuryl chloride,
S20 5CI2) by reacting stoichiometric quantities of chlorosulfonic acid,
HSO3Cl, with lithium metal according to:
2 Li (m) + 2 HSO3Cl (sol'n) + 2 LiSO3Cl (sol'n) + H2 (g) (32)
The reaction did not go to completion in any of the Zour solvent systems
attempted, even when the mixtures were heated to kboiling and refluxed
under an inert atmosphere. Simple electro.hemical cells in glass tubes
were constructed utilizing a 1.25 cm x 4 cm Teflon-bonded carbon cathode
wrapped with glass mat filter paper and lithium ribbon to yield a 10 cm2
active electrode area. The polarization characteristics of these cells
were determined by subjecting them to controlled voltage sweeps from open
circuit to 0V in the same manner as described in Section 11-2.1.1.
2.2.2 Results and Discussion
Discharge of the cells described above, containing LiSO3Cl as the
electrolyte solute, gave the following results:
SOLVENT OPEN CIRCUIT VOLTAGE AC RESISTANCE SHORT CIRCUIT CURRENT
POC 3 3.84V to 3,81V 0.44K 83.0 mA
SOC12 2.16V to 3.22V 1.0 K 0.41 mh
so 2C12 1.54V to l.50V 1.0 K 0.17 mA$205C12 3.22V to 2.67V 1.0 K 0.102 mA
61

The only cell of the group that had a sufficiently conductive electrolyte
solution to show electrochemical performance was that utilizing POC 3 as23a solvent. This cell was capable of delivering 1.6 mA/cm at 3.OV when
fresh. Since we know the open circuit potential of the lithium-phosphorus
oxychloride cell reaction is below 3.OV, we see that we were discharging
another component of the solution, possibly the LiSO 3Cl or unreacted
HSO3Cl. This hypothesis was confirmed by discharging the cell across a
180 resistor. The discharge voltage was initially above 3.OV, but finally
stabilized at 2.2V after the active component was reduced and the normal
POCl 3 discharge reaction became predominant.
A small quantity of crystalline LiSO3Cl was synthesized from lithium
chloride and boiling chlcrosulfonic acid according to:
LiCI (s) + HSO 3Cl M LiSO 3Cl (sol'n) + HCL (g) (33)
The LiSO3Cl was precipitated from the cooled chlorosulfonic acid solutionwith dry thionyl chloride and washed several times with thionyl chlorideto yield a relatively pure product. This material was soluble in POCI 3
but not in SOC 2, S02C12 or S205C12, which correlates with the aboveresults.
j~62
}V
3. SUMMARY, CONCLUSIONS AND RECOMMENDATIONS
No suitable alternatives to the present catholyte, LiAlC14 - SOC12were developed in this investigation. LiSO 3Cl was soluble in POC 3 (whichis not an acceptable cathode reactant) but gave ambiguous results whentested in a lithium/C cell. Pyrosulfuryl chloride was stable to lithium
but did not dissolve enough LiAlCl4 or LiSO 3Cl to make a sufficiently
condaxctive electrolyte for testing. Nitrobenzene was more promising as
a solvent/oxidant; LiAlCl4 was soluble to about 1.5 m/l. A lithium/C
cell in this electrolyte exhibited an open circuit of 3.5V and nitro-
benzene appeared to be reduced at the cathode. This solvent, however,has an unacceptably high freezing point and thus could only be used with
a cosolvent. On this basis, nitrobenzene may merit further investigation.
6
63

IV. RESERVE MODE CONFIGURATIONS OF THE Li/SOCl 2 CELL
1. INTRODUCTION
1.1 OBJECTIVES
The objective of this study was to explore reserve electrolyte con-
figurations of the Li/SOCl2 cell to ascertain the potential advantages for
improved performance and/or- for prolonged storage.
1.2 TECHNICAL APPROACH
Two reserve mode configurations of the Li/SOC1 2 cell were investigated;
1) a low-rate (standard) semi-reserve electrolyte cell and, 2) a high-ratereserve electrolyte cell. In the semi-reserve concept the cell contains
thionyl chloride but the electrolyte salt (LiAlCl4) is held in reserve.There could be some advantages to this configuration: the thionyl chloride
alone is known to be sufficiently nonconductive to prevent high currents
on accidental short-circuiting, and there should be less direct reaction
between lithium and pure thionyl chloride, reducing self-discharge and
possibly reducing voltage delay.
In the high-rate configuration, only the AlCl3 (Lewis Acid) component
of the electrolyte is used, and the entire electrolyte solution is held
in reserve. The electrolyte must be held in reserve to prevent self-discharge of the lithium in the presence of aluminum chloride (AlCl3 con-
tinuously dissolves the LiCl film covering the lithium surface). However,
this reaction may be slow enough to allow a fast discharge after activation,
as would be suitable in some applications (e.g., torpedo propulsion).
Because the discharge product LiCl (which normally deposits in the cathode
pores) is soli.ole in this electrolyte, high rate discharge may be maintained
without the usual premature clogging of the cathode.
I A5
65

2. TECHNICAL PRESENTATION
2.1 SEMI-RESERVE ELECTROLYTE CELLS
The concept of chemical activation of a reserve cell containing thionyl
chloride stored in contact with lithium and carbon electrodes was demonstrated
in small glass cells. The cell consisted of two 1.25 cm x 4.0 cm lithium
electrodes on either side of a similarly sized Teflon-bonded carbon electrode
assembled in glass tubes filled with 1.8M LiAlCl4 in SOC12 or with SOC12alone. The cell containing the LiAlCl4 salt was capable of delivering an
initial short circuit current in excess of 2.2A when potentiostatically
swept from its open circuit voltage (3.63V) to OV at 100 mV/s. After aging
six days at 70 C, the short circuit current obtained under similar con-
ditions at ambient temperature was limited to 0.22A, the majority of the
passivation being observed on the lithium electrode. The simple addition
of 0.lg AlCl3 to the approximate 15 ml of electrolyte solution did notdepassivate the anode; the short circuit current observed after this treat-
ment was only about 0.25A. A similar cell, after storage at 700C in
thionyl chlordie alone, had sufficient lithium chloride and aluminum chloride
added to make 1.8M LiAlCl4 before discharge. This cell was potentiostaticallypolarized in a similar manner and exhibited a short circuit current of 1.4A.
These experiments demonstrate that the addition of a small amount of Lewisacid AlCl 3, is not sufficient to depassivate a lithium anode aged in an
electrolytic solution originally containing electrolyte salts, LiAlCl4;
however, anodes aged in solvent alone (SOC12) show much less passivationand the cell can be activated by the addition of the electrolyte salt beforeuse. A.N. Dey has also reported that Li stored in pure thionyl chloride
for 624 hrs at 78 0C shows (by SEM analysis) a much thinner small-grained
film."1
2.2 HIGH-RATE RESERVE ELECTROLYTE CELLS
2.2.1 Experimental Procedure
For testing of the high rate reserve concept, small cells were built
in glass containers. The lithium electrode had an area of 16 cm2 (0.05 xI4 x 4 cm) and a theoretical capacity of about 1.7 Ah. The cathode was
a carbon-Teflon structure on nickel expanded mesh substrate; it had anarea of 25 cm2 (0.095 x 5 x 5 cm) and a carbon loading of approximately
0.55 g/cm 3 . These two electrodes were separated by glass fiber paper and
placed horizontally at the bottom of a shallow glass cell. The electrodes
67
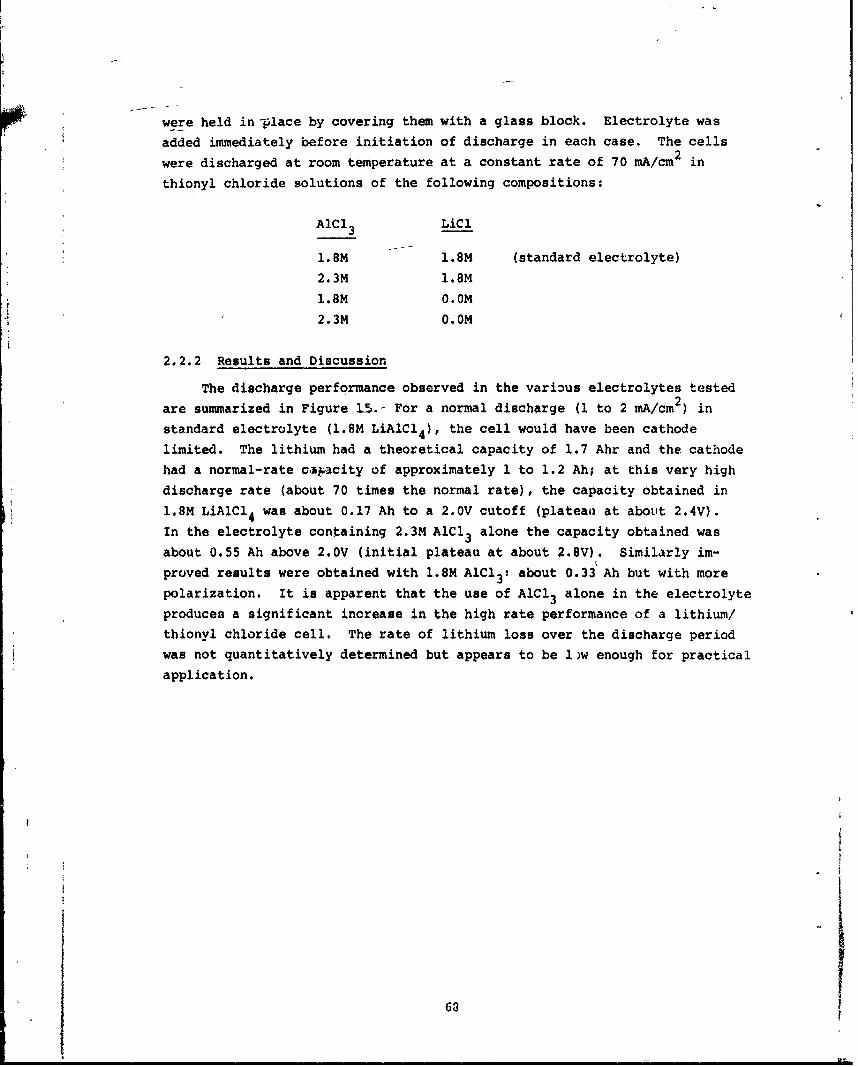
were held in -lace by covering them with a glass block. Electrolyte was
added immediately before initiation of discharge in each case. The cells2were discharged at room temperature at a constant rate of 70 mA/cm in
thionyl chloride solutions of the following compositions:
AlCl3 LiCl
1.8M 1.8M (standard electrolyte)
2.3M 1.8M
1.8M 0.0M2.3M 0.OM
2.2.2 Results and Discussion
The discharge performance observed in the various electrolytes tested
are summarized in Figure 15.- For a normal discharge (1 to 2 mA/cm ) in
standard electrolyte (1.8M LiAlCl4 ), the cell would have been cathode
limited. The lithium had a theoretical capacity of 1.7 Ahr and the cathode
had a normal-rate capacity of approximately 1 to 1.2 Ah; at this very high
discharge rate (about 70 times the normal rate), the capacity obtained in
1.8M LiAlCl4 was about 0.17 Ah to a 2.OV cutoff (platean at about 2.4V).
In the electrolyte containing 2.3M AlCl 3 alone the capacity obtained was
about 0.55 Ah above 2.0V (initial plateau at about 2.8V). Similarly im-
proved results were obtained with 1.8M AlC1 3: about 0.33 Ah but with more
polarization. It is apparent that the use of AlCl 3 alone in the electrolyte
produces a significant increase in the high rate performance of a lithium/
thionvl chloride cell. The rate of lithium loss over the discharge period
was not quantitatively determined but appears to be 1 )w enough for practical
application.
6
68
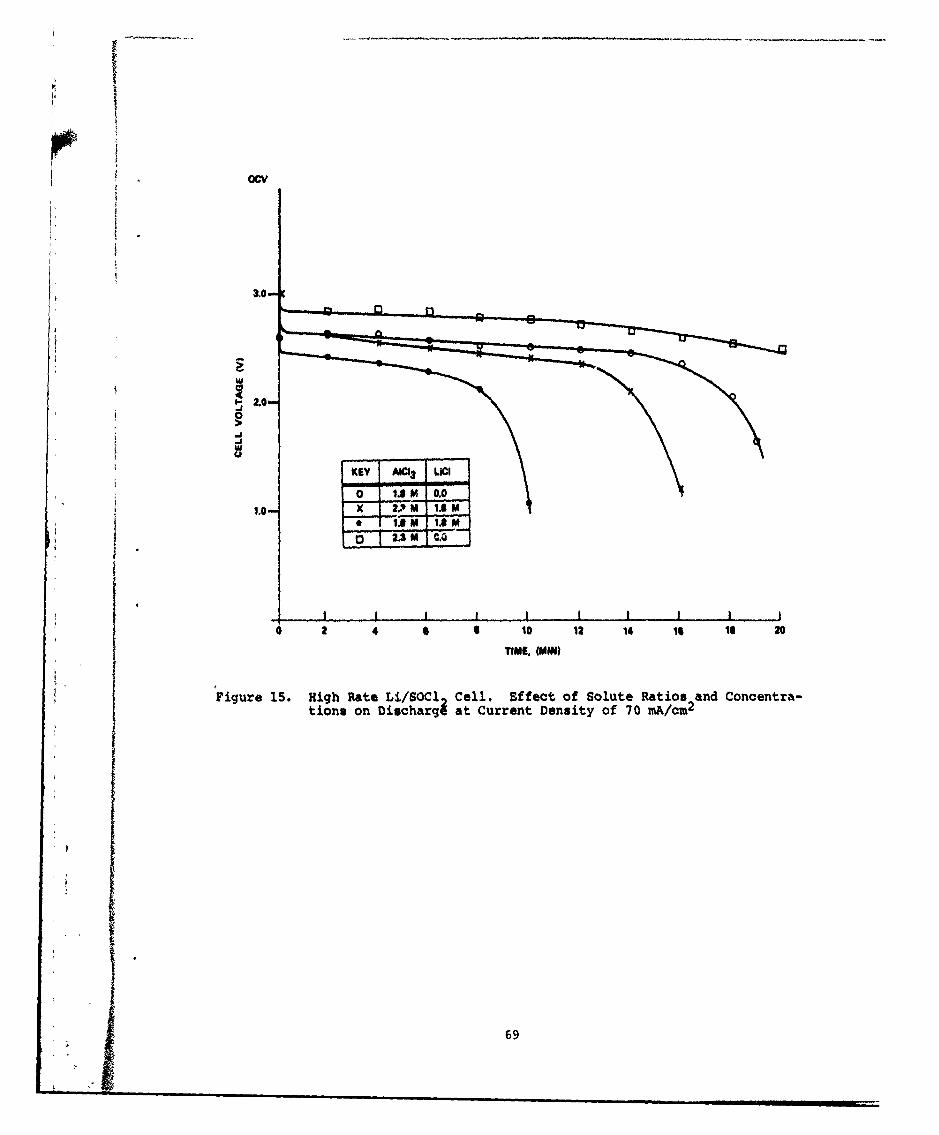
OCv
0
2,0
KEY AICI3 LICI
m V m
2A C.4
2 4 6 10 U 14 I s 2
TIME, (MIN)
Figure 15. High Rate Li/SOdl Cell. Ef fect of Solute Ratios and Concentra-tions on Dischargi at Current Density of 70 mA/cm 2
69

3. SUMMARY, CONCLUSIONS AND RECOMMENDATIONS
The low-rate semi-reserve cell in which the electrolyte solute
(LiAXCl4) is held in reserve, appears to be a viable concept in terms of
reduced self-discharge and voltage delay after storage at elevated tem-
perature. The engineering problems in reducing this concept to praticeand the cost in terms of energy density, complexity and reliability were
not evaluated but are anticipated to be substantial. Since there are nopresent applications that would utilize the prolonged storage capabilities
of this configuration, and because progress has been made in other simplerapproaches, no further inves-igation is recommended.
The second reserve electrolyte concept, in which all of the electrolyte
is hell in reserve and contains only the AlCl3 component of the solute, hasproved capable of delivering more than three times the capacity and energy
obtained with standard electrolyte at about 70 times the normal rate
(70 mA/cm2 for 30 min at 2.5V to 2.8V). Thus, this system may be suitable
for some high rate applications, such as undersea weapons propulsion, andit is recommended that the engineering aspects of such a reserve system be
evaluated.
71

V. DETERMINATION OF THE DISCHARGE MECHANISMS IN Li/SOCl2 CELLS
1. INTRODUCTION
1.1 OBJECTIVES
The determination of processes occurring during the discharge ofLi/SOCl2 cells is of both theoretical and practical interest. Understanding
of these processes can help in estimating the ultimate capability of thesystem and in determining design parameters.
The reactions occurring at the lithium electrode are reasonably wellestablished. Lithium metal reacts superficially with thionyl chloride toproduce a coating of lithium chloride; this film of LiCl is insoluble andprevents further direct attack. The LiCI acts as a solid electrolyte
interphase: it has a very low electronic or anionic conductivity, but acationic conductivity sufficient to allow discharge of the lithium.6 Atthe anode, lithium ions are furnished to the electrolyte and electrons are
furnished to the external circuit. Electrical conduction in the electrolyteinvolves no net transfer of the anion (tetrachloroaluminate) but the lithium
ion must transfer from the anode through the electrolyte and into the cathode.In the cathode, transfer of electrons from the external circuit to the
thionyl chloride must take place on the carbon surface with the entranceof the lithium ions, to preserve the balance of charge. The processes bywhich this occurs, however, have not been so clearly established. The
purpose of this work then has been to determine the nature of the electro-
chemical processes occurring in the cathode during cell operation.
1.2 TECHNICAL APPROACH
Since lithium ions are involved in the cathode process, the formation
of a lithium salt or salts is indicated. At the same time, the sulfur inSOC1 2 must be reduced (the oxygen and chlorine are already reduced to their
lowest oxidation states). Examples of known compounds with reduced sulfur,
which could be present include;
SC1 2, sulfur dichloride
$2CI 2 , sulfur monochloride
L12S, lithium sulfide
Li2S203, lithium thiosulfate
73 i u m
S, elemental sulfur
Li2S2 04 , lithium dithionite
Li2(2+n) 06 lithium polythionates
Compounds of sulfur with an oxidation state the same as or higher than that
in SOC1 2 could exist as products by exchange or disproportionation:
Li2 SO3, lithium sulfite
Li2S205 lithium pyrosulfite
SO2 , sulfur dioxide
Li2S206, lithium dithionate
Li2SO4, lithium sulfate
In addition to the compounds already mentioned to account for the chloride
and oxide present in SOC1 2, there is also:
LiC1, lithium chloride
There have been several attempts to define the reaction mechanism
based on known cell reactions, on qualitative analyses, and on some
quantitative work. Behl et al. 32 postulated that the sulfur was ultimately
reduced to lithium dithionite, based on the known reaction for the Li/SO 2soluble cathode cell. Auborn et al. 2' found Li2SO3 by x-ray analysis ofcrystals present on a cathode taken from a discharged cell; it was assumed
that the reduced form of sulfur was the element, since sulfur crystals were
also found throughout cells after discharge. Dey and Sqhlaikjer 12 dis-
charged C-size cells with neoprene closures and noted deformation of the
closures for cells which had been discharged, but not for cells storedwithout discharge. The pressurized vapor phase of the discharged cells
was found, by infrared spectroscopy, to contain SO2. Qualitative con-
firmation of the presence of sulfur, along with the essential absence of
sulfur oxyacid salts in the cathode, led to the hypothesis that the products
were LiCl, S, and S02* Confirmation of this reaction was attempted byCogley et al. 33 They performed quantitative analyses of discharged cathodes
for lithium chloride, and of complete discharged cells for sulfur and sulfur
dioxide. Wet chemical analyses for LiCl and S showed one mole of LiCd per
equivalent of charge, and one mole of sulfur per four equivalents of charge.Analyses of cell electrolytes by gas chromatography showed that SO2 waspresent and increased with cell discharge, but that one mole of S02 appeared [
74

for every two equivalents of charge. This is twice the amount expected
for the reaction:
4 Li + 2 SOCl2 S + SO2 + 4 LiCi (34)
The observed amounts of sulfur and LiCl however, correspond to the pre-
dicted values.
Several conflicting observations then, needed to be resolved at the
beginning of this work. If the production of LiCl had a one-to-one cor-
respondence with the amount of Li consumed, 3 3 production of Li2SO32 9 would
be impossible, although this material had apparently been positively
identified in the cathode. If no lithium compounds other than LiC1 could
form, then SO2 would be the only known compound in which the oxygen could
occur after discharge. Yet, twice the amount of SO2 predicted by Eq. (34)was actually observed. 3
Table VII shows the calculated open circuit potentials and the number
of equivalents per mole of SOC1 2 predicted by a number of possible discharge
reactions. For the first six reactions the products are assumed to besulfur, lithium chloride, and various compounds containing oxygen. For the
remaining reactions the products are assumed to be sulfur monochloride,
lithium chloride, and various oxygen compounds. The predicted open circuit
potentials are all similar and close to the observed potential (3.645V at
250C, see Figure 16). Thus these values alone are not sufficient to con-firm a reaction. The predicted numbers of equivalents per mole, however,
are substantially different in many cases; this information, which can be
determined without chemical analyses, can be combined with information
obtained from quantitative chemical analyses, and offers another means ofstudying the discharge process. For this reason we developed a method of
measuring the number of electrical equivalents passed per mole of SOC1 2reduced, based on controlled potential coulometry.
Procedures were also developed for detecting qualitatively, and then
measuring quantitatively, any lithium-oxyacid-sulfur salts which might have
been present in the cathodes of discharged cells. In the work by Cogley
et al.,33 the objective was to measure chloride in the cathode but not
sulfite or sulfate, etc. If lithium-sulfur-oxyacid salts are present inthe cathode, as Auborn claimed,2' the quantities might be too low to bedetected by difference, using this chloride analysis method. The presence
of non-stoichiometric amounts of Li2SO3, Li2SO4 , etc. in the cathode mightindicate that more than one discharge reaction occurs, and that predominance
of one or another could be affected by electrolyte concentration, temperature,
or other parameters.
75

TABLE VII
EQUIVILENTS PER MOLE OF SOC12 AND OPEN CIRCUITPOTENTIALS PREDICTED BY CELL REACTIONS
EQUIVALENT CALCULATEDPER MOLE POTENTIALSOC1 2 (V)
4 Li + 2 SOC1 2 -*4 LiCI + S + SO2 2.00 3.72
14 Li + 6 SOCI2 + 12 LiCI + 4 S + Li 2 S2 0 6 2.33 3.70
10 Li + 4 SOC1 2 8 LiCI + 2 S + Li2S204 2.50 3.57
10 Li + 4 SOCI2 8 LiCl + 3 S + Li2SO4 2.50 3.73
8 Li + 3 SOC1 2 6 LiC1 + S + Li2S203 2.67 3.56
8 Li + 3 SOC12 6 LiC1 + 2 S + Li 2SO 3 2.67 3.60
6 Li + 4 SOC1 2 4 6 LiC1 + S2C12 + 2 SO2 1.50 3.68
10 Li + 6 SOC1 2 - 8 LiC1 + 2 $2C1 2 + Li 2S20 6 1.67 3.64
7 Li + 4 SOC 2 5 LiCI + 3/2 S2C12 + Li2SO4 1.75 3.68
6 Li + 3 SOC1 2 - 4 LiCI + $2CI2 + Li2So 3 2.00 3.52
8 Li + 4 SOC1 2 + 6 LiC + S2C12 + Li2S204 2.00 3.50
7 Li + 3 SOC1 2 - 5 LiC1 + 1/2 S2C12 + Li2S 203 2.33 3.52
The measurement of sulfur dioxide in the electrolyte of dischargingor discharged cells was performed by Cogley et al., using gas chromatography.
In their technique, the injector was at 1500C and the column at 800C. A
reaction of sulfur with the solvent to form SC1 2 and SO2 is thermodynamically
favored at 1270C (i.e., below the injector temperature):
S + 2 SOC1 2 - SO2 + 2 SC 2 AF4 0 00K - -12 Kcal mole " . (35)
The investigators reported that over 90% of the sulfur, theoretically
predicted from the SOC1 2 discharge, had been found previously in the
electrolyte.
Thus, reaction of sulfur with SOCI 2 at the injector could account
quantitatively for the observed two fold excess of So2 over that predicted
by Eq. (34). For our experiments, sulfur dioxide was measured by quantita-
tive infrared spectroscopy at room tempe:ature to avoid chemical or thermaldecomposition of any of the material pxesent in the electrolyte.
The vapor pressure as a function of temperature was measured formixtures containing thionyl chloride with lithium tetrachloroaluminate,
sulfur, sulfur dioxide, and carbon, when it was found that the amount of
76

sulfur dioxide generated by cell discharge was less than that predicted by
Eq. (34). Carbon was suspected of absorbing the sulfur dioxide from the
electrolyte until the discharge products displaced the sulfur dioxide near
the end of discharge. Thionyl chloride itself was studied to compare
measured vapor pressure with literature data.' Fresh electrolyte, simulated-
discharged electrolyte (saturated with sulfur dioxide and sulfur), and dis-
charged electrolyte taken from spent cells were all tested without and with
fresh cathode material and cathodes taken from spent cells.
3.7 -
3.65.-
0
w e EXTRAPOLATED CELLPOTENTIALS
A EXTRAPOLATED REFERENCE3.5 POTENTIALS
3.45
3 .4 4i . .
-60 -40 -20 0 20 40 60 80TEMPERATURE, C.
Figure 16. Open Circuit Potential of a Li/SOCl2 Cell vs. Temperature
77

2. TECHNICAL PRESENTATION
2.1 EXPERIMENTAL PROCEDURE
The controlled potential coulometry was carried out in a cylindricalpyrex vessel containing about 100 ml of supporting electrolyte, to whichwas added a small weighed amount of SOCl2. A 1 ml pipette was used to
measure two samples, one for the test cell, the other for a weighing bottleto establish the weight of the sample. The SOC1 2 had been purified accordingto the procedure of Friedman and Wetter, 34 and checked for hydrolysis prod-
ucts according to French et al. 35 The amount of SOC12 used was about 1.6g,equivalent to 1 Ahr, assuming 2.67 equivalents per mole, the highest valuepredicted in Table VII. The cell had a working electrode about 3.5 cm
2
with carbon in excess, usually 500 mg to 600 mg; a lithium reference
electrode, and a counter electrode with lithium in excess. The counter2electrode waz also about 3.5 cm (two pieces of 30 mil foil). The electro-
lyte was POCl3 with either LiAlCl4 or LiBC1 4 as the electrolyte salt. The
phosphorus oxychloride was refluxed from 12 to 14 hrs over lithium anddistilled under dry air. It was checked for hydrolysis products prior to
use. 35 The supporting electrolyte was chosen for the following desirablefeatures: it did not react with SOC1 2, lithium, or the nickel screen usedto support the carbon working electrode. However, POC1 3 also dischargeson a carbon surface at about 2.5V to 3V anodic to lithium; therefore thecoulometric reduction of SOCl 2 had to be performed at a controlled potential.
In order to determine the lower potential limit fcr the coulometry,
the open circuit potential of the Li/SO 2 system had to be determined asa fuiction of temperature (see Figure 16). (This information was alsouseful in determining the "thermoneutral" potential; see Section 1-2.1.2.2.)A hermetically sealed D-size cell was used for these measurements. It hada cylindrical lithium anode pressed against the inside surface of the canand an .inner concentric carbon cathode. Part of the cathode was removed
at the bottom to permit introduction of a second lithium electrode. Thiselectrode was attached to the center pin of a second cover/feed throughassembly welded to the bottom of the can. This cell was about half die-
charged using a low current density at room temperature. The cell wasequilibrated at 25°C. The dependenae upon applied current of the terminal
potential, and of the potential of the cathode vs. the reference, wasrecorded for a stepwise series of ascending and descending currents. Thedata were fitted to polynomial functions and extrapolated to zero current
° ~~~79 . . . c..
to obtain the open circuit potential. The process was repeated for a
number of temperatures. The final results are presented in Figure 16.
A value of 3.30V was chosen as the limiting potential for the coulometric
reduction based on the approximate average of the measured SOCI 2 cell
potentials and the test cell without SOC12 added to the supporting electro-
lyte. With the limiting potential chosen, another constraint was needed.
A potentiostat could be used to fix the potential above the lower limit
selected, but the resulting initial current might be high enough to pas-
sivate the cathode surface. Current limitation was therefore necessary
also. The apparatus and method used to achieve both potential and current
control are shown in Figure 17. The potent.1ostat was a Wenking Model 61R.
With the diode in place, the potentiostat was not capable of discharging
the cell, only of charging it. Since the set potential was below the
open cJ- c.t potential however, charging could not occur, and no net current
could pa33 shrough both the cell and the potentiostat. Instead, the
potentiost ,t impressed a current through the load resistor which prevented
the potential between the carbon working electrode and the lithium reference
from falling below the set value. The recording ammeter (A) measured only
the current through the cell; the current through the resistor consisted
ot the cell current plus that impressed by the potentiostat. When the
switch was first closed at time tI , the cell discharged through the load
resistor without any participation by the potentiostat. The resistor was
chosen such that the initial current was below 1 mA/cm2 o'- cathode. When
the potential fell to the set value at time t2 , the potentiostat then sent
current through the resistor, gradually reducing the fraction of current
through the cell. The measured quantity is the total charge passed,
(i x t), i.e., the shaded area under the curve shown in Figure 17. The
cell was placed in a thermostatically controlled chamber 12 hrs before
beginning a run. A magnetic stirrer was used to keep the solution agitated.
Predischarge of the supporting electrolyte, to remove impurities such as
C12, was carried out prior to adding the SOC12 to the cell.
Chemical analyses of cathodes from discharged wound-D and bobbin 2-D
cells were performed as folluws. Cells were discharged at constant current
at various temperatures to a 1V cutoff. Temperature equilibration before
discharge wts typirally 12 to 14 hrs. Discharged cells were drilled near
the top, where there is void volume, and all volatile materials were then
ic.ioveO by evacuating the cells at ambient temperature. The cells were
disassOn: l'.ed in tJhe dryroom. The cathodes were serirated and subjected
to further vacuum drying under gertle heating (400 to 500C). Qualitative
testing uf these cathodes for lithium-sulfur-oxyacid salts, 20, and Li2S
was carried out using wet chemical methods. Solutions we e handled under
80
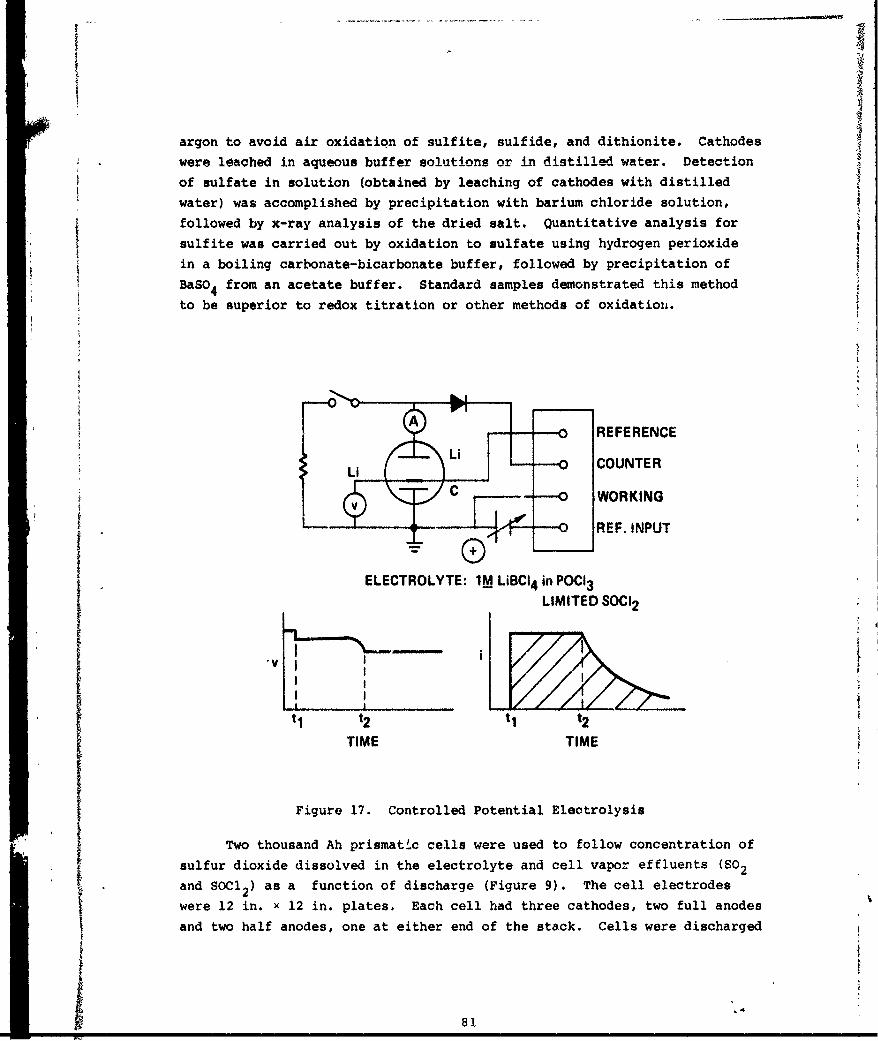
argon to avoid air oxidation of sulfite, sulfide, and dithionite. Cathodes
were leached in aqueous buffer solutions or in distilled water. Detection
of sulfate in solution (obtained by leaching of cathodes with distilled
water) was accomplished by precipitation with barium chloride solution,
followed by x-ray analysis of the dried salt. Quantitative analysis for
sulfite was carried out by oxidation to sulfate using hydrogen perioxidein a boiling carbonate-bicarbonate buffer, followed by precipitation of
BaSO4 from an acetate buffer. Standard samples demonstrated this method
to be superior to redox titration or other methods of oxidation.
SREFERENCELi
Li O COUNTER
ELECTROLYTE: iM LiBCI4 in POdl3
LIMITED SOCI 2
Ii Li
TIME TIME I
Figure 17. Controlled Potential Electrolysis
Two thousand Ah prismatic cells were used to follow concentration of
sulfur dioxide dissolved in the electrolyte and cell vapor effluents (SO2and SOCI2) as a function of discharge (Figure 9). The cell electrodes
were 12 in. x 12 in. plates. Each cell had three cathodes, two full anodes
and two half anodes, one at either end of the stack. Cells were discharged
81'
at 10A (1.8 mA cm- ) at ambient temperature. The cell case was welded
and provided with a filling port through which vapors could escape into
a tightly fitted Teflon tube. Vapors were led from the cell to a scrubbing
apparatus assembled from standard laboratory equipment. Each flask was one
liter in capacity. The total volume was one liter of 4M aqueous K2CO3. If
the cell ejected SO2 and SoC12 slightly above atmospheric pressure, the
carbonate would absorb both gases forming K2SO3 and KC1. For sampling,dry nitrogen was led through the system as shown, to purge any acid vapors
out of the connecting tubing. (A "Drierite" trap between the cell and the
first flask was found to be unnecessary; the double flask system prevented
any hazard of back-flow of the aqueous mixture into the cell.) Afterpurging, the flasks were removed, the solutions were mixed and then dis-
tributed between the two flasks again. At regular intervals, samples were
taken, one from one of the flasks and one from the cell through the fillingport, with the short plastic tube to the Y-joint disconnected. K2SO3 in
the aqueous sample was determined by oxidation to the sulfate and precipita-
tion as BaSO4. KCl was determined argentimetrically and the SOC12 collected
was equal to half the KC1; the SO2 collected was then equal to the total
K2SO minus half the KC1.
Sulfur dioxide dissolved in the electrolyte was determined by infrared
spectroscopy according to the following procedure. Solutions of SO2 in
SOC1 2 will absorb in the infrared region at 1333 cm"1 and, to a lesser
extent, at 1140 cm"1 (Figure 18). The former is useful for analysis. For
calibration standards, SOC1 2 free of SO2 must be prepared. This can be
done by fractionating the purified solvent, discarding the first fractions.
Gravimetric standard solutions of SO2 may be then prepared and appropriate
dilutions made. The net absorption vs. concentration is linear, following
Beer's law, up to at least 0.1 molar, (Figure 19). A Perkin Elmer Model 621
infrared spectrophotometer was used, with Barnes Engineering NaCl micro-cavity cells (nominal thickness 0.10 mm). Path lengths increased with cell
use, so that standards had to be run following every measurement. One
milliter electrolyte samples were pipetted into 50 ml flasks containing
25 ml of SO2- free SOC12 and then filled to the mark with S02-free SOCl2.
The vessel used to measure the vapor pressure of electrolyte mixtures
as a function of temperature is shown in Figure 20. It was constructed ofstainless steel. Its internal volume was 70 ml; 51 ml was the typical sample
size of the liquid under test. Table VIII shows the mixtures used for the
tests performed. The used cathode material had 5g of carbon to 51 ml of
liquid, to repeat the ratio used in the cells. Used electrolyte presumablywas saturated .ith sulfur and SO2, having been taken from completely dis-
charged 2000 Ahr prismatic cells.
82

WAVELENGTH (MICRONS)
10 6 87 9 10
DILUENT80- SOC,2
60-
4- STANDARD--
20 SAMPLE-''
0 1600 1400 1200 1000WAVENUMBER (CM1)
Figure 18. SO2 in SOCi 2, infrared Spectrum~
0.15-
0.0ItU
I0IN
- -NET ABSORBANCE0( 1 1000.2 0.4 0.6IFigure 19. Beer's Law Plot S02 in SOdl2
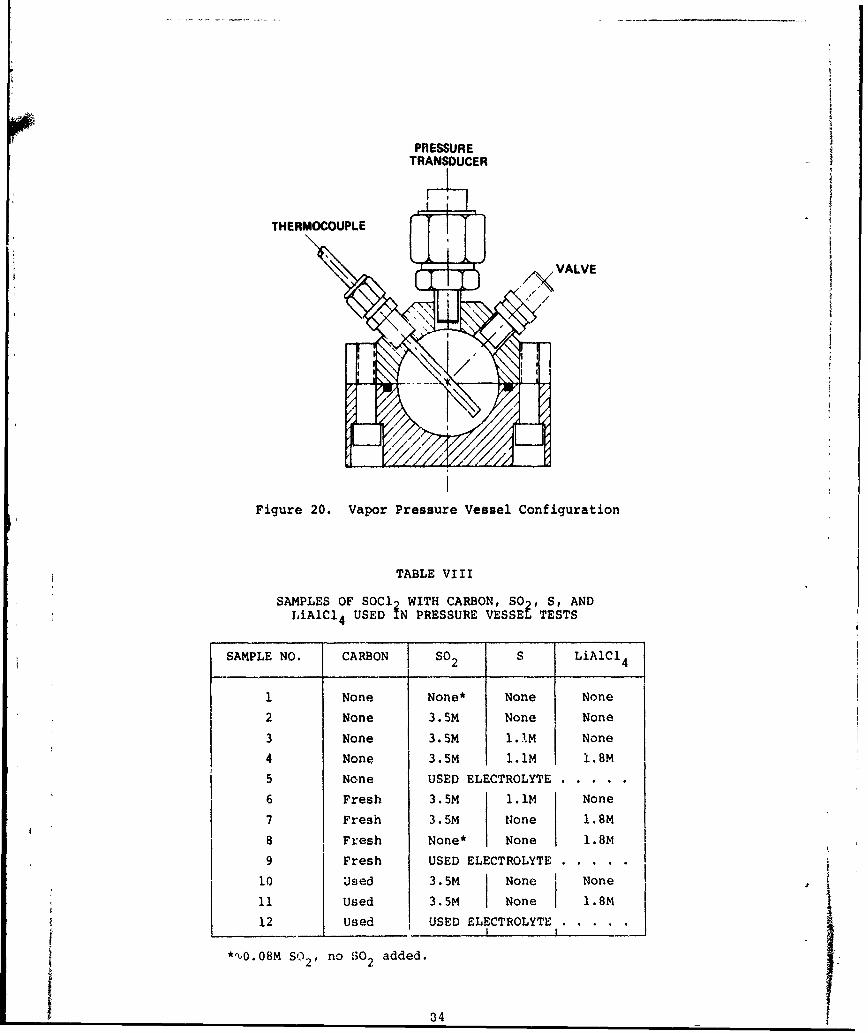
PRESSURETRANSDUCER
THERMOCOUPLE
• . VALVE
Figure 20. Vapor Pressure Vessel Configuration
TABLE VIII
SAMPLES OF SOC1 2 WITH CARBON, SO2, S, ANDLiAlCl4 USED IN PRESSURE VESSEL TESTS
SAMPLE NO. CARBON SO2 S LiAlC14
1 None None* None None
2 None 3.5M None None
3 None 3.5M 1.!M None
4 None 3.5M 1.1M 1.8M
5 None USED ELECTROLYTE .......
6 Fresh 3.5M 1.1M None
7 Fresh 3.5M None 1.8M
8 Fresh None* None 1.88M
9 Fresh USED ELECTROLYTE .......
10 Used 3.5M None None
11 Used 3.5M None 1.8m
12 Used USED ELECTROLYTE .......I -I I
*%0.08M SO2 no SO added.
2 34I.
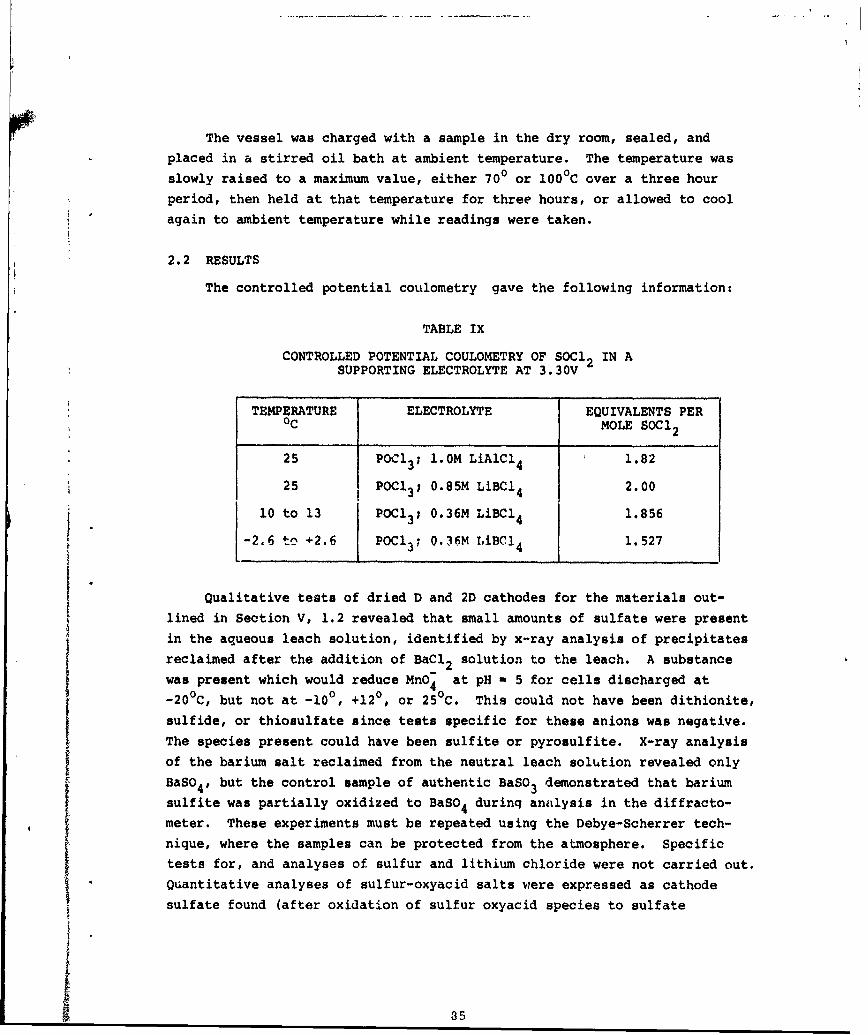
The vessel was charged with a sample in the dry room, sealed, and
placed in a stirred oil bath at ambient temperature. The temperature was
slowly raised to a maximum value, either 700 or 100 0C over a three hour
period, then held at that temperature for three hours, or allowed to cool
again to ambient temperature while readings were taken.
2.2 RESULTS
The controlled potential coulometry gave the following information:
TABLE IX
CONTROLLED POTENTIAL COULOMETRY OF SOC12 IN ASUPPORTING ELECTROLYTE AT 3.30V
TEMPERATURE ELECTROLYTE EQUIVALENTS PER°C MOLE SOC 2
25 POCl 3 ; 1.0M LiAlCI 4 1.82
25 POCI3; 0.85M LiBC14 2.00
10 to 13 POCl 3; 0.36M LiBC14 1.856
-2.6 to +2.6 POC13 ; 0.36M LiBC!4 1.527
Qualitative tests of dried D and 2D cathodes for the materials out-lined in Section V, 1.2 revealed that small amounts of sulfate were present
in the aqueous leach solution, identified by x-ray analysis of precipitates
reclaimed after the addition of BaCl2 solution to the leach. A substance
was present which would reduce MnO" at pH - 5 for cells discharged at
-20 C, but not at -10°, +120, or 25 C. This could not have been dithionite,
sulfide, or thiosulfate since tests specific for these anions was negative.
The species present could have been sulfite or pyrosulfite. X-ray analysisof the barium salt reclaimed from the neutral leach solution revealed only
BaSO 4, but the control sample of authentic BaSO 3 demonstrated that barium
sulfite was partially oxidized to BaSO 4 durinq analysis in the diffracto-meter. These experiments must be repeated using the Debye-Scherrer tech-
nique, where the samples can be protected from the atmosphere. Specific
tests for, and analyses of sulfur and lithium chloride were not carried out.
Quantitative analyses of sulfur-oxyacid salts were expressed as cathodesulfate found (after oxidation of sulfur oxyacid species to sulfate
i835
by H202 at pH = 10) divided by sulfate expected according to:
7Li + 4SOC12 -, 3/2 S2C12 + Li2SO4 + SLiC1 ... (36)
(1.75 eq. per mole SOC 2 )
and according to the observed cell capacity. For the control cells (which
were not discharged at all), the capacity was taken as the average of the
bobbin 2D cells discharged at 250C. The % sulfate, or sulfate found divided
by that expected, is plotted against discharge temperature in Figure 21.
The amount of sulfate found at room temperature or 120C is near that for
the control samples, implying that sulfate formed as much through handling
as through cell discharge. At -10 C, more sulfate appeared, and at -20 C,
a significant amount of sulfur-oxyacid-salt was produced by discnarge,
possibly a mixture of sulfite and sulfate.
30f 0 BOBBIN 2D, 150 mA
25L A WOUND D, 100 mA (8 CELLS)> CONTROL
4
< 20
0. 15
0 AO0
LA1O 00O
5 0[
00 .. . .4- ... i4_ _ ml
-30 -20 -10 0 10 20 30
DISCHARGE TEMPERATURE, 0C.
Figure 21. %Cell Capacity Accounted for Based on7 Li + 4 SOC12 3/2 S2Cl2 + Li2SO4 + 5 LiCl
36

The measurements of SO2 in the electrolytes of anode limited and
cathode limited 2K Ahr prismatic cells, and the amount of SO2 and SOC12vapors which escape from such cells, have been plotted as a function of
electrical capacity. These were shown and described above in Section I,
2.2.2, and Figures 12 and 13. In both the anode and cathode limited cells,
so2 concentration built up more slowly than that indicated in Figures 12
and 13 as predicted by Eq. (34), until near the end of discharge. At
this point, electrolyte sulfur dioxide increased rapidly and about 10.5 moles
of SO2 were finally expelled to the scrubber in the case of the cathode
limited cell, beginning shortly after 1200 Ahrs. The anode limited cell
also expelled SO2 to the scrubber shortly after 1200 Ahrs, but the amount
expelled never exceeded 90 millimoles. Scatter in electrolyte SO2 measure-
ment was in excess of that expected from the uncertainty (±5%), as noted
in the data of Figure 12. When the cell was redesigned to allow for greater
electrolyte mixing by thermal convection, the scatter was greatly reduced,
but the SO2 generation was still less than predicted by Eq. (34) until near
the end of discharge. The time required for discharge was about 1350 Ahr/
10A = 135 hours or 5.6 days.
The pressure tests were performed to determine whether the carbon was
responsible for absorbing some of the generated SC , therefore explaining
why the amount found was less than that expected according to Eq. (34).
Figure 22 shows the result when pure thionyl chloride saturated with SO2at room temperature (3.56M) was introduced into the pressure vessel witn
or without unused cathode material, in the same ratio as that present in
the 2K Ahr cells. The carbon made no significant difference in the vapor
jressure vs. temperature curve, indicating that it did not absorb SO2 .
Figure 23 shows the result when electrolyte taken from a completely dis-
charged 2K Ahr cell was temperature cycled to 70 C without carbon, at a0 2measured SO2 concentration of 3.01M. The pressure at 70 C (about 18 lb/in2
gauge) was less than that for S02-SOC1 2 mixture (about 33 lb/in2 gauge),
possibly because of thi dissolved electrolyte salt (see Figure 10).
However, on cooling the vessel, the pressure was higher than it had been
during heating. On the second thermal cycle, the pressure rose even higher.
The experiment was repeated using carbon and cycling to 1000C (Figure 24).
Pressure hysteresis was also observed as the temperature was cycled five
times. No hysteresis occurred when fresh electrolyte saturated with S and
so2 was used in place of the electrolyte from the discharged cells, whether
carbon was present or not. This demonstrated that reactions such as Eq. (35)
or Eq. (20) were not responsible for the pressure increase observed on
temperature cycling below 100 C.
87
60 p
50c S 2 ...... 3.56 M/L3 WITH OR WITHOUT CARBON
40. 3 HOURSS.-AT 70-C
30.
20 1
101[
--- ,TEMP, 0C I10 20 0 4 5b 60 70 80 90 100
Figure 22. Pressure-Temperature Behavior, SOCl2 with SO2
60--
S 2 ......... 3.01 M/L (INITIALLY)
50- cc
Il40- c
~3 HOURSAT 70°C
CC'
20- CLEt.ECYCLE 1
10.
TEMP. 0C
10 20 30 40 50 60 70 8'0 90 100
Figure 23. Pressure-Temperature Behavior, Electrolytetrom Discharged Cell
33 .

140-' --- I3 HOURSAT 1000C
120 SO ....... 3.58 M/L (INITIALLY)
CABON (CATHODE). 0.1 G/ML 5100-1_
80-
60f40-
20-
10 20 30 40 50 60 70 80 90 100
Figure 24. Pressure-Temperature Behavior, Electrolytefrom Discharged Cell
.3 DISCUSSION
The reconciliation of the coulometric data with the noted production
of SO 2 is the most important problem in the analysis of these data. Exami-
nation of dried cathodes showed that at room temperature, production of
lithium-sulfur-oxyacid salts does not account for a significant fraction
of the discharge mechanism. This correlates with the data of Cogley et al., 33
so it is assumed that the lithium ions are consumed in the cathode as
lithium chloride. The only other possible products are SO2 , SC1 2, S2C12,and elemental sulfur. However, when these possible reactions are considered
2 Li + 2 SOCI 2 - SCl 2 + SO 2 + 2LiCl ... (37)
1 eq. mole-1 SOCI 2
2 eq. mole-1 s02
6 Li + 4 SOC12 6 LiCl + S2 C 2 + 20 2 ... (38)
1.5 eq. mole- SOC 2
3 eq. mole 1 so2
89
4 Li + 2 SOC1 2 4 LiCI + S + S02 (34)
2.00 eq. mole -I so
4 eq. mole "I SO2
the available data do not cor:espond to the predicted electrical equivalents
per mole of SOC12 or of SO2. From 00 to 250C, the equivalents per mole
SOC 2 is at least 1.5, closer to 2.0 (Table IX), ruling out Eq. (37).
The predicted amount of S02 is even higher for Eq. (37) and (38) than for
Eq. (34), thus likely ruling out Eq. (38). There is one other possibility
which has not been explored:
6 Li + 3 SOC12 S20 + SO2 + 6 LiCl (39)
2 Li + SOCI 2 - SO + 2 LiCl (on discharge) (40)
2 2 0 3S + S02 (slow) (41)
02 So S + SO2 (42)
The formation, properties, and infrared spectra of "SO" and S20 have been
described in the literature. (See for example "Gmelins Handbuch der
Anorganischen Chemie,"Verlag Chemie, Weinheim (1953), Volume 9, part B,
pages 167-178.) Sulfur monoxide has been observed in the vapor phase in
the presence of a diluent gas. When condensation is attempted, a solid
polymer results which decomposes on heating to sulfur and sulfur dioxide.
No solutions of S20 or SO have ever been reported. The infrared absorption
bands ztt 1165 and 679 cm"1 observed by A.V. Jonas in 1950 were sought indilutions of electrolyte taken from discharged 2K Ahr cells, but nothing
was found. Formation of "SO" in solution according to Eq. (40) followed
by decomposition according to Eq. (42) would conveniently explain all the
other observed phenomena: electrical capacity of two equivalents per mole;
low electrolyte SO content when compared with that predicted by Eq. (34);
more rapid buildup of SO2 as the concentration of "SO" increased (decompo-
sition rate by bimolecular reaction would be proportional to the square of
the concentration); pressure buildup or hysteresis on temperature cycling
to 100 0C in a closed vessel which cannot be duplicated with SOCl2 + S + so +
LiAlCI4 ; sulfur stoichiometry as found by Cogley22 in discharged cells
90

from which SOC1 2 was removed; absence of significant quantities of lithium
sulfur oxyacid salts in the cathodes of cells discharged at room temperature.
The presence of reducing species in the aqueous leach of dried cathodes
taken from cells discharged at -20 C can explain the results reported by
Auborn,29 where x-ray analysis of a dried cathode identified Li2SO3. How-
ever, more work in this area is needed. Analysis of cells discharged at
temperatures lower than -20 C are underway. Changes in the p,:incipal
reaction stoichiometry could alter the AF and AH for the cell reaction,
changing also the dependence of the open circuit potential upon temperature,
as reported in Figure 16.
Cathode limited cells ejected SO2 at atmospheric pressure, while anode
limited cells did not (Figures 12 and 13). The heat generated at the anode
of an anode limited cell near the end of discharge is due to polarization
of remaining lithium as the surface area decreases. Uniform discharge of
lithium was fcund to occur making this transition period short. The surface
is always close to bulk eJectrolyte, facilitating heat transport away from
the surface. In the passivating cathode of a cathode limited cell, the
heat produced is trapped inside the pores where there is less opportunity
for convection to remove or distribute it. The time between the onset of
passivation and the end of discharge is longer for a cathode than for an
amode limited cell, so that more heat ia produced. Thus, an anode limitedcell is better, both because heat and pressure generation are less likely,
and because a discharged cell contains no lithium to pose an explosion
hazard during disposal or recycling of cell materials.
91

3. SUMMARY, CONCLUSIONS AND RECOMMENDATIONS
The prinicpal cell reaction at room temperature in the Li/SOCl2 system
does not involve the formation of lithium-sulfur-oxyacid salts, Li2 S or22Li 20, under the conditions of these experiments. Sulfur dioxide is pro-
duced by cell discharge, but at a rate lower than that predicted by a
stoichiometric reaction producing suflur, sulfur dioxide and lithium
chloride. The difference may be the production of an unstable lower oxide
of sulfur, which decomposes on heating below 1000C to generate equal amounts
of sulfur and sulfur dioxide.
At -20 0C, electrochemical production of sulfur-oxyacid salts during
discharge becomes significant, and may include sulfite or pyrosulfite as
well as sulfate. The dependence of open circuit potential upon temperature
is linear from 720 to -20 C but falls steeply at lower temperatures, possibly
because of a change in the principal reaction stoichiometry. It is recon-
mended that further studies be conducted on discharge reaction mechanisms
at low temperatures by analysis of discharged cathodes.
The coulometric equivalence of SOC12 is near 2.00 equivalents per mole
at room temperature. The method should be refined and the procedure repeated
to establish whether this value really changes as the temperature is lowered.
The present limitation i the freezing point of the supporting electrolyte
solvent, about 20C.
Since sulfur dioxide is prodiuced during discharge, cell design should
deal with the possible increase of pressure as the result of increasing
electrolyte SO2 concentration. Cathode limited 2K Ahr prismatic cellswere found to eject SO2 at atmospheric pressure near the end of discharge,
when polarization occurred. Anode limited cells did not do so. It is
recommended that anode limited cells be designed, particularly when large
prismatics are needed, to avoid pressure increases near the end of dis-
charge and to eliminate explosion hazard during reclamation of materials
from spent cells.
93

VI. INVESTIGATION OF INORGANIC LIQUID OXIDANTS AS
CATHODE REACTANTS FOR SEA WATER BATTERIES
1. INTRODUCTION
1.1 OBJECTIVES
There are numerous electrically powered devices that operate in sea
water such as sonobuoys, electric torpedoes and emergency/rescue equipment.
The most widely used power source is the magnesium/silver chloride sea water
battery. Recently, F. Solomon" has reported on the characteristics ofthis cell, and a more economical version based on copper halide; the ad-
vantages attributed to these systems are as follows:
1) Simplicity. The Mg/AgCl cell consists of simple bipolar plates
which are stored dry. Sea water flowing between the plates pro-
vides a conductive electrolyte and carries out the discharge and
corrosion products. The system will also function in fresh
water, generating electrolyte from discharge products. The
copper halide battery is reported to be of similar simple
construction and operation.2) Durability. In a dry condition the cells can be stored
indefinitely and are mechanically rugged.
3) Voltage regulation. The silver chloride system gives excellent2 2voltage regulation from 0 mA/cm to 10 mA/cm ; the polarization
curve is essentially flat at about 1.57V over this range in 3.5%
salt solution. Above 10 mA/cm 2 the polarization is still low;
about 1.37V at 100 mA/cm 2 (137 mW/cm2). The copper halidesystem exhibits a steeper polarization curve, but operates over
the same approximate voltage range, A variation of the copper
halide system that was being developed for electric torpedo
propulsion was reported to sustain about 150 mA/cm2 at 1.4V(210 mW/cm 2), which is actually better than the silver chloride
system.
4) Energy density. The Mg/AgCl system may be capable of energy
densities of 30 Wh/Dm3 and 120 Wh/Kg. For the sonobuoy appli-
cation the reported volumetric energy densities are in the range3 3of 7 Wh/Dm to 15 Wh/Dm and the gravimetric energy densities
are in the range of 83 Wh/Kg to 111 Wh/Kg. For the copper
halide systems these values are 9 Wh/Dm 3 to 12 Wh/Dm3 and 75 Wh/Kg.
95 U 1I G AMO?1
5) Cost. The major disadvantage of the AgCI based system is thecost of the cathode material. The silver chloride cost was
estimated to be about $0.52/Wh. (This was based on $5.50 per
troy ounce of silver and $0.30 per troy ounce for conversion tothe chloride-1974. The current price of silver is about $5.00per troy ounce.) In this respect the copper halide has a sig-nificant advantage. The material cost of the copper halide
mix was estimated to be about $0.04/Wh. However, developmentof this system has apparently been discontinued.
The use of a liquid oxidant/carbon cathode vs. the magnesium electrodein sea water might produce a more powerful electrochemical couple than thehalide cells described above. The use of an inexpensive liquid oxidant(e.g., sulfuryl chloride at approximately $0.03 to $0.05/Wh) with a carbon
electrode might in addition be economically favorable. The purpose ofthis investigation then was to explore the potential feasibility of active
metal-sea water cells using inorganic liquid oxidant cathodes. The ultimategoal is to develop economically feasible sea water battery systems in which
the peak power density exceeds that of the Mg/AgCl system.
1.2 TECHNICAL APPROACH
In order to explore a number of possibilities in a preliminary manner,state-of-the-art materials and technology were used whenever possible.Various sea water cell magnesium alloy anodes were obtained from NUSC(Newport), and the cathodes were carbon-Teflon structures. The inorganicliquid oxidants examined were several of the materials investigated in the
course of the Li/SOCd2 cell development; S02C12, SOCd 2, S2C12, SC12 and
POC 3. AgCl electrodes, obtained from NUSC, were used to generate com-parison data. Only laboratory type cells were investigated and no attempthas yet been made to evaluate energy densities or cost.
i9
j 9

I|
2. TECHNICAL PRESENTATION£
2.1 EXPERIMENTAL PROCEDURE
The magnesium anode materials obtained from NUSC had the following
allow compositions.
1) MTA75 Mg, Tl (7%), Al (5%)
A2) AZ61 Mg, Al (6%), Zn (1%)
3) AZ31 Mg, Al (3%), Zn (1%)
4) AP65 Mg, Al (6%), Pb (5%)
In addition, pure magnesium, pure aluminum (99.99%), and an aluminum alloy
were tested:
5) MRLA6 Al, En (0.12%), Ga (0.06%), Mg (0.06%)
Most of the electrode couples were evaluated in 3.5% aqueous NaCl to
simulate sea water. A few systems were tested in 40% KOH.
The cells were arranged in a horizontal configuration; the anode was
placed at the bottom of a glass dish and covered with aqueous NaCl, andthe carbon cathode was laid over a circular glass frit or attached directly
to the end of the glass tube. For operation, the liquid oxidant was added
to the carbon through a rubber septum and the glass tube was lowered into
the aqueous solution over the anode. Open circuit voltages were measured,
and the cells were polarized from open circuit to 0.OV with a linear
potential sweep in the manner described in Section 11-2.2.1. Usually a
1000 load was placed across each cell and the voltage was monitored on a
strip chart recorder to determine the voltage under a sustained load.
2.2 RESULTS AND DISCUSSION
In the first group of experiments performed, MTA-75 magnesium anodes
were used in 3.5% NaCl electrolyte; cathodes were constructed by addingvarious inorganic liquid oxidants to carbon powder on a 0.5 cm2 fritted
glass support. The open circuit voltage and voltage under a 1000 load
are summarized in the following table. These are compared with a standard
AgCl cathode in a similar configuration:
& 97
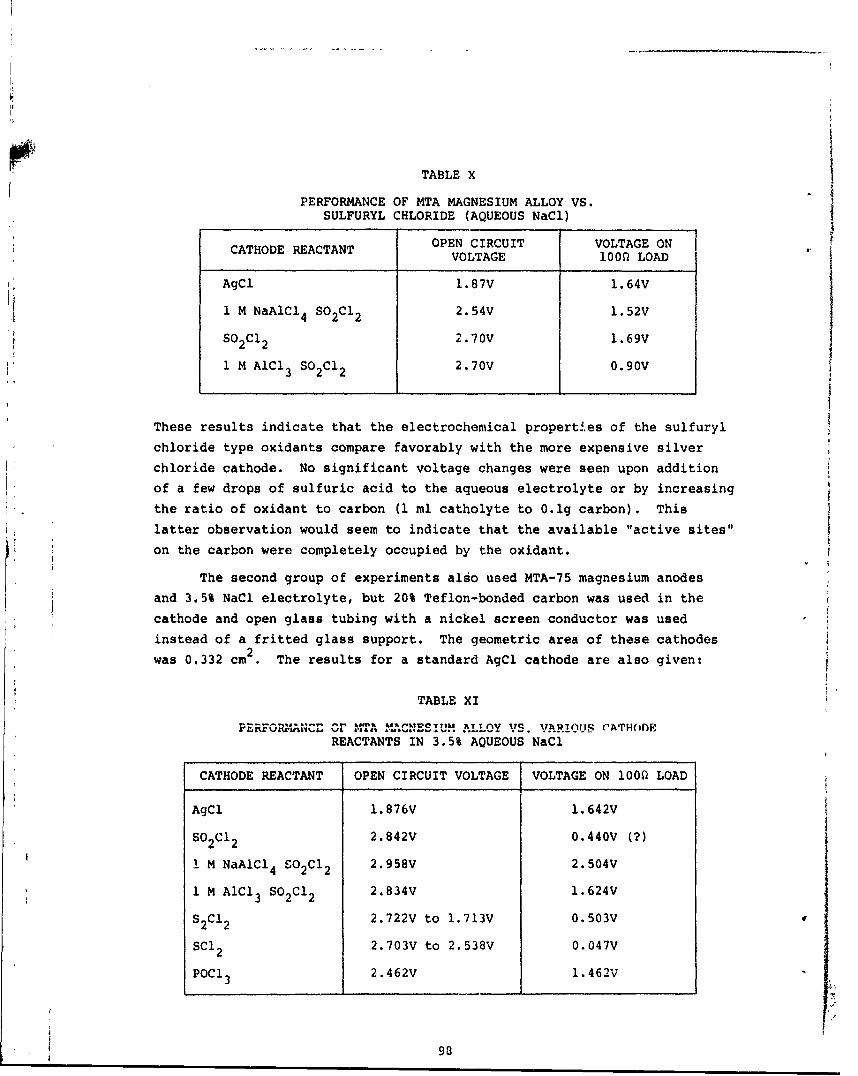
rTABLE X
PERFORMANCE OF MTA MAGNESIUM ALLOY VS.SULFURYL CHLORIDE (AQUEOUS NaCl)
OPEN CIRCUIT VOLTAGE ONCATHODE REACTANTVOLTAGE 1000 LOAD
AgCl 1.87V 1.64V
1 M NaA1Cl4 SO2 C12 2.54V 1.52V
So2 Cl2 2.70V 1.69V
1 M AlC13 So2C12 2.70V 0.90V
These results indicate that the electrochemical properties of the sulfuryl
chloride type oxidants compare favorably with the more expensive silver
chloride cathode. No significant voltage changes were seen upon addition
of a few drops of sulfuric acid to the aqueous electrolyte or by increasing
the ratio of oxidant to carbon (1 ml catholyte to O.lg carbon). This
latter observation would seem to indicate that the available "active sites"
on the carbon were completely occupied by the oxidant.
The second group of experiments also used MTA-75 magnesium anodes
and 3.5% NaCl electrolyte, but 20% Teflon-bonded carbon was used in the
cathode and open glass tubing with a nickel screen conductor was used
instead of a fritted glass support. The geometric area of these cathodes
was 0.332 cm2 . The results for a standard AgCl cathode are also given:
TABLE XI
PERFORMAILOCE 014' MAT" IMACESIUM ALLOY VS. 1flRIOUSi CATHOflEREACTANTS IN 3.5% AQUEOUS NaCl
CATHODE REACTANT OPEN CIRCUIT VOLTAGE VOLTAGE ON 100Q LOAD
AgCl 1.876V 1.642V
s02C12 2.842V 0.440V (?)
I M NaAlCl4 S02C12 2.958V 2.504V
1 M AlCl3 S02C12 2.834V 1.624V
$2CI 2 2.722V to 1.713V 0.503V
SCl 2 2.703V to 2.538V 0.047V
POCI3 2.462V 1.462V
98
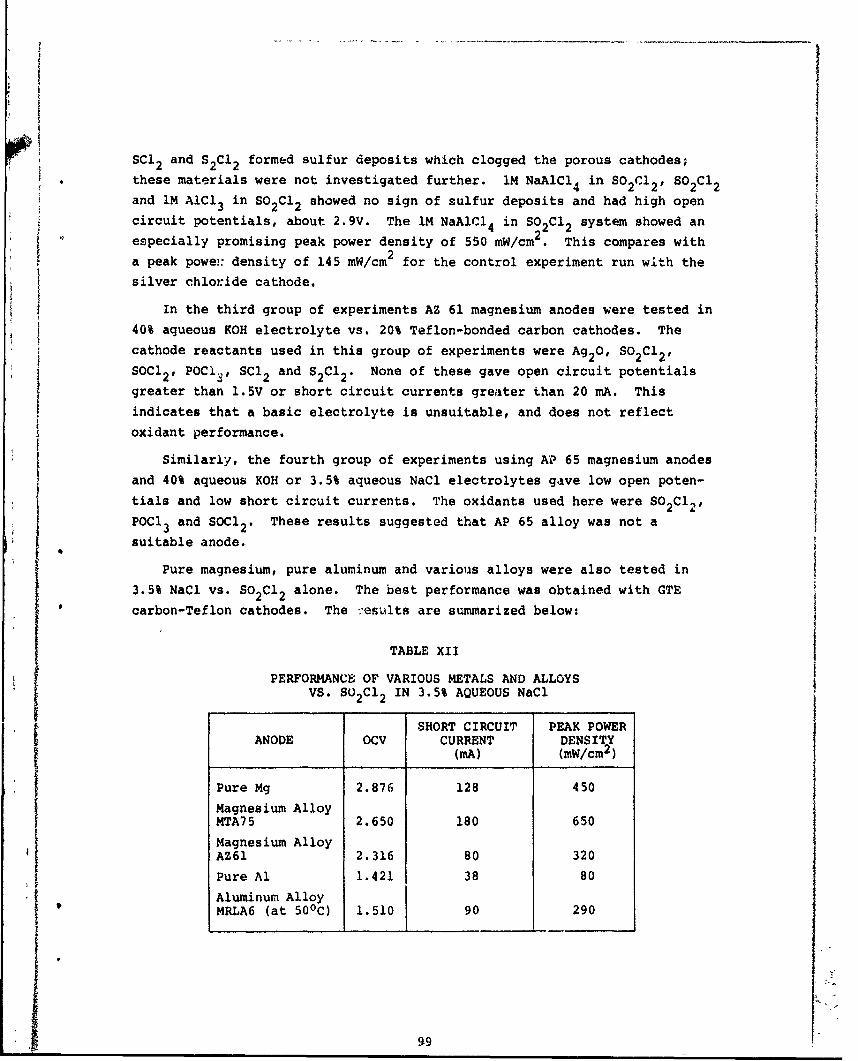
SCl2 and S2C12 formed sulfur deposits which clogged the porous cathodes;these materials were not investigated further. IM NaAlCl4 in SO2 C12 , So 2 C12
and 1M AlCl 3 in So2C12 showed no sign of sulfur deposits and had high open
circuit potentials, about 2.9V. The 1M NaAICI4 in S02C12 system showed an
especially promising peak power density of 550 mW/cm . This compares with
a peak powe:: density of 145 mW/cm 2 for the control experiment run with the
silver chloride cathode.
In the third group of experiments AZ 61 magnesium anodes were tested in40% aqueous KOH electrolyte vs. 20% Teflon-bonded carbon cathodes. Thecathode reactants used in this group of experiments were Ag20, So2C12,
SOC12 , POC,, SC 2 and $2C12 . None of these gave open circuit potentials
greater than 1.5V or short circuit currents greater than 20 mA. This
indicates that a basic electrolyte is unsuitable, and does not reflect
oxidant performance.
Similarly, the fourth group of experiments using AP 65 magnesium anodes
and 40% aqueous KOH or 3.5% aqueous NaCl electrolytes gave low open poten-
tials and low short circuit currents. The oxidants used here were SO2C12 ,
POCI 3 and SOC 2. These results suggested that AP 65 alloy was not a
suitable anode.
Pure magnesium, pure aluminum and various alloys were also tested in
3.5% NaCl vs. So2C12 alone. The best performance was obtained with GTE
carbon-Teflon cathodes. The esults are summarized below:
TABLE XII
PERFORMANCE OF VARIOUS METALS AND ALLOYSVS. S02dC2 IN 3.5% AQUEOUS NaCl
SHORT CIRCUIT PEAK POWERANODE OCV CURRENT DENSITY
(mA) (mW/cm2 )
Pure Mg 2.876 128 450Magnesium AlloyMTA75 2.650 180 650
Magnesium AlloyAZ61 2.316 80 320
Pure Al 1.421 38 80
Aluminum AlloyMRLA6 (at 500C) 1.510 90 290
99

Of all the anode materials tested, the MTA75 magnesium alloy gave the
best results, and sulfuryl chloride gave the best performance as an oxidant.This combination was tested further in a larger cell using sea water elec-
trolyte replenishment and with S02C12 alone, with 1M AlCI4 added, and withIM NaAlCl4 added. These cells had a 3 cm x 3 cm MTA-75 anode separated
from the cathode by 0,5 cm, and a 20% Teflon-bonded carbon cathode con-
taining 0.2g carbon powder with 1 ml of oxidant. Among these three cells,
the one containing NaAlCl4 in S02C12 gave the best performance. This
cell was discharged across a 321 load for 70 min at a power density of
140 mW/cm2 . The objective of the electrolyte replenishment was to remove
the discharge products and expose a clean electrode surface. The anodeswere corroded considerably at the end of the test. This corrosion usually
started directly under the cathode (this problem is common to several seawater battery systems). The amount of oxidant and the amount of carbon
present did not seent to affect the initial performance significantly.
10
100

3. SUMMARY, CONCLUSIONS AND RECOMMENDATIONS
In terms of peak power density, the liquid oxidant sulfuryl chloride
on a carbon electrode vs. various anode materials gave higher performancethan commercial Mg/metal-halide sea water cells. The best results ob-
tained were 650 mW/cm2 for S02C12 vs. MTA75 magnesium alloy in 3.5% NaCl;this compares to about 145 mW/cm 2 for Mg/AgCl. Engineering complexity and
cost of a sulfuryl chloride/carbon-cathode based system were not evaluated;
however, the initLal results are sufficiently promising to justify furtherinvestigation of the system. Since SO2CI2 reacts with water to form H2SO4
it is recommended that sulfuric acid and other aqueous solutions be tested
in addition.
~i01

VII. REFERENCES
1 1. K. Arii, Bull, Inst. Phys. Chem. Tokyo 8, 719 (1929).
2. K. Arii, Science Repts. Tohoku Imp. Univ., First r., 22, 182-99(1933).
3. N. Marincic, A. Lombardi and C.R. Schlaikjer, "Progress in theDevelopment of Lithium/Inorganic Batteries," Proceedings of the 27thPower Sources Symposium, pp. 37-42 (1976).
4. A.N. Dey, ECOM-74-0109-5 (August 1975).
5. E. Peled and H. Yamin, Submitted to 28th Power Sources Symposium'June 1978).
6. E. Peled and H. Straze, JECS 124, 1030 (July 1977).
7. K.M. McKay, Comprehensive Inorganic Chemistry, A.F. Trotman-Dickenson(Ed.), Pergamon Press, 1, 23-76 (1973).
8. Z. Szklarksa-Smialowski, JECS 110, 444 (1963).
9. K.M. McKay, Hydrogen Compounds of the Metallic Elements,E. & F.N. Spon Ltd. London (1966).
* 10. G.L. Holleck, M.J. Turchan and D.R. Cogley, ECOM-74-0030-7I(January 1975).11. A.N. Dey, ECOM-74-0109-10 (December 1976).
12. A.N. Dey and C.R. Schlaikjer, Proceedings of the 26th PowerSources Symposium, p. 47 (7974).
13. W.A. Hart and O.F. Beumel, Jr., Comprehensive Inorganic Chemistry,A.F. Trotman-Dickenson (Ed.), Pergamon Press, 1, 336 (1973).
14. Ibid., 1, 358.
15. J. Boyes and J. Chivers, J. Chem. Soc. Dalton, 1715 (1975j.
16. W.C. Schumb, et al., J. Am. Chem. Soc. 57, 260-266 (1935).
17. H. Staudinger, et al., Helv. Chim. Acta, 71-74 (1925).
18. R. Cherton, Bull. Soc. Roy. Sci. Liege 11, 54-60 (1942).
19. K. Heumann, et al., Ber. 16, 1625-1631 (1883).
20. H. Prinz, Lieb. Ann. 223, 355-371 (1884).
21. 0. Ruff, Ber. 34, 1749-1758 (1901).
22. H.B. North, et al., J. Am. Chem. Soc. 40, 774-777 (1918).
23. W.C. Schumb, et al., J. Am. Chem. Soc. 57, 260-266 (1935).
24. T. Harrington, et al., J. Soc. Chem. Ind. 64, 209-211 (1945).
103
25. J.R. Driscoll, G.L. 4olleck, D.E. Toland and S.B. Brummer,
ECOM-74-0030-12 (April 1977).
26. L. Heyne, Electrochimica Acta 15, 1251-1266 (1970).
27. E. Peled, "The Electrochemical Behavior of Alkali and Alkaline EarthMetals in Non-Aqueous Battery Systems -- The Solid Electrolyte Inter-face Model," presented at the 152nd Meeting of the ElectrochemicalSociety, Atlanta, GA (October 1977).
28. U. Mayer and V. Gutmann, Structure and Bonding 12, 113 (1972).
29. J.J. Auborn, K.W. French, S.J. Liberman, V.K. Shah and A. Heller,JECS 120, 1613 (1973).
30. J. Devynck, Thes6 de DS, Facult6 des Sciences de Paris (April 1971).
31. A.N. Dey, Electrochimica Acta 21, 377-382 (1976).
32. W.K. Behl, J.A. Christopulos, M. Ramirez, S. Gilman, J. Electrochem.Soc. 120, 1619 (1973); U.S. Army Electronics Command, Fort Monmouth,NJ, Report ECOM-4101 (April 1973).
33. D.R. Cogley, M.J. Turchan, ECOM-74-0030-2 (May 1974).D.R. Cogley, M.J. Tucchan, G.L. Holleck, ECOM-74-0030-3 (September 1974).G.L. Holleck, M.J. Turchan, D.R. Co-gley, ECOM-74-0030-4 (January 1975).G.L. Holleck, J.J. Turchan, D.E. Toland, ECOM-74-0030-5 (April 1975).G.L. Holleck, J.R. Driscoll, D.E. Toland, ECOM-74-0030-6 (July 1975).J.R. Driscoll, G.L. Holleck, Abstract 34, Electrochem. Soc., Fall
Meeting, Dallas, Texas (1975).
34. L. Friedman and W.P. Wetter, J. Chem. Soc. (A), p. 36 (1967).
35. K. French, P. Cukor, C. Perisiani, J. Auborn, J. Electrochem. Soc.121, 1045 (1974).
36. F. Solomon, "Performance of a New Non-Silver Sea Water Battery,"Proceedings of the 9th Intersciety Energy Conversion EngineeringConference, pp. 660-66t (1974).
1Ii 104

TECHNICAL REPORT DISTRIBUTION LIST
No. Copies No. Copies
Office of Nitval Research Defense Documentation CenterArlington, Virqinia 22217 Building 5, Cameron StationAttn: Code 472 2 Alexandria, Virginia 22314 12
Office of Naval Research U.S. Axicv Research OfficeArlingto. , Virginia 22217 P.O. Box 12211Attn: Code 1021P 1 6 Research Triangle Park, N.C. 27709
Attn; CRD-AA-IPONR Branch Office536 S. Clark Street Naval Ocean Systems CenterChicago, Illinois 60605 San Diego, California 92152Attn: Dr. Jerry Smith 1 Attn: Mr. Joe M.artney
ONR Branch Office Naval Weapons Cente?715 Broadway China Lake, California 93555New York, New York 10003 Attn: Head, Chemistr) L'visionAttn: Scientific Dept. 1
Naval Civil Engineering LaboratoryONR Branch Office Port Hueneme, California 930411030 East Green Street Attn: Mr. W.S. HaynesPasadena, California 91106Attn: Dr. R.J. Marcus I Professor 0. Heinz
Department of Physics & ChemistryONR Branch Office Navp" Postgraduate School760 Market Street, Rm. 447 Monterey, California 93940San Francisco, California 94102Attn: Dr. P.A. Miller 1 Dr. A.L. S4afkosky
Scientific AdvisorONR Branch Office Commandant of the Marine Corps (Code RD-l)495 Summer Street Washington, D.C. 20380 1Boston, Massachusetts 02210Attn: Dr. L.H. Peebles 1Office of Naval Research
Arlington, Virginia 22217Director, Naval Research Laboratory Attn: Dr. Richard S. MillerWashington, D.C. 20390Attn: Code 6100 1 Library
P.R. Mallory and Company, Inc.The Asst. Secretary of the Navy (R&D) P.O. Box 706Department of the Navy Indianapolis, Indiana 46206Room 4E736, PentagonWashington, D.C. 20350 1 Dr. P.J. Hendra
University of SouthamptonCommander, Naval Air Systems Command Department of ChemistryDepartment of the Navy Southampton S09 5NHWashington, D.C. 20360 United KingdomAttn: Code 310C (H. Rosenwasser) 1
Dr. Sam PeroneDr. Paul Delahay Purdue UniversityNew York University Department of ChemistryDep&rtment of Chemistry West Lafayette, Indiana 47907Now York, New York 100031
"ECHNICAL REPORT DISTRIBUTIO11 LISTI
No. Copies No. Copies
Dr. R.A. Osteryoung Dr. Royce W. Mu-rayColorado State University University of North CarolinaDepartment of Chemistry Lepartrent of ChemistryFort Collins, Colorado 80521 1 Chapel Hill, North Carolina 27514 1
Dr. E. Yeager Naval Ocean Systems CenterCase Western Reserve University San Diego, California 92152Department of Chemistry Attn: Technical Library 1Cleveland, Ohio 41106
1Dr. D.N. Bennion The Electrochemistry BranchUniversity of California Materials Division, Research & Tech. Dept.Energy Kinetics Department Naval Surface Weapons CenterLos Angeles, California 90024 1 White Oak L3boratory
Silver Spring, Maryland 20910 1Dr. R.A. MarcusUniversity of Illinois Dr. G. Goodman
Department of Chemistry Globe-Union Inc.Uibana, Illinois 61801 1 5757 North Green Bay Avenue
Milwaukee, Wisconsin 53201Dr. J.J. Auborn
Bell Laboratories Dr. J. BoechlerMurray Hill, New Jersey 07974 1 Electrochimica Corporation
Attn: Technical LibraryDr. Adam Heller 2485 Charleston RoadBell Telephone Laboratories Mountain View, California 94040 1Murray Hill, New Jersey 07974
Dr. P.P. SchmidtDr. T. Katan Oakland UniversityLockheed Missiles & Space Co., Inc. Department of ChemistryP.O. Box 504 Rochester, Michigan 48063 1Sunnyvale, California 94088 1
Mr. D.L. UrburtonDr. Joseph Singer, Code 302-1 The Electrochemistry BranchNASA-Lewis Materials Division, Research & Tech. Dept.21000 Brookpark Road Naval Surface Weapons CenterCleveland, Ohio 44135 1 White Oak Laboratory
F1lv..r Spring, Maryland 20910 1Dr. S.B. BrummerEIC Corporaion55 Chapel StreetNowton, Massachusetts 02158 1
Dr. Aaron WoldBrown UniversityDepartmelt of ChemistryProvidence, Rhode Island 02912
Dr. R.C. Chudace0McGraw-Edison Company
Edison Battery Division .1Post Office Box 28Bloomfield, New Jersey 07003 1