Embed Size (px)
Citation preview

ÉCOLE DOCTORALE DES SCIENCES CHIMIQUES
ISIS (UMR 7006)
Laboratoires des Nanostructures
THÈSE présentée par :
Hadi BAHSOUN
Soutenue le : 14 Septembre 2017
pour obtenir le grade de : Docteur de l’université de Strasbourg
Discipline/ Spécialité : Physique
Electronic Strong Coupling of Molecular Materials in the Liquid Phase
THÈSE dirigée par :
Prof. EBBESEN Thomas Professeur, Université de Strasbourg
RAPPORTEURS : Prof. GOMEZ RIVAS Jaime Professeur, Université Technique Eindhoven Prof. RUBIO Angel Professeur, Max Planck Institute for the Structure
and Dynamics of Matter
AUTRES MEMBRES DU JURY : Dr. GENET Cyriaque Directeur, CNRS, Université de Strasbourg
UNIVERSITÉ DE STRASBOURG


Acknowledgements
I
Acknowledgements
First, I want to dedicate my gratitude and appreciation to my supervisor Prof. Thomas
W. Ebbesen for giving me the opportunity to have this PhD in his lab (Nanostructures
laboratories), and for his trust to freely use all the available resources to serve this scientific
project during the past three years. I learned a lot from his wide scientific knowledge and
experience, and gained new approaches in science and life in general. He was always
concerned to optimize the success of my work and his door was always open for guidance,
support and advice.
I would particularly like to thank Dr. James A. Hutchison for all the scientific and
experimental support he offered me, and for his follow up on my projects. His enthusiasm
was a huge source of inspiration and motivation for me. My deepest appreciation goes to
Dr. Eloïse Devaux for her technical support, teachings, and kindness. Her presence and
patience in solving all the technical problems were the major reason behind the smooth
running of experiments. I also thank Dr. Cyriaque Genet who was very careful to deliver
the correct scientific picture, for his kind advice and also for accepting to be a member of
my thesis jury.
Here, I seize the opportunity to express my gratitude to Prof. Angel Rubio and Prof.
Jaime Gómez Rivas for accepting to be among the jury members of my thesis and for their
time to evaluate my thesis report.
I want to thank all my colleagues at ISIS in general, and at Nanostructure Laboratories
in particular. One can never wish for a more united and supportive team than the one that
I worked with during my PhD. I have the honor to be one of you. For this, I dedicate special
thanks to Jino George, Anoop Thomas, and Atef Shalabney for all their experimental
support, and generosity in sharing their scientific knowledge and experiences. They are
also close friends who were always there to provide me with personal support and helpful
advice. I am indebted for Thibault Chervy, who proved to be an outstanding young
scientist, an active team member, and a gentle person. He was my companion for the past
three years; I learned much from him about the topic and he offered me a lot of help during
critical stages of my thesis. I also thank Shaojun Wang for the time he spent to engage me

Acknowledgements
II
with his research projects and to help me improve my research skills. I also want to thank
him for his own thesis which was a source of inspiration to mine.
I want to thank also my colleagues Xiaolan Zhong, Stefano Azzini, Robrecht
Vergauwe, Oussama Sentissi, Gabriel Schnoering, and Yoseline Rosales-Cabara for their
kind cooperation and for maintaining a friendly and positive atmosphere at work. And I
also express my appreciation to Madam Marie-Claud Jouaiti who held the pressure of all
the administrative work and made these procedures less time consuming.
I would like to express my deepest heartfelt gratitude to my parents, brothers, sisters,
other family members and friends, who believed in me and supported me continuously on
both moral and emotional levels. They never hesitated to keep pushing me forward, and
surrounded me with all the love throughout these years. In this context, I want to thank my
friend Amer Hamdi-Sakr for the wonderful 13 years of friendship, and for his company
during this long scientific and life exploration journey (in Beirut, Dubai, and Strasbourg)
which started in our second year of University, and I wish him all the success he deserves
in his PhD and future plans.
Many thanks and respect to the French government and its people for their openness
to host foreign students and treat them as their own citizens. I am also grateful for the
University of Strasbourg for funding my project and managing all the beneficial formations
and conferences, and to all its obliging staff members who always offered high quality
service.
To all of you, thank you.
Hadi

Contents
III
Contents
Acknowledgements I
I. Fundamentals 1
1. General Introduction
1.1- Basics of Light-Matter Interaction……………………………..........
1.2- Coupling Regimes: Weak Coupling and Strong Coupling………….
1.2.1- The Weak Coupling Regime…………………………………
1.2.2- The Strong Coupling Regime………………………………...
1.3- Brief History of Light-Matter Strong Coupling Research…………..
1.4- State-of-the-art Light-Molecule Strong Coupling…………………..
1.5- Outline of This Thesis……………………………………………….
2
2
4
5
6
7
10
15
2. Theoretical Description of Strongly Coupled Systems
2.1- Classical Description………………………………………………..
2.1.1- Anti-Crossing of Normal Modes……………………………..
2.1.2- Numerical Applications………………………………………
2.2- Quantum Description………………………………………………..
2.2.1- Single Two-Level System……………………………………
2.2.2- Collective Rabi Splitting……………………………………..
17
17
17
22
25
25
30
II. Results
32
3. Strong Coupling on Plasmonic Structures
3.1- Surface Plasmon Polariton…………………………………………..
3.1.1- Dispersion of SPPs…………………………………………...
3.1.2- The Evanescent Field of SPPs………………………………..
3.1.3- The Excitation of SPPs……………………………………….
3.1.4- Strong Coupling on Plasmonic Arrays……………………….
3.2- Wetting Properties Under Strong Coupling…………………………
3.2.1- Experimental Section…………………………………………
33
33
35
37
39
46
48
50

Contents
IV
3.2.2- Results and Discussions……………………………………...
3.3- Conclusions …………………………………………………………
56
65
4. Strong Coupling in Liquid Fabry-Perot Nanocavities
4.1- The Physics of Fabry-Perot Cavities………………………………
4.2- Electronic Light-Molecule Strong Coupling in Liquid Fabry-Perot
Nanocavities…………………………………………………………
4.2.1- Fabrication of Fabry-Perot Liquid Nanocavities …………….
4.2.2- Experimental Section…………………………………………
4.2.3- Results and Discussions……………………………………...
4.2.4- Quantum Yield Calculations…………………………………
4.3- Conclusions …………………………………………………………
66
67
70
71
74
79
84
87
Thesis Conclusions and Outlook 88
References…………………………………………………………………….
Publications and Conferences…………………………………………………
91
106

1
Part I.
Fundamentals

Ch1. General Introduction
2
CHAPTER 1: General Introduction
This chapter gives an introduction to the basics of light-matter interactions. The two
fundamental interaction regimes, the weak and strong coupling regimes, will be discussed
with an emphasis on the latter. A brief history of the theory of strong light-matter coupling
will be provided, highlighting the important stages of emergence of this field. Some
examples from state-of-the-art experiments on strong coupling of light with various
material systems will be presented. Results on strong coupling of light with organic
materials will be a particular focus, highlighting the need to explore this area further for
both the fundamental science and applications.
1.1- Basics of Light-matter Interaction
Our visual perception of the world around us in all its forms and colors is governed
by a myriad of diverse light-matter interactions. We have long striven to understand
the reasons behind many visual observations, for instance, why do we see daylight on
earth and darkness in outer space despite the permanent presence of the sun, why are
some objects opaque while others are transparent, why do objects seem bent or closer
to an external observer when they are in water? Over time, the understanding of light-
matter interaction phenomena like scattering, transmission, refraction and dispersion
have answered these questions and many others concerning the observable world
around us.1 This understanding grew phenomenally first with the advent of Maxwell’s

Ch1. General Introduction
3
Electromagnetic Theory of Light that treats the propagation of light classically, and
then later with the view of the dual wave/particle nature of light put forward by Albert
Einstein and the development of quantum theory starting with Max Planck.2 Finally
the fusion of the two theories into quantum electrodynamics (QED) has taken the study
of light-matter interactions from the macroscopic scale to the single photon-atom
level.3
Figure 1.1: Schematic representation of basic light-matter interaction. (a) Atom with a positively charged
center and its electronic cloud before and after its interaction with light which leads to the formation of a
transient dipole moment. (b) Successive absorption and emission of a photon of energy hv by a two-level
atom/molecule.
Two basic events that govern many interactions of light with a material are the
successive absorption and emission of a photon by an absorber. When a photon with energy
hv strikes a material (for example a two-level atom as schematically presented in Figure
1.1a) having a transition with same energy, the photon is absorbed by the atom via a dipole
coupling interaction, leaving the atom in an excited state. The atom can return to its ground
state by releasing a photon with the same energy hv (as can be seen in Figure 1.1b),
conserving the total energy of the system. Of course many other types of light-matter
interaction may take place depending on the properties of the light field (frequency,
polarization, and intensity), the material (size, chemical composition, electronic density,
etc…), and the circumstances of the interaction (environment, phase relationships, angle
of incidence, etc…).
(a) (b)

Ch1. General Introduction
4
In general we can define two light-matter interaction regimes: the weak and the
strong coupling regimes, which depend on the fate of the photon after the
absorption/emission process discussed above. If, after emission, the photon propagates
away and is lost to the system, the interaction is ‘weak’, and the photon and atom remain
separately measureable entities. If however the two species (photon and absorber) are
placed in an environment where they are allowed to continuously interact by multiple
absorption/emission events, the interaction can enter the strong coupling regime where the
photon and atom become hybridized leading to the formation of new hybrid light-matter
eigen-states. In this thesis, we seek to explore such hybrid light-matter states involving
molecules and investigate their properties.
1.2- Coupling Regimes: Weak Coupling and Strong
Coupling
Figure 1.2: Schematic of a coupled oscillator system: two harmonic oscillators, represented as two weights,
m1 and m2, attached by a spring to a surface, coupled by, and exchanging energy through, a spring of coupling
strength k.
Any two harmonic oscillators that are allowed to exchange energy can be
considered as a single coupled oscillator system. For instance, two mechanical oscillators
can exchange energy through a spring of coupling strength k, connecting them (Figure
1.2a), while some energy is lost to the environment by friction. The coupled system
exhibits very different behavior depending upon the quantitative relationship between the
two processes i.e the energy exchange and energy losses. The notion of moving from the
weak to the strong coupling regime is tied to exactly this change of behavior at the

Ch1. General Introduction
5
threshold where the rate of energy exchange overcomes the rate of energy dissipation. In
analogy to this system, the energy exchange between light and matter is mediated by
coupling factor whose strength will determine the coupling regime. Further discussion
about the coupling strength in the case of light-matter interaction is presented in the next
chapter.
1.2.1- The Weak Coupling Regime
In the weak coupling regime, where losses overwhelm energy exchange between
the oscillators, modifications to the original frequencies of the coupled oscillators in Figure
1.2 are minor. Returning from the classical model in Figure 1.2 to the dipole coupling
between a light field of a cavity and an atom, a similar behavior is observed qualitatively.
For instance, the radiative rate of the atom can be modified by the interaction but the
molecule emission frequency remains unchanged.4 An example is the Purcell effect5
whereby the spontaneous emission rate is either enhanced or inhibited due to the modified
photonic mode density inside an optical cavity. This effect will be further explored and
demonstrated experimentally in chapter 5.
Figure 1.3: Förster energy transfer mechanism between singlet dipole-dipole interactions.
Donor Acceptor

Ch1. General Introduction
6
Another example of weak coupling, this time between the transition dipoles of two
absorbers, is Förster energy transfer6 between donor and acceptor molecules. In the case
of molecules having resonant emission and absorption transitions (see Figure 1.3), the
energy transfer is irreversible when transfer rate (kET) from donor to acceptor is smaller
than the relaxation rate (kVib) of the acceptor. In contrast, when kET is greater than any other
relaxation mechanisms of the excited state, back and forth transfer of energy can occur and
the system enters the strong coupling regime. In this limit, new delocalized eigenstates that
extend collectively over several molecules are generated, known as excitons as proposed
by Davydov.7 A similar reshaping of the energy levels of the system occurs via strong
coupling of photons and matter as will be discussed in the next section.
1.2.2- The Strong Coupling Regime
Figure 1.4: Formation of two hybrid polaritonic states due to light-matter strong coupling
Under certain conditions, a transition dipole moment of a two-level system can
exchange energy with a resonant light mode (Figure 1.4). Again, the strong coupling is
achieved when the energy exchange rate exceeds all dissipation processes during the
interaction. . Here we note that dissipations in the system can occur through the EM mode
(radiative decay), or by the relaxation pathway of the excited state.8–11 When the above
conditions are achieved, the phenomenon of strong coupling gives rise to two new light-
Molecular Resonance
Hybrid (Polaritonic) States
Photonic Mode
Ch1. General Introduction
7
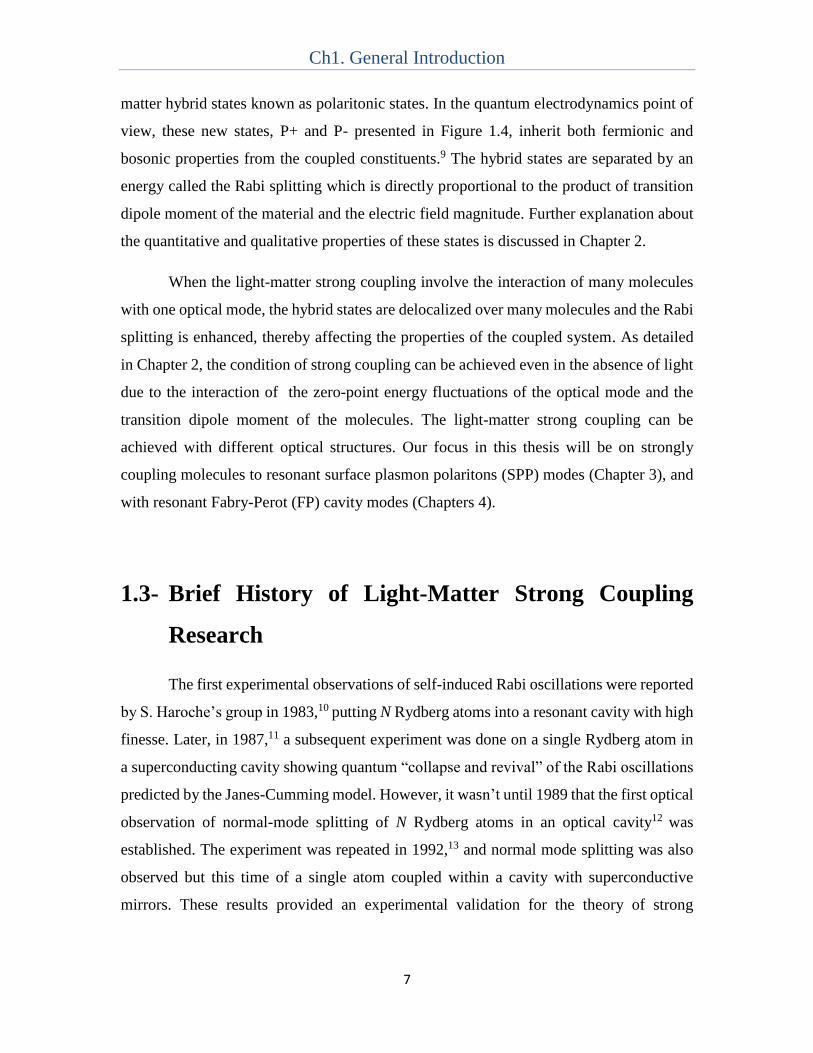
matter hybrid states known as polaritonic states. In the quantum electrodynamics point of
view, these new states, P+ and P- presented in Figure 1.4, inherit both fermionic and
bosonic properties from the coupled constituents.9 The hybrid states are separated by an
energy called the Rabi splitting which is directly proportional to the product of transition
dipole moment of the material and the electric field magnitude. Further explanation about
the quantitative and qualitative properties of these states is discussed in Chapter 2.
When the light-matter strong coupling involve the interaction of many molecules
with one optical mode, the hybrid states are delocalized over many molecules and the Rabi
splitting is enhanced, thereby affecting the properties of the coupled system. As detailed
in Chapter 2, the condition of strong coupling can be achieved even in the absence of light
due to the interaction of the zero-point energy fluctuations of the optical mode and the
transition dipole moment of the molecules. The light-matter strong coupling can be
achieved with different optical structures. Our focus in this thesis will be on strongly
coupling molecules to resonant surface plasmon polaritons (SPP) modes (Chapter 3), and
with resonant Fabry-Perot (FP) cavity modes (Chapters 4).
1.3- Brief History of Light-Matter Strong Coupling
Research
The first experimental observations of self-induced Rabi oscillations were reported
by S. Haroche’s group in 1983,10 putting N Rydberg atoms into a resonant cavity with high
finesse. Later, in 1987,11 a subsequent experiment was done on a single Rydberg atom in
a superconducting cavity showing quantum “collapse and revival” of the Rabi oscillations
predicted by the Janes-Cumming model. However, it wasn’t until 1989 that the first optical
observation of normal-mode splitting of N Rydberg atoms in an optical cavity12 was
established. The experiment was repeated in 1992,13 and normal mode splitting was also
observed but this time of a single atom coupled within a cavity with superconductive
mirrors. These results provided an experimental validation for the theory of strong

Ch1. General Introduction
8
coupling and took the first steps on the journey towards exploring the rising field of so-
called cavity quantum electrodynamics.14,15
Consequently cavity quantum electrodynamics attracted the interest of solid state
physicists, and strong coupling was implemented on semiconductors such as quantum dots
and quantum wells.16,17 Excitons, or electron-hole pairs, were coupled with resonant
photonic modes giving rise to exciton-polaritons. The first exciton-polariton mode splitting
was demonstrated by C. Weisbuch et al. in 1992,18 who succeeded in spectrally resolving
the Rabi splitting for GaAs quantum wells imbedded in distributed Bragg’s reflectors
(DBR) Fabry-Perot (FP) cavities. It was noticeable that larger Rabi splitting values were
recorded for exciton-polaritons as compared with those occurred in the case of atoms-
cavity systems, and this is due to the larger number of dipoles contributing to the energy
exchange in the cavities. Subsequent experiments were performed to explore
photoluminescence properties of exciton-polaritons.19 For instance, the polariton
dispersion curve was deduced from angle resolved photoluminescence measurements and
validated the theoretical dispersion of the exciton-polaritons.20 Other contemporary studies
investigating exciton-polaritons dynamics21,22 have led to the observation of Bose Einstein
Condensates (BEC) and superfluidity in semiconductor planar micro-cavities embedding
quantum wells.23
In general, relatively low values of Rabi splitting energies result from the coupling
of inorganic semiconductors (in the order of 10 meV).24 This is due to the low binding
energy of the Wannier-Mott (WM) type of excitons25 taking part in the coupling process.
WM excitons have large radii (larger than the lattice distances of the crystal) and
consequently low effective mass due to the large electric field screening the Coulomb’s
forces that holds them to their nuclei. Hence WM exciton binding energies can be less than
thermal energy at room temperature (~26 meV at room temperature) making them
unstable, with concomitant broadening of their transition line-widths making it difficult to
resolve the Rabi splitting. Under such circumstances, special conditions (cryogenic set ups
and very high Q-factor DBRs) are required to clearly observe the Rabi splitting in
inorganic semiconductors. For this reason, attention turned towards excitons with binding
energies that are large enough to observe the Rabi energy oscillations at room temperature.

Ch1. General Introduction
9
This was established on systems like GaN in high finesse DBRs,26 CdSe nanocrystals
coupled to surface plasmon polaritons,27 two-dimensional MoS2 atomic crystals,28 two-
dimensional WS2 monolayers coupled to surface plasmons,29 and single QD strongly
coupled with single photon in high Q micro-cavity.30 These results have significant impact
on many applications like nonlinear optics and quantum information processing.24
Influenced by the coupling of phonon modes to surface plasmons,31 light-organic
molecule strong coupling was demonstrated for the first time by Pockrand et al. in 198332
when they coupled cyanine dye molecules to resonant plasmon polaritons on Ag surface.
Nevertheless, little attention was given to organic molecule strong coupling at that time.
Only after two papers on light-molecule strong coupling were published in 199833,34 did
the interest to employ molecules in the strong coupling research increase, leading
eventually to the observation of room temperature lasing35,36 and polariton
condensation,37,38 in 2014. Interestingly, organic molecules exhibit a set of characteristics
which give them advantages over inorganic semiconductors for strong coupling. Firstly,
their excitons are of the Frenkel type, displaying large transition dipole moment39 and
higher binding energies (~0.1 to 1eV) as compared to WM-type excitons. Secondly, high
concentrations of molecules can be confined in small volumes to collectively interact with
a photonic mode. These features allow high values of Rabi splitting to be observed at room
temperature even within low Q-factor cavities. For instance, light-molecule strong
coupling with a Rabi splitting of 700 meV was reported in 2011, representing 32 % of the
molecule’s transition energy,40 using a photochrome coupled to either a metallic FP cavity
or a plasmonic mode, consequently putting the system in the ultra-strong coupling
regime.40–44
Another exciting feature of using molecules for strong coupling is that they can
exist as liquids, gases, and solutes, allowing the exploration of strong coupling in a great
variety of phases of matter. Liquid phase strong coupling was demonstrated very recently
at the nanostructures laboratory in ISIS-Strasbourg, by the coupling of a vibrational
transition of Citronellal in a micro-fluidic FP cavity.45 Subsequent experiments reported
the first multi-mode Rabi splitting in the vibrational states of strongly coupled Fe(CO)5 in

Ch1. General Introduction
10
the liquid phase.42 Such ultra-strong coupling modifies the optical, molecular and material
properties of the coupled system.
1.4- State-of-the-Art Light-Molecule Strong Coupling
As mentioned earlier, the strong interaction of cavity electromagnetic modes with
molecules can drastically alter the states of molecules allowing for new possibilities to
control the properties of this quantum-mechanical ensemble.46 In the past few years,
extensive effort from different teams9,37,41,47–50 was invested in exploring the properties of
strongly coupled molecular systems towards fundamental understanding and potential
applications. Molecules with various properties were studied under strong coupling in
order to investigate physical phenomena,35,37,38 devices,40,47,51,52 and any consequence for
material and molecular science.47,53,54 For example J-aggregates were extensively
employed in strong coupling research,32,55–63 due to their well suited characteristics
including intense, narrow absorption and emission peaks and small Stokes shifts. In the
next few paragraphs the state-of-the-art of the photophysical, chemical, and dynamical
properties of polaritonic eigenstates arising from light-molecule strong coupling will be
summarized.
In 2005, the first demonstration of strong coupling of an organic light emitting
diode (LED) in a microcavity was reported by Bulović and his team.61 Thin films of
polyelectrolyte J-aggregate dyes embedded in a resonant microcavity were shown to emit
upon electrical injection of carriers. Subsequently, Kéna-Cohen and his team showed that
organic LED’s electroluminescence can be achieved at lower voltages under ultra-strong
coupling.51 They also demonstrated in the same paper an enhancement in external quantum
efficiency due to ultra-strong coupling which could impact the development of organic
LEDs. In 2010, Kéna-Cohen and Forrest reported the room temperature lasing of
polaritons arising from the coupling of melt-grown anthracene single crystals sandwiched
between DBR mirrors,35 the result which was also reported very recently by Gomez Rivas
and his team, but this time via the coupling of organic rylene dye with resonant surface
plasmons on top of silver array.36 Shortly afterward, temporal and spatial coherence of

Ch1. General Introduction
11
emission from hybrid polaritons were studied. For instance the real-time observation (on
10 fs scale) of ultrafast Rabi oscillation in a J-aggregate/metal nanostructure was reported
by Lienau’s group,62 indicating coherent energy transfer between excitons and SPP fields.
On the other hand, in 2012 Bellessa and coworkers63 reported spatial coherence of
emission from disordered J-aggregates strongly coupled to the surface plasmon polaritons
of a metallic film, an effect that is absent in the weak coupling regime. Two years later,
Törmä and coworkers64 studied the evolution of spatial coherence properties of organic
fluorescent molecules coupled to plasmonic surface lattice resonances as their system went
from the weak to strong coupling regime. Two groups reported room temperature polariton
condensation.37,38 These findings show that organic molecule polaritonic states can allow
the study of quantum condensates under ambient conditions and might benefit soft matter
optoelectronic devices.65 In the same context, Chervy et al. have very recently investigated
second harmonic generation (SHG) of polaritons.66 Using porphyrin nanofiber crystals in
a metallic cavity, they observed an enhancement by 2 orders of magnitude of the SHG
efficiency from the lower polaritons as compared to that of the same material outside the
microcavity. Recently strong coupling of a few molecules with plasmonic nanocavities at
room temperature was reported by Baumberg and colleagues.67 The latter results promise
to have numerous applications including single-photon emitters and nonlinear optics.

Ch1. General Introduction
12
Figure 1.5: Observing ultra-strong coupling. (a) Schematic of the photochromic conversion between
merocyanine (MC) and spiropyran (SP) in a micro-cavity. (b) Absorption spectra for a film in the SPI (dashed
line) and MC (solid line) forms. (c) The evolution of transmission spectrum of the coupled system under UV
illumination. The initial (black) spectrum corresponds to the cavity transmission in presence of SP molecules.
By exposing SP to 330 nm UV light, they are converted into MC, resulting in resonance with the cavity. As
the concentration of MC increases, a transition from weak to strong coupling and eventually ultrastrong
coupling occurs. Figures are from references [40,46,68].40,46,68
So far we have discussed how light-molecule strong coupling is manifested in
quantum physics and photo-physical phenomena. However, this is not the sole province in
which strong coupling can play a role. In fact, over the past decade the study of strong
coupling has been shown to modify chemical and bulk properties of the molecules. For
instance, Hutchison et al. studied the strong coupling of a photochromic cyanine dye which
experiences reversible conversion from a colorless molecule to one with a well-defined
absorption band at 560 nm under illumination with UV light (visible light for the reverse
process),40 allowing the system to switch from the weak to the ultra-strong coupling regime
and vice-versa via sample irradiation (see Figure 1.5). Accordingly, they were able to show
MCSPI
(b)
(a)
(c)
Ch1. General Introduction
13
the rate of evolution of the photochrome towards the photostationary state decreased and
the yield increased under strong coupling.69 They have also examined the same system to
show bulk modification of the work-function of these molecules when coupled to a
resonant metallic cavity as well as surface plasmon resonances.53 Note that this system was
involved in the experiments in Chapter 3 of the thesis. The conductivity of a semi-
conducting molecules can be enhanced when strongly coupled to surface plasmon
polaritons.47 Wang et al. reported that strong coupling could influence the hysteresis and
dynamics of a perovskite phase transition.70
Another interesting feature of the delocalized wave functions of the polaritonic
states is that they can alter the distance-dependence of energy transfer processes between
two species. Recently it was shown that non-radiative energy transfer is characterized by
a larger critical distance under strong coupling compared to that for a pure Förster-type
process.48,71 The length-scale of the energy transfer becomes defined by the extent of the
cavity mode (typically larger than 200 nm) to which the molecules are coupled, rather than
typical Forster distance of a few nanometres. The observation of double vacuum Rabi
splitting due to coupling of two molecules to a single optical mode provides the possibility
for energy transfer processes to occur among the hybrid modes.72 Very recently, Zhong et
al. reported amplified non-radiative energy transfer between two J-aggregate cyanine dyes
strongly coupled to the vacuum field of a cavity.60 With the help of femtosecond transient-
transmission spectroscopy, they were able to extract the transfer rates and demonstrate
enhancement by a factor of 7 as compared with the uncoupled system. They explained this
behavior by the presence of delocalized hybrid states that played the role of a connector
between the donor and acceptor molecules. The ability to transfer energy over distances
comparable to the wavelength of light has vast implications for light-harvesting systems,
solar energy conversion, and coherent energy transport.48,60,71,72
The strong coupling of molecular vibrational modes is a promising direction for
modifying chemical reactions.73–75 Vibrational transitions are found in the IR so that micro-
fluiduic FP cavities can be used for such studies.45 In the ultra-strong coupling regime,
multiple Rabi splittings can be observed.42 In 2016, using a simple deprotection reaction,
the Strasbourg group demonstrated that not only is the chemical reaction rate reduced

Ch1. General Introduction
14
under vibrational strong coupling but more importantly the activation enthalpy and entropy
of the reaction significantly modified indicating a change in the reaction mechanism.76
Very recently, Rabi splitting of protein vibrational modes strongly coupled to resonant IR
modes,77 and the strong coupling of electronic excitations of chlorosomes78 were reported.
These initial reports will very likely attract scientists from biological backgrounds to
exploit the phenomenon of strong coupling in their future research.
All this experimental work has stimulated many theoretical studies and has led to
the developments of new approaches to handle the complexity of the strongly coupled
molecular system.79–85 In so doing, many of the experimental results have been confirmed
and new predictions have emerged and thereby enriching the strong coupling field.
Needless to say that such system are very different from the the two-level Jaynes-
Cummings theory discussed in Chapter 2.
Figure 1.6: Emission of a strongly coupled dye molecule plotted as a function of k//. The nondispersive
emission is from the uncoupled molecules (J1) in the cavity, while the coupled ones give rise to dispersive
emission from the lower polaritons (P-). Figure is taken from references [9, 59]. 9,59
Polariton dynamics has been the focus of interest of many researchers. Polariton
states lifetime, relaxation processes and quantum efficiencies were studied.59,86,87 A

Ch1. General Introduction
15
thorough study was carried out by Schwartz et al. investigating the polariton dynamics
under strong coupling.56 They used steady-state and femtosecond time-resolved emission
and absorption spectrometry on a J-aggregate cavity system to demonstrate the unexpected
long lifetime of the lower polariton states. Later Wang et al. studied the strong coupling
emission quantum efficiency by acquiring the emission as a function of the position of the
active molecular layer inside a metallic resonant cavity.59 The emission from the lower
polaritons P- was observed to be dispersive as shown in Figure 1.6, emphasizing the
bosonic quality of the polaritonic states. However, they found that the polariton decay is
dominated by non-radiative processes resulting in low quantum yields. The lifetime of
these hybrids were also reported, and a longer lifetime was recorded by the lower
polaritons compared with those of the bare molecules, which was explained by the non-
Markovian character of the relaxation process.88 Polariton dynamics and photophysical
properties constitute part of our study in this thesis, as described in Chapter 4.
1.5- Outline of This Thesis
It is clear from the past two sections that understanding light-matter strong coupling
is evolving and gradually unveiling new and exciting phenomena. The field is advancing
at good pace and leading towards promising applications. Nevertheless, there are still many
unsolved issues concerning light-molecule strong coupling that require examination.
Strong coupling theory has mostly been well developed beyond the two level systems to
date, and is showing progress when applied with systems involving much more
complicated energy diagram, as in the case of molecules. In this thesis we report further
studies of light-molecule strong coupling which we hope will contribute to the overall
understanding of this phenomenon and its potentials.
In the next chapter, derivation of the theoretical framework for strong coupling
phenomena will be presented and explained. The quantitative description of the Rabi
splitting for an ensemble of N molecules shall be represented from the classical and
quantum point of views. Based on results showing bulk property changes, we were
interested to test whether those modifications could possibly affect the surface energy of

Ch1. General Introduction
16
strongly coupled materials. In Chapter 3, we will describe an attempt to find a way to
answer this question and discuss the challenges faced during those experiments.
In all of the experiments to date, electronic excitations coupled to light modes were
studied with systems having molecules in the solid phase. Mixed within polymer matrices,
molecules are restricted in terms of rotation and diffusion, restricting some relaxation
pathways and thus limiting the dynamics study of the hybrid states. In Chapter 4, we
demonstrate the excitonic state strong coupling of molecules mixed in liquid solution in
resonance with an especially designed Fabry-Perot nano-cavity. Theses liquid FP
nanocavities will be characterized, and the relation between the value of Rabi splitting and
the number of coupled molecules N will be experimentally demonstrated. Then, in the
same chapter, a study of the dynamics and the photo-physical properties in the weak and
strong coupling regime of a chlorin dye is reported. A comparison between our results and
ones reported for similar studies will be provided.
Ch2. Theoretical Description of Strongly Coupled Systems
17
CHAPTER 2: Theoretical Description of Strongly Coupled Systems
The mechanism of strong light-matter interactions has been investigated
theoretically from different point of views: classical, semi-classical, and quantum. Some
of the basic features of strong coupling that we discussed in the previous section, such as
the anti-crossing behavior, Rabi splitting, and delocalized wave functions of the hybrid
states are described in this chapter by using theoretical models. Classically, we have treated
the matter as a Lorentzian oscillator driven by an electric field force. We have also
performed numerical applications to predict the behavior of organic molecules in a
resonant cavity. From the quantum point of view, a single two level system interacting
with a single optical mode was treated using Janes-Cumming Hamiltonian. For an
ensemble of N-molecules, we have adapted Dicke’s Hamiltonian to show the collective
property of Rabi splitting.
2.1- Classical Description
2.1.1- Anti-crossing of Normal Modes
In order to study the strong interaction, we begin by considering the matter as a
classical Lorentzian oscillator2,89 composed of a point-like electric dipole oscillating with
a frequency 𝜔0. Since we are dealing with the system from a classical point of view, the

Ch2. Theoretical Description of Strongly Coupled Systems
18
dipole is considered to be driven by a harmonic force created by the electric field E(r,t),
and consequently displaced by a distance r from its equilibrium position. With such
considerations, the equation of motion of the electron under the force of the field is:
𝑚𝑑2𝑟
𝑑𝑡2+ 𝑚𝛾
𝑑𝑟
𝑑𝑡+ 𝜔0
2𝑚𝑟 = −𝑒𝐸(𝑟, 𝑡)
(2.1)
where m is the mass of the electron and e is its charge, and γ represents the energy
dissipated in the system due to damping forces. The local field of the charges and all other
magnetic forces were neglected90 in equation (2.1). Since the electron displacement is very
small compared to the wavelength of the EM-field in the visible range, then E(r,t) is
constant in r(t)=r e-iωt and varies harmonically with time as e-iωt where 𝜔 is the frequency
of the field. Consequently, the electron’s motion will follow the same harmonic time
dependence as that of the driving field force. Therefore, after applying these assumptions
and performing simple derivatives, equation (2.1) will become:
𝑚(−𝜔2 − 𝑖𝜔𝛾 + 𝜔02)𝑟 = −𝑒𝐸 (2.2)
Now consider a set of N electrons are experiencing harmonic movement upon the
interaction with the field. If each electron is polarized by –er, then the polarization density
P of the electrons present in a unit volume V is given by:
𝑃 = −𝑁
𝑉𝑒𝑟 (2.3)
Substituting (2.2) in (2.3) will give:
𝑃 =𝑁𝑒2
𝑚𝑉
1
(𝜔02 − 𝜔2 − 𝑖𝜔𝛾 )
𝐸
(2.4)
However, the macroscopic linear polarization of a dipole is defined as:
𝑃 = 휀0𝜒𝐸 (2.5)
where 𝜒 is the electric susceptibility of the matter, and 휀0 is the permittivity in vacuum.
Also by simple substitution, one can obtain 𝜒 as a function of 𝜔:

Ch2. Theoretical Description of Strongly Coupled Systems
19
𝜒(𝜔) = 𝐴
(𝜔02 − 𝜔2 − 𝑖𝜔𝛾 )
(2.6)
where we have substituted in A all the constant values as a function of 𝜔: 𝐴 =
(𝑁𝑒2)/(𝑚휀0 𝑉) . This means that besides having a real part, 𝜒(𝜔) has an imaginary part
which corresponds to the delayed response of the dipole to the field. The permittivity of
the medium is correlated to the susceptibility by:
휀(𝜔) = 1 + 𝜒(𝜔) (2.7)
which by substituting in (2.6) will give:
휀(𝜔) = 1 + 𝐴
(𝜔02 − 𝜔2 − 𝑖𝜔𝛾 )
(2.8)
Now let us consider the simplified energy-momentum dispersion relation of a transverse
EM wave inside a FP cavity or propagating at a metal-dielectric interface44 (which is the
case in our experiments) as follows:
𝑘 = 𝜔
𝑐√휀(𝜔)
(2.9)
For simplicity, let’s denote 𝜅 = 𝑘𝑐 (where c is the speed of light in vacuum), then the
new term for the momentum 𝜅 is expressed as:
𝜅2 = 𝜔2휀(𝜔) = 𝜔2(1 + 𝐴
𝜔02 − 𝜔2 − 𝑖𝜔𝛾
)
(2.10)
By applying simple algebraic rearrangements, equation (2.10) can be also written as:
𝜅2 − 𝜔2 = 𝐴
𝜔02 − 𝜔2 − 𝑖𝜔𝛾
(2.11)
(𝜅 − 𝜔)(𝜅 + 𝜔) = 𝐴
(𝜔0 − 𝜔)(𝜔0 + 𝜔) − 𝑖𝜔𝛾 (2.12)
Ch2. Theoretical Description of Strongly Coupled Systems
20
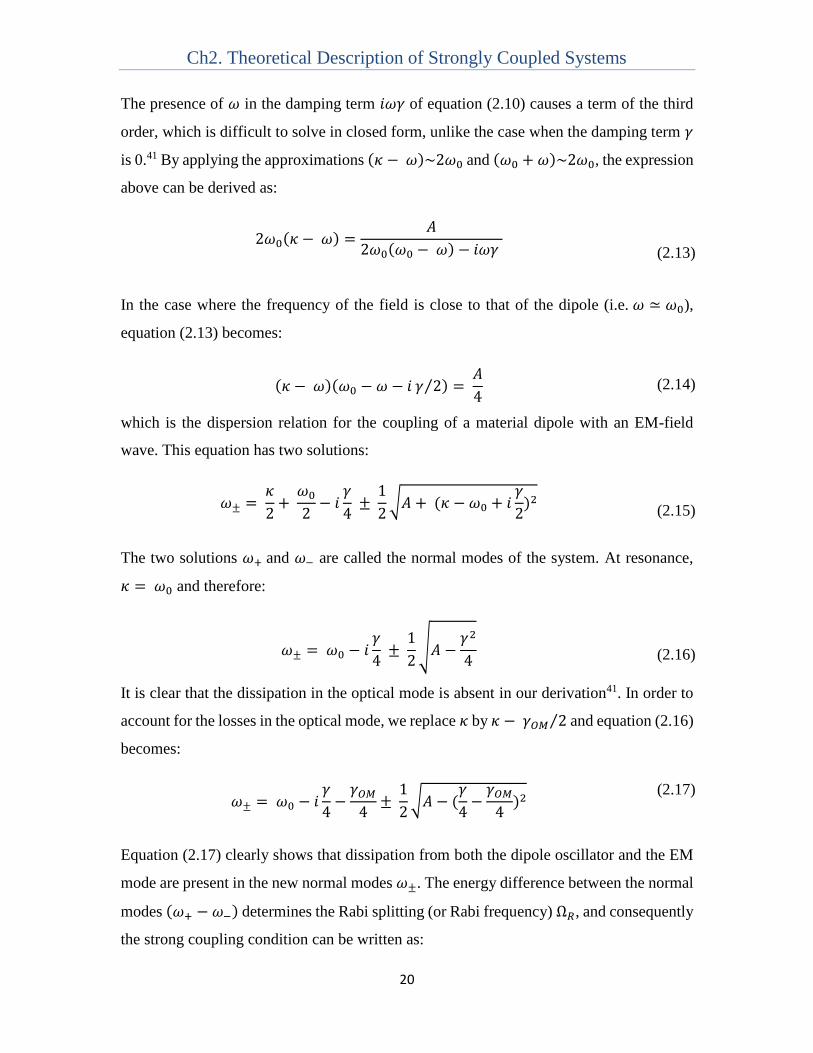
The presence of 𝜔 in the damping term 𝑖𝜔𝛾 of equation (2.10) causes a term of the third
order, which is difficult to solve in closed form, unlike the case when the damping term 𝛾
is 0.41 By applying the approximations (𝜅 − 𝜔)~2𝜔0 and (𝜔0 + 𝜔)~2𝜔0, the expression
above can be derived as:
2𝜔0(𝜅 − 𝜔) =𝐴
2𝜔0(𝜔0 − 𝜔) − 𝑖𝜔𝛾
(2.13)
In the case where the frequency of the field is close to that of the dipole (i.e. 𝜔 ≃ 𝜔0),
equation (2.13) becomes:
(𝜅 − 𝜔)(𝜔0 − 𝜔 − 𝑖 𝛾 2⁄ ) = 𝐴
4 (2.14)
which is the dispersion relation for the coupling of a material dipole with an EM-field
wave. This equation has two solutions:
𝜔± = 𝜅
2+
𝜔0
2− 𝑖
𝛾
4 ±
1
2√𝐴 + (𝜅 − 𝜔0 + 𝑖
𝛾
2)2
(2.15)
The two solutions 𝜔+ and 𝜔− are called the normal modes of the system. At resonance,
𝜅 = 𝜔0 and therefore:
𝜔± = 𝜔0 − 𝑖𝛾
4 ±
1
2√𝐴 −
𝛾2
4
(2.16)
It is clear that the dissipation in the optical mode is absent in our derivation41. In order to
account for the losses in the optical mode, we replace 𝜅 by 𝜅 − 𝛾𝑂𝑀 2⁄ and equation (2.16)
becomes:
𝜔± = 𝜔0 − 𝑖𝛾
4−
𝛾𝑂𝑀
4±
1
2√𝐴 − (
𝛾
4−
𝛾𝑂𝑀
4)2
(2.17)
Equation (2.17) clearly shows that dissipation from both the dipole oscillator and the EM
mode are present in the new normal modes 𝜔±. The energy difference between the normal
modes (𝜔+ − 𝜔−) determines the Rabi splitting (or Rabi frequency) Ω𝑅, and consequently
the strong coupling condition can be written as:

Ch2. Theoretical Description of Strongly Coupled Systems
21
Ω𝑅 = √𝐴 − (𝛾
4−
𝛾𝑂𝑀
4)2
(2.18)
The Equation in (2.18) shows that Ω𝑅 requires the condition that 𝐴 > (𝛾
4−
𝛾𝑂𝑀
4)2 and it is
maximum when 𝛾𝑂𝑀~ 𝛾. If we neglect the damping forces, the Rabi frequency is
expressed as:
Ω𝑅 = √𝐴 = √𝑁
𝑉
𝑒
√𝑚휀0
(2.19)
Equation (2.19) shows a direct correlation between the Rabi splitting and the concentration
C of coupled molecules since √𝐶 = √𝑁/𝑉. This correlation will be experimentally
observed in chapter 5.
The exact solutions of the dispersion relation obtained in (2.10) are represented in
Figure 2.1. The dispersions of the normal modes 𝜔± are displayed by assuming that there
are no losses in the system (i.e. 𝛾𝑂𝑀 = 𝛾 = 0) and that the constant A represents a small
fraction of 𝜔02. The graph takes into account only a small range of values of the
wavenumber 𝜅 around the bare dipole frequency 𝜔0 . At larger detunings, the normal
modes disperse asymptotically with the original dipole transition frequency and that of the
photonic mode (dashed lines in Figure 2.1). However, as the system approaches resonance
the curves spread away from the original dispersions and the energy gap between the
normal modes increases in a behavior referred as the anti-crossing. At resonance
(i.e. 𝜔 𝜔0⁄ = 𝜅 𝜔0⁄ = 1), the energy splitting is at its maximum, and the value at
maximum energy splitting is called the Rabi splitting (or Rabi frequency) as we have
mentioned earlier. Experimentally speaking, the presence of the anti-crossing behavior in
our dispersion relations is a typical proof that the system is in the strong coupling regime
and is associated with hybrid character of the modes. These hybrid modes have become
the topic of interest for many researches including our work in this thesis.

Ch2. Theoretical Description of Strongly Coupled Systems
22
Figure 2.1: Normal modes dispersion of the coupled system as a function of the optical mode tuning,
showing the anti-crossing behavior of energy at resonance with a Rabi splitting ΩR = 0.14ω0. The calculation
neglects the dissipations of the coupled system. The horizontal and sloped dotted lines display the energy of
the matter and dispersion of optical modes respectively in the absence of coupling.
2.1.1- Numerical Applications
The quantitative description in the above section is appropriate for a single dipole
(for instance an atom) interacting with a field mode. The situation is different in our
experiments, because matter here is an ensemble of organic molecules embedded in a
polymer matrix or mixed in a solution. For this reason, the line-shapes are far more
complicated than those present in single dipole due to the molecule’s inhomogeneous
broadening and vibrational manifolds.43,59,88 For this reason, we simulate our systems via
numerical method namely the Transfer or T-matrix formalism for multi-layer systems.
This formalism is an equation that relates the EM field input with its output through a
matrix which accounts for the boundary conditions of the field at each interface. We use
plane waves as an exact solution to the Maxwell’s equations and assume that each layer
can be described by a uniform index of refractions. The optical response of the active layer
0.7 0.8 0.9 1.0 1.1 1.2 1.3
0.7
0.8
0.9
1.0
1.1
1.2
1.3
0
0

Ch2. Theoretical Description of Strongly Coupled Systems
23
(embedded molecules) includes the material’s contribution to the refractive index 𝑛 which
is a complex number having the real part 𝑛′ and an imaginary part 𝑛′′. The latter part is
known as the extinction index and can be obtained from the absorption spectrum 𝑎(𝜔)
through the following relation:
𝑎(𝜔) = 𝜔
𝑐𝑛′′
(2.20)
Then by using Kramers-Kronig91 relations, one can obtain the value of the real index 𝑛′:
𝑛′ = 1 + 2
𝜋℘ ∫
𝜔′𝑛′′(𝜔′)
𝜔′2 − 𝜔2𝑑𝜔′
∞
0
(2.21)
where ℘ represents the principle value. Consequently, the real and imaginary parts of the
permittivity (휀′ and 휀′′ ) can be calculated using the following relations:
휀′ = 𝑛′2− 𝑛′′2 (2.22)
휀′′ = 2𝑛′𝑛′′ (2.23)
Both real and imaginary parts of the index depend on the energy 𝜔 (see Fig. 2.2a
and b). The absorption has a maximum value at the energy 𝜔0(Fig. 2.2a). The variation of
the real index 𝑛′ can be analyzed according to the relative value of the energy values with
respect to the absorption peak (Figure 2.2b). Far from 𝜔0, 𝑛′ is very close to the
background index (which is 1.41 in this case) either from above (for 𝜔 < 𝜔0) or below
(for 𝜔 > 𝜔0). As the energy approaches resonance, 𝑛′ increases in a behavior similar to
the “normal” dispersion. However, it drops suddenly at energies very close to resonance
resulting in a peak and dip around 𝜔0.

Ch2. Theoretical Description of Strongly Coupled Systems
24
Figure 2.2: The real (a) and imaginary (b) part of the refractive index of Chlorin e6 (Ce6) dissolved in
dimethylformamide (DMF). The vertical line shows the resonant frequency ω0 of this molecule and the
horizontal line in (b) corresponds to the background refractive index. Figures (c), (d) and (e) are the
calculated reflection (R%), transmission (T%) and absorption (A%=1- T%- R%) spectra respectively of the
coupled system, demonstrating that the original resonant mode (the middle black dotted line) splits into two
new normal modes (the orange dotted lines) when a 420 nm active layer is placed in a resonant cavity formed
by two 30 nm thick Ag mirrors.
When the system is placed into a resonant cavity, the peak and dip of the real index
will produce two normal modes with opposite phases. Experimentally, these normal modes
appear as two distinct peaks under spectroscopic observation. However, by making use of
the T-matrix formalism, we can predict the transmission, reflection, and absorption spectra
of a sample molecule placed in a resonant cavity. The spectra show the presence two peaks
0.00
0.05
0.10
0.15
n''
1.6 1.8 2.0 2.2
1.3
1.4
1.5
(eV)
n'
(a)
(b)
0
20
40
60
80
100
Re
fle
ctio
n %
0
20
40
Tra
nsm
issio
n %
1.6 1.8 2.0 2.2
0
20
40
(eV)
Ab
so
rptio
n %
(c)
(d)
(e)

Ch2. Theoretical Description of Strongly Coupled Systems
25
representing the normal modes under strong interaction with the cavity mode (the orange
dotted lines in Figures 2.2 c, d, and e). As we will see in Chapter 4, similar numerical
methods using the T-matrix were used to calculate the absorption of molecules when
placed in liquid Fabry-Perot (FP) nanocavities.
2.2- Quantum Description
2.2.1- Single Two-level System
In order to study the light-matter coupling from the quantum point of view, we
begin by considering the emitter as a single two-level system interacting with a quantized
electromagnetic field (see Figure 2.3).
Figure 2.3: A two-level system coupled to a single field mode treated as a harmonic oscillator.
The quantum emitter is modeled as a spin-1/2 dipole whose magnetic field is
aligned with the quantization axis z, having an upper level |𝑒⟩ and a lower level |𝑔⟩
connected by the transition angular frequency 𝜔0. In the basis of the spin along z, we define
the following spin-flip operators:

Ch2. Theoretical Description of Strongly Coupled Systems
26
𝜎+ = |𝑔⟩⟨𝑒| 𝜎− = |𝑒⟩⟨𝑔| 𝜎𝑧 = |𝑒⟩⟨𝑒| −|𝑔⟩⟨𝑔| (2.24)
On the other hand, the EM field is taken as a quantized harmonic oscillator with
frequency 𝜔, and we denote by 𝑎 and 𝑎† the bosonic creation and annihilation operators
respectively. If we denote the Hamiltonian of the spin-flip by ℋ𝑎 , that of the optical mode
by ℋ𝑏 and the interaction term by ℋ𝑎𝑏 , the general form of the Hamiltonian ℋ of the
system is expressed as:
ℋ = ℋ𝑎 + ℋ𝑏 + ℋ𝑎𝑏
(2.25)
The interaction term ℋ𝑎𝑏 is defined by the product of the transition dipole operator 𝓓 by
the electric field operator 𝓔 , which will usually bring about 4 terms. Two terms accounting
for the normal absorption/emission of a photon associated with a transition to the
upper/lower states, and two terms for the anti-resonant processes during which the
annihilation/creation of a photon is accompanied by a transitions to the lower/upper states.
Using the rotating wave approximation (RWA), we neglect the anti-resonant processes
leaving ℋ𝑎𝑏 with only two terms. In this case, the total Hamiltonian of the system is called
the Jaynes-Cumming Hamiltonian, and is expressed in terms of the defined operators as:
ℋ = ℏ
2 𝜔0𝜎𝑧 +
ℏ
2𝜔𝑎†𝑎 − 𝑖
ℏ
2Ω𝑅[𝑎𝜎+ − 𝑎†𝜎−] (2.26)
The factor Ω𝑅 which accounts for all the constant values resulting from the operators’
product −𝓓. 𝓔 measures the coupling strength. Ω𝑅 is called the Rabi frequency and is
expressed as follows:
Ω𝑅 =2𝑑
ℏ𝜉0
(2.27)
𝜉0 = √ℏ𝜔
2휀0𝑉
(2.28)

Ch2. Theoretical Description of Strongly Coupled Systems
27
where d is the transition dipole moment of matter and 𝜉0 is the electric field amplitude per
photon in the mode volume V. In the general case when the two-level system interacts
with 𝑛 photons, the eigenvectors of the system will be a set of: |𝑒, 𝑛⟩ and |𝑔, 𝑛 + 1⟩, and
the coupling term will be expressed as:
Ω𝑅,𝑛 =2𝑑
ℏ𝜉0√𝑛 + 1 (2.29)
Here it is interesting to note that in the absence of photons (𝑛 = 0); the Rabi
splitting sustains a finite value. This is due to the interaction of the dipoles with the zero
point energy fluctuations of the confined field. In this case, the regime is referred as the
Vacuum Rabi splitting and it is the condition present in all the experiments in this thesis.
Now in order to determine the eigenvalues of our system, we restrict our conditions
to the case of a dipole interaction with only a single photon mode. Keeping in mind the
Janes-Cumming coupling terms, we introduce the eigenvectors of the dipole-field system:
|𝑒, 0⟩ and |𝑔, 1⟩. Let ∆= 𝜔 − 𝜔0 be the dipole-field detuning constant. Therefore, the new
form of equation (2.26) is expressed as:
ℋ = ℏ
2(𝜔 + 𝜔0). 𝕝 +
1
2(
∆ −𝑖Ω𝑅
𝑖Ω𝑅 −∆) (2.30)
and 𝕝 = (1 00 1
) is the well-known unitary matrix. The diagonalization of (2.30) will result
in the energy eigenvalues expressed as follows:
𝐸± = ℏ
2(𝜔 + 𝜔0) ±
1
2√∆2 + Ω𝑅
2 (2.31)
In analogy with the classical description, the general form of the energy eigenvalues in
(2.31) is similar to the normal modes of equation (2.15) obtained in the previous section.
Plotting the dispersion of the energies in equation (2.31) will result in a similar anti-

Ch2. Theoretical Description of Strongly Coupled Systems
28
crossing behavior as that present in Fig. 2.1. Nevertheless, we can also deduce from the
previous diagonalization the following eigenstates:
|𝑃+⟩ = cos (𝜃
2) |𝑒, 0⟩ + 𝑖 sin (
𝜃
2) |𝑔, 1⟩ (2.32)
|𝑃−⟩ = sin (𝜃
2)|𝑒, 0⟩ − 𝑖 cos (
𝜃
2) |𝑔, 1⟩ (2.33)
|𝑃+⟩ and |𝑃−⟩ known as the polaritonic states, were expressed as a function of 𝜃 which is
the angle that the field makes with the z quantization axis and it is defined by:
tan 𝜃 = Ω𝑅
Δ (2.34)
At resonance, 𝜃 = 𝜋 2⁄ and the two polaritonic states become:
|𝑃𝑟𝑒𝑠+ ⟩ =
1
√2(|𝑒, 0⟩ + 𝑖|𝑔, 1⟩) (2.35)
|𝑃𝑟𝑒𝑠− ⟩ =
1
√2(|𝑒, 0⟩ − 𝑖|𝑔, 1⟩) (2.36)
In this sense, the polaritonic states represent a coherent superposition of an excited state
with no photon and a ground state with one photon. Therefore, we were able to
mathematically show how the polaritonic states arising from the strong light-matter
interaction inherit fermionic and bosonic characteristics from their constituents. Moreover,
the separation between these states is assigned to the reversible energy exchanged between
the matter and light mode.

Ch2. Theoretical Description of Strongly Coupled Systems
29
Figure 2.4: A two-level system coupled Rabi oscillation. An excited dipole is placed into a cavity and
undergoes vacuum Rabi oscillations mediated by the matter-field coupling strength 𝑔 = Ω𝑅/2, resulting in
one quantum being added to the mode. Dissipation mechanisms are also illustrated although not discussed
in the main text. γ is the atomic damping rate and τ is the cavity lifetime. Figure is adapted from reference.92
The time-evolution of the states will help studying the energy exchange mechanism
between the interacting species. Let us consider a dipole in the ground state interacting
with a trapped photon in its environment. The time-evolution of such system is given by:
|Ψ(𝑡)⟩ = cos (Ω𝑅𝑡
2) |𝑒, 0⟩ − 𝑖 sin (
Ω𝑅𝑡
2) |𝑔, 1⟩ (2.37)
The system is constantly oscillating between the lower and higher states and consequently
performing the so-called “Rabi oscillations” (see Figure 2.4). This is a typical description
for the case of a molecule placed inside a resonant cavity. The photon emitted by the
relaxed molecule is trapped and reabsorbed maintaining the Rabi oscillations. Moreover,
we can obtain the probability 𝛲𝑟 for finding the system in state |𝑔, 1⟩ by:
𝛲𝑟 = cos2 (Ω𝑅𝑡
2) =
1 + cos Ω𝑅𝑡
2
(2.38)
2.2.2- Collective Rabi Splitting:

Ch2. Theoretical Description of Strongly Coupled Systems
30
The quantum description explained above suffices to understand the origin of the
Rabi oscillations arising from reversible matter-field energy exchange at the level of a
single two-level system. Moreover, it was able to quantitatively expose the origins of the
new states |𝑃+⟩ and |𝑃−⟩ arising from this coupling. On the other hand, when dealing with
an ensemble of N two-level systems interacting with a confined mode (which is the case
of our experiments in this thesis), a many-body approach accounting for such ensemble is
required. For this reason, we adapt the so-called Dicke93–95 or Tavis-Cummings96
Hamiltonian which is given by:
ℋ𝑁 ≈ ℏ𝜔0 (−𝑁
2+ 𝑏†𝑏) + ℏ𝜔𝑎†𝑎 − 𝑖
√𝑁ℏΩ𝑅
2(𝑎†𝑏 − 𝑎𝑏†)
(2.39)
The system is here is treated as a giant quantum oscillator having an effective transition
dipole moment √𝑁𝑑. The new bosonic operator 𝑏 represents a mapping of the spin-
systems to bosonic systems41. We associate |𝐺, 1⟩ and |𝐷, 0⟩ to the ground and excited
states of the N-emitters system respectively, where the excitation is evenly distributed over
the N identical molecules (so-called Dicke’s states). Their expression is given by:
|𝐺, 1⟩ = |(𝑔, 𝑔, 𝑔, … ),1⟩ (2.40)
|𝐷, 0⟩ = 1
√𝑁∑|(𝑔, 𝑔, … 𝑒𝑖, … 𝑔),0⟩
𝑁
𝑖=1
(2.41)
By using the above expressions and solving for the eigenstates of ℋ𝑁, in the absence of
other photons interacting with the system, one can get the expression of the vacuum Rabi
splitting:
ℏΩ𝑅 = 2√𝑁𝑑𝜉0 (2.42)
It can be noticed that the collective Rabi splitting increases as a function of the
number of coupled emitters. Thus, we have so far validated this relationship by two distinct

Ch2. Theoretical Description of Strongly Coupled Systems
31
quantitative approaches (classical and quantum). We will also observe experimentally (in
Chapter 4) how this relationship has played the role for bringing our system from the weak
to the strong coupling regime. Moreover, we have considered the case where 𝑛 photons
interfere in the energy exchange process and consequently showed that the Rabi splitting
has a finite value even in the absence of photons. All the experiments present in this thesis
are performed in the vacuum Rabi splitting conditions.

32
Part II.
Results

Ch3. Strong Coupling on Plasmonic Structures
33
CHAPTER 3: Strong Coupling on Plasmonic Structures
In this chapter we investigate the strong coupling between surface plasmon polaritons
(SPPs) and organic molecules. An introduction to SPPs including its origins, dispersion
relation, and other properties are provided, followed by the basics of organic molecules
strong coupling with surface plasmon resonances. Experimental observation for the
molecule strong coupling with SPPs is presented in parallel with the methods and
procedures. Consequently, changes of surface properties under the coupling of a cyanine
dye with SPPs are investigated by studying its wetting properties. Contact angle
measurements are performed for the detection of such modifications, and discussed in
order to highlight the challenges of this experiment.
3.1- Surface Plasmon Polaritons
In metals, one can image the electrons of the conduction band as a sea inside which the
“fixed” nuclei or core atoms constituting the metallic bulk are immersed. On the surface
of a metal, the electrons are exposed to the interfacial dissymmetry unlike those in the
bulk.97 These surface electrons can undergo collective oscillations and experience EM
excitations called surface plasmon polaritons (SPPs). Hence SPPs are a mixture of EM
waves and surface charge oscillations (Figure 3.1a). SPPs can be confined in
subwavelength volumes, a feature that favors strong coupling effects.98,99

Ch3. Strong Coupling on Plasmonic Structures
34
The EM waves of SPPs are transverse magnetic (TM) modes in character, since the
electric field E and magnetic field H respectively within or perpendicularly to the plane of
incidence of light at the metal-dielectric interface, as illustrated in Figure 3.1a. The mixed
character of SPPs leads to the dispersion of the electric field confined at the interface, and
to an electric field in the z direction, which is maximum at the surface (z =0) and decreases
exponentially into the dielectric (metal) as z increases positively (negatively) as shown in
Figure 3.1b. The field in this case is said to be evanescent in z, and further explanation
about such evanescence behavior is discussed in later paragraphs.
Figure 3.1: (a) Schematic illustration of electromagnetic wave and surface charges at the metal-dielectric
interface. (b) The electric field evanescence along the z-axis and its corresponding penetration depth into the
dielectric (δd) and metal (δm) respectively.
The electric field due the surface plasmons 𝐸𝑆𝑃 is given by the following equation:
𝐸𝑆𝑃 = 𝐸0±𝑒𝑥𝑝[𝑖(𝑘𝑥. 𝑥 ± 𝑘𝑧 . 𝑧 − 𝜔𝑡)] (3.1)
where 𝐸0± is the magnitude of the electric field in the positive (+) and negative (-)
directions along the z-axis respectively. 𝑘𝑥 and 𝑘𝑧 represent the complex wave vectors of
the field in the 𝑥 and 𝑧 directions respectively, and 𝜔 is the frequency of plasma
oscillations. By inserting the equation (3.1) into Maxwell’s equations, one can obtain the
dispersion relation of SPPs, which is discussed next.
(a) (b)

Ch3. Strong Coupling on Plasmonic Structures
35
3.1.1- Dispersion of SPPs
The mixed character of the SPPs results in the dispersion of the confined electric
field at the metal-dielectric interface. The momentum of the surface plasmon modes (ℏ𝑘𝑆𝑃)
propagating along the interface (𝑘𝑆𝑃 = 𝑘𝑥) is larger than that of the free-propagating light
of the same frequency (𝑘0 = 2𝜋/𝜆). This can be explained quantitatively by applying
Maxwell’s equations with the appropriate boundary conditions to equation (3.1) which
eventually leads to the SPP dispersion relation100 as follows:
𝑘𝑆𝑃 = 𝑘0√휀𝑑휀𝑚
휀𝑑 + 휀𝑚 (3.2)
where 휀𝑑 and 휀𝑚 are the frequency dependent permittivity of the dielectric and the metal
respectively. The quantitative relationship between the permittivity values will determine
the dispersion.
Figure 3.2: The real (a) and imaginary part (b) of the permittivity of silver (Ag) and gold (Au) as a function
the wavelength λ. The values were calculated from the complex index of refraction taken from reference
[101].101
For SPP excitations to be possible, the permittivity of the metal which is a complex
number (휀𝑚 = 휀′𝑚 + 𝑖휀′′𝑚) should have a negative real part (휀𝑚′ ) with magnitude larger
than that of the dielectric material at the interface which is real and positive in most cases.
400 600 800 1000
-60
-40
-20
0
20
Au
Ag
'm
(nm)
400 600 800 1000
0
2
4
6
8
Au
Ag
'' m
(nm)
(a) (b)

Ch3. Strong Coupling on Plasmonic Structures
36
This condition can be fulfilled by metals, for instance Au and Ag as shown in Figure 3.2a.
The real part is negative for wavelengths above 400 nm and decreases rapidly starting from
500 nm. The imaginary part 휀′′𝑚 corresponds to the absorption (or dissipation) in the
metal. From Figure 3.2b, it can be deduced that Ag is a better choice of metal for the
generation of SPPs in the visible range between 400 nm and 600 nm, since it experiences
less dissipation allowing for longer propagation of SPPs.
It also follows from equation (3.2) that the SPP dispersion curve exhibits a
nonlinear characteristic. The dispersion of SPPs at an Ag-air interface in the energy range
1eV to 3.5 eV is shown in Figure 3.3 by substituting the permittivity data of Figure 3.2a
into equation (3.2).
Figure 3.3: Comparison of the dispersion curves of SPPs at an Ag-air interface (solid black curve) with that
of freely propagating light in the dielectric medium, in this case air (dash-dotted red curve).
At low energies, the dispersion curve of the SPPs is asymptotic to that of freely
propagating light (the red dash-dotted line in Figure 3.3), at these energies the SPPs
resemble grazing surface waves and are weakly bound to the interface. At higher energies,
10 20 30
1.0
1.5
2.0
2.5
3.0
3.5
(
ev)
Re (kSP
) / m-1

Ch3. Strong Coupling on Plasmonic Structures
37
SPPs have higher momentum than that of the feely propagating EM waves (𝑘𝑆𝑃 > 𝑘0) at
the same energy (Figure 3.3). This increase in momentum is associated with the strong
binding of the SPPs to the surface. The resulting momentum mismatch (∆𝑘) must be
compensated when generating SPPs by light or vice-versa. This can be experimentally
achieved by using different methods as will be discussed in later paragraphs.
3.1.2- The Evanescent Field of SPPs
In contrast to the propagating nature of SPPs along the surface, the interaction
between the surface charges and the electromagnetic field leads to an evanescent field in
the plane normal to the metal-dielectric interface which decays exponentially into each of
the metal and dielectric media as presented in Figure 3.1b.
Figure 3.4: The spatial extension of SPPs into the metal 𝛿𝑚 (a) and dielectric 𝛿𝑑 (b) media as calculated
from equation (3.3) for Au-air and Ag-air interfaces.
Due to the fact that 𝑘𝑆𝑃 > 𝑘0√휀𝑚,𝑑 , the wave vector of the normal evanescent
field 𝑘𝑧𝑚,𝑑 = √휀𝑚,𝑑(𝑘0)2 − (𝑘𝑆𝑃)2 is imaginary. In this case, the penetration depths in the
dielectric (𝛿𝑑 ) and the metal (𝛿𝑚) (a.k.a. skin depth) are defined by:
400 600 800 1000
0
200
400
600
800
1000
1200
Au
Ag
d (
nm
)
(nm)
400 600 800 1000
0
20
40
60
Au
Ag
m (
nm
)
(nm)
(a) (b)

Ch3. Strong Coupling on Plasmonic Structures
38
𝛿𝑚,𝑑 =1
|𝑘𝑧𝑚,𝑑|
(3.3)
at which the electric fields fall to 1/e. Equations from (3.3) are expressed as a function of
the metal and dielectric permittivity as follows:102
𝛿𝑚 =𝜆
2π|휀𝑑 + 휀𝑚
휀𝑚′2
|1/2
(3.4)
𝛿𝑑 =𝜆
2π|휀𝑑 + 휀′𝑚
휀𝑑2 |
1/2
(3.5)
The values from Figure 3.2a were used in equations (3.4) and (3.5) in order to calculate
the skin depth of the normal field inside the metal (Figure 3.4a) and dielectric (Figure 3.4b)
at each of the Au-air and Ag-air interface. It is obvious that the evanescent field has higher
penetration depth in the semi-infinite dielectric medium than that of the metal, and this is
due to the screening effect caused by the free charges in the metal. Nevertheless, in the
dielectric, the normal fields are concentrated in small volumes at the surface of metal with
values for 1/e on in the order of 𝜆/2 in the visible spectrum.
Figure 3.5: The penetration depth of SPPs normal field in PMMA at Au-PMMA (blue) and Ag-PMMA (red)
interfaces.
Ch3. Strong Coupling on Plasmonic Structures
39
To illustrate this point, Figure 3.5 shows the depth of the field inside a polymer
matrix Poly (methyl methacrylate), PMMA, the dielectric medium at the surface of Au and
Ag. As can be seen from Figure 3.5, the skin depth of the field at wavelengths between
550 nm and 600 nm is about 120 nm in Ag, and 100 nm in Au. These data correspond to
the experiment that will be discussed below in this chapter. In addition, it is clear that the
confined normal fields of SPPs provide a suitable environment for the observation of
strong light-molecule coupling.
3.1.3- The Excitation of SPPs
According to the dispersion relation given by equation (3.2), the momenta of SPPs
exceed that of freely propagating waves resulting in a momentum mismatch. The excitation
of SPPs requires conservation of momentum and can be achieved by compensation for the
missing momentum. There are several techniques to excite SPPs, such as Otto or
Kretschman-Raether prism coupling,103 leakage radiation spectroscopy,98,104 scattering
from a defect on the surface such as a subwavelength hole or slit,99–101,103,104 and periodic
corrugations on the surface of metals.105,106 The latter is also referred as diffraction grating,
and it is the technique we adapt in this thesis for the excitation of SPPs.
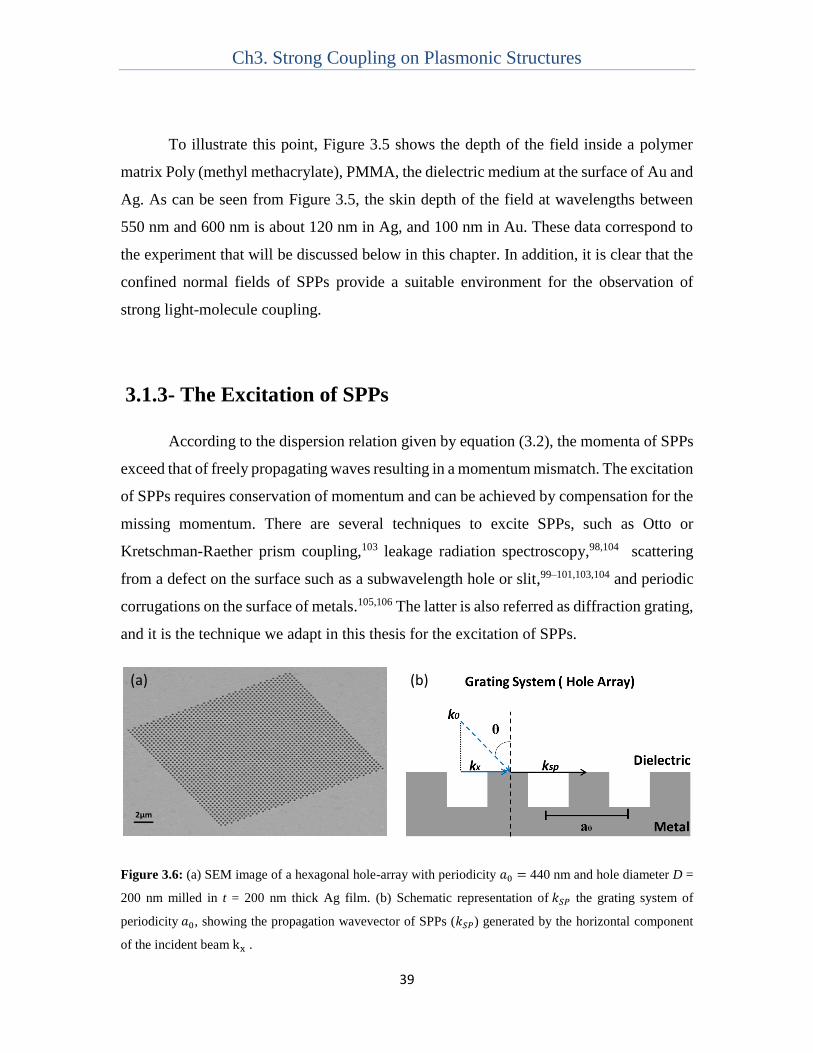
Figure 3.6: (a) SEM image of a hexagonal hole-array with periodicity 𝑎0 = 440 nm and hole diameter D =
200 nm milled in t = 200 nm thick Ag film. (b) Schematic representation of 𝑘𝑆𝑃 the grating system of
periodicity 𝑎0, showing the propagation wavevector of SPPs (𝑘𝑆𝑃) generated by the horizontal component
of the incident beam kx .
(a) (b)
2μm

Ch3. Strong Coupling on Plasmonic Structures
40
The diffraction grating that we use to excite SPPs is formed by milling a periodic
subwavelength array of cylindrical subwavelength holes through a metallic film (Figure
3.6a). SPPs are then generated when their momentum matches the momentum of the
incident photon via Bragg’s scattering according to the following equation:
|𝑘𝑆𝑃| = |𝑘𝑥 + 𝑖𝐺𝑥 + 𝑗𝐺𝑦| (3.5)
where 𝑘𝑆𝑃 is the surface plasmon wavevector, 𝑘𝑥 = (2𝜋/𝜆)𝑠𝑖𝑛𝜃 is the component of the
incident photon’s wavevector in the plane of the grating such that 𝜃 is the angle of
incidence (see Figure 3.6b). 𝐺𝑥 and 𝐺𝑦 (𝐺𝑥 = 𝐺𝑦 = 2𝜋/𝑎0) are the reciprocal lattice
vector for a square array with periodicity 𝑎0. The scattering order of the SPP modes is
denoted by (i, j) where i and j are integers.
Figure 3.7: Zero-order transmission spectra of hole-array (square periodicity) at normal incidence. The array
is milled on Ag film with periodicity 500 nm. The vertical solid and dashed lines correspond to the theoretical
(1, 0) SP resonances at the air-metal and glass-metal interfaces respectively (see text).
It is interesting to note that the extraordinary optical transmission through holes
having lateral dimensions less than half the wavelength of the incident beam exploits this
400 500 600 700 800 900
0
5
10
15
20
air
Tra
nsm
issio
n %
(nm)
glass

Ch3. Strong Coupling on Plasmonic Structures
41
momentum matching mechanism.107 This enhanced transmission results from the coupling
of the incident light with surface plasmon (SPP) modes, and is observed for specific
wavelengths (𝜆𝑆𝑃). At normal incidence, the relationship between the SPP modes and the
hole-array periodicity is given by the following equation:
𝜆𝑆𝑃 = 𝑎0
𝐶√
휀𝑑휀𝑚
휀𝑑 + 휀𝑚 (3.6)
where 𝐶(𝑖, 𝑗) is given by √i2 + j2 for square arrays and √4
3(i2 + j2 + ij) for hexagonal
arrays. The black curve in Figure 4.7c shows the transmission spectrum of a square hole-
array at normal incidence. The array has a periodicity of 500 nm, a hole diameter D of 260
nm, and is milled through a 200 nm Ag film deposited on glass substrate (more details
about sample preparation and data acquisition are explained in the experimental section
later in this chapter). The higher and lower energy peaks correspond to the SPPs at the Ag-
air and Ag-glass interfaces respectively. The predicted theoretical resonances of the (1,
0)a (air) and (1, 0)g (glass) modes (represented by the short vertical lines in Figure 3.7) are
in fact at transmission minima and located at a shorter wavelength than the experimental
peak. This is explained by Wood’s anomaly108 which occurs when a diffracted order
becomes tangent to the plane of the grating.109 Moreover, the peaks have a Fano-type
profile shape, which in addition to their displacement are the result of an interference effect
between the resonant (SPPs) contribution and the non-resonant continuum of directly
transmitted light.110

Ch3. Strong Coupling on Plasmonic Structures
42
Figure 3.8: (a) The zero-order transmission spectra at normal incidence of hexagonal hole-arrays with
varying periodicities (a0) from 280 nm to 460 nm milled in Ag film. The grey dashed arrow marks the peaks
of the (1, 0)g modes. (b) The wavelength of the (1, 0)g SPPs resonances as a function of the array periodicity.
The red line is a linear fit.
It is clear from equation (3.6) that the transmission maxima of the arrays scale with
the periodicity. Consequently, the plasmonic modes are periodic dispersive, and tuning
these modes to a desired frequency can be achieved by modifying the array’s periodicity
as presented in Figure 3.8. A set of hexagonal hole-arrays, with increasing periodicities
(by intervals of 20 nm), were milled through a 200 nm Ag film such that the diameter of
all the holes is set to 𝑎0/2. Their transmission spectra at normal incidence are presented in
Figure 3.8a where the linear dependence of the (1, 0)g resonances with the periodicity is
emphasized by the gray dashed arrow in Figure 3.8a, and linearly fitted by the red line in
Figure 3.8b.
400 500 600 700 800 900
0.0
0.2
0.4
0.6
0.8
1.0
1.2
1.4
1.6
1.8
a0= 280 nm
Tra
nsm
issio
n O
ffse
t
(nm)
a0= 460 nm
280 320 360 400 440 480
550
600
650
700
750
(
nm
)
a0 (nm)
(a) (b)

Ch3. Strong Coupling on Plasmonic Structures
43
Figure 3.9: (a) The zero-order transmission spectra as a function of incident angle of the light in TM mode.
Spectra were taken every 4° up to 16° for hexagonal array in Ag (a0 = 400 nm, hole diameter = 205 nm, film
thickness = 200 nm). (b) The energy-momentum dispersion of the same spectra present in (a) in addition to
their symmetric values for negative angles. The bright lines represent peaks and dark ones represent dips.
The dispersion of the SPP modes can also be seen in the angular dependence of the
spectra since 𝑘𝑥 = (2𝜋/𝜆)𝑠𝑖𝑛𝜃. For example, the transmission spectra were taken for a
hexagonal hole-array with periodicity 400 nm milled in Ag at varying angles from -16° to
+16° with intervals of 4° (for clarity, only those from 0° to +16° are presented in Figure
3.9a). The spectra were taken using TM polarized light. The peaks shift to lower energy
values (higher wavelength), change in intensity, and split into new peaks as the angle of
incidence increases (see Figure 3.9a). The energy-momentum dispersion, presented in
Figure 3.9b, was taken for all angles from -16° to +16°. The bright and dark areas represent
peaks and dips respectively.
500 600 700 800
0
3
6
9
12
15
18
Tra
nsm
issio
n %
(nm)
0
4
8
12
16
(a) (b)
2.5
1.5
-2 0 2
Transmission
En
ergy
(eV
)
kx (μm¯¹)
2

Ch3. Strong Coupling on Plasmonic Structures
44
Figure 3.10: The zero-order transmission spectra at normal incidence for a hexagonal hole-array (a0 = 380
nm) before (black curve) and after (red curve) the deposition of a 100 nm layer of PMMA on its surface.
Another consequence to the dispersion relation of SPPs (equation 3.6) is the
dependence of their modes on the index of the dielectric medium. Figure 3.10 shows the
transmission at normal incidence of a hexagonal array before and after the deposition of a
PMMA. The 200 nm diameter holes were milled in 200 nm Ag film deposited on a glass
substrate, with a lattice constant of 380 nm. The polymer is about 100 nm thick and has a
refractive index of 1.49 in the visible range. The (1,0)g transmission peak is significantly
boosted, and red shifted (by ca. 15 nm) upon the presence of the coated PMMA layer. This
is explained by the fact that the index of refraction at both surfaces of Ag is matched.111
The sensitivity of the SPP field to the index of refraction of the dielectric medium at the
interface illustrates the potential of such arrays in functioning as sensing nano-devices.
500 600 700 800 900
0
10
20
30
40
(nm)
Tra
nsm
issio
n %
Bare Ag surface
PMMA on Ag
400 500 600 700 800 900 1000
0
5
10
15
20
25
(nm)
No
rma
lize
d-t
o-A
rea
Tra
nsm
issio
n %
Hexagonal hole-array
Square hole-array

Ch3. Strong Coupling on Plasmonic Structures
45
Figure 3.11: The normal incidence transmission spectra of hexagonal hole-array with a0 = 440 nm (black
curve) and square hole-array with a0 = 380 nm (red curve). The diameter of holes in both cases is 140 nm.
The hole-arrays are milled in 200 nm thick silver film.
It can be noticed from equation (3.6) that hexagonal and square hole-arrays do not have
the same peak position for the same periodicity. This is due to the difference in the constant
factor C between the two geometries. Figure 3.11 represents the normalized-to-area
transmission spectra at normal incidence for a hexagonal and a square arrays with 440 nm
and 380 nm periodicities respectively, milled in the same Ag film, and both having the
same hole diameter D = 140 nm. Although both arrays have matching peaks at around 710
nm, the transmission intensity of the hexagonal array (the black curve in Figure 3.10) is ~
2 times larger.112 This can be explained by the number of degenerate modes which
corresponds to the each geometry.
Figure 3.12: The degenerated SPPs modes in the case of square (a) and hexagonal hole-array (b).

Ch3. Strong Coupling on Plasmonic Structures
46
The degeneracy of the SPPs modes supported by hole-arrays at normal incidence
can be retrieved from the factor C in equation (3.6). One can obtain the same value for C
in different configurations of the integers i and j. There are four degenerate modes for the
square array: (1, 0), (-1, 0), (0, 1), and (0, -1) and six for the hexagonal array: (1, 0), (-1,
0), (0, 1), (0, -1) (1, -1), and (-1, 1). As illustrated in Figure 3.11a and b, modes with same
energy propagate in different directions, and thus contributing to the degeneracy of the
mode. As a result, one can obtain higher strong coupling efficiency simply by modifying
the geometry of the array. In the next section, we will discuss strong coupling of organic
material with surface plasmons and implement such system to investigate bulk property
modifications which might arise from the SPP interaction with the material.
3.1.4- Strong Coupling on Plasmonic Arrays
As mentioned in the previous section, periodic arrays can excite selective SPP
modes which are confined to the surface of metal and evanescent into the dielectric
medium. Therefore, placing molecules having transitions that match with the confined SPP
modes, can lead to strong coupling and consequently the observation of normal mode
splitting. Next we provide experimental evidence of this by coupling merocyanine (MC)
dye molecules to plasmonic arrays and then investigate its effect on the surface properties
as we will see in the next section.
In order to achieve strong coupling of merocyanine (MC) dye molecules with
plasmonic resonances, we first mill a hexagonal hole-array (having periodicity of 250 nm
and hole diameter of 120 nm) in a 120 nm Ag film evaporated on a glass substrate. Then
we deposit a thin film of spiropyran (SPI) molecules embedded in a PMMA matrix on the
top of the milled array.

Ch3. Strong Coupling on Plasmonic Structures
47
Figure 3.13: (a) Normalized absorbance of MC with a maximum centered at 565 nm (dashed line). (b)
Transmission spectra at normal incidence for the same hole-array (a0 = 250 nm, D = 120 nm) at different
interfaces. The red curve represents the splitting of peaks due to the coupling of MC transition band (centered
at the vertical dashed line) with the plasmonic resonances.
Here, we recall from section 1-4 of the first chapter, that spiropyran (SPI) is a
transparent molecule in the visible spectrum that can be photisomerized to MC (which has
an absorbance peak at 565 nm as presented in Figure 3.13a) under UV irradiation, the
inverse process taking place under irradiation with visible light. This quality allows us to
reversibly switch from weak to strong coupling using the same sample and acquire
measurements under conditions where all other variables are constant.40 Figure 3.13b
shows the transmission spectra at normal incidence taken for the array in contact with air
(black curve), then after the deposition of SPI in PMMA film (green curve), and after the
photoisomeration to MC (red curve). The value of the Rabi frequency Ω𝑅 is calculated to
be 504 meV, which is in fact about 23% of the molecular transition energy (2.19 eV),
consequently putting the system in the ultra-strong coupling regime.40,45 Moreover, the
described system was then used for the investigation of strong coupling effects on the
wetting properties of a material as well detailed in the next section.
400 500 600 700 800 900
0.0
0.2
0.4
0.6
0.8
1.0
(nm)
Norm
alize
d-
Ab
so
rba
nce
400 500 600 700 800 900
0
2
4
6
8
10
12
14
(nm)
Tra
nsm
issio
n %
Ag-Air
Ag-MC
Ag-SPI
(a) (b)

Ch3. Strong Coupling on Plasmonic Structures
48
3.2- Wetting Properties Under Strong Coupling
In 2013, Hutchison et al. showed that the work-function of merocyanine (MC)
photochromic molecules could be altered by strong coupling with resonant SPPs.53 Such a
change would in turn lead to a change in the polarizability of the medium and thus of the
free surface energy. One way to test the existence of such a change is to measure the contact
angle at the interface between liquid droplets and the surface of a thin film of MC
molecules incorporated into the PMMA polymer matrix before and after their coupling to
resonant SPP modes (Figure 3.14).
The contact angle 𝜃𝑐 is a parameter which quantifies the wetting characteristics of
a liquid on a solid material.113 While all parameters affecting the contact angle between
two materials are fixed, any change in its value would indicate surface energy
modifications of either or both materials. In fact, contact angle variations due to charge
redistribution at the interface between the droplet and some insulators were observed in
the so-called “electro-wetting” phenomenon114,115 (which is achieved when potential
difference is applied between the droplet and a semiconductor). Nevertheless, observing
such changes would register a unique surface property refinement under strong coupling,
and thus entering a new realm of research in both fundamental surface science and
application.
Figure 3.14: Schematic illustration of the experiment for measuring the contact angle 𝜃𝑐, located between a
water droplet and the film containing MC molecules. The film is spin-coated at the top of hole-array.
Metal
Dielectric molecules
Water Droplet
Hole Array
θc
Glass substrate

Ch3. Strong Coupling on Plasmonic Structures
49
First, it is important to give a brief introduction to the contact angle, its significance,
and the factors affecting its values. In principle, the contact angle correlates with the
interaction factors coexisting between three interfaces: solid-liquid (SL), solid-gas (SG)
and gas-liquid (GL). Then, 𝜃𝑐 is defined by the angle between the solid-liquid interface
(which is also called the “contact line”)116 and the tangent to the liquid-gas interface, and
is given by Young’s equation117 as:
𝑐𝑜𝑠𝜃𝑐 = (𝛾𝑆𝐺 − 𝛾𝑆𝐿)
𝛾𝐿𝐺 (3.7)
where 𝛾𝑆𝐿 , 𝛾𝐿𝐺 , and 𝛾𝑆𝐺 represent the surface tension at the SL, LG, and SG interfaces
respectively as represented in Figure 3.15.
Figure 3.15: Schematic representation of the contact angle 𝜃𝑐 and the surface tension γ of the three
coexisting interfaces. (Figure adapted from Wikipedia).
However, droplets on extended surface domains can exhibit contact angles which
do not entirely satisfy the classical Young equation.118 Consequently two famous models
were proposed: the Wenzel model119 (equation 3.8 below) which suggests that the area of
contact at the SL interface is in fact larger than the actual area covered by the droplet due
to the surface roughness, and the Cassie-Baxter model120 (equation 3.9 below) which
involves finer roughness features. As a result, each model defines a new contact angle (the
Wenzel angle 𝜃𝑤 and the Cassie-Baxter angle 𝜃𝐶𝐵) in order to incorporate the surface
roughness factors (r and ϕ) at a microscopic scale as presented in equations (3.8) and (3.9).

Ch3. Strong Coupling on Plasmonic Structures
50
As will be discussed later, the surface roughness factor plays a major role in our
experiment.
𝑐𝑜𝑠𝜃𝑤 = 𝑟𝑐𝑜𝑠𝜃𝑐 (3.8)
𝑐𝑜𝑠𝜃𝐶𝐵 = 𝜙(𝑐𝑜𝑠𝜃𝑐 + 1) − 1 (3.9)
3.2.1- Experimental Section
In this section we describe the methods and tools utilized in the experiments
presented in this chapter. A special emphasis will be given to the Focused Ion Beam (FIB)
instrument which played a major role in the fabrication of samples utilized in this entire
thesis.
A- Focused Ion Beam (FIB):
Figure 3.16: Photo of FIB system (Auriga Zeiss). The most important components are indicated by the red
arrows.
Ion Beam Column
Electron Beam Column
Work Chamber
User interface
workstation

Ch3. Strong Coupling on Plasmonic Structures
51
The FIB is a technique which allows the execution of a set of state-of-the-art
nanofabrication and nanocharacterization processes. The FIB instrument is an ideal tool
for 3D high resolution imaging (in both ion beam and electron beam modes), patterning of
complex nanostructures (e.g. hole-arrays), maskless deposition of both metal and insulator
nano-sized materials, and detection of topographical and compositional information.
Modern FIB systems have wide applications in semiconductor industry and processing
environments121 as being successful tools for device preparation modification, mask
repairing, process control and failure analysis.122 This technology is becoming widely
spread in semiconductor research and more recently in biology for ultrastructural imaging
of biological systems.123
Our lab is equipped with a dual-beam Auriga FIB device form Zeiss (the one
present in Figure 3.16) which provides access to a number of sample preparation, imaging
and characterization techniques. The Ga ion beam column is mainly used for milling while
the electron beam column provides scanning electron microscopy (SEM) imaging. The
working chamber provides a high vacuum (~ 10-7 mbar). All the mentioned components
are controlled via the software system of the workstation.
The ion beam is generated by the extraction of Ga ions with a strong electric field.
The ions are then directed by the column towards the sample through a set of lenses and
aperture. High control over a set of discrete beam current values (ranging from 10 pA to
20 nA) allows a fine beam for high-resolution milling on sensitive samples and a heavy
beam for fast and rough milling. Inside the work chamber, an electrically controlled mobile
stage for the sample is used for sample positioning such that the same spot is
simultaneously detected by both the ion and electron beams. Once the latter condition is
achieved, the sample is then ready to receive the ion beam for milling. The removal of
sample material (for example the metal) is the result of its physical sputtering under the
action of the ion beam. The ion beam milling/deposition has a working field of view of
250 μm x 250 μm, but however such field of view can limit the milling resolution. For this
reason, arrays are milled no larger than 100 μm x 100 μm in order to obtain quality
structures (as we will see later in the next section).

Ch3. Strong Coupling on Plasmonic Structures
52
Figure 3.17: SEM images of cross-cuts created by the ion beam in: (a) Au film showing the cylindrical
shapes of the milled holes as indicated by the yellow arrows, (b) a 300 nm Ag film evaporated on a glass
substrate in order to measure the actual thickness of the film by imaging.
The features of the milled shapes (geometrical shape, sizes, periodicity, etc …) are
chosen and processed via the Nanopatterning and Visualization Engine software. The same
software allows the reproducibility of structuring which can be maintained by recording
the dwell time (time of exposure of a certain point on the sample to the ion beam), number
of dwelling repeats on the same spot, and dose (current per unit area). Figure 3.18 show a
cross-cut created at the surface of the samples under the action of the ion beam, a feature
which allows us to image the profile of the milled holes all the way through the metal depth
(Figure 3.18a) and to measure the actual thickness of metals (Figure 3.17b). Consequently,
all the SEM images (for instance Figure 3.6a), hole-arrays, and other structures presented
in this thesis were obtained by using the SEM mode of this FIB device.
B- Acquisition of Transmission Spectra:
The transmission spectra through the arrays were acquired using and inverted
microscope (Nikon TE 200), which is connected to a spectrometer (Acton SpectraPro 300i)
and a Si charged-coupled-device (CCD) (Princeton Instrument VersArray 1300B).
306 nm
Glass
Ag
(a) (b)

Ch3. Strong Coupling on Plasmonic Structures
53
Figure 3.18: Schematic representation of the acquisition of transmission spectra showing the passage of the
incident beam through the sample towards different parts of the system: the microscope objective, the
spectrometer, and finally the CCD camera.
For the measurements, the sample is aligned on the optical axis of a microscope
and illuminated with collimated light. Figure 3.18 shows how the transmitted light through
the microscope objective lens ( with magnification of 40x and a numerical aperture (NA)
of 0.6) enters the spectrometer through the entrance slit S, is reflected by the collimating
mirror M1 towards the diffraction grating D and finally reflected by the focusing mirror
M2 to be collected by the CDD camera. This measurement method was used for all the
transmission spectra of microscopic structures that are present in this thesis. Moreover, the
same microscope can be used in reflection mode where the incident beam arrives at the
sample from the objective side. Hence, we were able to use the same system for acquiring
reflection spectra and emission spectra as will be discussed in the next chapter.
Spectrometer
Sample
M1
M2
Collimated Incident Beam
S
D

Ch3. Strong Coupling on Plasmonic Structures
54
C- Contact Angle Measurements:
Contact angle measurements were carried out using a drop shape analyzer (DSA)
(DSA100 from KRÜSS). The instrument is mainly composed of a syringe, a stage, a
camera and light source which are all electronically controlled via computer software.
Figure 3.19: Schematic representation for the main parts of the drop shape analyser (DSA).
Figure 3.19 provides a simplified representation of the DSA set up including the
main parts required for measuring the contact angle: The sample is held on a horizontal
stage which can be moved manually in all 3-axes directions. A camera and a light source
are placed horizontally and opposite to each other in order to acquire an image for the drop
with a remarkable contrast compared with its background. The syringe is associated with
a tip customized to fit a set of needles of different shapes, sizes, and material to control the
size and the material of the desired drop. In our experiment we used NE50 needle with 5
µm internal diameter which has been designed for the manual dosing of small volumes
below the microliter range. The piston is controlled via software and has a pressing
resolution of 0.1 μL.

Ch3. Strong Coupling on Plasmonic Structures
55
The drop shape analysis (DSA) is an image based method for determining the
contact angle from the shadow image of a drop. There are several techniques for the
measurement of contact angle,113,124 but however, we adapt the static drop analysis
technique.
Figure 3.20: Image of a sessile drop taken by the DSA100 instrument with its fitted contour (shown in
green). The figure is reproduced from (https://www.kruss.de/services/education-theory/glossary/drop-shape-
analysis/)
In static drop analysis, a sessile drop (which is a free drop lying on the surface of a
solid) is gently placed onto our sample. An image of the drop is recorded with the help of
a camera and transferred to the drop shape analysis software (see Figure 3.20). Right after
the image is captured, a baseline highlighting the drop-solid interface is usually selected
manually. As a result a contour recognition (the green line in Figure 3.20) is initially
carried out based on a grey-scale analysis of the image. In the second step, a geometrical
model describing the drop shape is fitted to the contour and consequently giving
information about the measured contact angle with an estimated volume of the drop.
D- Sample Preparation:

Ch3. Strong Coupling on Plasmonic Structures
56
Ag films (120 nm thick) were deposited on top of a cleaned glass substrate using
an electron beam evaporator (Plassys ME 300) at optimized working pressure ~ 10-6 mbar
and at a deposition rate ~0.2 nm/s. Sub-wavelength hole arrays (similar to one in Figure
3.21) were milled by Auriga FIB system in the Ag films with varying periodicities (220
nm, 250 nm, 280 nm, and 320 nm) and hole size kept equal to half the periodicity. A
solution composed of a mixture of 1.5% in weight 1′,3′-Dihydro-1′,3′,3′-trimethyl-6-
nitrospiro[2H-1-benzopyran-2,2′-(2H)-indole (Aldrich) SPI, and 1.5% in weight of
Poly(methyl methacrylate) (average Mw ~120,000, Aldrich) PMMA in Toluene
(anhydrous, 99.8%, Aldrich) was prepared. The solution was then deposited on the top of
the arrays by spin coating. Photoisomerisation of SPI to MC was performed under the
irradiation of 365 nm near UV light using VL-6.LC (from VILBER) for durations of 10 to
15 minutes.
3.2.3- Results and Discussions
Figure 3.21: (a) SEM image of a ~ 1 mm2 large plasmonic array milled in 120 nm Ag film by using Auriga
FIB machine. The small squares are identical hexagonal hole-arrays (a0 = 250 nm, D = 120 nm) separated
by 5 μm from each side. (b) A captured photo for the sample carrying arrays different periodicities indicated
by the red arrows.
100 μm
(a)
(b)

Ch3. Strong Coupling on Plasmonic Structures
57
The volume of the water droplet to be placed on the plasmonic arrays is on the
order of 1 μL. Therefore, it required the milling of large hole-arrays (around 1mm2 in area)
in order to be able to accommodate the drop. This in fact is one of the major challenges for
the sample preparation. The formation of large hole-arrays with custom geometry,
periodicity, and hole-size is not straight forward (as it is the case of few tens of μm2 size
arrays) and it has been the interest of many nanofabrication studies due to their large
application potential such as for biosensors.125 Several techniques for the fabrication of
large nano-arrays have been reported such as electron beam lithography,126 nanoimprint
lithography,127 reactive ion etching (after lithography process),128 and monolayer
formation of self-assembled colloids over large areas.129
Here, we succeeded in the fabrication of large area hole-arrays by FIB. Figure 3.21a
shows an SEM image to one of such arrays milled in 120 nm Ag film. The large overall
square is an assembly of smaller squares which are separated by ~ 5 μm (vertically and
horizontally). Each small square is a (100 μm x 100 μm) hole-array with hexagonal
geometry (similar to the one present in Figure 3.6a), having periodicity of 250 nm and a
hole-size of 120 nm. Such arrays were milled with different periodicities on the same
sample as presented in Figure 3.21b. The transmission spectrum through this periodic
structure, with and without the SPI/MC layer, is presented in Figure 3.13b.

Ch3. Strong Coupling on Plasmonic Structures
58
Figure 3.22: (a) The value of contact angle measured for a set of 5 different drops on the surface of (b) SPI
before and (c) after irradiation with UV.
The first experiment for the contact angle measurement was conducted to highlight
the difference in the surface tension between water droplets on bare surfaces of SPI and
MC films, i.e. in the absence of strong coupling. To do so, 2% in weight SPI molecules
mixed in Toluene were spin-coated on the top of an Ag film, deposited on a glass substrate,
forming a 110 nm thick layer. Five distinct drops of Milli-Q water having different
volumes were placed on the SPI layer and static drop analysis to measure the contact angle
was performed. The same procedure was followed after the photoisomeration of SPI to
MC by UV irradiation. The graph in Figure 3.22a displays the values of the measured
contact angle for the 5 different drops on each of the bare molecule surfaces (SPI in blue
and MC in red). The contact angle values vary between 94° and 96.5° on SPI, while they
vary between 86° and 88° on MC. The contact angle difference (𝛥𝜃𝑐 = 𝜃𝑐𝑆𝑃𝐼 − 𝜃𝑐
𝑀𝐶) was
calculated, and it averages ~8.5° (with an error range of ±1.3°). It can be concluded that
MC has higher surface tension than SPI, and this is typical because MC has higher ground
state energy as compared to that of SPI.68 Contact angle variations for SPI molecules,
before and after photo switching, on various surface textures were measured by other
groups, and they reported similar 𝛥𝜃𝑐.130–132 Figures 3.22b and 3.22c are camera shots
taken for the drops by the DSA, and they display the drop shape on the surfaces of SPI and
MC respectively.

Ch3. Strong Coupling on Plasmonic Structures
59
Figure 3.23: (a) The value of contact angle measured for a set of 5 different drops on the surface of (b)
PMMA mixed with SPI before and (c) after irradiation with UV.
The same experiment described above was repeated, but this time when the SPI
molecules are embedded in a PMMA polymer matrix (as described in the experimental
section). The PMMA film ensures identical extended surface domains before and after the
photoisermation process, and thus provides control over external factors which contact
angle. The results presented in Figure 3.23a show measured contact angle values for 5
different drops placed on the surface of PMMA-SPI film before and after switching to MC.
It is clear that small or no variation exist within the same molecule, and that the difference
in contact angle Δθc has dropped to ~1.7°. However, the major aim is to see a larger contact
angle difference once the experiment is performed on the MC molecules coupled on the
resonant plasmonic structures. Figures 3.23b and 2.23c provide a visual confirmation to
the numerical results, where the spherical curvature of the water droplets are observed to
be very similar, (unlike those present in Figure 3.22 a and b).
Table 3.1: Variations in the contact angle measurements on plasmonic structures
Similarly, a set of measurements for the contact angle were acquired on plasmonic
structures. Now that the large hole-arrays were deposited by a layer of SPI molecules
embedded in PMMA matrix, small drops (~0.5μL) of Milli-Q water were placed on these
structures and the contact angle was measured before and after the UV irradiation of SPI.
The experiment was repeated for several times by placing the droplets above on resonance
and off resonance plasmonic arrays (independently) and the contact angle difference
𝛥𝜃𝑐 = 𝜃𝑐𝑆𝑃𝐼 − 𝜃𝑐
𝑀𝐶 was recorded (as presented in Table 3.1). It can be noticed from Table

Ch3. Strong Coupling on Plasmonic Structures
60
3.1 that the values were inconsistent, and the negative values are obtained when 𝜃𝑐𝑆𝑃𝐼 <
𝜃𝑐𝑀𝐶 .
Figure 3.24: SEM image on a section of the large array showing the mark left by the water droplet (having
an area of ~ 56515 μm2) after its evaporation.
It was observed that the water droplets were leaving an impact on the surface
structures as can be seen in Figure 3.24. These features were later realized to occur very
rapidly leading to modifications in the surface structure and consequently the contact
angle. In fact, this explains the dispersed 𝛥𝜃𝑐 values presented in Table 1. In fact, we later
observed that it was leaving the same impact on the surface of metals even without the
presence of polymer (PMMA in our case). In order to better understand this behavior, a
drop of water was randomly placed on the surface of Ag film and the time evolution of
contact angle was recorded for the same drop and showed remarkable changes within
periods ~10’s of seconds. In fact, Ag surfaces are known for their reactivity with ambient
environment,133 and it was shown that water interaction with oxidized Ag surface enhances
its surface restructuring.134 For this reason, the phenomenon (impact of water droplets) was
investigated with Au, which is assumed to be less reactive, to test whether water causes

Ch3. Strong Coupling on Plasmonic Structures
61
surface restructuring in the absence of adsorbents. For this, Milli-Q water drops were
placed on the surface of a Au film and were let to evaporate in normal laboratory
conditions. After the droplet evaporation, similar features to those present in Figure 3.24
were observed. It was still unclear whether these features were surface restructuring or
some contaminants from water.
Thereby, a water distillation setup was assembled and triple distillation of the Milli-
Q water was performed in order to ensure the purity of the water droplets. On the other
hand, 300 nm Au film was deposited by thermal evaporation at a low rate (~0.1 nm/s) on
a quartz slide. Droplets of the triple distilled water were placed via well cleaned glass
pipette, and the water droplets were left to evaporate. The experiment was carried out this
time in a clean room in order to minimize the interaction with external contaminants.
Figure 3.25: Captured photo for the Au sample showing the features (indicated by the red arrows) left after
the evaporation of triple distilled water droplets.
The photo in Figure 3.25 was captured after the water droplets have evaporated. As
indicated by the red arrows, features were formed can be clearly observed by the naked
eye.

Ch3. Strong Coupling on Plasmonic Structures
62
Figure 3.26: SEM image of the feature present in Figure 3.25 due to the water droplet. (a) The whole feature
showing a contrast at the circumference. (b) A magnified SEM image of the area pointed by yellow arrow in
(a).
The sample in Figure 3.25 was then imaged by SEM with different magnifications.
Figure 3.26 a and b show structures having tree-like branches shapes on the surface of Au.
At a certain magnification, one can also observe the circumference of the impact of the
droplet inside which the features appear (see Figure 3.26 a and b).
Figure 3.27: SEM images: (a) at 23K times magnification and shows the cross cut at the features. A clear
contrast between the original Au film and the features is pointed by the yellow arrow. (b) At 90K times
magnification, showing the area inside the yellow circle of (a) and highlighting the roughness modification
to the surface imposed by the features.
A cross cut was made by FIB and subsequent SEM imaging reveals a contrast
between the original gold film cross-section and that of the new features (as indicated by
the yellow arrow in Figure 3.27a). It can be then concluded that the features and Au are of

Ch3. Strong Coupling on Plasmonic Structures
63
different material. Moreover, those impurities residing at the surface of Au, form
roughness of different sizes. For instance from Figure 3.27a, the large islands have
roughness in the order of 100’s of nm, while in Figure 3.27b (which a magnified image to
the area in yellow circle of Figure 3.27a) they are in the order of 10’s of nm. These values
were confirmed by atomic force microscopy (AFM) measurements.
The final stage of the characterization of features residing on the surface of metals
during their evaporation is the material identification by energy dispersive x-ray (EDX)
spectroscopy.

Ch3. Strong Coupling on Plasmonic Structures
64
Figure 3.28: EDX analysis spectra showing the elemental analysis on sample of Figure 3.25 (a) when
probing the features (b) when probing the Au surface away from features. The blue curve represents the
background signal.
EDX analysis was performed on the sample of Figure 3.25 targeting both the new
surface features and the untouched Au surface. The EDX spectra indicate the presence of
two new elements (Na and Cl) besides Au (see Figure 3.28a). These elements were
completely absent when probing the Au surface away from the features, as can be seen in
Figure 3.28b. It can be concluded that those new elements came most likely from the
environment and could possibly be collected from ambient air despite the triple distillation
of water. This result shows again how difficult it is to make accurate measurements of
wetting.
3.3- Conclusions
In this chapter, we show how SPPs can be excited by using hole-array structures
milled on metal surfaces and demonstrated how hybrid light-matter states with large Rabi
splitting achieved on such nanostructures of higher symmetry indicating the importance of
SP mode degeneracy. Moreover, we made an attempt to investigate surface energy
modifications under strong coupling of MC electronic excitations with plasmonic
resonances. A brief introduction to measuring surface interactions via the contact angle
was provided emphasizing on the effect of surface roughness.
After much effort, we could not demonstrate that the contact angle of the water is
modified at the water-SPI and water-MC interfaces after strong coupling. Indeed, these
measurements proved very difficult because we found that the water droplets leave a
significant impact on the structure of the solid film, resulting in immediate changes in the
values of the contact angle. After characterization of these structural modifications using
scanning electron microscopy (SEM), atomic force microscopy (AFM) and electronic X-
ray diffraction (EDX) analysis, we have been able to conclude that the evaporation of the

Ch3. Strong Coupling on Plasmonic Structures
65
droplets affects the roughness of the surface of the polymeric film and could also leave
impurities locally (such as Cl and Na) even when we use purified water. These changes
not only affect the value of the contact angle for a single measurement but also make it
very difficult to perform further measurements on the same set of holes and to ensure
reproducibility of the results.

Ch4. Strong Coupling in Liquid Fabry-Perot Nanocavities
66
CHAPTER 4: Strong Coupling in Liquid Fabry-Perot Nanocavities
It was discussed briefly in Chapter 1 that the strong coupling conditions could be
experimentally achieved by different methods. In the previous chapter, we used periodic
structures on metals to excite surface plasmon resonances. Due to their half-open character,
such systems were ideal for our study of surface properties under strong coupling as it was
for other preceding experiments.47,53 In this chapter, the we exploit the Fabry-Perot (FP)
cavity as another useful method for the investigation of molecular dynamics under strong
coupling.
Firstly, the physics of FP cavities will be introduced in terms of multiple interferences.
Then, a detailed explanation will follow outlining the fabrication of FP nanocavities in
which solutions can be introduced such that light-molecule interactions can be studied at
will in the liquid phase. These nano-fluidic cavities are fully characterized and put to use
to achieve the strong coupling of electronic transitions of various dyes in solution.
Particularly modifications to the photo-physical properties of a dissolved dye, chlorin e6,
upon strong coupling to the optical modes of our cavities are presented and analyzed. Some
paragraphs in this chapter are inspired by a submitted manuscript.135
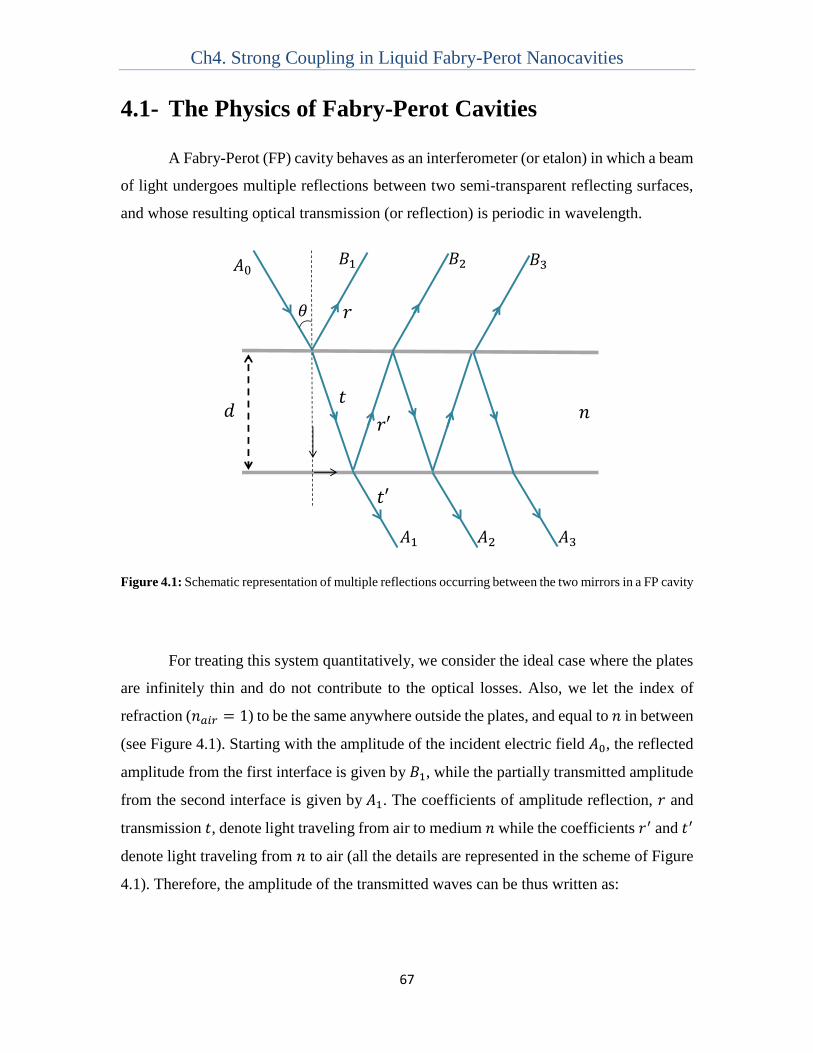
Ch4. Strong Coupling in Liquid Fabry-Perot Nanocavities
67
4.1- The Physics of Fabry-Perot Cavities
A Fabry-Perot (FP) cavity behaves as an interferometer (or etalon) in which a beam
of light undergoes multiple reflections between two semi-transparent reflecting surfaces,
and whose resulting optical transmission (or reflection) is periodic in wavelength.
Figure 4.1: Schematic representation of multiple reflections occurring between the two mirrors in a FP cavity
For treating this system quantitatively, we consider the ideal case where the plates
are infinitely thin and do not contribute to the optical losses. Also, we let the index of
refraction (𝑛𝑎𝑖𝑟 = 1) to be the same anywhere outside the plates, and equal to 𝑛 in between
(see Figure 4.1). Starting with the amplitude of the incident electric field 𝐴0, the reflected
amplitude from the first interface is given by 𝐵1, while the partially transmitted amplitude
from the second interface is given by 𝐴1. The coefficients of amplitude reflection, 𝑟 and
transmission 𝑡, denote light traveling from air to medium 𝑛 while the coefficients 𝑟′ and 𝑡′
denote light traveling from 𝑛 to air (all the details are represented in the scheme of Figure
4.1). Therefore, the amplitude of the transmitted waves can be thus written as:

Ch4. Strong Coupling in Liquid Fabry-Perot Nanocavities
68
𝐴1 = 𝑡 𝑡′𝐴0; 𝐴2 = 𝑡 𝑡′𝑟′2𝑒𝑖𝛿𝐴0; 𝐴3 = 𝑡 𝑡′𝑟′4𝑒2𝑖𝛿𝐴0; … (4.1)
The multiple output beams differ in phase due to the different path lengths traversed by
each of the beams. The optical phase acquired by the light on one round trip between the
plates is given by:
𝛿 = 4𝜋 𝑛 𝑑 𝑐𝑜𝑠𝜃
𝜆 (4.2)
where 𝑑 is the distance between the two plates, 𝜃 is the angle of incidence, and 𝜆 is the
wavelength of the incident beam. Now, the sum of transmitted wave amplitudes 𝐴𝑇
becomes:
𝐴𝑇 = 𝑡 𝑡′𝐴0 (1 + 𝑟′2𝑒𝑖𝛿 + 𝑟′4
𝑒2𝑖𝛿 + ⋯ ) = 𝑡 𝑡′
1 − 𝑟𝑟′2𝑒𝑖𝛿𝐴0 (4.3)
The power transmission 𝑇 = 𝐼𝑡 𝐼0⁄ will be expressed in terms of equation (4.3) as:
𝑇 = 𝐼𝑡
𝐼0=
𝐴𝑇𝐴𝑇∗
𝐴0𝐴0∗ =
(𝑡 𝑡′)2
(1 − 𝑟 𝑟′)2 + 4√𝑟 𝑟′𝑠𝑖𝑛2(𝛿 2⁄ ) (4.4)
Since we consider a lossless system with identical surfaces, then: 𝑟 = 𝑟′ and 𝑟2 + 𝑡2 = 1.
Thus equation (4.4) simplifies to:
𝑇 = 1
1 + 𝐹𝑠𝑖𝑛2(𝛿 2⁄ ) (4.5)
such that the factor
𝐹 = 4𝑅
(1 − 𝑅)2 (4.6)

Ch4. Strong Coupling in Liquid Fabry-Perot Nanocavities
69
is known as the finesse coefficient of the cavity and 𝑅 = (𝑟𝑟′)2 is the reflectance of the
mirrors. The fraction [1 + 𝐹𝑠𝑖𝑛2(𝛿 2⁄ )]−1 of equation (4.5) is called the Airy function and
it shows strong dependence on the value 𝑅. The same equation imposes that the condition
of a transmission maximum is 𝛿 2⁄ = 𝑚𝜋 where 𝑚 is an integer and represents the optical
mode order of the cavity.
Figure 4.2: Airy function [1 + 𝐹𝑠𝑖𝑛2(𝛿 2⁄ )]−1 curves with different values of reflectance R of mirror.
The Airy function is plotted in Figure 4.2 for different 𝑅 values. It can be noticed
that the transmission peaks are broad and indistinct for mirrors with weak reflections (for
instance 𝑅 = 0.2), whereas they appear to be large and sharp with high Q-factor in the case
when 𝑅 approaches unity (see Figure 4.2). Such large reflectivity values (0.7-0.9) could be
obtained in the visible range for Ag mirrors of thickness ~ 30nm.
4.2- Electronic Light-Matter Strong Coupling in Liquid
Fabry-Perot Nanocavities
0.5 1.0 1.5 2.0 2.5
0.0
0.2
0.4
0.6
0.8
1.0
Tra
nsm
issio
n
R = 0.2
R = 0.4
R = 0.7
R = 0.9

Ch4. Strong Coupling in Liquid Fabry-Perot Nanocavities
70
In the presence of the growing interest in studying strongly coupled materials (as
detailed in Chapter 1), there is a need to explore SC of molecules in liquid solutions since
that it is the natural condition of many molecular processes. Experiments in liquid solutions
have only been achieved for vibrational strong coupling (VSC) which is facilitated by the
fact that the vibrational modes are in the IR which allows one to use micro-fluidic Fabry-
Perot (FP) cavities (e.g. spacing 1~10 µm).42,45,74–77,136,137 In contrast, electronic strong
coupling (ESC) of molecules in the liquid form has not been reported yet for the simple
reason that the cavity length in the visible is on the order of 100 nm which is technically
very challenging. Among other things, the nanofluidic FP cavity mirrors (Figure 4.3a) need
to be uniformly flat on a scale much smaller than the cavity length and the cavity must be
accessible to the solution.
Figure 4.3: (a) Schematic illustration of the amplitude of the first and second Fabry−Perot (FP) cavity modes
confined between two metallic mirrors. (b) Absorbance and emission spectra of Chlorin e6 in DMF and its
molecular structure.
In this chapter, we explain the fabrication of nanofluidic FP cavities tunable over a
wide range of visible wavelengths which can be filled with liquids. To illustrate the
potential of such cavities we study the photophysical properties of a chlorophyll analog,
Chlorin e6 (Ce6) shown in Figure 4.3b, in both the weak and strong coupling regimes. In
particular, we compare the emission quantum yield and the radiative rate constant as a
(a)
Wavelength (nm)
(b)

Ch4. Strong Coupling in Liquid Fabry-Perot Nanocavities
71
function of detuning in both regimes which highlights the distinct features of the strong
coupling condition.
Chlorin e6 has a sharp absorption peak (Q-band) at 664 nm and fluoresces with a
small Stoke-shift at 674 nm (Figure 4.3b). In addition to these spectral features which are
very suitable for studying light-matter interactions, it is characterized by high solubility in
many solvents without forming aggregates.138 In dilute conditions, it has a reasonably long
fluorescence lifetime (4.4 ns) and a good emission quantum yield (~15% in ethanol).139,140
These characteristics make Ce6 a good candidate among organic molecules for exploring
liquid phase photoemission and relaxation processes under both strong and weak coupling
regimes.
4.2.1- Fabrication of Fabry-Perot Liquid Nanocavities
To prepare the nanofluidic FP cavity having two parallel metallic mirrors separated
by a distance d on the order of 100 nm, we developed the following technique. The sample
preparation starts by evaporating a 50 nm thick Ag layer on a 2.5 cm x 2.5 cm glass
substrate. The sample is then introduced in a Zeiss Auriga Focused Ion Beam (FIB)
apparatus and a ca. 10-20 μm x 120 μm rectangular area is milled through the Ag layer
and into the glass substrate to create the nanofluidic channel (Figure 4.4a and b). After the
milling, another 30 nm of Ag is evaporated on the substrate to act as the cavity’s bottom
mirror. Another identical glass substrate with an Ag layer acting as the cavity’s top mirror
is also prepared. Then the two substrates are cold-welded by high pressure (~1.6 tons/cm2)
using a press normally employed for preparing pellets for IR measurements (Figure 4.4a).
Cold-welding has already been used successfully to make solid state cavities.141,142

Ch4. Strong Coupling in Liquid Fabry-Perot Nanocavities
72
Figure 4.4: (a) The fabrication stages of nanocavities of thickness d, starting by milling through the Ag layer
and glass substrate (stage 1), then Ag evaporation on the milled channels (stage 2) and finally cold-welding
both substrates under high pressure (stage 3). (b) SEM image in top view of the upper part of a rectangle
milled through 50 nm Ag and into the glass. A light shadow indicated by the yellow arrow shows milling
also through the glass substrate. (c) The milled channel depth profile acquired by AFM along the width of
the rectangle in (b).
A first set of cavities with increasing depth were milled along a line in the middle
of the sample, connected between each other by a very small overlap area (emphasized by
the yellow arrow in Figure 4.5c) resulting in a few millimeters long channel as shown in
Figure 4.5a with and without solvent. The thickness of the top mirror layer depends on the
required measurements. For instance, we used a 30 nm top Ag mirror when probing the
cavities in transmission mode (as illustrated in Figure 4.5b) and 200 nm when
characterizing the spectra in reflection mode (as we will see later in this Chapter). It is
important to note that a 2 nm film of Cr layer is always present between the glass substrate
and the Ag film in order to ensure strong adhesion. Finally, to introduce the molecules into
the nanofluidic channels, the sample is simply dipped into the liquid solution which is
SEM Top View Image of Channel
0 2 4 6 8 10 12
0
20
40
60
80
100
120
140
160
Dep
th
(nm
)
Lateral Distance (m)
AFM Profile of Channel
(b) (c)
GlassAg
ZZ
Stage 1 Stage 2 Stage 3(a)

Ch4. Strong Coupling in Liquid Fabry-Perot Nanocavities
73
drawn in by capillary force. We have verified that many solvents including water wet the
channels and therefore are spontaneously pulled in.
Figure 4.5: (a) Optical micrographs showing white light transmission through the nanofluidic FP cavities
before and after filling them with toluene. The colored rectangles represent FP cavities of varying
thicknesses, with the corresponding wavelength shift of the confined light mode. (b) Schematic diagram
illustrating in 3D the final shape of the cavity and the transmission spectra obtained in (a). (c) SEM image
in top view showing the milled channels through glass, and emphasizing the small overlap connections
(indicated by the yellow arrows). (d) Transmission spectra through empty nanocavities, showing the photonic
mode resonance as a function of FIB milling repeats.
The thickness of the nanofluidic FP cavity was controlled by milling different
depths in the bottom substrate. High control over the cavity mode resonance is achieved
by programming a large number of repeats on the Zeiss Auriga FIB to mill a given
thickness. This enables very flat surfaces (less than a few nm variation over 5 m) on
Fabry-Perot Nanocavity Transmission
400 500 600 700 800 900
0
20
40
60
Tra
nsm
issio
n %
(nm)
10000
12000
14000
16000
18000
20000
22000
24000
25000
Milling Parameter
(a)
z
(c) (d)
(b)
15μm
120μm
z

Ch4. Strong Coupling in Liquid Fabry-Perot Nanocavities
74
which the mirror can then be deposited (see Figure 4.4c). In Figure 4.5d, the transmission
resonance of various channels is shown as a function of ion beam milling repeats. Under
our milling conditions, the peak position moves by ca. 20 nm for every 1000 repeats
reflecting the change in FP path length d as also can be seen in the colors of Figure 4.5a.
In fact, this provides us with high control (up to 1nm) over the peak position. The color
changes once again upon introduction of a solvent (here toluene) due to the increased
medium refractive index inside the channel. The Q-factor of such cavities ranges between
20 and 60, depending on the type of metal (e.g. the imaginary part of the dielectric
constant) and the mode used. The ability to mill FP nanocavities of 100s of microns lateral
extent with desired shape, and with very high control of cavity thickness, is an outstanding
point of our fabrication method, making these nanofluidic structures ideal for studying
molecules in solutions in the weak and strong coupling regimes.
4.2.2- Experimental Section
A- Sample Preparation:
BK7 glass substrates (25 x 25 mm) were subjected to standard cleaning procedures:
sonicated in Helmanex solution (1% in MilliQ water), then rinsed with water and sonicated
for 1 h in pure ethanol before being rinsed several times with pure water. The glass
substrates were then dried in an oven. Layers of Cr (2 nm) and Ag (50 nm) were deposited
consecutively on top of a cleaned glass substrate using an electron beam evaporator
(Plassys ME 300) at optimized working pressure ~ 10-6 mbar and at a deposition rate of
0.2 nm/s. Channels were milled using a Zeiss Auriga FIB system. The ion beam current
was fixed at 16nA and the dwell time to 1 μs. Only the number of milling repeats is varied
to control the cavity thickness d. The milling removes the Ag layer and the desired depth
in the glass (Figure 4.4b). Individual cavities were milled, for instance, as 12 μm x 120 μm
rectangles, and a set of rectangles of various depths could be milled along a straight line
forming a channel. Next, 30 nm of Ag was deposited over the milled sample to form the
bottom mirror. Finally, another glass substrate with a 200 nm thick Ag layer was cold-

Ch4. Strong Coupling in Liquid Fabry-Perot Nanocavities
75
welded to the milled sample under high pressure (~1.6 tons/cm2) using Specac Manual
Hydraulic Pellet Press device.
Figure 4.6: Schematic representation of the top view of samples used for our emission experiments. Each
cavity is represented by a colored line based on its optical mode energy detuning relative to the molecule’s
absorption transition at 664 nm (i.e. cavities with photonic modes in neat DMF at 567 nm (light blue), 631
nm (blue), 665 nm (black), 678 nm (orange), and 733 nm (red)). The areas with neither top nor bottom
mirror that act as reservoirs for liquid to enter the cavity are labelled ‘glass’. The green horizontal rectangle
is an area with only one mirror.
For practical reasons, we also prepared nanofluidic FP cavities of single optical
path length in parallel as illustrated in Figure 4.6. Here, both ends of the substrate (blue
area in Figure 4.6) were masked during metal evaporation to form a metal free space acting
as a reservoir for the liquid to fill the channels. In addition, a mask was placed over parts
of the milled channels (illustrated by the green rectangle in Figure 4.6) before evaporating
the bottom mirror to create in each channel one-sided mirror areas which act as a reference
for the optical characterization of the bare molecule.
B- Solution:
The solutions were prepared by dissolving Chlorin e6 (used as purchased from Frontier
Scientific) in N,N-dimethylformamide (DMF) solvent (used as purchased from Sigma
Aldrich ≥ 99.8%). The solution was then placed in a small beaker and the samples with the

Ch4. Strong Coupling in Liquid Fabry-Perot Nanocavities
76
nanocavities were dipped into the solution for ~ 1 hour to enable the liquid to fully enter
the cavities.
C- Reflection and Emission Dispersion Measurements
Figure 4.7: Detection scheme of the home built set up used for dispersion measurements showing the
passage of light coming out of the sample through main parts of the set up.
A home built microscopy setup was used for the dispersive reflection and emission
spectra. It consists of a microscope lens that focuses a broad band white light source (DH-
2000-BAL, Ocean Optics) onto the cavity of interest. The reflected light was imaged on
the slit of a monochromator (Princeton Instruments), couple to a charge-coupled device
(CCD, Pixis, Princeton Instruments) detector to register the spectra. By using a Fourier
lens, the angle resolved reflection spectra could be obtained. The reflection dispersion
spectra were acquired for each cavity thickness, for both solutions of high concentration
(strong coupling regime) and low concentration (weak coupling regime). The same
microscopy set-up was used to obtain the angle resolved emission from each cavity. The
system was excited at 532 nm using a continuous wave diode laser (Oxxius) with a focal
spot of ~ 1.2 μm diameter and ~160 μW power. It should be noted the emission properties
are independent of excitation wavelength.
Sample Microscope
Objective
Converging
Lens Aperture Fourier Lens CCD

Ch4. Strong Coupling in Liquid Fabry-Perot Nanocavities
77
D- Emission Spectra Measurements at Normal Incidence
The emission spectra of the samples were collected in reflection mode using a Nikon
Eclipse TE200 light microscope (illustrated in Figure 3.18 in Chapter 3), with a Nikon 40X
objective having a 0.6 numerical aperture (NA) and 3.7-2.7 mm working distance (WD).
After focusing at a point in the filled cavity, the system was excited in epi configuration
by UV light produced by a mercury short arc HBO lamp (OSRAM). The excitation light
was filtered by a Semrock bandpass filter centered at 365 nm. The emitted light from the
cavities was collected by a spectrograph/CCD camera (Acton SP-300i/Roper ST133)
coupled to the microscope. The emission spectrum was also recorded from the same
channels in a region with only one mirror, the latter representing emission from the bare
molecules. Emission spectra recorded for different cavity thicknesses recorded at normal
incidence are shown in Figure 4.8.
Figure 4.8: Emission spectra of Ce6 in DMF in cavities obtained at normal incidence for (a) high
concentration (strong coupling regime) and (b) low concentration (weak coupling regime) and for different
cavity detunings (indicated by the cavity peak wavelengths in neat DMF, 665 nm the resonant case). The
inset in (a) is the emission spectrum of Ce6 at high concentration taken from a one-mirror channel.
450 500 550 600 650 700 750 800 850
0
1000
2000
3000
4000
5000
nm
Em
issio
n In
ten
sity
567 nm
631 nm
665 nm
678 nm
733 nm
Strong Coupling
450 500 550 600 650 700 750 800 850
0
5000
10000
15000
20000
nm
Weak Coupling
Em
issio
n In
ten
sity
567 nm
631 nm
665 nm
678 nm
733 nm
450 500 550 600 650 700 750 800 850
0,0
5,0k
10,0k
nm
(a) (b)

Ch4. Strong Coupling in Liquid Fabry-Perot Nanocavities
78
As can be seen in Figure 4.8a, when the cavity is strongly red-detuned a large emission
peak appears. This is especially apparent at high concentrations of Ce6 (0.18 M) used to
achieve strong coupling and is attributed to excimer emission, peaking outside the cavity
at ca. 745 nm (inset, Figure 4.8a). The fluorescence lifetime of the emission at 740 nm is
longer than that observed for monomeric Ce6, while the excitation spectrum of this
emission matches that of monomeric Ce6, perfectly in keeping with the emission properties
of an excimer. This red-shifted emission >740 nm was thus excluded from the quantum
yield determinations.
E- Lifetime Measurements
The emission lifetimes were measured using the time-correlated single photon
counting technique (TCSPC) on a Nikon Eclipse Ti confocal microscope coupled to a
PicoQuant PicoHarp 300 pulse correlator. A 40X objective with 0.6 NA and 3.7-2.7 WD
was employed. The excitation source was a picosecond pulsed diode laser (PicoQuant PDL
800-D) at 640 nm, instrument response-limited pulse width of 83 ps, repetition rate of 80
MHz and average power of 9 mW. The emitted photons were detected by a single photon
avalanche diode (SPAD) detector. A 685 nm ± 10 nm bandpass filter was placed before the
detector in order to measure emission only from monomeric Ce6-cavity interactions. The
emission decay lifetimes could be well fit by single exponential decay profiles in all cases
using using PicoQuant SymphoTime64 software.

Ch4. Strong Coupling in Liquid Fabry-Perot Nanocavities
79
4.2.3- Results and Discussions
Figure 4.9: Variation of the Rabi splitting as a function of the square root of Ce6 concentration in
DMF. The black squares are the Rabi splitting value corresponding to each concentration (6%, 8%,
and 10% in weight in DMF), and the red line is their linear fit.
We recall from Chapters 1 and 2 that for a system with N molecules coupled to a
resonant mode, the Rabi splitting is directly proportional to the square root of the
concentration of molecules coupled to the field since ℏΩ𝑅 ∝ √N 𝑉⁄ = √𝐶. The first mode
of the fluidic FP nanocavities was coupled to Ce6 molecules having three different
concentrations in DMF (6%, 8% and 10% in weight). The Rabi splitting values were
recorded and plotted for each concentration respectively (see Figure 4.9). The linear fit of
the recorded data (indicated by the red line in Figure 4.9) verifies the linear relationship of
the Rabi splitting ℏΩ𝑅 to the square root of the molecular concentration 𝐶. So as we will
show next, decreasing the concentration is one way to bring the system from the strong to
the weak coupling regime.
0.30 0.35 0.40
100
125
150 Rabi Splitting at a given Concentration
Linear Fit
E (
me
V)
C (mol.lit-1)
1/2
6%
8%
10%

Ch4. Strong Coupling in Liquid Fabry-Perot Nanocavities
80
Figure 4.10: Angle resolved dispersion reflection spectra from high concentration (strong coupling regime)
(a) and low concentration (weak coupling regime) (b) Ce6/DMF solution-filled cavities resonant with the
Ce6 transition energy (dashed lines). The emission dispersion curves from the same cavities are shown in
(c) and (d) with normal incidence excitation at 532 nm.
To study the properties of Ce6 under weak and strong coupling regime in liquid
solution, samples with parallel FP cavities, such as in Figure 4.6, were prepared with a
thick top mirror so that the spectroscopic measurements could be recorded in reflection
mode. This has no particular consequence on the Q-factor.
Solutions of Ce6 in dimethylformamide (DMF), at high (0.18 M) and low
concentrations (3.6 mM) were introduced into the nanocavities by capillarity. Reflection
dispersion spectra for these two concentrations in cavities where the λ mode (Figure 4.3a)
is resonant with the Ce6 absorption peak at 664 nm are plotted in Figures 4.10 a and 4.10
1.6
-6 -4 -2 0 2 4 6
775
2
1.9
1.8
1.7En
ergy
(eV
)
Wavelen
gth (n
m)
Reflection R%Reflection
k// (μm¯¹)
1
0.8
0.6
0.4
0.2
0
620
670
688
653
729
Strong Coupling Weak Coupling
(a) (b)
(c) (d)
2
1.9
1.8
1.7
1.6
-6
Wavelen
gth (n
m)
Reflection
En
ergy
(eV
)
k// (μm¯¹)
-4 -2 0 2 4 6
1
0.8
0.6
0.4
0.2
0
Wavelen
gth (n
m)
R%
620
670
688
653
729
775
2
1.9
1.8
1.7
1.6
Wavelen
gth (n
m)
1300
1000
700
400
0
IntensityEmission
En
ergy
(eV
)
k// (μm¯¹)
-6 -4 -2 0 2 4 6
620
670
688
653
729
775
2
1.9
1.8
1.7
1.6
Wavelen
gth (n
m)
IntensityEmission
En
ergy
(eV
)
k// (μm¯¹)
7000
-6 -4 -2 0 2 4 6
6000
5000
4000
3000
2000
1000
0
620
670
688
653
729
775

Ch4. Strong Coupling in Liquid Fabry-Perot Nanocavities
81
b respectively. In Figure 4.10 a, a mode splitting can be seen due to the strength of the
interaction between the mode and molecular transition (represented by the dashed line in
all Figures 4.10). The splitting has a value of ca. 110 meV, which is larger than the full
width at half-maximum (FWHM) of both the molecular absorption peak (67 meV) and the
FP resonance (62 meV). The system is therefore clearly in the strong coupling regime. The
polaritonic states are dispersive due to the photonic character they inherit from the FP
mode. As discussed above, the Rabi splitting depends on the square root of Ce6
concentration (see Figure 4.9) and at a certain threshold when the Rabi splitting becomes
smaller than the FWHM of the original components, the system is no longer in the strong
coupling regime. This is the case when the concentration is decreased by a factor of ca.
50 such as in Figure 4.10b. The FP mode then displays the normal parabolic dispersive
shape and the system is in the weak coupling regime with no avoided crossing at the
molecular absorption.
The emission dispersions in the strong and weak coupling regimes at resonance are
displayed in Figures 3c and 3d. The emission of P- in the strong-coupling case (Figure 3c)
is at slightly lower energies than that in the weak coupling regime and only the reflection
dispersion curves reveal unambiguously whether the system is in the weak or strong
coupling regimes. However, as we will see next, the effect of the coupling regime on the
emission quantum yield and radiative lifetimes are quite distinct.

Ch4. Strong Coupling in Liquid Fabry-Perot Nanocavities
82
Figure 4.11: Emission quantum yield (a) and (b) and decay (c) and (d) as function of cavity mode detuning
in the weak and strong coupling regimes respectively for Ce6 in DMF solution. Each cavity is represented
by a colored cylinder based on its optical mode energy detuning relative to the molecule’s absorption
transition at 664 nm (i.e. cavities with photonic modes in neat DMF at 567 nm (light blue), 631 nm (blue),
665 nm (black), 678 nm (orange), and 733 nm (red)). The resonant case is in black. The green lines in (a)
and (b) correspond to the emission quantum yields of the bare molecule at the same concentrations.
Figure 4.11a and 4.11b show the variation of the emission quantum yield as a
function of cavity mode detuning in the strong and weak coupling regimes respectively.
While the absolute value of Φ are determined within 10%, the relative values between
different detunings are accurate up to the signal to noise ratio of the spectroscopic
equipment. Firstly, we observe that the emission quantum yields in the strong coupling
Strong Coupling Weak Coupling
0.03
0.025
0.02
0.015
0.01
0.005
0
0.035 0.2
0.16
0.12
0.08
0.04
0
(a) (b)
1 2 3 4 5 6
0.01
0.1
1
Time (ns)
No
rma
lize
d E
mis
sio
n D
eca
y
0 5 10 15 20 25 30 35
0.01
0.1
1
Lifetime (ns)
No
rma
lize
d E
mis
sio
n D
eca
y
(c) (d)
Strong Coupling Weak Coupling

Ch4. Strong Coupling in Liquid Fabry-Perot Nanocavities
83
case are always much lower than those in the weak coupling case due to self-quenching at
high Ce6 concentration, discussed further down. In the strong coupling regime, the
maximal quantum yield is achieved for the resonant cavity and decreases when the cavity
is blue or red detuned. The yield at resonance is much higher than that of the bare molecule
at the same concentration (dashed green line in Figure 4.11a). This likely reflects the
enhanced radiative nature of the collective polaritonic state, and indeed the radiative rate
constant kr (extracted from the emission lifetimes (𝜏) (Figures 4.11c and 4.11d) and the
quantum yield as 𝑘𝑟 = Φ 𝜏)⁄ follows the same trend as the quantum yield for different
detunings (see Table 4.1). Other studies have found both enhanced and suppressed
emission quantum yields under strong coupling. 4,5,10 Such variations, which depend on the
coupled molecules and the experimental conditions, reflect most likely differences in the
non-radiative channels available for decay and the fact that Φ is dominated by knr59,87,143
(e.g. values in Table 1).
However, a different trend was observed in the weak coupling case, here the
emission quantum yield is maximum when the cavity mode overlaps with the Ce6
fluorescence (orange bar in Figure 4b). Again this correlates with the extracted radiative
rate (Table 4.1) and is the trend one would expect from a Purcell effect on the radiative
decay rate of the molecule. It should however be noted that the emission quantum yield
does not exceed that of the bare molecule in solution, perhaps because we are observing
an averaging effect across the mode amplitude with some molecules experiencing very
high mode density but others being at the central node or near the mirrors (Figure 1b).
In contrast to the quantum yields, the emission lifetimes measured from the cavities
are nearly invariant as a function of detuning in both the weak and strong coupling regime.
This is because the non-radiative rate constant knr dominates kr in both weak and strong
coupling regimes (Table 4.1). In the weak coupling limit (3.6 mM Ce6), knr is determined
mainly by the internal vibrational relaxation and inter-system crossing as its lifetime ~4.3
ns is similar to that in 10-5 M solutions where interactions between Ce6 molecules within
the excited state lifetime are unlikely. In the strong coupling limit (0.18 M Ce6), excited
Ce6 can also be quenched efficiently by interaction with surrounding Ce6 molecules in the
ground state (self-quenching), increasing knr by an order of magnitude.

Ch4. Strong Coupling in Liquid Fabry-Perot Nanocavities
84
Table 4.1: Measured fluorescence quantum yield (Φ), fluorescence lifetime (τ), and calculated radiative rate
constant (kr) and non-radiative rate constant (knr) for DMF solutions of Chlorin e6 of 0.18 M concentration
(strong coupling regime) and 3.6 mM concentration (weak coupling regime) in Fabry-Perot nanocavities
with optical modes of various detunings (the on resonance mode is highlighted in green) relative to the
Chlorin absorption at 664 nm.
4.2.4- Quantum Yield Calculation
The emission quantum yield Φ values were determined relative to that of dilute
solutions of the bare Ce6, using the following equation:
Φ𝑐 = Φ𝑅 .𝐴𝑅(𝜆𝑒𝑥)
𝐸𝑅 .
𝐸𝑐
𝐴𝑐(𝜆𝑒𝑥).𝑛𝑐
2 (𝜆𝑒𝑚)
𝑛𝑅2 (𝜆𝑒𝑚)
(4.7)
where A is the fractional absorption (1-10-Absorbance) at the excitation wavelength, 𝐸 the
integral of emission counts, and 𝑛 the index of refraction of the solvent at the emission
wavelength. Indices c and R represent the cavity and the reference molecule (Ce6)
Table 4.1: Radiative and non-radiative emission rates of Ce6 in DMF
Strong Coupling
cavity resonance φ τ (ns) kr (s-1) knr (s
-1)
567 nm 1.4E-03 0.40 3.4E+06 2.5E+09
631 nm 8.9E-03 0.42 2.1E+07 2.4E+09
665 nm 3.0E-02 0.42 7.1E+07 2.3E+09
678 nm 2.7E-02 0.42 6.3E+07 2.3E+09
733 nm 6.0E-03 0.43 1.4E+07 2.3E+09
Weak Coupling
cavity resonance φ τ (ns) kr (s-1) knr (s
-1)
567 nm 5.9E-02 4.0 1.5E+07 2.3E+08
631 nm 9.5E-02 4.4 2.2E+07 2.1E+08
665 nm 1.5E-01 4.5 3.3E+07 1.9E+08
678 nm 1.7E-01 4.2 4.1E+07 2.0E+08
733 nm 4.2E-02 4.2 1.0E+07 2.3E+08

Ch4. Strong Coupling in Liquid Fabry-Perot Nanocavities
85
respectively. Importantly, the quantum yields were referenced to Ce6 in dilute
ethanol,139,140 and transfer matrix simulations were used to determine the absorption in the
Ce6/DMF layer in each cavity. Note that at high concentration, excimer emission is
apparent at long wavelengths >740 nm for highly concentrated solutions and we excluded
this from the analysis as explained in the Experimental Section. Reabsorption of the
emission is minimal (<0.5%) even at the highest concentration used for strong coupling
due to the extremely short pathlength.
The calculation of the fluorescence quantum yield values (Φ) for cavity emission were
obtained through a two-step procedure as follows:144
i) Calculation of Ce6 quantum yield in DMF:
The Φ of Ce6 in DMF (Ce6-d) was determined by comparing it to that of the known
value in ethanol139,145 (0.15) using dilute solutions (~ 8 x 10⁻⁶ M) and correcting for
the relative fraction of light absorbed as per equation (4.7). Steady-state
fluorescence spectra were taken with a Horiba Jobin Yvon-Spex Fluorolog-3
fluorimeter, and the emission values were obtained by integrating the area under
the spectra. The quantum yield of 8 x 10⁻⁶ M Ce6 in DMF was found to be 0.21. To
determine Φ at higher concentrations (3.6 mM and 0.175M), where the solution
becomes increasingly optically dense we assume that the radiative decay rates
remain constant, but non-radiative decay rates increase with concentration due to
self-quenching. In such conditions the quantum yield as a function of concentration
can be obtained from the lifetime of the concentrated solution using:
Φ𝑚
𝜏𝑚=
Φ
𝜏 (4.8)
where 𝜏 is the decay lifetime and the index 𝑚 is the value measured in dilute
solution (here ~ 8 x 10⁻⁶ M Ce6). Consequently, the Φ values for Ce6 in DMF at
3.6 x 10⁻³ M and 0.18 M were found to be 0.2 and 0.0187 respectively.

Ch4. Strong Coupling in Liquid Fabry-Perot Nanocavities
86
ii) Calculation of the fluorescence quantum yield from FP cavities:
The final quantum yield values that are presented in Table 1 were calculated by
using Equation (4.7) and using as reference the emission from one-mirror channels,
assumed to have the quantum yield values determined in i) above. The total
emission from each cavity was obtained by integrating the areas under the spectra
up to 720 nm in Figure 4.8a and 4.8b, to avoid including excimer emission in the
analysis. The absorbance values (𝐴𝑏𝑠) from the one-mirror channels were
calculated by using Beer Lambert’s equation
𝐴𝑏𝑠 = 𝐶. 휀. 2𝑑 (4.9)
where C the molecular concentration, 휀 the molecule’s extinction coefficient, 𝑑 is
the channel path length and the factor 2 accounts for the fact that the excitation
light is reflected off the back-mirror.
In the case of the FP cavities, the fraction of light absorbed in the Ce6/DMF layer
at 365 nm (A) was obtained by using Transfer matrix simulations of the system (glass - Cr
(2nm) – Ag (30nm) – Active layer (solution) – Ag (200nm)). These absorption values are
related to Absorbance as:
𝐴 = 1 − 10−𝐴𝑏𝑠 (4.10)
Finally, after the calculation of the quantum yield, the radiative 𝑘𝑟 and non-
radiative 𝑘𝑛𝑟 rate constants in Table1 were calculated using the following equations:
Φ = 𝑘𝑟
𝑘𝑟 + 𝑘𝑛𝑟 = 𝜏. 𝑘𝑟 (4.11)
which leads to:

Ch4. Strong Coupling in Liquid Fabry-Perot Nanocavities
87
𝑘𝑟 = Φ
τ (4.12)
𝑘𝑛𝑟 = 1 − Φ
τ (4.13)
4.3- Conclusions
In summary we have succeeded in preparing nanoscale liquid Fabry-Perot
nanocavities that have the excellent optical qualities necessary to observe strong coupling
effects for molecular solutions. In particular we demonstrate the enhanced radiative nature
of polaritonic states generated from concentrated DMF solutions of Chlorin e6. Our
fabrication method allows for the facile preparation of FP nanocavities of any desired
lateral shape and lateral extent up to the millimeter scale, but with exquisite control over
the nanoscale thickness. Thus samples can be customized to various geometries and length
scales for different experimental purposes. While these FP nanocavities were made with
Ag mirrors, we have tested that the same approach can be used for other metals such as
Au. Furthermore, many solvents including water are easily taken up by our cavities such
that studies of biological systems in their native solvation environment become possible.
The observation of light-matter strong coupling of electronic transitions in the liquid state
opens the possibility to study other molecular processes in this regime where diffusion and
orientation plays a role, such as chemistry, with potential to broaden the scope of this field
immensely.

Thesis Conclusions and Outlook
88
Thesis Conclusions and Outlook
In general, the overall aim of this thesis was to contribute to the fundamental
understanding of the strong coupling phenomenon of light with organic molecules by
implementing new systems and techniques in order to investigate property modifications
of coupled molecular systems with photonic resonances. Consequently our conclusion can
be divided into two main headings which correspond to the tools we exploited to achieve
strong coupling experimentally.
In our first project, we intended to take advantage of the open character of
plasmonic structures in order to extract subsequently surface property modifications, such
as wetting, induced by the strong coupling of merocyanine (MC) whose work-function had
been found to be tunedunder similar conditions.53 We overcame many experimental
challenges such as milling resonant hole-array structures over relatively large areas (~ 1
mm2) on the surface of metals, and observing the Rabi splitting experienced by the coupled
MC molecules on the surface of these arrays. When considering future prospects, such
large plasmonic structures should be ideal tools for surface-enhanced Raman scattering
spectroscopy (SERS) and biosensing applications.127
The study of wetting on such structures by contact angle measurements
encountered many difficulties. In particular, both the metal and polymer surfaces were
restructured, damaged and contaminated by the evaporation of the water droplets used in
the experiments. This happened even under very stringent purity conditions and therefore
it became clear that such wetting experiments are not feasible with the current experimental
conditions. Nevertheless, with some modifications, the original hypothesis of the
experiment might still hold. For example, it would be possible to try replacing water by
droplets by an inert liquid with high boiling point such that they would not experience
quick evaporation.
Since many natural dynamic processes of molecules occur in the liquid phase, there
was a need to find a system which allows us to explore strong coupling effects on

Thesis Conclusions and Outlook
89
molecules dissolved in liquid solvents. Experiments in liquid solutions have only been
achieved for vibrational strong coupling (VSC) where micro-fluidic Fabry-Perot (FP)
cavities can be easily used.42,45,77 In this second project, the strong coupling of molecular
electronic transitions with resonant photonic modes was achieved in the liquid phase for
the first time. This required the development of a fabrication method of Fabry-Perot
nanocavities, having modes in the visible range, in which liquids can be introduced. The
method is easy to implement and extends to the formation of custom cavities with various
geometries and sizes based on the experimental requirements. Due to the fact that cavities
with different modes and in various shapes can be fabricated on the same substrate, thus it
opens the potential for an all-fluidic strong coupling chip.
To illustrate the potential of these systems, the photophysical properties of weakly
and strongly coupled chlorin e6 (Ce6) molecules mixed in DMF solvent were studied. The
emission quantum yield of Ce6 was observed to be larger for coupled molecules than the
uncoupled ones. The quantum yield decreases as the system moves away from the strongly
coupled resonance conditions. Moreover, a different trend was observed in the weak
coupling case following what one would expect from a Purcell effect. The latter
observation supports the conclusion that the quantum yield enhancement observed for the
lower polariton relative to the bare molecule was a consequence of the strong coupling
phenomenon.
In addition, unlike the emission quantum yield, the fluorescence lifetime decay did
not result in any significant differences when measured for different detunings. The
calculation of radiative and non-radiative decay constants reveals that the non-radiative
relaxation processes dominates the radiative ones by two orders of magnitude. The non-
radiative rates for different cavity detunings were also similar in value and this explains
the absence of variation in fluorescence lifetimes. Building on these results, it would be
interesting to look for coherence of emission from strongly coupled molecules in the liquid
phase.

Thesis Conclusions and Outlook
90
Other projects relying on coupling electronic transitions of molecules in the liquid
phase are still in progress. For instance, recent theoretical studies report that collective
interactions of dipoles with a photonic cavity can generate optomechanical effects, which
might lead to a second order transition of the coupled dipoles from an isotropic to an
aligned phase.146 We believe that our system, in which molecules have freedom of
movement, is ideal to verify experimentally this theory and perhaps show realignment
effects of strongly coupled molecular dipoles.
This work has been technically very challenging. Nevertheless, our results are a
small but important contribution to this emerging field of modified molecular properties
under light-matter strong coupling. We believe that a number of molecular processes can
and will be studied in the nano-fluidic cavity configuration developed here deepening our
fundamental understanding and opening the door to future applications.

References
91
References:
(1) Eugene Hecht. Optics, 4th Editio.; Alfred Zajac, Ed.; Addison-Wesley, 1987.
(2) G.R. Fowles. Introduction to Modern Optics; Courier Corporation, 2012.
(3) Haroche, S. Controlling Photons in a Box and Exploring the Quantum to Classical
Boundary. Ann. Phys. 2013, 525, 753–776.
(4) M.Ducloy; D.Block. Quantum Optics of Confinded Systems; Kluwer Academic
Publishers, 1996.
(5) Purcell, E. M. Spontaneous Emission Probabilities at Radio Frequencies. Physical
Review. 1946, p 681.
(6) Főrster, T. 10th Spiers Memorial Lecture. Transfer Mechanisms of Electronic
Excitation. Discuss. Faraday Soc. 1959, 27, 7–17.
(7) Kasha, M. Energy Transfer Mechanisms and the Molecular Exciton Model for
Molecular Aggragates. Radiat. Res. 1963, 20, 55–70.
(8) Rodriguez, S. R. K. Classical and Quantum Distinctions between Weak and
Strong Coupling. Eur. J. Phys. 2016, 37, 25802.
(9) Ebbesen, T. W. Hybrid Light-Matter States in a Molecular and Material Science
Perspective. Acc. Chem. Res. 2016, 49, 2403–2412.
(10) Kaluzny, Y.; Goy, P.; Gross, M.; Raimond, J. M.; Haroche, S. Observation of
Self-Induced Rabi Oscillations in Two-Level Atoms Excited inside a Resonant
Cavity: The Ringing Regime of Superradiance. Phys. Rev. Lett. 1983, 51, 1175–
1178.
(11) Rempe, G.; Walther, H.; Klein, N. Observation of Quantum Collapse and Revival
in a One-Atom Maser. Phys. Rev. Lett. 1987, 58, 353–356.
(12) Raizen, M. G.; Thompson, R. J.; Brecha, R. J.; Kimble, H. J.; Carmichael, H. J.
Normal-Mode Splitting and Linewidth Averaging for Two-State Atoms in an

References
92
Optical Cavity. Phys. Rev. Lett. 1989, 63, 240–243.
(13) Thompson, R. J.; Rempe, G.; Kimble, H. J. Observation of Normal-Mode Splitting
for an Atom in an Optical Cavity. Phys. Rev. Lett. 1992, 68, 1132–1135.
(14) Haroche, S.; Raimond, J. M. Exploring the Quantum: Atoms, Cavities, and
Photons, 1st Editio.; Oxford University Press, 2006.
(15) Haroche, S.; Kleppner, D. Cavity Quantum Electrodynamics. Phys. Today 1989,
42, 24–30.
(16) Andreani, L. C. Strong Light-Matter Coupling From Atoms to Solid-State Systems;
Singapore: World Scientific, 2013.
(17) Deng, H.; Haug, H.; Yamamoto, Y. Exciton-Polariton Bose-Einstein
Condensation. Rev. Mod. Phys. 2010, 82, 1489–1537.
(18) Weisbuch, C.; Nishioka, M.; Ishikawa, A.; Arakawa, Y. Observation of the
Coupled Exciton-Photon Mode Splitting in a Semiconductor Quantum
Microcavity. Phys. Rev. Lett. 1992, 69, 3314–3317.
(19) Houdré, R. Early Stages of Continuous Wave Experiments on Cavity-Polaritons.
Phys. Status Solidi Basic Res. 2005, 242, 2167–2196.
(20) Houdré, R.; Weisbuch, C.; Stanley, R. P.; Oesterle, U.; Pellandini, P.; Ilegems, M.
Measurement of Cavity-Polariton Dispersion Curve from Angle-Resolved
Photoluminescence Experiments. Phys. Rev. Lett. 1994, 73, 2043–2046.
(21) Baumberg, J. J. Spin Condensates in Semiconductor Microcavities. In
Semiconductor Spintronics and Quantum Computation; Awschalom, D. D., Loss,
D., Samarth, N., Eds.; Springer Berlin Heidelberg: Berlin, Heidelberg, 2002; pp
195–219.
(22) Saba, M.; Ciuti, C.; Bloch, J.; Thierry-Mieg, V.; André, R.; Dang, L. S.;
Kundermann, S.; Mura, A.; Bongiovanni, G.; Staehli, J. L.; Deveaud, B. High-
Temperature Ultrafast Polariton Parametric Amplification in Semiconductor

References
93
Microcavities. Nature 2001, 414 (6865), 731–735.
(23) Carusotto, I.; Ciuti, C. Quantum Fluids of Light. Rev. Mod. Phys. 2013, 85, 299–
366.
(24) Khitrova, G.; Gibbs, H. M.; Kira, M.; Koch, S. W.; Scherer, A. Vacuum Rabi
Splitting in Semiconductors. Nat. Phys. 2006, 2, 81–90.
(25) W Y Liang. Excitons. Phys. Educ. 1970, 5, 226.
(26) Sellers, I. R.; Semond, F.; Leroux, M.; Massies, J.; Disseix, P.; Henneghien, A. L.;
Leymarie, J.; Vasson, A. Strong Coupling of Light with a and B Excitons in GaN
Microcavities Grown on Silicon. Phys. Rev. B - Condens. Matter Mater. Phys.
2006, 73, 1–4.
(27) Gómez, D. E.; Vernon, K. C.; Mulvaney, P.; Davis, T. J. Surface Plasmon
Mediated Strong Exciton-Photon Coupling in Semiconductor Nanocrystals. Nano
Lett. 2010, 10, 274–278.
(28) Liu, X.; Galfsky, T.; Sun, Z.; Xia, F.; Lin, E. Strong Light-Matter Coupling in
Two-Dimensional Atomic Crystals. Nat. Photonics 2015, 9, 30–34.
(29) Wang, S.; Li, S.; Chervy, T.; Shalabney, A.; Azzini, S.; Orgiu, E.; Hutchison, J.
A.; Genet, C.; Samorì, P.; Ebbesen, T. W. Coherent Coupling of WS2 Monolayers
with Metallic Photonic Nanostructures at Room Temperature. Nano Lett. 2016, 16,
4368–4374.
(30) Reithmaier, J. P.; Sek, G.; Löffler, A.; Hofmann, C.; Kuhn, S.; Reitzenstein, S.;
Keldysh, L. V; Kulakovskii, V. D.; Reinecke, T. L.; Forchel, A. Strong Coupling
in a Single Quantum Dot-Semiconductor Microcavity System. Nature 2004, 432,
197–200.
(31) Agranovich, V. M.; Malshukov, A. G. Surface Polariton Spectra If The Resonance
with the Transition Layer Vibrations Exist. Opt. Commun. 1974, 11, 169–171.
(32) Pockrand, I.; Brillante, A.; Möbius, D. Exciton–surface Plasmon Coupling: An

References
94
Experimental Investigation. J. Chem. Phys. 1982, 77, 6289–6295.
(33) Lidzey, D. G.; Bradley, D. D. C.; Skolnick, M. S.; Virgili, T.; Walker, S.;
Whittaker, D. M. Strong Exciton-Photon Coupling in an Organic Semiconductor
Microcavity. Nature 1998, 395, 53–55.
(34) Fujita, T.; Sato, Y.; Kuitani, T.; Ishihara, T. Tunable Polariton Absorption of
Distributed Feedback Microcavities at Room Temperature. Phys. Rev. B 1998, 57
(19), 12428–12434.
(35) Kéna-Cohen, S.; Forrest, S. R. Room-Temperature Polariton Lasing in an Organic
Single-Crystal Microcavity. Nat. Photonics 2010, 4, 371–375.
(36) Ramezani, M.; Halpin, A.; Fernández-Domínguez, A. I.; Feist, J.; Rodriguez, S.
R.-K.; Garcia-Vidal, F. J.; Gómez-Rivas, J. Plasmon-Exciton-Polariton Lasing.
Optica 2016, 4, 22–27.
(37) Daskalakis, K. S.; Maier, S. a; Murray, R.; Kéna-Cohen, S. Nonlinear Interactions
in an Organic Polariton Condensate. Nat. Mater. 2014, 13, 271–278.
(38) Plumhof, J. D.; Stöferle, T.; Mai, L.; Scherf, U.; Mahrt, R. F. Room-Temperature
Bose–Einstein Condensation of Cavity Exciton–polaritons in a Polymer. Nat.
Mater. 2013, 13, 247–252.
(39) Atkin, P.; Paula, J. Physical Chemistry; 2006.
(40) Schwartz, T.; Hutchison, J. A.; Genet, C.; Ebbesen, T. W. Reversible Switching of
Ultrastrong Light-Molecule Coupling. Phys. Rev. Lett. 2011, 106, 196405–(1–4).
(41) Törmä, P.; Barnes, W. L. Strong Coupling between Surface Plasmon Polaritons
and Emitters: A Review. Rep. Prog. Phys. 2015, 78, 13901.
(42) George, J.; Chervy, T.; Shalabney, A.; Devaux, E.; Hiura, H.; Genet, C.; Ebbesen,
T. W. Multiple Rabi Splittings under Ultrastrong Vibrational Coupling. Phys. Rev.
Lett. 2016, 117, 1–5.
(43) George, J.; Wang, S.; Chervy, T.; Canaguier-Durand, A.; Schaeffer, G.; Lehn, J.-
References
95
M.; Hutchison, J. a; Genet, C.; Ebbesen, T. W. Ultra-Strong Coupling of
Molecular Materials: Spectroscopy and Dynamics. Faraday Discuss. 2015, 281–
294.
(44) Kéna-Cohen, S.; Maier, S. A.; Bradley, D. D. C. Ultrastrongly Coupled Exciton-
Polaritons in Metal-Clad Organic Semiconductor Microcavities. Adv. Opt. Mater.
2013, 1, 827–833.
(45) George, J.; Shalabney, A.; Hutchison, J. A.; Genet, C.; Ebbesen, T. W. Liquid-
Phase Vibrational Strong Coupling. J. Phys. Chem. Lett. 2015, 6, 1027–1031.
(46) Fontcuberta i Morral, A.; Stellacci, F. Light-Matter Interactions: Ultrastrong
Routes to New Chemistry. Nat. Mater. 2012, 11, 272–273.
(47) Orgiu, E.; George, J.; Hutchison, J. a.; Devaux, E.; Dayen, J. F.; Doudin, B.;
Stellacci, F.; Genet, C.; Schachenmayer, J.; Genes, C.; Pupillo, G.; Samorì, P.;
Ebbesen, T. W. Conductivity in Organic Semiconductors Hybridized with the
Vacuum Field. Nat. Mater. 2014, 14, 1123–1130.
(48) Coles, D. M.; Somaschi, N.; Michetti, P.; Clark, C.; Lagoudakis, P. G.; Savvidis,
P. G.; Lidzey, D. G. Polariton-Mediated Energy Transfer between Organic Dyes in
a Strongly Coupled Optical Microcavity. Nat. Mater. 2014, 13, 712–719.
(49) Holmes, R. J.; Forrest, S. R. Strong Exciton-Photon Coupling and Exciton
Hybridization in a Thermally Evaporated Polycrystalline Film of an Organic Small
Molecule. Phys. Rev. Lett. 2004, 93, 1–4.
(50) Bellessa, J.; Symonds, C.; Laverdant, J.; Benoit, J.-M.; Plenet, J. C.; Vignoli, S.
Strong Coupling between Plasmons and Organic Semiconductors. Electronics
2014, 3, 303–313.
(51) Gubbin, C. R.; Maier, S. A.; Kéna-Cohen, S. Low-Voltage Polariton
Electroluminescence from an Ultrastrongly Coupled Organic Light-Emitting
Diode. Appl. Phys. Lett. 2014, 104.
(52) Lunz, M.; de Boer, D.; Lozano, G.; Rodriguez, S. R. K.; Gómez-Rivas, J.;

References
96
Verschuuren, M. A. Plasmonic LED Device. Proc.SPIE 2014, 9127, 91270N–
91270N–6.
(53) Hutchison, J. A.; Liscio, A.; Schwartz, T.; Canaguier-Durand, A.; Genet, C.;
Palermo, V.; Samorì, P.; Ebbesen, T. W. Tuning the Work-Function via Strong
Coupling. Adv. Mater. 2013, 25, 2481–2485.
(54) Shalabney, A.; George, J.; Hiura, H.; Hutchison, J. A.; Genet, C.; Hellwig, P.;
Ebbesen, T. W. Enhanced Raman Scattering from Vibro-Polariton Hybrid States.
Angew. Chemie - Int. Ed. 2015, 54, 7971–7975.
(55) Hao, Y. W.; Wang, H. Y.; Jiang, Y.; Chen, Q. D.; Ueno, K.; Wang, W. Q.;
Misawa, H.; Sun, H. B. Hybrid-State Dynamics of Gold Nanorods/dye J-
Aggregates under Strong Coupling. Angew. Chemie - Int. Ed. 2011, 50, 7824–
7828.
(56) Schwartz, T.; Hutchison, J. A.; Léonard, J.; Genet, C.; Haacke, S.; Ebbesen, T. W.
Polariton Dynamics under Strong Light-Molecule Coupling. ChemPhysChem
2013, 14, 125–131.
(57) Tischler, J. R.; Scott Bradley, M.; Zhang, Q.; Atay, T.; Nurmikko, A.; Bulović, V.
Solid State Cavity QED: Strong Coupling in Organic Thin Films. Org. Electron.
2007, 8, 94–113.
(58) Wiederrecht, G. P.; Hall, J. E.; Bouhelier, A. Control of Molecular Energy
Redistribution Pathways via Surface Plasmon Gating. Phys. Rev. Lett. 2007, 98,
1–4.
(59) Wang, S.; Chervy, T.; George, J.; Hutchison, J. A.; Genet, C.; Ebbesen, T. W.
Quantum Yield of Polariton Emission from Hybrid Light-Matter States. J. Phys.
Chem. Lett. 2014, 5, 1433–1439.
(60) Zhong, X.; Chervy, T.; Wang, S.; George, J.; Thomas, A.; Hutchison, J. A.;
Devaux, E.; Genet, C.; Ebbesen, T. W. Non-Radiative Energy Transfer Mediated
by Hybrid Light-Matter States. Angew. Chemie - Int. Ed. 2016, 55, 6202–6206.

References
97
(61) Tischler, J. R.; Bradley, M. S.; Bulović, V.; Song, J. H.; Nurmikko, A. Strong
Coupling in a Microcavity LED. Phys. Rev. Lett. 2005, 95, 1–4.
(62) Vasa, P.; Wang, W.; Pomraenke, R.; Lammers, M.; Maiuri, M.; Manzoni, C.;
Cerullo, G.; Lienau, C. Real-Time Observation of Ultrafast Rabi Oscillations
between Excitons and Plasmons in J-Aggregate/metal Hybrid Nanostructures.
2013 Conf. Lasers Electro-Optics Eur. Int. Quantum Electron. Conf.
CLEO/Europe-IQEC 2013 2013, 7, 1–5.
(63) Aberra Guebrou, S.; Symonds, C.; Homeyer, E.; Plenet, J. C.; Gartstein, Y. N.;
Agranovich, V. M.; Bellessa, J. Coherent Emission from a Disordered Organic
Semiconductor Induced by Strong Coupling with Surface Plasmons. Phys. Rev.
Lett. 2012, 108, 1–5.
(64) Shi, L.; Hakala, T. K.; Rekola, H. T.; Martikainen, J. P.; Moerland, R. J.; Törmä,
P. Spatial Coherence Properties of Organic Molecules Coupled to Plasmonic
Surface Lattice Resonances in the Weak and Strong Coupling Regimes. Phys. Rev.
Lett. 2014, 112.
(65) Lagoudakis, P. Polariton Condensates: Going Soft. Nat. Mater. 2014, 13, 227–
228.
(66) Chervy, T.; Xu, J.; Duan, Y.; Wang, C.; Mager, L.; Frerejean, M.; Münninghoff, J.
A. W.; Tinnemans, P.; Hutchison, J. A.; Genet, C.; Rowan, A. E.; Rasing, T.;
Ebbesen, T. W. High-Efficiency Second-Harmonic Generation from Hybrid Light-
Matter States. Nano Lett. 2016, 7352–7356.
(67) Chikkaraddy, R.; de Nijs, B.; Benz, F.; Barrow, S. J.; Scherman, O. A.; Rosta, E.;
Demetriadou, A.; Fox, P.; Hess, O.; Baumberg, J. J. Single-Molecule Strong
Coupling at Room Temperature in Plasmonic Nanocavities. Nature 2016, 535,
127–130.
(68) Hutchison, J. A.; Schwartz, T.; Genet, C.; Devaux, E.; Ebbesen, T. W. Modifying
Chemical Landscapes by Coupling to Vacuum Fields. Angew. Chemie - Int. Ed.
2012, 51, 1592–1596.
References
98
(69) Hutchison, J. A.; Schwartz, T.; Genet, C.; Devaux, E.; Ebbesen, T. W. Modifying
Chemical Landscapes by Coupling to Vacuum Fields. Angew. Chemie - Int. Ed.
2012, 51, 1592–1596.
(70) Wang, S.; Mika, A.; Hutchison, J. a; Genet, C.; Jouaiti, A.; Hosseini, M. W.;
Ebbesen, T. W. Phase Transition of a Perovskite Strongly Coupled to the Vacuum
Field. Nanoscale 2014, 6, 7243–7248.
(71) Holmes, R. J. Organic Polaritons: Long-Distance Relationships. Nat. Mater. 2014,
13, 669–670.
(72) Hakala, T. K.; Toppari, J. J.; Kuzyk, A.; Pettersson, M.; Tikkanen, H.; Kunttu, H.;
Törmä, P. Vacuum Rabi Splitting and Strong-Coupling Dynamics for Surface-
Plasmon Polaritons and Rhodamine 6G Molecules. Phys. Rev. Lett. 2009, 103, 1–
4.
(73) Shalabney, A.; George, J.; Hutchison, J. a.; Pupillo, G.; Genet, C.; Ebbesen, T. W.
Coherent Coupling of Molecular Resonators with a Microcavity Mode. Nat.
Commun. 2015, 6, 5981.
(74) Simpkins, B. S.; Fears, K. P.; Dressick, W. J.; Spann, B. T.; Dunkelberger, A. D.;
Owrutsky, J. C. Spanning Strong to Weak Normal Mode Coupling between
Vibrational and Fabry–Pérot Cavity Modes through Tuning of Vibrational
Absorption Strength. ACS Photonics 2015, 2, 1460–1467.
(75) Dunkelberger, A. D.; Spann, B. T.; Fears, K. P.; Simpkins, B. S.; Owrutsky, J. C.
Modified Relaxation Dynamics and Coherent Energy Exchange in Coupled
Vibration-Cavity Polaritons. Nat. Commun. 2016, 7, 13504.
(76) Thomas, A.; George, J.; Shalabney, A.; Dryzhakov, M.; Varma, S. J.; Moran, J.;
Chervy, T.; Zhong, X.; Devaux, E.; Genet, C.; Hutchison, J. A.; Ebbesen, T. W.
Ground-State Chemical Reactivity under Vibrational Coupling to the Vacuum
Electromagnetic Field. Angew. Chemie - Int. Ed. 2016, 55, 11462–11466.
(77) Vergauwe, R. M. A.; George, J.; Chervy, T.; Hutchison, J. A.; Shalabney, A.;

References
99
Torbeev, V. Y.; Ebbesen, T. W. Quantum Strong Coupling with Protein
Vibrational Modes. J. Phys. Chem. Lett. 2016, 7, 4159–4164.
(78) Coles, D. M.; Yang, Y.; Wang, Y.; Grant, R. T.; Taylor, R. A.; Saikin, S. K.;
Aspuru-Guzik, A.; Lidzey, D. G.; Kuo, J.; Tang, -Hsiang; Smith, J. M. Strong
Coupling between Chlorosomes of Photosynthetic Bacteria and a Confined
Optical Cavity Mode. Nat. Commun. 2014, 5, 5561.
(79) González-Tudela, A.; Huidobro, P. A.; Martín-Moreno, L.; Tejedor, C.; García-
Vidal, F. J. Theory of Strong Coupling between Quantum Emitters and
Propagating Surface Plasmons. Phys. Rev. Lett. 2013, 110, 126801.
(80) Flick, J.; Ruggenthaler, M.; Appel, H.; Rubio, A. Atoms and Molecules in
Cavities, from Weak to Strong Coupling in Quantum-Electrodynamics (QED)
Chemistry. Proc. Natl. Acad. Sci. 2017, 114, 3026–3034.
(81) Schachenmayer, J.; Genes, C.; Tignone, E.; Pupillo, G. Cavity-Enhanced
Transport of Excitons. Phys. Rev. Lett. 2015, 114, 1–6.
(82) Herrera, F.; Spano, F. C. Cavity-Controlled Chemistry in Molecular Ensembles.
Phys. Rev. Lett. 2016, 116, 1–6.
(83) Kowalewski, M.; Bennett, K.; Mukamel, S. Non-Adiabatic Dynamics of
Molecules in Optical Cavities. J. Chem. Phys. 2016, 144, 1–8.
(84) Del Pino, J.; Feist, J.; Garcia-Vidal, F. J. Signatures of Vibrational Strong
Coupling in Raman Scattering. J. Phys. Chem. C 2015, 119, 29132–29137.
(85) Marchetti, F. M.; Keeling, J. Collective Pairing of Resonantly Coupled
Microcavity Polaritons. Phys. Rev. Lett. 2014, 113, 1–5.
(86) Gomez, D. E.; Lo, S. S.; Davis, T. J.; Hartland, G. V. Picosecond Kinetics of
Strongly Coupled Excitons and Surface Plasmon Polaritons. J. Phys. Chem. B
2013, 117, 4340–4346.
(87) Grant, R. T.; Michetti, P.; Musser, A. J.; Gregoire, P.; Virgili, T.; Vella, E.;

References
100
Cavazzini, M.; Georgiou, K.; Galeotti, F.; Clark, C.; Clark, J.; Silva, C.; Lidzey,
D. G. Efficient Radiative Pumping of Polaritons in a Strongly Coupled
Microcavity by a Fluorescent Molecular Dye. Adv. Opt. Mater. 2016, 4, 1615–
1623.
(88) Canaguier-Durand, A.; Genet, C.; Lambrecht, A.; Ebbesen, T. W.; Reynaud, S.
Non-Markovian Polariton Dynamics in Organic Strong Coupling. Eur. Phys. J. D
2015, 69.
(89) Jackson, J. D. Classical Electrodynamics. John Wiley & Sons, Inc. 1962.
(90) Oughstun, K.; Cartwright, N. On the Lorentz-Lorenz Formula and the Lorentz
Model of Dielectric Dispersion: Addendum. Opt. Express 2003, 11, 2791–2792.
(91) Lucarini, V.; Saarinen, J. J.; Peiponen, K.-E.; Vartiainen, E. M. Kramers-Kronig
Relations in Optical Materials Research; Springer: Berlin, 2005.
(92) Grusdt, F. Introduction to Cavity QED. 2011, 1–8.
(93) Garraway, B. M. The Dicke Model in Quantum Optics: Dicke Model Revisited.
Philos. Trans. A. Math. Phys. Eng. Sci. 2011, 369, 1137–1155.
(94) Radiation, S. I, 19&4. Phys. Rev. 1954, 93, 99–110.
(95) Bhaseen, M. J.; Mayoh, J.; Simons, B. D.; Keeling, J. Dynamics of
Nonequilibrium Dicke Models. Phys. Rev. A - At. Mol. Opt. Phys. 2012, 85, 1–25.
(96) Tavis, M. Exact Solution for an N-Molecule Radiation-Field Hamiltonian. Phys.
Rev. 1968, 170, 379–384.
(97) Barnes, W. L.; Dereux, A.; Ebbesen, T. W. Surface Plasmon Subwavelength
Optics. Nature 2003, 424, 824–830.
(98) Stein, B.; Laluet, J. Y.; Devaux, E.; Genet, C.; Ebbesen, T. W. Surface Plasmon
Mode Steering and Negative Refraction. Phys. Rev. Lett. 2010, 105, 1–4.
(99) Genet, C.; Ebbesen, T. W. Light in Tiny Holes. Nature 2007, 445, 39–46.

References
101
(100) Laluet, J. Y.; Drezet, A.; Genet, C.; Ebbesen, T. W. Generation of Surface
Plasmons at Single Subwavelength Slits: From Slit to Ridge Plasmon. New J.
Phys. 2008, 10.
(101) Yi, J. M.; Cuche, A.; de León-Pérez, F.; Degiron, A.; Laux, E.; Devaux, E.; Genet,
C.; Alegret, J.; Martìn-Moreno, L.; Ebbesen, T. W. Diffraction Regimes of Single
Holes. Phys. Rev. Lett. 2012, 109, 1–5.
(102) Raether, H. Surface Plasmons on Smooth and Rough Surfaces and on Gratings.
Springer Tracts Mod. Phys. 1988, 111, 136.
(103) Hendry, E.; Garcia-Vidal, F. J.; Martin-Moreno, L.; Rivas, J. G.; Bonn, M.;
Hibbins, A. P.; Lockyear, M. J. Optical Control over Surface-Plasmon-Polariton-
Assisted THz Transmission through a Slit Aperture. Phys. Rev. Lett. 2008, 100,
26–29.
(104) Ditlbacher, H.; Krenn, J. R.; Felidj, N.; Lamprecht, B.; Schider, G.; Salerno, M.;
Leitner, A.; Aussenegg, F. R. Fluorescence Imaging of Surface Plasmon Fields.
Appl. Phys. Lett. 2002, 80, 404–406.
(105) Ritchie, R. H.; Arakawa, E. T.; Cowan, J. J.; Hamm, R. N. Surface-Plasmon
Resonance Effect in Grating Diffraction. Phys. Rev. Lett. 1968, 21, 1530–1533.
(106) Gómez Rivas, J.; Schotsch, C.; Haring Bolivar, P.; Kurz, H. Enhanced
Transmission of THz Radiation through Subwavelength Holes. Phys. Rev. B 2003,
68, 201306.
(107) Ebbesen, T. W.; Lezec, H. J.; Ghaemi, H. F.; T. Thio; A.Wolff, P.; Thio, T.;
A.Wolff, P. Extraordinary Optical Transmission through Sub-Wavelength Hole
Arrays. Nature 1998, 86, 1114–1117.
(108) Wood, R. W. Anomalous Diffraction Gratings. Phys. Rev. 1935, 48, 928–936.
(109) Ghaemi, H. F.; Thio, T.; Grupp, D. E.; Ebbesen, T. W.; Lezec, H. J. Surface
Plasmons Enhance Optical Transmission through Subwavelength Holes. Phys.
Rev. B 1998, 58, 6779–6782.

References
102
(110) Genet, C.; Van Exter, M. P.; Woerdman, J. P. Fano-Type Interpretation of Red
Shifts and Red Tails in Hole Array Transmission Spectra. Opt. Commun. 2003,
225, 331–336.
(111) Krishnan, A.; Thio, T.; Kim, T. J.; Lezec, H. J.; Ebbesen, T. W.; Wolff, P. A.;
Pendry, J.; Martin-Moreno, L.; Garcia-Vidal, F. J. Evanescently Coupled
Resonance in Surface Plasmon Enhanced Transmission. Opt. Commun. 2001, 200,
1–7.
(112) Salomon, A.; Wang, S.; Hutchison, J. A.; Genet, C.; Ebbesen, T. W. Strong Light-
Molecule Coupling on Plasmonic Arrays of Different Symmetry. ChemPhysChem
2013, 1882–1886.
(113) Bracco, G.; Holst, B. Surface Science Techniques; 2013; Vol. 51.
(114) Saeki, F.; Baum, J.; Moon, H.; Yoon, J.-Y.; Kim, C.-J.; Garrell, R. L.
Electrowetting on Dielectrics (EWOD): Reducing Voltage Requirements for
Microfluidics. Polym. Mater. Sci. Eng. 2001, 85, 12–13.
(115) Khodayari, M.; Hahne, B.; Crane, N. B.; Volinsky, A. A. Floating Electrode
Electrowetting on Hydrophobic Dielectric with an SiO2 Layer. Appl. Phys. Lett.
2013, 102, 1–13.
(116) Quéré, D. Rough Ideas on Wetting. Phys. A Stat. Mech. its Appl. 2002, 313, 32–
46.
(117) Young, T. An Essay on the Cohesion of Fluids. Philos. Trans. R. Soc. London
1805, 95, 65–87.
(118) Lipowsky, R.; Lenz, P.; Swain, P. S. Wetting and Dewetting of Structured and
Imprinted Surfaces. Colloids Surfaces A Physicochem. Eng. Asp. 2000, 161, 3–22.
(119) Wenzel, R. N. Resistance Of Solid Surfaces To Wetting By Water. Ind. Eng.
Chem. 1936, 28, 988–994.
(120) Cassie, B. D.; Cassie, A. B. D.; Baxter, S. Of Porous Surfaces,. Trans. Faraday
References
103
Soc. 1944, 40, 546–551.
(121) Reyntjens, S.; Puers, R. A Review of Focused Ion Beam Applications in
Microsystem Technology. J. Micromechanics Microengineering 2001, 11, 287–
300.
(122) Kim, C. S.; Ahn, S. H.; Jang, D. Y. Review: Developments in Micro/nanoscale
Fabrication by Focused Ion Beams. Vacuum 2012, 86, 1014–1035.
(123) Narayan, K.; Subramaniam, S. Focused Ion Beams in Biology. Nat. Methods
2015, 12, 1021–1031.
(124) Chau, T. T.; Bruckard, W. J.; Koh, P. T. L.; Nguyen, A. V. A Review of Factors
That Affect Contact Angle and Implications for Flotation Practice. Adv. Colloid
Interface Sci. 2009, 150, 106–115.
(125) Ohno, T.; Wadell, C.; Inagaki, S.; Shi, J.; Nakamura, Y.; Matsushita, S.;
Sannomiya, T. Hole-Size Tuning and Sensing Performance of Hexagonal
Plasmonic Nanohole Arrays. Opt. Mater. Express 2016, 6, 1594.
(126) Altewischer, E.; Genet, C.; van Exter, M. P.; Woerdman, J. P.; Alkemade, P. F. a;
van Zuuk, A.; van der Drift, E. W. J. M. Polarization Tomography of Metallic
Nanohole Arrays. Opt. Lett. 2005, 30, 90–92.
(127) Kumar, S.; Cherukulappurath, S.; Johnson, T. W.; Oh, S. H. Millimeter-Sized
Suspended Plasmonic Nanohole Arrays for Surface-Tension-Driven Flow-through
SERS. Chem. Mater. 2014, 26, 6523–6530.
(128) Lee, S. H.; Bantz, K. C.; Lindquist, N. C.; Oh, S. H.; Haynes, C. L. Self-
Assembled Plasmonic Nanohole Arrays. Langmuir 2009, 25, 13685–13693.
(129) Vogel, N.; Goerres, S.; Landfester, K.; Weiss, C. K. A Convenient Method to
Produce Close- and Non-Close-Packed Monolayers Using Direct Assembly at the
Air-Water Interface and Subsequent Plasma-Induced Size Reduction. Macromol.
Chem. Phys. 2011, 212, 1719–1734.

References
104
(130) Samanta, S.; Locklin, J. Formation of Photochromic Spiropyran Polymer Brushes
via Surface-Initiated, Ring-Opening Metathesis Polymerization: Reversible
Photocontrol of Wetting Behavior and Solvent Dependent Morphology Changes.
Langmuir 2008, 24, 9558–9565.
(131) Dattilo, D.; Armelao, L.; Fois, G.; Mistura, G.; Maggini, M. Wetting Properties of
Flat and Porous Silicon Surfaces Coated with a Spiropyran. Langmuir 2007, 23,
12945–12950.
(132) Athanassiou, A.; Lygeraki, M. I.; Pisignano, D.; Lakiotaki, K.; Varda, M.; Mele,
E.; Fotakis, C.; Cingolani, R.; Anastasiadis, S. H. Photocontrolled Variations in
the Wetting Capability of Photochromic Polymers Enhanced by Surface
Nanostructuring. Langmuir 2006, 22, 2329–2333.
(133) Xu, Y.; Greeley, J.; Mavrikakis, M. Effect of Subsurface Oxygen on the Reactivity
of the Ag(111) Surface. J. Am. Chem. Soc. 2005, 127, 12823–12827.
(134) Bao, X.; Muhler, M.; Pettinger, B.; Uchida, Y.; Lehmpfuhl, G.; Schlögl, R.; Ertl,
G. The Effect of Water on the Formation of Strongly Bound Oxygen on Silver
Surfaces. Catal. Letters 1995, 32, 171–183.
(135) Bahsoun, H.; Chervy, T.; Thomas, A.; Börjesson, K.; Hertzog, M.; George, J.;
Devaux, E.; Genet, C.; Hutchison, J. A.; Ebbesen, T. W. Electronic Light-Matter
Strong Coupling in Liquid Fabry-Perot Nanocavities. ACS Photonics 2017,
Submitted.
(136) Casey, S. R.; Sparks, J. R. Vibrational Strong Coupling of Organometallic
Complexes. J. Phys. Chem. C 2016, 120, 28138–28143.
(137) Trichet, A. A. P.; Foster, J.; Omori, N. E.; James, D.; Dolan, P. R.; Hughes, G. M.;
Vallance, C.; Smith, J. M. Open-Access Optical Microcavities for Lab-on-a-Chip
Refractive Index Sensing. Lab Chip 2014, 14, 4244–4249.
(138) Paul, S.; Heng, P. W. S.; Chan, L. W. Optimization in Solvent Selection for
Chlorin e6 in Photodynamic Therapy. J. Fluoresc. 2013, 23, 283–291.
References
105
(139) Zenkevich, E.; Sagun, E.; Knyukshto, V.; Shulga, A.; Mironov, A.; Efremova, O.;
Bonnett, R.; Songca, S. P.; Kassem, M. Photophysical and Photochemical
Properties of Potential Porphyrin and Chlorin Photosensitizers for PDT. J.
Photochem. Photobiol. B Biol. 1996, 33, 171–180.
(140) Kay, A.; Humphry-Baker, R.; Graetzel, M. Artificial Photosynthesis. 2.
Investigations on the Mechanism of Photosensitization of Nanocrystalline TiO2
Solar Cells by Chlorophyll Derivatives. J. Phys. Chem. 1994, 98, 952–959.
(141) Ferguson, G. S.; Chaudhury, M. K.; Sigal, G. B.; Whitesides, G. M. Contact
Adhesion of Thin Gold Films on Elastomeric Supports: Cold Welding under
Ambient Conditions. Science (New York, N.Y.). 1991, pp 776–778.
(142) Kéna-Cohen, S.; Davanço, M.; Forrest, S. R. Strong Exciton-Photon Coupling in
an Organic Single Crystal Microcavity. Phys. Rev. Lett. 2008, 101, 116401.
(143) Ballarini, D.; De Giorgi, M.; Gambino, S.; Lerario, G.; Mazzeo, M.; Genco, A.;
Accorsi, G.; Giansante, C.; Colella, S.; D’Agostino, S.; Cazzato, P.; Sanvitto, D.;
Gigli, G. Polariton-Induced Enhanced Emission from an Organic Dye under the
Strong Coupling Regime. Adv. Opt. Mater. 2014, 2, 1076–1081.
(144) Würth, C.; Grabolle, M.; Pauli, J.; Spieles, M.; Resch-genger, U. Relative and
Absolute Determination of Fluorescence Quantum Yields of Transparent Samples.
Nat. Protoc. 2013, 8, 1535–1550.
(145) Kay, A.; Humphry-Baker, R.; Gratzel, M. Artificial Photosynthesis. 2.
Investigations on the Mechanism of Photosensitization of Nanocrystalline TiO2
Solar Cells by Chlorophyll Derivatives. J. Phys. Chem. 1994, 98, 952–959.
(146) Cortese, E.; Lagoudakis, P.; Liberato, S. De. Collective Optomechanical Effects in
Cavity Quantum Electrodynamics. arXiv 2017, 1–6.

106
Publication:
H. Bahsoun, A. Thomas, T. Chervy, K. Börjesson, M. Hertzog, J. George, E. Devaux, C.
Genet, J.A. Hutchison, T.W. Ebbesen. Light-Matter Strong Coupling in Liquid Fabry-
Perot Nanocavities. ACS Photonics, accepted.
___________________________________________________________________
List of Attended Conferences:
1. H. Bahsoun, A. Thomas, T. Chervy, K. Börjesson, M. Hertzog, J. George, E. Devaux, C.
Genet, J.A. Hutchison, T.W. Ebbesen; Poster “Light-Matter Strong Coupling in Liquid
Fabry-Perot Nanocavities”; Advanced Nanomatierials - Nanotech Conference 28-30/
06/2017, Paris
2. H. Bahsoun, A. Thomas, T. Chervy, K. Börjesson, M. Hertzog, J. George, E. Devaux, C.
Genet, J.A. Hutchison, T.W. Ebbesen; Poster “Light-Matter Strong Coupling in Liquid
Fabry-Perot Nanocavities”; Photochemistry and photophysics - ICP 16-21/07/ 2017,
Strasbourg

Résumé Version Française
107
Introduction:
Au cours des dernières années, des études ont montré que le couplage fort entre la
matière et la lumière et la formation associée d'états hybrides lumière-matière (Figure 1)
donnent lieu à des différente propriétés moléculaires et matérielles de celles des
constituants originaux, à savoir le mode de lumière et la molécule subissant le couplage.
Le régime de couplage fort (SC) a été exploré en détail dans différentes configurations
expérimentales et étudié théoriquement par de nombreux groupes.1–21 Des exemples de
processus et propriétés modifiés sous couplage fort sont le taux de transfert d'énergie non-
radiatif,11 la conductivité12 et la fonction de travail des matériaux semi-conducteurs13 et le
rendement quantique d’émission.1
Figure 1. (a) Représentation schématique du couplage fort d'une transition moléculaire d'énergie ℏωm et
d'une résonance optique d'énergie ℏωph formant les états hybrides P + et P- séparés par l'énergie de séparation
de Rabi ℏΩ𝑅.
Nous rappelons que lorsqu'un matériau avec un moment dipolaire de transition bien
défini est placé dans un environnement électromagnétique (EM) avec des modes propres
qui résonnent avec l'énergie d’une transition du matériau, ils peuvent interagir en
échangeant de l'énergie grâce à des événements successifs d'émission et d'absorption. Si le
taux de change de l'énergie est plus rapide que toute dissipation dans le système,
l'interaction donnera lieu à la formation de deux nouveaux états hybrides ou polaritoniques,
et on dit que le système est dans le régime de couplage fort.14 Les deux nouveaux états, P
+ et P- représentés sur la figure 1a, sont séparés par une énergie appelée « séparation de
Rabi » ℏΩ𝑅 (Figure 1). La théorie montre que même lorsque le nombre de photons dans

Résumé Version Française
108
le système passe à zéro, la séparation de Rabi a encore une valeur finie. Ceci est dû à
l'interaction du matériau avec les fluctuations d'énergie du point zéro du mode confiné.15
Dans ce cas, le système est dit dans le régime de Rabi du vide, les conditions de toutes nos
expériences durant cette thèse. Pour un système avec N molécules couplées avec un mode
résonnant, la séparation de Rabi est directement proportionnelle à la racine carrée de la
concentration de molécules couplée au champ : ℏΩ𝑅 ∝ √N 𝑉⁄ = √𝐶. Ainsi, la diminution
de la concentration est une façon d'amener le système du régime de couplage fort au
couplage faible.
Figure 2. (a) Représentation schématique du couplage d'un système de réseau avec une périodicité a,
indiquant la direction du vecteur ksp du moment du plasmon de surface. Le champ électrique évanescent (Ez)
à l'interface métal-diélectrique est représenté par la ligne noire sur le côté droit de la figure. (b) Exemple
schématique de l'amplitude des premier et deuxième modes de cavité Fabry-Pérot (FP) confinés entre deux
miroirs métalliques parallèles.
L'environnement électromagnétique nécessaire pour le couplage fort de la matière
légère peut être réalisé expérimentalement par plusieurs méthodes telles qu'une cavité
Fabry-Perot (FP) ou des résonances plasmons de surface de nanostructures métalliques16
(Figure 2). Dans nos premières expériences, nous avons utilisé des réseaux de trous
périodiques afin de générer les polaritons de plasmon de surface (SPP) associés aux modes
photoniques confinés à la surface d'un métal (Figure 2a). Ensuite, nous avons utilisé une
cavité de Fabry-Pérot (FP) composée de deux miroirs parallèles séparés par une distance
d qui est égale à un multiple de la moitié de la longueur d'onde du mode EM souhaité
(Figure 2b). Nous pouvons diviser le travail principal de la thèse en deux parties, qui sont
brièvement présentées comme suit:

Résumé Version Française
109
- Dans la première partie, le couplage de la transition électronique moléculaire de
merocyanine (MC) aux SPP résonnants a été exploré pour étudier sous couplage
fort les modifications de la propriété de surface, en particulier l’énergie de surface
par les changements dans les angles de mouillage de H2O.
- Dans la deuxième partie, nous décrivons le développement d'une méthode efficace
et facile pour la fabrication de cavités FP nano-fluidiques qui permettent d’étudier
le couplage fort de molécules en solution ayant des transitions électroniques dans
le visible. Pour démontrer le potentiel de ces FP nano-fluidiques, nous avons étudié
les propriétés photo-physiques des molécules de Chlorin e6 (Ce6) en fonction du
désaccord avec les modes de cavité. Nous montrons l’évolution de la durée de vie
radiative et le rendement quantique d’émission de Ce6 en solution liquide dans les
deux régimes de couplage faible et fort. Ce travail ouvre de nouvelles perspectives
pour étudier des processus physico-chimiques en solution sous couplage fort.
Résultats et Discussions:
En 2013, Hutchison et al ont montré que la fonction de travail des molécules
photochromiques de merocyanine (MC) pouvait être modifiée par couplage fort avec des
SPP résonnants.13 Un tel changement devrait entraîner à son tour un changement de la
polarisabilité du milieu et donc de l'énergie libre de surface. Une façon de tester l'existence
d'un tel changement consiste à mesurer l'angle de contact à l'interface entre des gouttelettes
de liquide et la surface d'un film mince de molécules MC incorporées dans la matrice
polymère PMMA, avant et après son couplage à des SPP résonnants (Figures 3a et 3b). Ici,
nous notons que le spiropyran (SPI) est une molécule transparente dans le spectre visible
qui peut être photo-isomérisée en MC sous irradiation UV, le processus inverse ayant lieu
sous irradiation avec de la lumière visible. Cette qualité devait nous permettre de passer de
manière réversible du couplage faible au fort en utilisant le même échantillon et d'acquérir
des mesures dans des conditions où toutes les autres variables étaient constantes.17,18
Pour observer l’interaction entre des gouttelettes d’eau et le système fortement
couplé, il nous a d’abord fallu développer une technique pour graver au FIB (faisceau à

Résumé Version Française
110
ions focalisés) des réseaux périodiques dans un film d’Ag plus grand que les gouttelettes
à mesurer, c’est-à-dire environ 1 mm x 1 mm (Figure 3c). La périodicité des réseaux est
choisie pour générer des SPP ayant un mode résonnant avec le pic d’absorption de MC à
560 nm. Un couplage fort entre MC et SPP a ainsi été obtenu avec une séparation de Rabi
~ 470 meV (Figure 3d). Les mesures de l'angle de contact ont ensuite été effectuées à la
surface de MC mélangées dans une matrice polymère de PMMA étalée sur la surface des
réseaux de trous par centrifugation (spin-coating).
Figure 3. (a) Illustration schématique de l'expérience, montrant une gouttelette d’eau sur la couche de MC
déposée au-dessus des trous gravés dans le film d'Ag et l'angle de contact (θc). (b) Une image de deux gouttes
d'eau reposant sur la surface de la couche MC sur et hors du réseau de trous. (c) image SEM des grands
réseaux de trous de 1 mm x 1 mm gravés à l'aide du système FIB Auriga. (d) Les spectres de transmission
du réseau de trous Ag (bleu), avec une couche de SPI (vert) et avec la MC (rouge) respectivement.
Après de nombreux efforts, nous n’avons pas pu démontrer que l'angle de contact
de l’eau est modifié aux interfaces eau-SPI et eau-MC même sous couplage fort. En effet,
ces mesures se sont avérées très difficiles car nous avons constaté que les gouttelettes d'eau
laissent un impact significatif sur la structure du film solide, ce qui entraîne des

Résumé Version Française
111
changements immédiats dans les valeurs de l’angle de contact.22 Après la caractérisation
de ces modifications structurales utilisant la microscopie électronique à balayage (SEM),
la microscopie à force atomique (AFM) et l'analyse par diffraction des rayons X
électroniques (EDX), nous avons pu conclure que l’évaporation des gouttelettes affecte la
rugosité de la surface du film polymérique et pouvait aussi laisser localement des impuretés
(telles que Cl et Na) même lorsque nous utilisions de l’eau purifiée. Ces changements
affectent non seulement la valeur de l'angle de contact pour une seule mesure, mais aussi
rend très difficile la possibilité d'effectuer d'autres mesures sur le même ensemble de trous
et de garantir la reproductibilité des résultats.
Dans un autre axe de recherche, nous avons cherché à explorer le couplage fort de
molécules dans des solutions liquides car c'est la condition naturelle de nombreux
processus moléculaires. Les expériences dans des solutions liquides n'ont été réalisées à ce
jour que pour un couplage fort vibrationnel qui est facilité par le fait que les transitions
vibrationnelles sont dans l'IR, ce qui permet d'utiliser des cavités micro-fluidiques FP2,19-
21 (e.g. espacement des miroirs ~ 10 μm). En revanche, le couplage fort électronique de
molécules en solution liquide n'a pas jamais été signalé pour la simple raison que la
longueur de la cavité dans le visible doit être de l'ordre de 100 nm, ce qui est techniquement
très difficile à fabriquer. Entre autres, les miroirs de la cavité FP nano-fluidique (Figure
1b) doivent être uniformément plats sur une échelle beaucoup plus petite que la longueur
de la cavité et la cavité doit être accessible à la solution.

Résumé Version Française
112
Figure 4. Spectres dispersifs de réflexion (a) à haute concentration (régime de couplage fort) et (b) à faible
concentration (couplage faible) pour des cavités remplies de solution Ce6 / DMF résonnant avec l'énergie de
transition du Ce6 (lignes pointillées). Les courbes de dispersion d'émission provenant des mêmes cavités
sont indiquées en (c) et (d).
Dans ce travail de thèse, nous avons développé un processus original de fabrication
des cavités FP nano-fluidiques accordables sur une large gamme de longueurs d'ondes
visibles qui peuvent être remplies de liquides. Cette technique, détaillée dans la thèse,
combine de la gravure au FIB, ainsi que de la soudure à froid sous pression des miroirs
formant la cavité FP. Ces cavités ont un facteur de qualité suffisant pour être utilisé dans
des expériences de couplage fort. Pour illustrer le potentiel de ces cavités, nous avons
étudié les propriétés photo-physiques d'un analogue de la chlorophylle, Chlorin e6 (Ce6),
dans les régimes de couplage faible et fort. En particulier, nous comparons le rendement
1.6
-6 -4 -2 0 2 4 6
775
2
1.9
1.8
1.7En
ergy
(eV
)
Wavelen
gth (n
m)
Reflection R%Reflection
k// (μm¯¹)
1
0.8
0.6
0.4
0.2
0
620
670
688
653
729
Strong Coupling Weak Coupling
(a) (b)
(c) (d)
2
1.9
1.8
1.7
1.6
-6
Wavelen
gth (n
m)
Reflection
En
ergy
(eV
)
k// (μm¯¹)
-4 -2 0 2 4 6
1
0.8
0.6
0.4
0.2
0
Wavelen
gth (n
m)
R%
620
670
688
653
729
775
2
1.9
1.8
1.7
1.6
Wavelen
gth (n
m)
1300
1000
700
400
0
IntensityEmission
En
ergy
(eV
)
k// (μm¯¹)
-6 -4 -2 0 2 4 6
620
670
688
653
729
775
2
1.9
1.8
1.7
1.6
Wavelen
gth (n
m)
IntensityEmission
En
ergy
(eV
)
k// (μm¯¹)
7000
-6 -4 -2 0 2 4 6
6000
5000
4000
3000
2000
1000
0
620
670
688
653
729
775

Résumé Version Française
113
quantique d'émission et la constante radiative en fonction du désaccord dans les deux
régimes qui met en évidence les caractéristiques distinctes de la condition de couplage fort.
Des solutions de Ce6 dans le di-méthyl-formamide (DMF), à haute concentration
(0,18 M) et faibles concentration (3,6 mM) ont été introduites dans les nano-cavités par
capillarité. Des exemples des spectres de dispersion d'émission et de réflexion pour ces
deux concentrations dans les cavités sont montrés dans la Figure 4. L’anti-croisement
(séparation de Rabi) en réflexion (Figure 4a) a une valeur de ca. 110 meV, qui est plus
large que la pleine largeur à mi-hauteur du pic d'absorption moléculaire (67 meV) et de la
résonance FP (62 meV). Le système est donc clairement dans le régime de couplage fort.
Les états polaritoniques sont dispersifs en raison du caractère photonique qu'ils héritent du
mode FP. Lorsque la concentration est diminuée d'un facteur d’environ 50 tel que dans la
Figure 4b, il n’y a plus d’anti-croisement du pic car le système est maintenant dans le
régime de couplage faible.
Figure 5. Le rendement quantique d'émission (a) et (b) en fonction du désaccord du mode cavité dans les
régimes de couplages forts et faibles respectivement pour des solutions de Ce6 dans le DMF. Chaque
cavité est représentée par un cylindre coloré basé sur son désaccord énergétique de mode optique par
rapport à la transition d'absorption de la molécule à 664 nm. Les longueurs d’ondes précises pour chaque
couleur sont en légende. Le cas résonnant est en noir. Les lignes vertes dans (a) et (b) correspondent aux
rendements quantiques d'émission de la molécule nue aux mêmes concentrations.

Résumé Version Française
114
Les valeurs Φ du rendement quantique d'émission ont été calculées et la variation
du rendement quantique d'émission en fonction du désaccord du mode cavité dans les
régimes de couplage fort et faible respectivement (Figures 5a et 5b). Dans le régime de
couplage fort, le rendement quantique maximal est atteint pour la cavité résonnante et
diminue lorsque la cavité est désaccordée dans le bleu ou le rouge. Cependant, une
tendance différente a été observée dans le cas de couplage faible, ici le rendement
quantique d'émission est maximal lorsque le mode cavité chevauche le spectre de
fluorescence de Ce6. Ceci s’explique facilement par le fait que dans ce cas la densité d’état
optique est maximum à la longueur d’émission ce qui augmente la constante radiative kr
pour cette condition et ainsi Φ. De manière générale, on peut constater que les variations
de Φ reflètent principalement les changements dans kr dans les deux régimes de couplage
car la constante non-radiative est quasi-invariante du désaccord de la cavité.
Conclusion:
Durant cette thèse, nous avons exploré différents effets du couplage fort sur les
processus et propriétés moléculaires. Même si les expériences sur le mouillage se sont
avérées infructueuses par rapport au but recherché, cela a été très pédagogique. Nous avons
réussi à préparer des nano-cavités Fabry-Pérot liquides nanométriques qui ont de très
bonnes qualités optiques nécessaires pour observer les effets de couplage fort pour des
solutions moléculaires. En particulier, nous montrons que la nature radiative des états
polaritoniques est améliorée par rapport à ceux des molécules de Chlorin e6 non-couplées.
Notre méthode de fabrication de FP nano-fluidiques est facile et sera accessible à d’autres
chercheurs. Ainsi, les échantillons peuvent être personnalisés selon diverses géométries et
échelles de longueur à des fins expérimentales différentes. L'observation du couplage fort
des transitions électroniques à l'état liquide ouvre la possibilité d'étudier d'autres processus
moléculaires dans ce régime que nous sommes déjà en train d’explorer.

Résumé Version Française
115
References:
(1) Wang, S.; Chervy, T.; George, J.; Hutchison, J. A.; Genet, C.; Ebbesen, T. W. J. Phys. Chem. Lett. 2014, 1433–1439.
(2) Thomas, A.; George, J.; Shalabney, A.; Dryzhakov, M.; Varma, S. J.; Moran, J.; Chervy, T.; Zhong, X.; Devaux, E.; Genet, C.; Hutchison, J. A.; Ebbesen, T. W. Angew. Chemie - Int. Ed. 2016, 11462–11466.
(3) Wang, S.; Mika, A.; Hutchison, J. a; Genet, C.; Jouaiti, A.; Hosseini, M. W.; Ebbesen, T. W. Nanoscale 2014, 7243–7248.
(4) Kéna-Cohen, S.; Forrest, S. R. Nat. Photonics 2010, 371–375.
(5) Vergauwe, R. M. A.; George, J.; Chervy, T.; Hutchison, J. A.; Shalabney, A.; Torbeev, V. Y.; Ebbesen, T. W. J. Phys. Chem. Lett. 2016, 4159–4164.
(6) Chervy, T.; Xu, J.; Duan, Y.; Wang, C.; Mager, L.; Frerejean, M.; Münninghoff, J. A. W.; Tinnemans, P.; Hutchison, J. A.; Genet, C.; Rowan, A. E.; Rasing, T.; Ebbesen, T. W. Nano Lett. 2016, 7352-7356.
(7) Shalabney, A.; George, J.; Hiura, H.; Hutchison, J. A.; Genet, C.; Hellwig, P.; Ebbesen, T. W. Angew. Chemie - Int. Ed. 2015, 7971–7975.
(8) Galego, J.; Garcia-Vidal, F. J.; Feist, J. Phys. Rev. X 2015, 1–14.
(9) Herrera, F.; Spano, F. C. Phys. Rev. Lett. 2016, 1–6.
(10) Litinskaya, M.; Tignone, E.; Pupillo, G. J. Phys. B At. Mol. Opt. Phys. 2016, 164006.
(11) Zhong, X.; Chervy, T.; Wang, S.; George, J.; Thomas, A.; Hutchison, J. A.; Devaux, E.; Genet, C.; Ebbesen, T. W. Angew. Chemie - Int. Ed. 2016, 6202–6206.
(12) Orgiu, E.; George, J.; Hutchison, J. a.; Devaux, E.; Dayen, J. F.; Doudin, B.; Stellacci, F.; Genet, C.; Schachenmayer, J.; Genes, C.; Pupillo, G.; Samorì, P.; Ebbesen, T. W. Nat. Mater. 2014, 1123 - 1130.
(13) Hutchison, J. A.; Liscio, A.; Schwartz, T.; Canaguier-Durand, A.; Genet, C.; Palermo, V.; Samorì, P.; Ebbesen, T. W. Adv. Mater. 2013, 2481–2485.
(14) Haroche, S.; Kleppner, D. Phys. Today 1989, 24–30.
(15) Ebbesen, T. W. Acc. Chem. Res. 2016, 2403–2412.
(16) Törmä, P.; Barnes, W. L. Rep. Prog. Phys. 2015, 13901.
(17) Schwartz, T.; Hutchison, J. A.; Genet, C.; Ebbesen, T. W. Phys. Rev. Lett. 2011, 196405.
(18) Hutchison, J. A.; Schwartz, T.; Genet, C.; Devaux, E.; Ebbesen, T. W. Angew. Chemie - Int. Ed. 2012, 1592–159.
(19) George, J.; Chervy, T.; Shalabney, A.; Devaux, E.; Hiura, H.; Genet, C.; Ebbesen, T. W. Phys. Rev. Lett. 2016, 1–5.

Résumé Version Française
116
(20) Shalabney, A.; George, J.; Hutchison, J. a.; Pupillo, G.; Genet, C.; Ebbesen, T. W. Nat. Commun. 2015, 5981.
(21) Simpkins, B. S.; Fears, K. P.; Dressick, W. J.; Spann, B. T.; Dunkelberger, A. D.; Owrutsky, J. C. ACS Photonics 2015, 1460–1467.
(22) Hejazi, V.; Moghadam, A. D.; Rohatgi, P.; Nosonovsky, M. Langmuir 2014, 9423–9429.