Embed Size (px)
Citation preview

Thrust vectoring experiments with gas injection
Item Type text; Thesis-Reproduction (electronic)
Authors Sekhon, Kalwant Singh, 1938-
Publisher The University of Arizona.
Rights Copyright © is held by the author. Digital access to this materialis made possible by the University Libraries, University of Arizona.Further transmission, reproduction or presentation (such aspublic display or performance) of protected items is prohibitedexcept with permission of the author.
Download date 21/05/2018 08:24:47
Link to Item http://hdl.handle.net/10150/319830

THRUST VECTORING EXPERIMENTS WITH GAS INJECTION
byK. S„ SEKHON
A Thesis Submitted to the Faculty of theDEPARTMENT OF MECHANICAL-ENGINEERING
In Partial Fulfillment of the Requirements For the Degree ofMASTER OF SCIENCE '
In the Graduate CollegeTHE UNIVERSITY OF ARIZONA
1 9 6 4
STATEMENT BY THE AUTHOR
This thesis has been submitted in partial fulfill ment of the requirements for an advanced degree at The University of Arizona and is deposited in the University Library to be made available to borrowers under the rules of the Library. -
Brief quotations from this thesis are allowable without special permission, provided that accurate acknowledgment of the source is made. Request {for permis sion for extended quotation from or reproduction of this manuscript in whole or in part may be granted b|r the head of the major department or the Dean of the Graduate College when in his judgment the proposed use of the material is in the interests of scholarship. In all lother instances, however, permission must be obtained |from the author. ' . • - i ■
SIGNED
■, ■ ti ; I
APPROVAL BY THESIS DIRECTOR' ' ,■ This thesis has been approved on the date;shown below:
ACKNOWLEDGMENTS
The author wishes to express his appreciation to Dr. E. K. Parks and Professor A. R. Yappel of The University of Arizona for their guidance$ encouragement, and suggestions throughout the many academic and project- testing hours necessary for the completion of this thesis.
Thanks are also extended to Mr. 0. B. O'Brien and Mr. Gerard B. Fields for fabricating the exhaust nozzles and various accessory test pieces used in the thesis project.

table of contentsPage
SYMBOLS . viiiCHAPTER
1 INTRODUCTION . . . . . . . . . . . . . . . 11.1 General .............. . . . . . . . 11.2 Thrust Vectoring Methods . .
1.2.1 Jet Vane Method . . .1.2.2 Jetavator Method . .1.2.3 Gimbaled Nozzle Method1.2.4 Rotating Nozzle Method
112351.2,5 Secondary Gas Injection Method 6
1.3 Historical Development . . . . . . . . 71.4 Purpose of the Study . . . . . . . . . 8THEORETICAL CONSIDERATION . . . . . . . . . 92.1 Introduction . . . . . . . . . . . . . 92.2 Thrust Equation . . . . . . . . . . . 92.3 Ideal Rocket Theory .............. 112.4 The Effect of Parameters . . . . . . . 12
2.4.1 Effect of Ambient Pressure . . 122.4.2 Effect of Chamber Pressure . . 132.4.3 Effect of Expansion Area Ratio 14
THRUST VECTORING CONTROL BY SECONDARY INJECTION M E T H O D ...................... . 163.1 Introduction . . . .......... 163.2 Secondary Fluid Injection Concept . . 16

TABLE OF CONTENTS (Contd)CHAPTER . Page
3 THRUST VECTORING CONTROL BY SECONDARYINJECTION METHOD (Contd)3.3 Parametric Concepts . . . . . . . . . 20
3.3.1 Injector Location . . . . . . 203 -3.2 Injection Angle of the Fluid 213.3.3 Penetration of the Injectant 22
4 APPARATUS U S E D ........................ 234.1 Test Apparatus .......... 23
4.1.1 Air S u p p l y ................ 234.1.2 Air Bearings . . . . . . . . 264.1.3 Secondary Air Supply . . . . 284.1.4 Nozzle . . . . . . . . . . . 284.1.5 The Schlieren System . . . . 32
4.2 Pressure and Force Measuring Equipment . . . . . . . . . . . . . . . . 34
4.3 Mass Flow Calculations . . . . . . . 385 TEST PROCEDURE, RESULTS AND DISCUSSION . 40
5.1 Test Procedure . . . . . . . . . . . 405.2 Results and Discussion . . . . . . . 41
5.2.1 Relation of Side Thrust toInjection Flow Rates . . . . 41
5.2.2 Effect of Orifice Area andInjection Pressure . . . . . 52
5.2.3 Schlieren Photographs . . . 525.3 Conclusions ........... 535.4 Recommendations . . . . . . . . . . 54
APPENDIX .............. . . . . . . . . . . . 56REFERENCES................ * ........... 57
V

FIGURES
FIGURE • Page2.1 Fluid Pressure Forces Acting on the Rocket Thrust Chamber Surfaces............. . . 103.1 Secondary Injection Shock Wave Phenomenon 184.1 Test Stand and Basic Test Equipment . . . 244.2 Schematic Diagram of the Test Section . . 254.3 The Compressor with Storage Tank . . . . 2?4«4 Air Bearings and Air Bearing Connector . 294.5 Air Bearing Linkage . . . . . . . . . . . 304.6 Nozzle Sketch . . . . . . . . . . . . . . 314.7 Schlieren System . . . . . . . . . . . . 334.8 Schlieren Arrangement . . . . . . . . . . 324.9 Air Supply for Plenum Chamber and Air
Bearings .................. . 354.10 Force Transducers and Secondary Injection
Arrangement .................... . 364 .11 Side Force Transducer and Air Bearing
Supply Manifold ............ . 374.12 Speedomax Potentiometer and B.C. Bridge
Input Arrangement . . . . . . 39
FIGURES(Contd)FIGURE Page
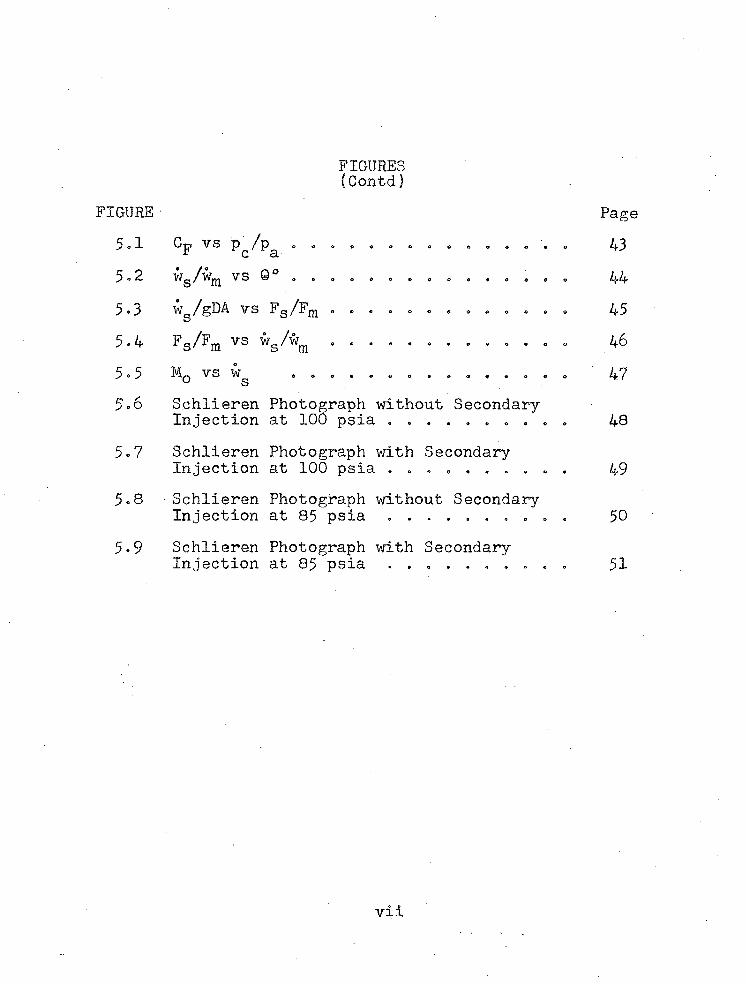
5.1 CF vs pc/pa . . . . . . . . . . . . . . . 435.2 W g v s 9 . . . . . . . . . . . . . . . 445.3 wg/gDA vs Fs/Fm . . . . . . . . . . . . . 455.4 Fs/Fm vs “s ^ m • • • ................... 465.5 v s . . . . . . . . . . . . . . . 475.6 Schlieren Photograph without Secondary Injection at 100 psia . . . . . . . . . . 485.7 Schlieren Photograph with Secondary
Injection at 100 p s i a ............ .. 495.8 Schlieren Photograph without Secondary
Injection at 85 p s i a ............ .. 505-9 Schlieren Photograph with Secondary
Injection at 85 psia .................. 51
vii
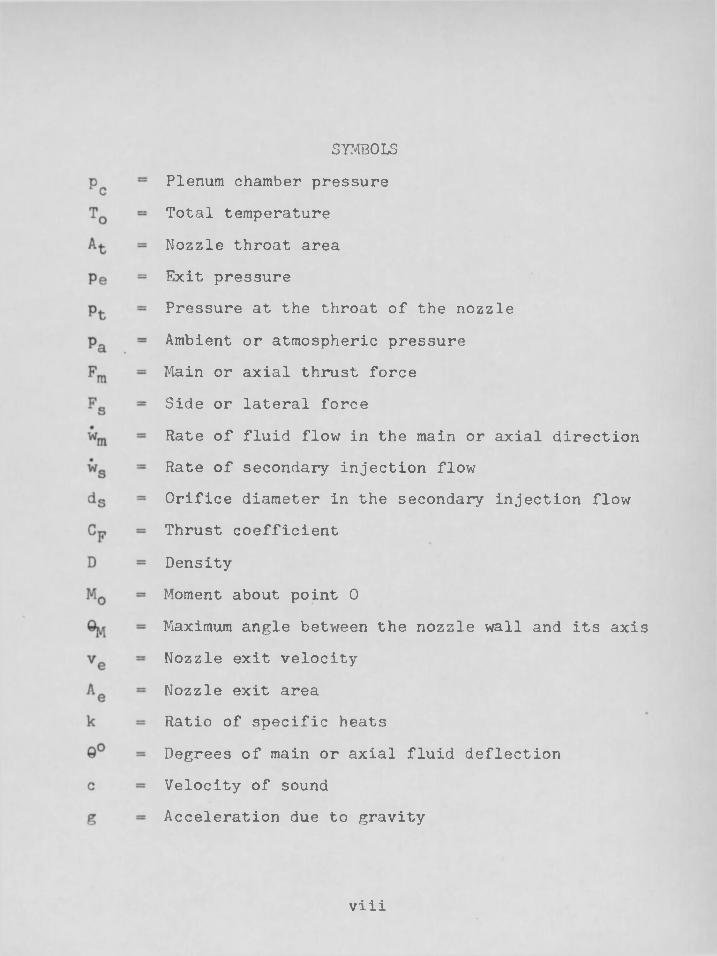
SYMBOLS Plenum chamber pressure Total temperature Nozzle throat area Exit pressurePressure at the throat of the nozzle Ambient or atmospheric pressure Main or axial thrust force Side or lateral forceRate of fluid flow in the main or axial directionRate of secondary injection flowOrifice diameter in the secondary injection flowThrust coefficientDensityMoment about point 0Maximum angle between the nozzle wall and its axisNozzle exit velocityNozzle exit areaRatio of specific heatsDegrees of main or axial fluid deflection Velocity of sound Acceleration due to gravity
viii

ABSTRACT
The technique of obtaining thrust vectoring control by the secondary flow of gas into the supersonic region of a nozzle has been studied. The secondary mass flow is varied by changing the injection pressure and by putting four orifices of different diameters in the secon dary flow. All orifices are round and drilled perpendicular to the wall of the nozzle. Side force as well as axial thrust are measured by the use of force transducer. Calibration of both side force and axial thrust were accomplished through the use of potentiometer arrangement The axial thrust was varied from 95 pounds to 140 pounds while the side force range was 1.25 pounds to 8.48 pounds The maximum plenum pressure attained was 102 psia. Data on the relationship of side force to injectant flow rate, the effect of injection pressure and the effects of injected area were presented and discussed.

CHAPTER I
INTRODUCTION
1.1 GeneralThe problem of steering or ’’vectoring” a solid pro
pellant vehicle becomes more difficult in rocketry as the size and performance increase. Our present-day problem, which a propulsion engineer must face, is to design a thrust vector control nozzle that will operate reliably for a significant time at very high combustion temperatures in a highly erosive environment. The second problem that must be faced is the weight factor. The nozzle in its final configuration should be as light in weight and as inexpensive as possible.
1.2 Thrust Vectoring MethodsMany methods of deflecting the nozzle exhaust
stream of solid rockets to provide thrust vector control have been investigated. These are briefly described in the following paragraphs.
1.2.1 Jet Vane MethodJet vanes are airfoils located in the exhaust
flow of a rocket nozzle, generally immediately aft of the exit plane of the nozzle. When a jet vane is deflected to
1

a given angle of attack, lift and drag forces are produced. The vane lift is the component of the thrust vector normal to the vehicle longitudinal axis, and the vane drag is a decrement or loss in magnitude of the axial component of the thrust vector. The vectorial addition of the vane lift, drag, and rocket thrust force determines the degree of deflection of the rocket thrust vector.
Jet vanes have been widely applied for the control of solid-rocket engines and for early liquid-rocket engines including the German V-2 missile. Advantages of the system include the capability to develop sufficient jet deflection for most applications, rapid response, and relatively low actuation torque and power requirements.
- Disadvantages include constant loss of impulse due to vane drag even at zero angle of attack| substantial material problems in the high temperature propellant gas environment, aggravated by the fact that vanes are constantly immersed in the jet stream with a changing effectiveness because of vane erosion.
1.2.2 Jetavator MethodThe jetavator in its usual form is a closed curved
surface pivoted on the rocket nozzle so that deflection of the jetavator causes it to interfere with the nozzle . jet-stream flow. Deflection of the jetavator causes impingement of the jet stream on the inner surface of the

3jetavator, thereby changing the direction of the Jetstream flow, and consequently the direction of the rocket thrust-vector. A simple pivoted jetavator can be used to provide control in one plane only. Jetavators, however, can be mounted in gimbals or used with multiple rocket nozzles to provide pitch, yaw, and roll control.
The side forces obtained from the jetavator are due to the turning of the supersonic jet stream by the jetavator surface and the consequent increase in static pressure along the jetavator surface. The forces obtain- . able from the jetavator system have been adequate foh most applications, but a quantitative analysis of them must be made experimentally for each particular design.The shape of the jetavator surface and the stream impingement pattern do not lend themselves to theoretical analysis.
Jetavators require a relatively low actuation torque when they are designed to take into account all environmental conditions. There is no loss of impulse with the jetavator due to drag when it is in the neutralposition. Because the jetavator is not continuouslyexposed to the hot gas flow, the material problem is lesssevere than that associated with jet vanes.
1.2.3 Gimbaled Nozzle MethodThe gimbaled or swiveled nozzle changes the direc
tion of the rocket thrust vector by changing the direction

of the nozzle, relative to the center line of the rocket engine.
In such designs, the entire throat and exit cone assembly is pivoted in a suitable bearing structure, so that the axis of the throat-exit cone assembly can be rotated relative .to the central axis of the rocket engine. Swiveled nozzles can be designed to provide for deflection in two planes, in which case the nozzle is referred to as a "gimbaled nozzle.11 The gimbaled nozzle in solid- prepellent engine applications is equivalent to the gimbaled thrust chamber in liquid engine configurations.The moving element of swiveled nozzles is sealed to the fixed portion of the engine by a flexible or dynamic seal system, adequate to withstand the thermal and pressure environment. Depending upon propellant gas characteristics, the swiveled or gimbaled nozzle seal system and the interface between the fixed and moving portions of the nozzle can represent a substantial developmental problem. The advantage of the swiveled nozzle includes its essentially linear control characteristics, because the jet deflects directly with the nozzle, and the absence of drag losses such as are experienced in the jet vane or jet- avator system. In general, actuation torques experienced with swiveled nozzles are higher than with equivalent jetavator or jet-vane systems.
1.2.4 Rotating Nozzle MethodIn the rotating nozzle, the plane of rotation of
the diverging part of the nozzle is skewed relative to a plane perpendicular to the axis of the throat. In the neutral position, the thrust axis corresponds to the central axis of the rocket engine. As the nozzle is rotated, however, the plane of the throat gradually approaches an attitude parallel to the plane of rotation of the nozzle.By shifting the attitude of the throat-exit cone assembly, the jet stream is deflected. The rotating nozzle must always be used in multiple-nozzle sets so that opposite pairs of nozzles can be rotated simultaneously since, as the nozzle rotates to develop a pitch motion, for example, it also develops a yaw misalignment. By rotating a pair of nozzles in opposite directions, the yaw deflections are opposite and cancel each other, while the pitch deflections are mutually additive.
The rotating nozzle has two advantages when compared to a swivel or gimbaled nozzle. The seal system is more nearly a static seal than in the case of the swiveled nozzle, so that the adjustable interface remains in a constant dimensional relationship. In general, the rotating nozzle can be shorter in over-all length than an equivalent swiveled nozzle. The disadvantages include the lack of

6linearity in response and the relatively large motion of the nozzle required for a given jet deflection.
1.2.5 Secondary Gas Injection MethodThis method under study in this thesis is the
injection of secondary gas through the nozzle wall into the main gas stream. This injected gas has the effect of forming a wedge of gas which tends to deflect the main stream gas away from the wall. When the main stream flow is deflected from the wall by this wedge of gas, an oblique shock is formed. The change in momentum of the fluid generates a side or lateral force within the nozzle. Any drag losses which result because of the use of this are considered negligible.
The advantages accruing from the use of the secondary gas injection method include the elimination of actuation force requirements, the possibility of reducing relatively the nozzle weight and the attainment of a more rapid response and higher cyclic rates. Disadvantages of the system are the large quantity of secondary flow necessary to achieve high jet deflections and the difficulty of valvihg high temperature propellant gases if no separate source of -secondary injection fluid is used. When jet deflection requirements are low, however, secondary gas injection can be a highly attractive vector control method.

1.3 Historical DevelopmentThe basic principle of secondary gas injection for
the purpose of generating controlled forces on an aerodynamic surface or body is as old as the science of supersonic aerodynamics. Utilizing this technique for thrust- vectoring control is, however, of more recent origin. Work in this field was first reported in 1952 and was continued
uunder an Air Force contract through 1957. A test program was also conducted by the U. S. Naval Air Rocket Test Station in 1955• Major research and development work has also been carried on at the U. S. Naval Ordnance Test Station at China Lake, California, where the use of liquid injectants has been emphasized as opposed to gaseous injection. The work at NOTS has been carried to the point of proving feasibility of using this method in present- day rockets under static test conditions. The NOTS program has been a prime factor in developing the interest in secondary-injection thrust-vectoring control which exists today.
Moog Servocontrols, Inc., first proposed liquid secondary-injection hardware to NOTS in December, 1959. Since that time the company has been cooperating with a number of missile manufacturers in developing light-weight liquid secondary-injection thrust-vectoring control systems. The initial studies of the secondary-injection
technique, using cold-flow (air) equipment, was reported by United Aircraft Corporation (1)*, and the Naval Ordnance (1) Test Station. Both organizations used gases as the injectant fluids. These studies, in general, indicated that for maximum effectiveness the injected gas should be near the temperature of the main-stream gases. By the use of liquid injectant fluid, the need for high temperature materials may be eliminated. This was demonstrated by NOTS in December, 1959«
■ i . . ■
1.4 Purpose of the StudyThe objective of this study, was to investigate
the feasibility of steering a rocket by injecting gas into the supersonic flow of the nozzle. Injection of secondary gas into the supersonic main-stream causes the stream-jet to be deflected from the wall, thus creating a thrust vector at an angle to the nozzle axis. . The steering is accomplished by the component of the lateral or side force which is perpendicular to the nozzle axis.The study included static tests in the laboratory by injecting room temperature air through a relatively small circular hole into the nozzle main-stream.
* Numbers in parentheses refer to REFERENCES.

CHAPTER 2
THEORETICAL CONSIDERATION '
2.1 Introduction 'In common with all other jet-propulsion engines,
gases are heated and then expanded in the nozzle of rockets. The gas is accelerated rearward to high velocities. Since a force is required to accelerate the rearward moving gases, a reaction force is produced which is evident as the thrust force. The rocket, which carries all its propellants with it, is entirely independent of the atmosphere for a source of thrust, and will actually produce more thrust in space than it does in the atmosphere.
2.2 Thrust EquationThe equation expressing the thrust relationship
for a rocket may be derived by an investigation of the net external forces acting on the over-all rocket system.It may also be derived by the more detailed method of'integrating the pressure forces acting over the internal and external surfaces of the thrust chamber. Either method (11) yields the following equation:
9

10
F = m ve + (pe - pa) Ag (2.1)
whereve = relative exit velocity of the fluid m = mass rate of flow in exit
p e = static pressure in jet exit plane p^ = atmospheric or ambient pressure
The first term of this equation is called momentum thrust, as it represents the net momentum increase of the exhaust gases being accelerated and exhausted from the nozzle at velocity ve.
Figure 2.1Fluid Pressure Forces Acting on
the Rocket Thrust Chamber of Surfaces
This term is then equal to the sum of the axial components of all the internal pressure forces in the thrust chamber. The second term is called the pressure thrust and is the

11algebraic sum of the external pressure forces in the nozzle excluding the exit plane acting over the nozzle exit area.
2.3 Ideal Rocket TheoryThe analysis and design of rocket engines require
a certain degree of idealization of the problem to make a mathematical approach feasible. The following assumptions are made to predict the performance of an "ideal" rocket.
1. The working substance obeys the perfect gas laws
2. The process is isentropic3. The propellant flow is steady and constant4. The gas velocity is uniform across any sec
tion normal to the nozzle axis.
A more convenient expression for the thrust of a rocket is given in terms of its throat area, effective chamber pressure, and thrust coefficient (11):
The values of Cp are usually greater than one and less than two. Cp is defined according to the following expression (11):
T ~ Pc At CF (2.2 )
\(2.3)

12The performance of a rocket system is most com
monly expressed by a quantity called the "specific impulse, " or Ig, which is the thrust.delivered for each pound per second of propellant expanded, or mathematically:
Ig = T/w (2.4)
where w is weight rate of flow.
2.4 The Effect of ParametersThe thrust and specific impulse of a rocket thrust
chamber will be affected somewhat by changes in almost any of the design parameters included in the preceding equations. The following discussion will be limited to the effect of three of the more important and interesting parameters: ambient pressure, effective chamber pressure, and nozzle-expansion area ratio Aq/A^.
2.4.1 Effect of Ambient PressureThe ambient pressure appears in the second or
pressure-thrust term of Equation (2.1). It does not appear in the first or momentum-thrust term because the downstream pressure cannot influence the flow rate or gas velocity in a full-flowing supersonic nozzle. Because appears in the negative term in Equation (2.1), a decrease in ambient pressure such as caused by a rocket traveling to a higher altitude will produce an increase in thrust. This pressure also appears in the equation Cp.

13Equation (2.4) shows that since thrust force increases as ambient pressure is decreased, specific impulse will also increase.
2.4.2 Effect of Chamber PressureThe affect of chamber pressure pc is somewhat more
involved. pc appears in Equation (2.2) as well as in theexpression for Cp, Equation (2.3). In the latter, thechamber pressure appears in the two pressure ratios, pe/pc and Pa/Pc* However, for any full flowing supersonic nozzle, the ratio Pe/pc is dictated by the nozzle area ratio and the gas properties, so that any increase inpc will produce a proportional increase in pe, and theratio will remain constant. pc, therefore, influences the thrust coefficient only through the negative term Pa/pc♦An increase in chamber pressure decreases the negative term, and hence increases Cp.
Since the thrust of a rocket is directly proportional to both pc and Cp in Equation (2.2), an increase in chamber pressure in a given thrust chamber will increase the thrust directly through p^, and indirectly through Cp.
The specific impulse is also proportional to Cp. Therefore, an increase in chamber pressure in a given thrust chamber will also increase the specific impulse.

2.4.3 Effect of Expansion Area RatioIn a supersonic nozzle, the ratio p / p is a uniques c
function of the nozzle expansion area ratio Ae/At. There is, then, some particular expansion area ratio for which the exhaust gases are expanded to an exit pressure which is just equal to the ambient pressure. When an expansion through a nozzle is such that pe = pa, this is referred to as Moptimum expansion" because it results in the maximum thrust. The reason, for this may be seen in Figure2.1, which depicts the pressure distribution characteristics of a rocket thrust chamber.; As the gases expand in the nozzle, the internal pressure on the nozzle wall which contributes to the thrust in the positive direction decreases in value with expansion. Also, as long as this internal pressure is greater than the externally ambient pressure, it is seen that the net force on the nozzle wall is in a forward direction. However, as soon as the internal pressure drops below the ambient pressure, the pressure gradient is in a rearward or negative direction, resulting in a drag rather than a contribution to the thrust.
Any nozzle expansion area ratio greater than the optimum area ratio will expand the exhaust gases to an exit pressure that is lower than the ambient pressure.This condition where p@ is less than pa, the expansion is

15greater than the optimum amount of the expansion and is called "over expansion.8t
Any nozzle expansion area ratio lower than the optimum area ratio will not have a large enough exit area to expand the exhaust gases down to the ambient pressure. When $e is greater than pa, the expansion is less than the optimum amount of expansion and is called "under - expansion."
For rocket systems boosting space vehicles through the atmosphere, a maximum average specific impulse is desired rather than a maximum specific impulse at sea level or any other altitude in particular. The maximum "average" specific impulse is achieved with a nozzle that is over-expanded at sea level and under-expanded at the burn-out altitude. Thus, booster nozzles normally have an area ratio greater than the optimum sea-level area ratio. Out of the atmosphere, an infinite area ratio could theoretically be employed to advantage, but a practical compromise must be reached between high specific impulse and low nozzle weight..

CHAPTER 3
THRUST VECTORING CONTROL BY SECONDARY INJECTION METHOD
3.1 Introduction .Each stage of a rocket-powered missile or other
vehicle usually includes some requirement for main thrust vectoring or the production of a side force by some other means. Mechanical methods of achieving thrust vectoring have been discussed in Chapter 2. In competition with mechanical systems, the secondary fluid injection technique has appeared attractive because this method eliminates the need for mechanical hardware that must be actuated in the extremes of exhaust gas flow. Moreover, during experiments (3) with secondary injection systems, lateral, forces have been produced that greatly exceed the reaction that the secondary flow would furnish if used directly for side force. •
3.2 Secondary Fluid Injection ConceptThe feasibility and compatibility of the secondary
fluid injection principle have been proven, but mathematical analysis has not been developed to the point where exact criteria are available to the designer. In view of the empirical nature of rocket nozzle design, it is
16
doubtful that the design of a secondary fluid injection thrust vectoring system will lend itself to exact theoretical analysis except in a general sense. The empirical design data available up to this time are the results of extensive testing at the U. S. Naval Ordnance (1)(2)(3) Test Station at Lockheed Missile Systems Division at Aerojet General Corporation, and at Hercules Powder Company. -
In order to visualize the phenomena of secondary injection thrust vectoring control, it is convenient to consider a convergent divergent nozzle. The flow from the throat to the exit plane exists in the supersonic regime. If the flow adjacent to the nozzle wall in this supersonic regime is disturbed by the injected fluid to the extent that the boundary layer separates, a shock wave will be generated which will propagate obliquely from the wall. The resultant shock wave will cause the entire fluid flow within the nozzle to feel the effect of the initial disturbance. Because of the character of the main-stream flow and the origin of the disturbances, the shock wave generated will be oblique. As the main gas stream passes through this oblique shock wave, the following changes in the flow occur:
1. Static pressure increases2. Total pressure decreases slightly3. The flow trajectory is altered

The net result of these effects is that a side force is generated that is equivalent to the effect of static pressure rise across the shock wave. This static pressure increase integrated over the shaded area follow ing the shock as shown in Fig. 3.1 should yield the side thrust force. It may also be stated that the induced shock is proportional to the angular deflection of the main rocket gas flow as it passes through the oblique shock. These two effects, in reality, are one and the same and represent a restatement of the law of momentum.
Figure 3.1Secondary Injection Shock Wave Phenomenon

It should be noted that the pressure field down-stream and for a short distance up-stream of the injection point is irregular in character. Fig. 3.1 also attempts to show that the vaporized liquid injectant or the gaseous injectant must occupy the portion of the nozzle volume evacuated by the main gas stream as it deflects through the thrust vector angle.
The total side force obtained by this method is a function of the static pressure rise across the shock wave. By increasing the injectant momentum influx, the main-stream fluid deflection is increased. This, in turn, causes an increase in static pressure which results in a transverse force of greater magnitude.
Theoretically, it can be seen that a saturation limit on the total side force available exists when theentire nozzle cross section aft of the injection point or
Ipoints is included in the shock wave shadow' area. In the practical case there is little likelihood of reaching this limit.
A second saturation limit, which more realistically determines the maximum side force available can be recognized by referring to Fig. 3.1. It can be seen that the shock wave generated by the injection process assumes a steeper angle with reference to the longitudinal nozzle axis than the turning angle of the main gas stream.
20The maximum side force value is attained when the shock wave angle becomes normal enough that the shock wave impinges on the opposite nozzle wall at the exit plane.
3«3 Parametric ConceptsParameters (10) which affect the thrust vectoring
control include injector location, injector angle, type of injector, flow penetration, injector pattern and fluid injected. Each parameter will not be discussed in detail but an outline of a few of these will be given.
3.3.1 Injector LocationTwo contradictory factors must be considered in
the selection of the location for installing a variable area injection valve on the divergent section of the rocket nozzle. It is obvious that injection at the throat would be of little use, because the Mach one condition of the flow at this location would cause a normal shock with resultant flow deceleration and no flow trajectory change. By moving the injection point downstream, the Mach number of primary gas stream approaching the injectant point will be greater. Thus, an advantage is obtained by introducing the injectant down-stream of the throat because the induced shock strength magnitude becomes larger. Shock strength increases with Mach number. Under such conditions, greater .fluid stream deflections may be obtained. By applying one-dimensional

aerodynamic analysis to the aforementioned situation, it was found that the most desirable injection point is at a location approximately 10 to 20 percent of the length of the nozzle, down-stream from the throat.
3.3.2 Injection Angle of the FluidThe secondary injection concept depends upon an
interchange of momentum between the injection stream and main gas stream. Ideally, this would occur in a plane perpendicular to the thrust axis. Because of the significant difference in velocities between the main gas stream and the much lower velocity of the liquid injection stream, it is desirable to aim the liquid injector up-stream into the exhaust nozzle in order to approximate this situation. The up-stream angle of the injectant depends on the velocity magnitudes of the main stream and injection stream.
3.3.3 Penetration of the InjectantPenetration is defined as the physical distance
that the injectant penetrates into the main flow stream. The mechanism of shock wave interaction is not well understood. Empirical data obtained to date, however, indicate that the deeper the penetration of the injectant, the more will the main stream be deflected. In turn, the side thrust force will become greater as the injectant fluid penetration into the main stream becomes greater. Good

penetration is achieved by injecting a concentrated stream of fluid at a relatively high velocity.
CHAPTER 4
APPARATUS USED
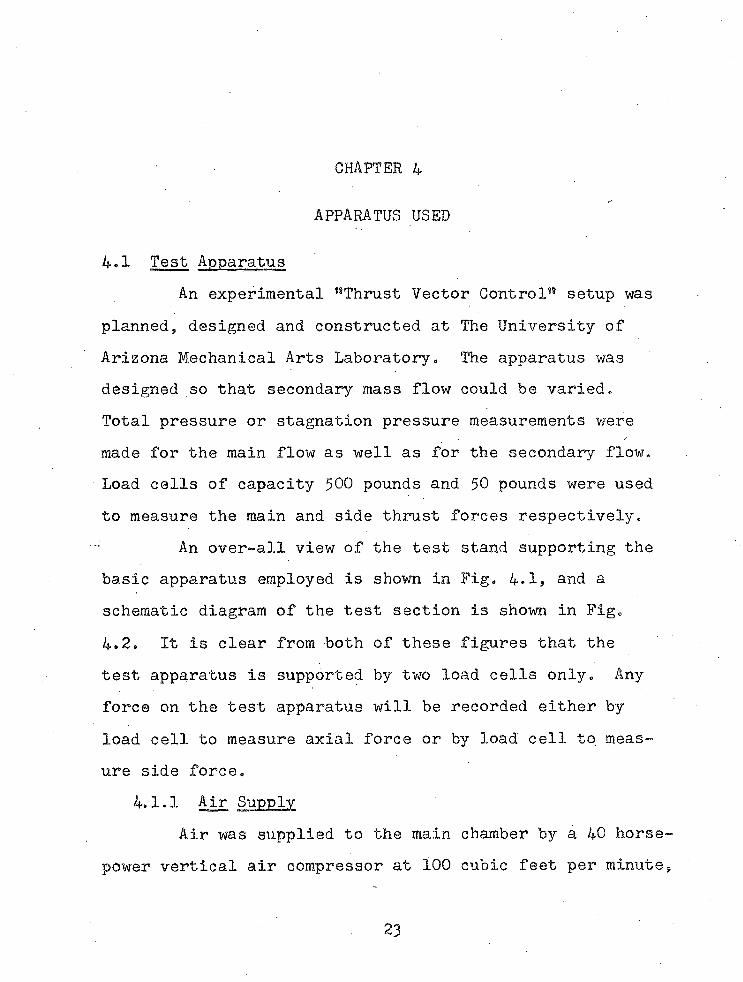
4.1 Test ApparatusAn experimental 18Thrust Vector Control88 setup was
planned, designed and constructed at The University of Arizona Mechanical Arts Laboratory. The apparatus was designed so that secondary mass flow could be varied.Total pressure or stagnation pressure measurements were made for the main flow as well as for the secondary flow. Load cells of capacity $00 pounds and $0 pounds were used to measure the main and side thrust forces respectively.
An over-all view of the test stand supporting the basic apparatus employed is shown in Fig. 4.1, and a schematic diagram of the test section is shown in Fig.4.2. It is clear from both of these figures that the test apparatus is supported by two load cells only. Any force on the test apparatus will be recorded either by load cell to measure axial force or by load cell to measure side force.
4.1.1 Air SupplyAir was supplied to the main chamber by a 40 horse
power vertical air compressor at 100 cubic feet per minute,
23
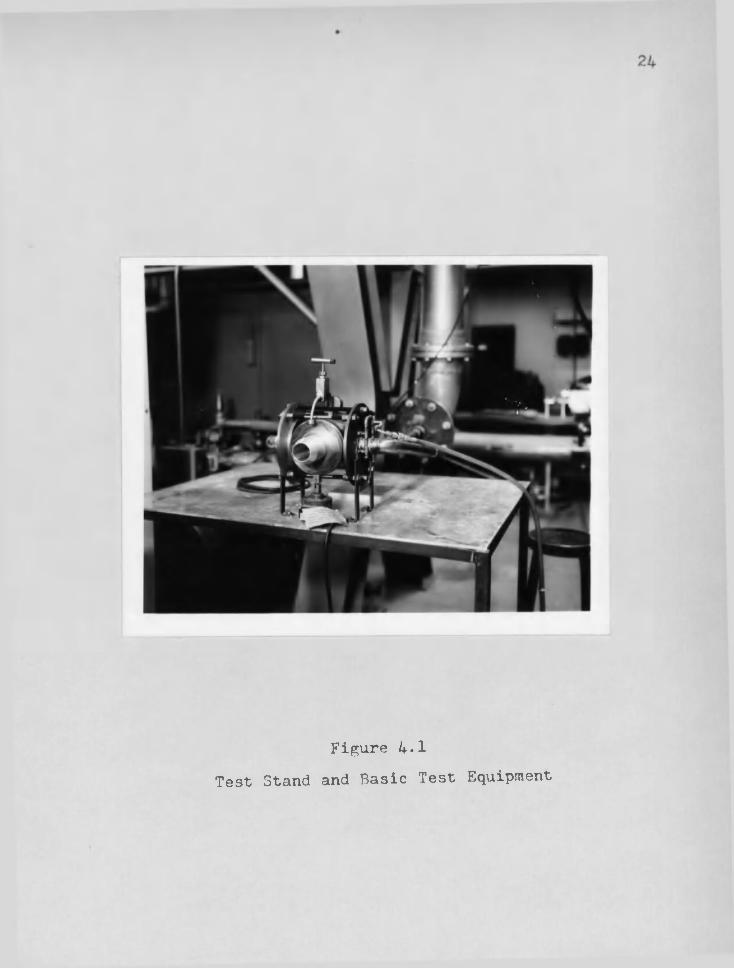
Figure 4.1 Test Stand and Basic Test Equipment

■1*101 X I I
supplytankp0=125psia
valve
MainForceTrans-
\ orificducen
PlenumChamber
Nozzle
Side force transducer
Figure 4.2 Schematic Diagram of the Test Section
26manufactured by Gardner Denver Company. The storage tank capacity was 200 cubic feet and its pressure was set at a pressure of 150 psi. The compressor with storage tank may be seen in Fig. 4.3. This photograph was taken before air supply connections were made for the test apparatus.The air lines connecting the main supply to the test apparatus is shown in Fig. 4.1.
Mass flow in the main flow as well as in the secondary flow was calculated by assuming sonic flow at the throat of the nozzle and at the orifice placed in the secondary flow.
4.1.2 Air BearingsAir at approximately 68°F was supplied to the
plenum chamber of the test apparatus by '2 inch diameter pipes. These pipes were connected to the chamber exactly opposite to each other and perpendicular to the plenum chamber with the intent of eliminating any lateral forces which may be caused by the entering air. These lines were isolated from the plenum chamber by air bearings in order to eliminate any interference with the movement of the nozzle device and to prevent any interference with force transmission and its measurement. Since this is believed to be the first use of air bearings (11) in the literature of nThrust Vectorings Experiments/8 a brief description of air bearings will be made.

Figure 4.3 The Compressor with Storage Tank

28A schematic diagram of the air bearing flange
assembly is shown in Fig. 4.4. The air conduits are completely separated from the plenum chamber by a 0.003 inch air cushion. The air bearings are placed immediately outside of the plenum chamber. The 2-inch plenum chamber delivery lines are rigidly affixed to the frame. Connecting rods link the two restraining plates adjacent to the air bearing pads. The air bearings have a 0.003 inch clearance between the fixed plates and the floating plenum chamber plates.
An air supply at 80 psi was connected to the air bearings through small holes in the face of plates. These holes may be seen in the schematic diagram of air bearings in Fig. 4.4.
4.1.3 Secondary Air SupplySecondary air was injected to the supersonic zone
of the nozzle through one-half inch tubing leading from the plenum chamber. The mass flow was controlled by the use of four orifices of different diameters in the secondary injection flow. An orifice is shown in the schematic diagram of the test section of Fig. 4.2.
4.1.4 NozzleTo investigate the interaction of the injectant
with the main stream gas, a series of experiments was performed in which the pressure distributions in the plenum

29
Figure 4.4 Air Bearings and Air Bearing Connector

Figure 4.5 Air Bearing Linkage

chamber were measured. Two nozzles having pressure expan sion ratios of 11:1 and 7:1 were designed and fabricated. Unfortunately, the first nozzle did not give satisfactory results because the pressure for which it was designed could not be attained due to loss of pressure in the air
supply pipes and elbows. Separation of fluid from the wall occurred before the secondary injection point was reached. The second nozzle was designed at 7 :1 pressure ratio. The ratio of the exit area to the throat area was 2.84. for this nozzle was 6^ degrees. The metal used was aluminum because it was easy to machine.
Figure 4-6Nozzle Sketch

4.1.5 The Schlieren SystemA Schlieren arrangement (6) was used to study the
shock waves at the exit. Figures 4.7 and 4.9 show the Schlieren apparatus. Light from a uniformly illuminated line source of small but finite width is collimated by the first lens and then passed through the test section. Thereafter it is brought to a focus by the second lens and projected on the screen. At the focal point, where there exists an image of the source, a knife-edge is introduced which cuts off part of the light. With no flow in the test section, the knife-edge is usually adjusted so as to intercept about half the light. The screen is uniformly
< L — *
F " v \
Figure 4.8
Schlieren Arrangement

33
Figure 4.7 Schlieren System

illuminated by the-portion of the light escaping the knife- edge. When the flow is established in the test section, any light ray passing through a /region in which there is a density gradient normal to the light direction will be deflected as though it has passed through a prism. Therefore, depending dpon the orientation of the knife-edge with respect to the density-gradient and on the sign of the density-gradient, more or less of the light passing through each part of the section will escape the knife- edge and illuminate the screen.
4.2 Pressure and Force Measuring EquipmentPressure gauges of range from zero to 200 psia
were used to measure plenum chamber pressure and secondary injection pressure. One of these pressure gauges may be seen in Figure 4-9. Force measurements were accomplished by the use of two load cells. One was used to measure axial force and the other was used to measure side force. These load cells were manufactured by Baldwin-Lima- Hamilton Corp. Both of these load cells may be seen in Figures 4.10 and 4.11. The load cells were used in conjunction with a potentiometer and were calibrated in terms of pounds force per millivolt of current. A Leeds and Northrop Speedomax potentiometer was used to record the load cell output voltage accurately. It is shown in

35
Figure 4.9Air Supply for Plenum Chamber and Air Bearings

Figure 4.10Force Transducers and Secondary
Injection Arrangement

Figure 4.11Side Force Transducer and
Air Bearing Supply Manifold

38Fig. 4.12 along with the X-Y recorder and the regulated D.C. power supply.
4*3 Mass Flow Calculations
lated by assuming sonic flow at the throat of the nozzle and at the secondary flow outlet orifice. The following formula (6) was used to calculate the sonic velocity
where c is the sonic velocity, k is the ratio of specific heat Cp/cv. R is the gas constant and T is the absolute temperature of the gas at the throat of the nozzle or at the orifice. Since the Mach number is one at the throat, c is also the velocity of the gas flowing through the nozzle. Therefore, the rate of mass flow is
where w is weight rate of flow, is the throat and is the specific density at the throat.
The main flow as well as secondary flow was calcu
(4.1)
w = c At Dt (4.2)

39
Figure 4.12Speedomax Potentiometer and D. C. Bridge
Input Arrangement

CHAPTER 5
TEST PROCEDURE, RESULTS AND DISCUSSION
5.1 Test ProcedureAn experimental program has been conducted to
investigate the side force generation associated with injection of secondary cold air into the expansion cone of a nozzle for thrust .vector control purposes.
After initially calibrating the force measuring equipment, tests were run at five different plenum chamber pressures varying from 80 psia to 102 psia. The injec- tant pressures were almost the same as the plenum chamber pressures since there was only an insignificant amount of pressure drop in the pipe from plenum chamber to the injection point.
Axial as well as side force measurements were obtained through the use of force transducers of 500 and 50 pounds capacity.respectively. Four orifices, each having a different diameter opening, were used during the tests. The pressure ratios across the orifices were thus controlled from approximately 7.5 to 5.3 in four roughly equal increments. The pressure ratios were maintained so as to be certain that choked flow existed
40

41through the injectant orifices. Experimental data obtained by measurement during the twenty runs were plenum chamber pressure, side force and axial force. Schlieren photographs of the nozzle exhaust gas were also taken.
5.2 Results and DiscussionAll measured data as well as calculated, data were
recorded in Table 5.1. Data from this table were plotted on the graphs presented as Figures 5.1 to 5.5. Schlieren photographs of the exhaust gas from the nozzle for various plenum chamber pressures with and without the secondary air injection are included as Figures 5.6 to 5.9. These were included in order to illustrate the effect of secondary injection in the main stream.
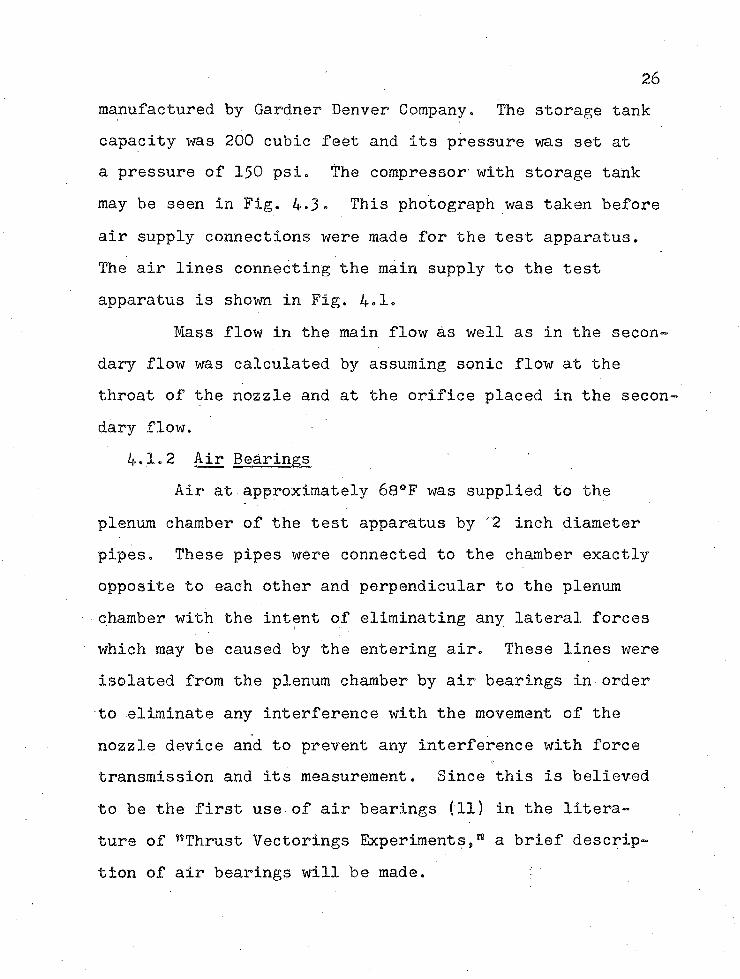
5.2.1 Relation of Side Thrust to Injection Flow Rates Injection fluid flow rates were varied by changing
the injectant pressure and orifice area. The ratio of side force to main stream thrust force (Fs/Fm) was plotted against the ratio of secondary weight rate of flow to main stream weight rate of flow (wg/wm ), in Fig. 5.4. Under these varied conditions, the change in side force with secondary flow was found to be linear. This is what was expected theoretically. The more the flow, the more the rate of change of momentum. This, in turn, gives more side force.

Pa - 13-44 psia TABLE 5-1 x 7.75 =: A yxFmT0 = 68 + 460 = 528R OBSERVED AND CALCULATED DATAAt = 1.1 in2
No JipopsiaMain flow Secondary Flow
f/fs m• 2ws
1Fm /lb/sec
ws 1 lb /sec ds
w /w s m CF 6°in. lE-in Po/Pa
gDA*1 102 139.5 2.6 8.48 0.113 0.25 .061 .0434 1.33 3-51 3 °25' .473 65.8 7.62 95 126.0 2.43 7-12 0.105 0.25 .0568 .0433 1.24 3.29 3°15' .440 55.2 7.13 90 116.0 2.28 6.47 0.994 0.25 .0557 .0437 1.18 3-10 3°12' .429 50.2 6.74 85 106.5 2.16 5.52 0.094 0.25 .0518 .0436 1.15 2.92 2°59' .401 43.0 6.325 80 98.5 2.03 4.92 0.0889 0.25 .050 .0437 1.12 2.78 2*52' .387 38.3 5.956 102 139.5 2.6 7.89 0.0996 0.234 .0567 .0383 1.33 3.10 3°15' .440 60.5 7.67 95 126.0 2.43 6.53 0.092 0.234 .0520 .0379 1.20 2.87 3*0' .405 50.5 7.18 90 116.0 2.28 5.88 .0872 0.234 .0506 .038 1.18 2.73 2*54' .392 45.8 6.79 85 106.5 2.16 4.97 .0824 0.234 .0469 .0381 1.15 2.65 2*42' .364 38.5 6.3210 80 98.5 2.03 4.33 .0786 0.234 .0442 .0382 1.12 2.47 2*32' .345 33.7 5.9511 102 139.5 2.6 6.71 .087 0.219 .0481 .0335 1.33 2.74 2*46* .375 52.0 7.612 95 126.0 2.43 5.35 .0809 0.219 .0424 .0334 1.20 2.54 2*26' .330 41.5 7.113 90 116.0 2.28 4.70 .0765 0.219 .0406 .0333 1.18 2.40 2*20' .315 36.5 6.714 85 106.5 2.16 3.75 .0724 0.219 .0035 .0334 1.15 2.27 2*1' .273 28.2 6.3215 , 80 98.5 2.03 3.15 .0683 0.219 .0321 ■ 0331 1.12 2.15 1*50' .248 24.4 5.9516 102 139-5 2.6 4.46 .0742 0.203 .03191 .0235 1.33 2.28 1*38' .246 1 34.6 7.617 ! 95 126.0 2.43 3.20 .0691 0.203 .0254 .0284 1.20 2.18 1*27' .197 24.8 7.118 90 116.0 2.28 2.45 .0655 0.203 .0211 .0286 1.18 2.04 1*13' .164 19.0 ‘ 6.7(19 85 106.5 2.16 1.62 |.062 0.203 .0152 .0287 1.15 1.91 54' .118 12.5 ! 6.3220 80 98.5 2.03 1.25 .0587 to. 203 • 013.7. .0283 1.12 1.83 47' .107 9 .7 _5u95
ro

1.25 .
- Experimental . Theoretical
pc = chamber pressure pa = ambient pressure Ct? = thrust coefficient
1.15
Cf
1.05
6.755.75 7.0
Figure 5.1 Cp vs Pc/pa

Secondary rate of flowMain rate of flow
tan2° 0'
1°30'
1°0«
0.350.25 0.4Figure 5.2 wg/wm vs ©°

0.6
0.5
m0.4
0.3
0.2 '
w = Secondary Rate of Flowg =
A = D =
Fs = Fm ~
Acceleration due to gravityAreaDensitySide forceMain thrust force
o . i ;1.5 2.0
w2.5s/gDA
Figure 53 w^/gDA vs Fg/?m
3-0 3.5 •p-vn
0.06
0.05-
0.04
0.03
m
0.02-
0.01
0.025 0.03. 0.03 5
Figure 5.4 Fs/Fm vs ws/wm
ws = secondary rate of flowwm = main rate of flowFs = side forceFm = main forcem
0.045£
60 {
50
40
30M Ib-in o
20
10,
M = Moment about 0Secondary rate of flow
0.05 0.06 0.07 0.08, 0.09lb/sec
0.1 0.11 1X12
Figure 5.5 vs wg
►
Figure 5.6Schlieren Photograph Without
Secondary Injection at 100 psia

Figure 5•7Schlieren Photograph With Secondary Injection at 100 psia
Figure 5.8Schlieren Photograph Without
Secondary Injection at 85 paia

51
Figure 5.9Schlieren Photograph With
Secondary Injection at 85 psia

525.2.2 Effect of Orifice Area and Injection Pressure
Variations of side force have been noted when the area of the injection orifice or port was changed. The data that were obtained in this experiment indicate a relation between the rate of change of momentum of the injected fluid to the side thrust developed. By Newton’s Second Law of Motion, 18The rate of change , of momentum is proportional to the force generated.n This relation was verified by plotting the ration of Fs/Fm to wg^/gDA* in Fig. 5.3. The graph indicates linear relationship. This led to the hypothesis that the ratio of side force tomain thrust force was a function of the ratio of the rate
.
of change of momentum of the secondary and primary streams.
5.2.3 Schlieren PhotographsFour Schlieren photographs of the nozzle efflux
are presented from Fig. 5.6 to 5.9. Note on each photograph the plenum chamber pressure at the time each photograph was taken. Two of these photographs (Fig. 5.6 and5.8) indicate offlux of gas without secondary fluid injection. These photographs are taken at 100 psia and 85 psia respectively. The other two photographs. (Fig. 5.7 and 5.9) are taken at 100 psia and 80 psia with secondary injection. It may be seen by comparing Figs. 5.6 to 5.9 that the shock becomes more oblique to the flow at higher pressure. This also indicates the amount of penetration

53of secondary injection into the -main stream is greater as the injection pressure is increased.
5.3 ConclusionsThe general character of the pressure disturbances
associated with the interaction of the injectant and the main stream exhaust has been defined. It needs to be emphasized that the following data were obtained from an injection nozzle that was not optimized for maximum side force and therefore should not be taken as representative of the performance associated with an optimized system. .
The results show the effect of the injectant flow rate, and the injectant pressure of the side force generation. These results are plotted in Fig, 5-3 and Fig.5.4 and are linear. It may be concluded that the greater penetration creates, in effect, a greater equivalent physical obstacle to the main stream flow. Thereby, a stronger shock is created and better mixing of the injectant with the main stream gas is obtained. The above fact is illustrated from Schlieren photographs (Fig. 5.6 through5.9) also.
The effect of injection pressure is illustrated in Fig. 5.1 by the decrease in side force for the lower injection pressure. It. may also be concluded that the space vehicle may be controlled by controlling the secondary injection pressure and flow rate. The aforesaid fact

54is illustrated in Fig. 5.2 and Fig. 5.5. The deflection 0 for the forces becomes greater as the side force Fg is increased.
For maximum specific impulse, the injection port should be located as far down-stream as possible, with the Mach number of the injected gas as high as possible.
For deeper penetration of the secondary fluid into the main stream and higher side force, the secondary gas should.be injected at higher pressure and in the up-stream direction.
5.4 RecommendationsSince a major portion of the side force depends
upon a static pressure recovery of the main-stream gases acting over an assymetrical area within the nozzle, the injectant should provide a large an obstruction as possible to the stream flow. The secondary injectant should be the kind which could react or decompose with a release of heat or, in the case of inert fluid, vaporize and dissociate with a minimum amount of heat absorption. Consequently, the following injectant characteristics are desired (2)»

Low specific heat in liquid and vapor phases Low boiling point Low latent heat of vaporization Low molecular weights of products of combustionHigh density.

APPENDIX
F
Fs x I = Fm x y
M0 = Fm x y
c = kRT w = DAv6 = tan —
FC F = -2 —
56

REFERENCES
1. Bankstonj, L. T., **Thrust Vectoring Experiments."U . S. Naval Ordnance Test Station, China Lake, Calif., NAVORD Dept. 6548, NOTS 2247 (May, 1959).
2. Green, C. J., and Benham, C. B., "Parameters Controlling the Performance of Secondary Injection. U . S. Ordnance Test Station, China Lake, NAVEPS 7743, NOTS 2710 (Dec., 1961). .
3. Green, C. J., and"McCullough, F., Jr., "Liquid Thrust Vectoring Control." U . S. Naval Ordnance Test Station, China Lake, Calif., NAVWERS 7744, NOTS 2711 (June, 1961).
4. Broadwell, J. E., "Analysis of the Fluid Mechanics ofSecondary Injection for Thrust Vector Control," Space Technology Laboratories, Inc., Redondo Beach, Calif.,. (May, 1963).
5. Newton, T, F., Jr., and Spaid, F. W.. "Interaction of Secondary Iniectants and Rocket Exhaust for Thrust
' Vector Control." ARS 77~32, 1203-1211 (l<^2).6., Shapiro, A. H., "The Dynamics and Thermodynamics of
Compressible Flow," The Ronald Press Co., New York,1953, Vol. I.
7. Stanley, I. B., "Weight Factor in Rocket Vectoring." _ Astronautics and Aerospace Engineering, August, 19o3.8. Moak, H., "Thrust Vectoring Control Schemes for Solid
Propellant Rockets," Astronautics, Vol. 7, No. 3,pp. 28-29, March, 1962.
9. Chamay, A. J., and Sederquist, R. A., "An Experimental Investigation of Shock Vector Control with Gaseous Secondary Injection." 2216-6”ARS, Oct., (T96TT.
57

REFERENCES (Contd.)
10. Hawk, G. W., and Geyer, L. H., ^Secondary Injection Thrust Vector Control Systems.n Moog Servocontrols. Inc., Aerospace Engineering, May, (1962).
11. Lackmann, G. V., Boundary Layer and Flow Control, "Experimental Methods for Testing High Lift BLC and Circulation Control Models,” Williams, J., and Butler, S. F., Pergamon Press™' (1961).
m