Embed Size (px)
Citation preview

;F_ =-NASA TechnicalMemorandum 106448- r
, AIAA-93-4014--_..:
Thrust Augmentation options for theBeta II Two-Stage-to-Orbit Vehicle
Christopher A. SnyderLewis Research .Cente__r_..................................
Cleveland, Ohio
Prepared for theAIAA Aircraft Design, Systems and Operations Meeting
sponsored by the American Institute of Aeronautics and AstronauticsMonterey, California, August 11-13, 1993
f
(NASA-TN-10644B) THRUSTAUGMENTATION OPTIONS FOR THE BETA 2TW0-STAGE-TO-ORBIT VEHICLE (NASA)
17 p
G3/07 0198073
https://ntrs.nasa.gov/search.jsp?R=19940017090 2020-04-11T07:46:45+00:00Z

l
Thrust Augmentation Options for the Beta H Two-Stage-to-Orbit Vehicle
Christopher A. Snyder*National Aeronautics and Space Administration
Lewis Research Center
Cleveland, Ohio 44135
ABSTRACT
NASA Lewis Research Center is continuingto study propulsion concepts for a horizontal takeoffand landing, fully reusable, two-stage-to-orbit vehicle.This will be capable of launching and returning a10,000 pound payload to a 100 nautical mile polarorbit using low-risk technology. The vehicle, Beta II,is a derivative of the USA.F/Boeing Beta vehicle
which was designed to deliver a 50,000 poundpayload to a similar orbit. Beta II stages at Math 6.5and about 100,000 feet altitude. The propulsion
system for the booster is an over/under turbine bypassengine/ramjet configuration. In this paper, severaloptions for thrust augmentation were studied in orderto improve the performance of this engine wherethere was a critical need. Options studies wereturbine engine overspeed in the transonic region,water injection at various turbine engine locationsalso during the transonic region, and water injectionat the turbine engine face during high speedoperation. The methodology, constraints, propulsionperformance and mission study results are presented.
INTRODUCTION
This paper is part of NASA Lewis ResearchCenter's (LeRC) on-going study of propulsion systemsfor low-risk replacements for the Space Shuttle.NASA LeRC has been addressing critical design
areas in order to improve the Beta 1I boosterperformance. The purpose of this present study wasto predict the improved vehicle performance due tothe enhancements made to the booster propulsion
system.
The vehicle used for this study, Beta II, is atwo-stage-to-orbit (TSTO) vehicle derived from theUSAF/Boeing Beta vehicle (ref. 1 & 2). Beta II, ahorizontal takeoff and landing vehicle, was
downsized from the original Beta to deliver 10,000pounds to a 100 nautical mile polar orbit. Thevehicle configuration is shown in Figure 1.
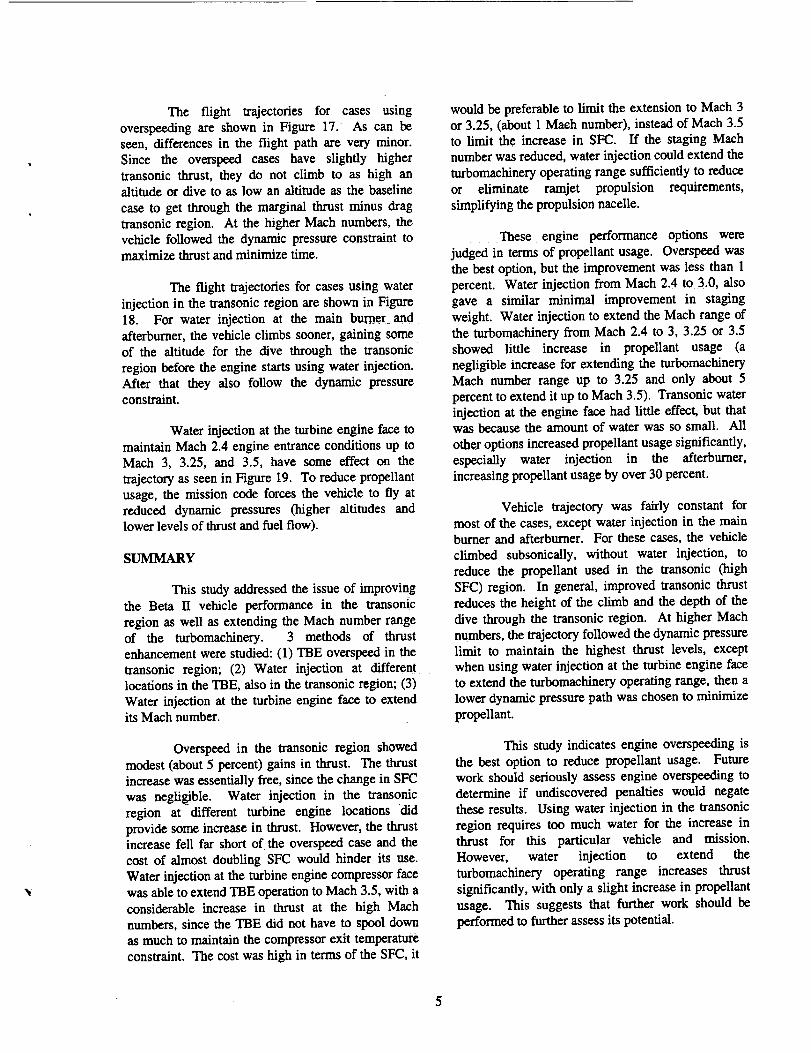
Beta H was designed to be fully reusable,using low-risk and near-term technology. The totaltakeoff weight of Beta II (booster and orbiter) was 1million pounds (ref. 3). The Beta II configurationstudied in this paper had four High-Speed CivilTransport (HSCT) derived turbine bypass engines ontop and one conventional ramjet at the bottom pernacelle (see Figure 2). A standard hydrocarbon jetfuel was used in both main and afterburner of the
HSCT engines and they operated from takeoff toMach 3 or 3.5. The ramjet used hydrogen fuel and
became operational around Math 1.0 until separationoccurred. Also included in this configuration was avariable-capture area inlet for better inlet/engine
airflow matching throughout the flight path.
The Beta H booster propulsion system isfully airbreathing from takeoff to separation at Mach6.5 and 100,000 feet altitude. After separation thebooster returns to its landing site. The orbiter,similar to the Space Shuttle orbiter in appearance, isbottom-loaded within the booster to improve mating
and staging operations. The orbiter was propelled byone Space Shuttle Main Engine. The orbiterpropulsion system operated from booster/orbiterseparation to orbit.
Options looked at in this study includedturbine engine aerodynamic overspeed and water
injection to improve its capability and performance.Mission analysis was then performed to determinethe optimum configuration based on the minimumpropellant used. Description of the engines and, itsconstraints, analysis methods, turbine engine
performance using various options for thrustenhancement and the aceompanying effects on thevehicle will be discussed.
* Aerospace Engineer, Member AIAA

TURBINE BYPASS ENGINE
The turbine bypass engine (TBE) is used inthis study aridis illustrated in Figure 3. The TBE is asingle-spool, turbojet-like engine that should beoptimum for an acceleration mission. The uniquefeature of the "['BE is that it has a bypass valve to
bypasssome airflowaroundthe main burnerandturbine for better compressor-turbineairflow
matching.Thisbypassairisthenmixed withthe
turbineexitflow.Thisallowshighersealevelburner
temperatures, while maintaining acceptablecompressor surge margins. At sea level staticconditions, engine overall pressure ratio was 20.4 andthe turbine bypass ratio (ratio of bypass airflow tomain airflow) was 0.18 at maximum burnertemperatures. From a previous study (ref. 3), theengine corrected airflow was set to 610 pounds persecond. Maximum burner temperature was limited to
3560 °R and the engine was operated to limitmaximum compressor exit temperature to 1810 OR.
Since this is an acceleration vehicle,
maximum afterburning was used to maximize thrust,
except for the 5 percent of airflow used forafterburner liner cooling. The TBE and ramjetairflow are supplied by a common inlet. During TBE
operation, turbine engine airflow is maximized,within its temperature and mechanical speedconstraints, to maximize thrust. The inlet airflow notused by the TBEs is used for the ramjet. The inletand nozzle performance data came from previousBeta II studies and will not be reported here.
RAMJET
The ramjet size was also determined in aprevious study (ref. 4), which set Mach number andaltitude limits for the Beta 1I vehicle. A maximumburner cross-sectional area of 111.3 square feet wasused, with a constant cross-sectional area. Nozzlethroat area was variable to maximize performance.
The ramjet was hydrogen fueled; the fuel-to-air ratiowas set to maximize thrust. However, the fuel-to-airratio was limited to the stoichiometric value, and 5
percent of the ramjet airflow was not burned, but used
for cooling.
METHOD OF ANALYSIS
Several codes were used in performing this
study. The NASA Engine Performance Program(NEPP) (ref. 5), was used to carry out the turbineengine performance analysis. NEPP performs a one-
dimensional, steady-state thermodynamics analysisand includes chemical - equilibrium effects.Compressor and turbine performance maps were usedto model the thermodynamic and aerodynamicperformance of these components. They wereassumed to be similar in technology and performanceto those being used in current High Speed ResearchStudies.
The ramjet performance was calculatedusing RAMSCRAM (ref. 6). RAMSCRAM is a one-dimensional, steady-state code which includeschemical equilibrium effects for a ramjet or scramjetduct. The user sets loss factors for various portions ofthe cycle, such as internal performance factors for theinlet, diffuser or nozzle. The program willautomatically determine the loss in momentum due tothe heat release in the combustor.
The performance data used for the nozzlewas from previous Beta 1I studies using SEAGULL(ref. 7). SEAGULL is a steady-state, inviscid, two-dimensional performance code which uses finitedifferences method. Nozzle performance included
friction, divergence and over or under expansionlosses. The inlet performance data was obtainedusing the Inlet Performance Analysis Code 0PAC)(ref. 8). IPAC makes use of the oblique shock and
Prandfl-Meyer expansion theory for the prediction ofinlet performance and includes additive, bleed, andspillage drags. Since the performance data generatedfor the TBE and ramjet was uninstalled data, theINSTALL code (ref. 9) was used to take into accountthe installation effects of the propulsion system. TheINSTALL code was designed to calculate net
installed propulsion performance at various flightconditions based on uninstalled engine, inlet andnozzle data.
The mission analysis was performed using
the Optimal Trajectories by Implicit Simulationprogram (OTIS) (ref. 10). OTIS simulates andoptimizes point mass trajectories with provisionsmade for free and fixed end constraints, specified way
points and path constraints. OTIS was used to findoptimal trajectories to maximize weight at staging(minimize propellant usage), while satisfyingmaximum dynamic pressure, staging Mach numberand engine operation points constraints. The vehicleaerodynamic and weight data came from previousBeta II studies.
2

DISCUSSION AND RESULTS
For this study, three options were assessed as
means to increase the overall performance of the Beta
II vehicle: (1) Aerodynamic overspeeding of the TBE
in the transonic ( Mach 0.9 to 1.5 ) region in order to
increase thrust and improve the booster's marginal
thrust minus drag performance in that region; (2)
Water injection during the transonic region atdifferent turbine engine locations for the same
purpose mentioned above; (3) Water injection at theturbine engine face to extend the top Mach number of
the turbomachinery from Mach 2.4 up to 3.5.
Uninstalled TBE performance using these options
will be presented and discussed followed by the
mission analysis. Uninstalled thrust was corrected foraltitude effects along the flight trajectory using the
engine face total pressure in atmospheres and is
presented per propulsion module of 4 engines.
Turbine engine specific fuel consumption (SFC) isbased on total propellant used (fuel and water), not
just the JP fuel.
OVERSPEED
Aerodynamic (and mechanical) overspeed ofthe TBE in the transonic was looked at in terms of
performance. Generally turbine engine overspeedingis not used because it increases stress on the rotating
components, increases the chance of compressor stall
by operating in a region of reduced stall margin, and
reduces engine life. However, overspeeding appears
quite practical for short periods in vehicles with short
duty cycles, such as the Beta II booster. In the
transonic region, the vehicle has marginal thrust
minus drag performance. Any increase in
performance would improve acceleration during this
period. For this reason, aerodynamic overspeeding of
7 and 10 percent were investigated to improve engine
and vehicle performance.
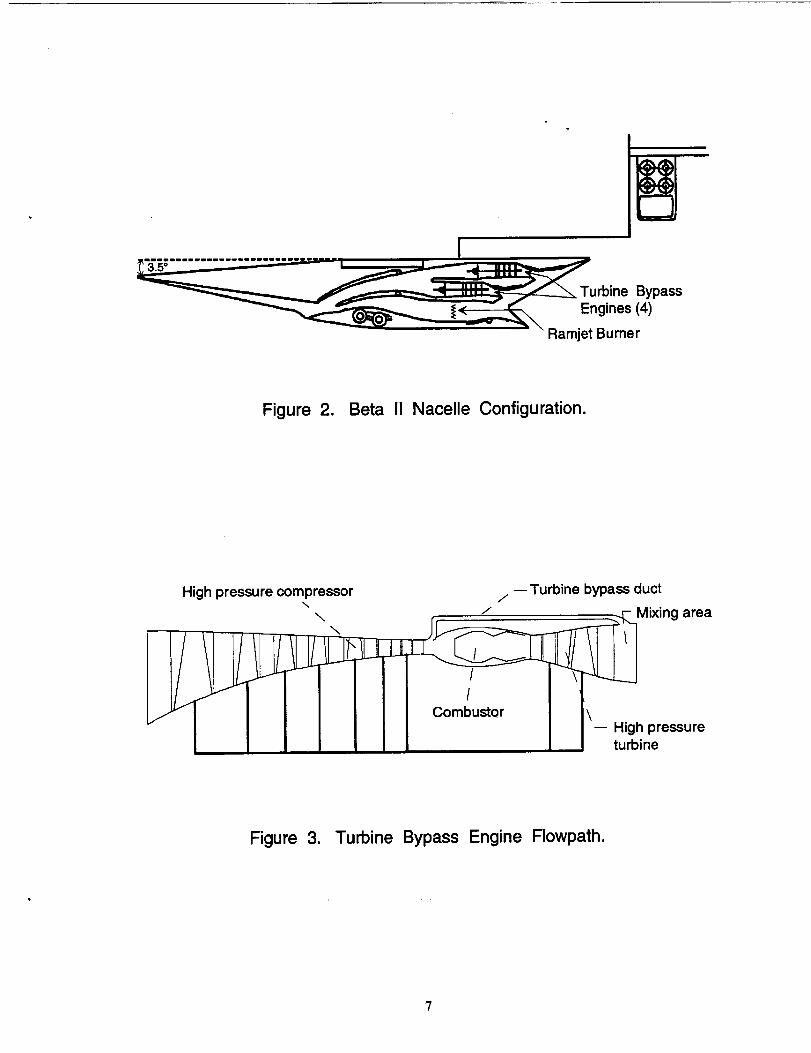
Figure 4 shows that increasing the TBE rpmincreases thrust, as expected. For the 7 percent
overspeed thrust increases just over 5 percent, at 10
percent overspeed, the increase is just under 6
percent. This can be attributed to the increase inairflow, as seen in Figure 5. However, correctedairflow increases about 0.5 percent more than the
thrust. The reason the thrust increase was slightly
l_s than the increase in airflow is due to the slight
decrease in compressor efficiency, which reduced the
nozzle pressure ratio slightly. Since the TBE was runwith the same maximum afterburning (same net exit
fuel-to-air ratio) and the thrust increased almost
directly with airflow, the SFC does not change
significantly for the overspeed case compared to the
baseline case, as shown in Figure 6.
TRANSONIC WATER INJECTION
Water injection was studied to determine its
thrust enhancement potential in the transonic region
to improve the booster's marginal thrust minus drag
performance in this region. Water injection was done
at the turbine engine face, in its main burner and theafterburner. Water addition at the engine face was
limited by the vapor saturation limit. Additional
water added beyond this limit would entail liquid
water droplets impinging on the compressor blades,
hurting its performance. However, significantly
higher amounts of water could be added and
evaporated in the main burner and afterburner.
Figures 7 and 8 shows the ratio of thrust
with and without water injection versus percent water
injected at different locations for the TBE at Mach0.9 and Mach 1.5, the start and end of the transonic
region. The percent water added is the ratio of waterflow rate added, to the mass flow rate entering that
component. Water injection at the engine faceincreases thrust the most for a given amount of water.
This is caused by the cooling effect of the water,
which reduces compressor entrance temperature.This also reduces its work and increases the airflow
slightly. Water injection in the main burner allowsmore fuel to be added in that burner to maintain a
constant exit temperature and some work will bederived from the heated water vapor passing through
the turbine. However, with continuous maximum
afterburning, the engine net exit fuel-to-air ratio is
always at 0.95 of the stoichiometric value, meaningless fuel is added to the afterburner. The cooler
nozzle entrance temperature reduces exhaust velocity,
offsetting the increase in thrust from mass addition
and slightly higher nozzle pressure ratio. Water
injection in the afterburner initially increases thrustdue to mass addition, but the effect is also offset by
the reduction of nozzle exhaust velocity caused by the
reduction of exhaust temperature. At 30 to 40 percent
water injection, the increase in mass addition isinsufficient to overcome the reduction in exhaust
velocity and exit temperature and thrust actuallydecreases with increasing amounts of water. But
before this point, engine SFC was above that of most
rockets and probably would not even be consideredfor use.
To reduce the number of parameters, aconstant ratio of 0.5 percent water was added
throughout the transonic at the turbine engine face, ora constant 8.5 percent water added to the main burneror the afterburner. The percentage water added at the
engine face was set by the minimum required to reachthe saturation limit. For the main burner, 8.5 percent
water injection was chosen for consistency withanother turbine engine cycle run in companionstudies (to be reported), was limited to this value. Asimilar value was chosen for the afterburner for
comparison purposes between the main burner andafterburner cases. As can be seen in Figure 9, for theassumed amounts of water added, thrust increasesmost for the main burner, followed by the afterburner
and the engine face, although it is always less than 4
percent.
Figure 10 shows that corrected airflowincreases slightly when water is added at the turbine
engine face, but does not have any effect for the othercases. This is because water injection at the turbine
engine compressor face reduces the compressorentrance temperature, reducing its work. Thischanges the compressor/turbine matching with a netincrease in turbine engine airflow capability.However, the thrust increase alone does not tell thewhole story. Figure 11 shows that the increase inthrust can be very costly in terms of SFC. For theengine face, the amount of water injection was quitemodest, as was the change in thrust and SFC. But forthe case of water injection in the main burner, theSFC is extremely high. It is even worst for theafterburner. This is due to the fact that the
percentage water added is based on the mass flowentering that component. For the main burner, it isthe total TBE airflow minus the turbine bypass and
turbine cooling flows, or about 70 percent of the totalairflow. For the afterburner, the percentage is based
on total TBE airflow (all bypass and cooling flowshave been added back into the main flow path) plusmain burner fuel, or about 103 percent of total
airflow. This results in 50 percent more water addedto the afterburner case relative to main burner case.
HIGH SPEED WATER INJECTION
The TBE had to spool down above Mach 2 tomaintain the compressor exit temperature limit of1810 °R. Without water injection, the TBE had to beshut down at Mach 3 because of the compressor exit
temperature limit. For a HSCT engine, limited toMach 2.4 entrance conditions, the turbomachinery
would have to shut down before reaching Mach 3.
Water injection at the turbine engine compressor facewas investigated to maintain engine conditionssimilar to the design Mach number of 2.4, up to flightMach numbers of 3.5. Water injection at the engineface seemed to be a viable alternative to using more
expensive or exotic materials capable of the high
temperatures, or shutting down the engine beforedesired.
As shown in Figure 12, modest amounts ofwater would be required to maintain Math 2.4 engineentrance temperatures at speeds up to Mach 3.5. Asseen in Figure 13, water injection past Mach 2.4 alsohelps keep the corrected airflow up. This has severalpositive effects on the engine, versus spooling downthe engine, if further spooling down is possible. Thewater decreases entrance temperature, which reduces
compressor work, and improves compressor correctedspeed, .mass flow, and compression capability. Thisalso increases engine and nozzle pressure ratio,further increasing thrust, as seen in Figure 14.However, there is also a sharp increase in the SFC,
especially at Math 3.5, as shown by Figure 15.
MISSION ANALYSIS
A vehicle with constant aerodynamic
properties and a take-off gross weight of 1 millionpounds was used for the mission analysis (only theengine performance was changed for each case). Thefigure of merit was propellant used. Relativepropellant used was determined by subtracting thebaseline vehicle staging weight from the value foreach case. The baseline staging weight is 853,700
pounds. Negative relative weights indicate a decreasein amount of propellant used, or a possible increase in
payload capability.
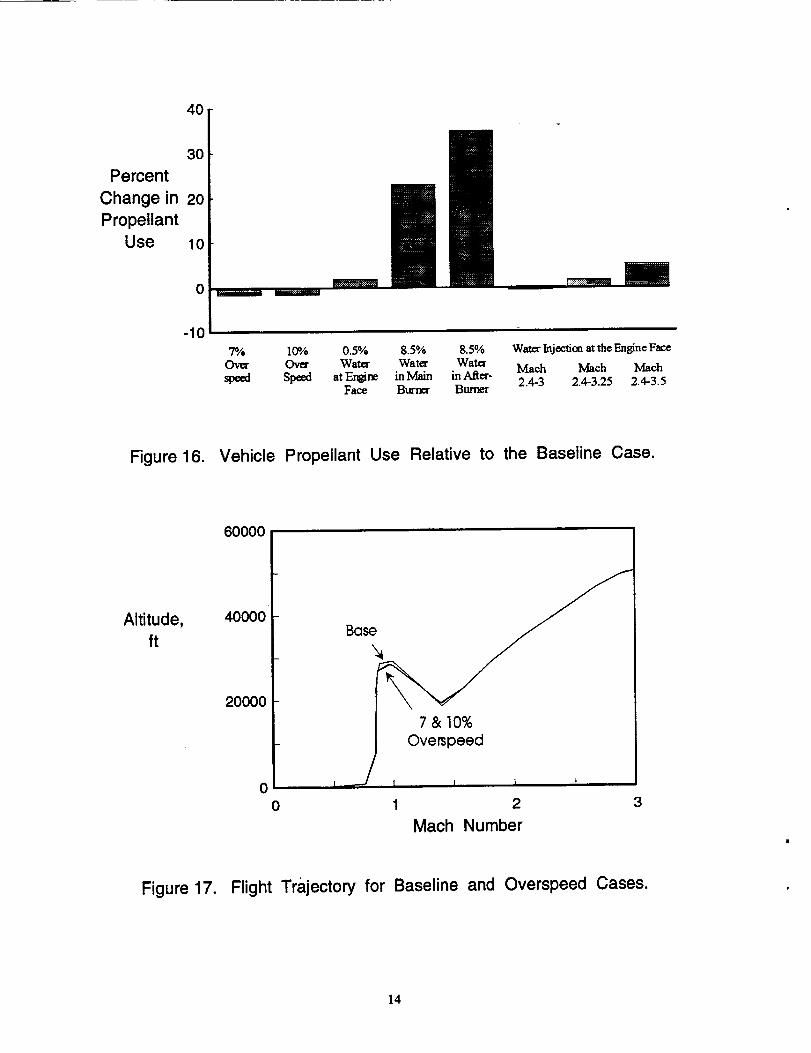
As seen in Figure 16, overspeeding the TBE
produces the greatest decrease in propellant used.This is due to the increase in thrust with no penalty in
SFC. Water injection transonically always increases
propellant usage, due to the small increase in thrustbeing overwhelmed by the much larger increase inSFC. Adding water at the engine face up to Mach 3improves propellant usage because the thrust doubledfor that point, while the SFC only increased by 50percent. For Mach 3.25 and 3.5, SFC is increasingmuch faster than the thrust. But even with the largeincrease in SFC at Mach 3.5, the propellant usage
increase is only about 5 percent.
The flight trajectories for cases usingoverspeeding are shown in Figure 17. As can beseen, differences in the flight path are very minor.Since the overspeed cases have slightly higher
transonic thrust, they do not climb to as high analtitude or dive to as low an altitude as the baseline
case to get through the marginal thrust minus dragtransonic region. At the higher Mach numbers, thevehicle followed the dynamic pressure constraint tomaximize thrust and minimize time.
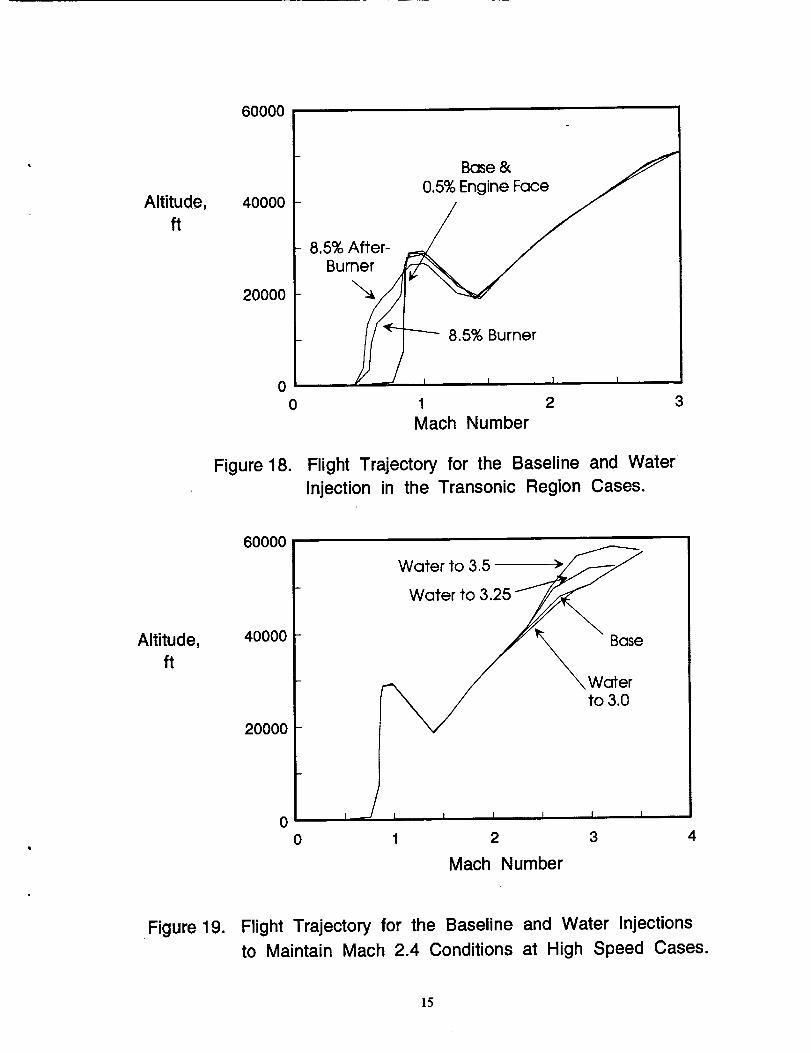
The flight trajectories for cases using waterinjection in the transonic region are shown in Figure18. For water injection at the main burner andafterburner, the vehicle climbs sooner, gaining someof the altitude for the dive through the transonic
region before the engine starts using water injection.After that they also follow the dynamic pressureconstraint.
Water injection at the turbine engine face tomaintain Mach 2.4 engine entrance conditions up toMath 3, 3.25, and 3.5, have some effect on the
trajectory as seen in Figure 19. To reduce propellantusage, the mission code forces the vehicle to fly atreduced dynamic pressures (higher altitudes andlower levels of thrust and fuel flow).
SUMMARY
This study addressed the issue of improvingthe Beta 11 vehicle performance in the transonic
region as well as extending the Mach number rangeof the turbomachinery. 3 methods of thrustenhancement were studied: (1) TBE overspeed in the
transonic region; (2) Water injection at differentlocations in the TBE, also in the transonic region; (3)
Water injection at the turbine engine face to extendits Mach number.
Overspeed in the transonic region showedmodest (about 5 percent) gains in thrust. The thrustincrease was essentially free, since the change in SFC
was negligible. Water injection in the transonicregion at different turbine engine locations didprovide some increase in thrust. However, the thrustincrease fell far short of the overspeed case and thecost of almost doubling SFC would hinder its use.Water injection at the turbine engine compressor facewas able to extend TBE operation to Mach 3.5, with aconsiderable increase in thrust at the high Machnumbers, since the TBE did not have to spool downas much to maintain the compressor exit temperatureconstraint. The cost was high in terms of the SFC, it
would be preferable to limit the extension to Mach 3or 3.25, (about 1 Maeh number), instead of Mach 3.5to limit the increase in SFC. If the staging Math
number was reduced, water injection could extend theturbomachinery operating range sufficiently to reduceor eliminate ramjet propulsion requirements,
simplifying the propulsion nacelle.
These engine performance options were
judged in terms of propellant usage. Overspeed wasthe best option, but the improvement was less than 1percent. Water injection from Mach 2.4 to 3.0, alsogave a similar minimal improvement in stagingweight. Water injection to extend the Mach range ofthe turbomachinery from Mach 2.4 to 3, 3.25 or 3.5showed little increase in propellant usage (a
negligible increase for extending the turbomachineryMach number range up to 3.25 and only about 5
percent to extend it up to Mach 3.5). Transonic waterinjection at the engine face had little effect, but thatwas because the amount of water was so small. All
other options increased propellant usage significantly,especially water injection in the afterburner,increasing propellant usage by over 30 percent.
Vehicle trajectory was fairly constant formost of the cases, except water injection in the mainburner and afterburner. For these cases, the vehicleclimbed subsonically, without water injection, to
reduce the propellant used in the transonic (highSFC) region. In general, improved transonic thrustreduces the height of the climb and the depth of thedive through the transonic region. At higher Machnumbers, the trajectory followed the dynamic pressurelimit to maintain the highest thrust levels, exceptwhen using water injection at the turbine engine faceto extend the turbomachinery operating range, then alower dynamic pressure path was chosen to minimize
propellant.
This study indicates engine overspeeding isthe best option to reduce propellant usage. Futurework should seriously assess engine overspeeding todetermine if undiscovered penalties would negatethese results. Using water injection in the transonicregion requires too much water for the increase inthrust for this particular vehicle and mission.However, water injection to extend the
turbomachinery operating range increases thrustsignificantly, with only a slight increase in propellantusage. This suggests that further work should be
performed to further assess its potential.
5

REFERENCES
1. Plencner,R.M.: Overview of the Beta II Two-
Stage-to-Orbit Vehicle Design. AIAA 91-3175,September 1991.
2. Nadell, S.B.; Baumgarten, W.J.; Alexander, S.W.:Mission And Sizing Analysis for the Beta II Two-
Stage-to-Orbit Vehicle. AIAA 92-1264, February1992.
3. Davic, J.; Midea, A.C.: Propulsion And
Aerodynamic Analysis of the Beta H Two-Stage- to-Orbit Vehicle. AIAA 92-4245, August 1992.
4. Snyder, C.A.; Maldonado, J.J.: The Design andPerformance Estimates for the Propulsion Module forthe Booster of a TSTO Vehicle. AIAA 91-3136,
Sept., 1991.
5. Plencner, R.M.; Snyder, C.A.: The Navy/NASAEngine Program (NNEP89) - A User's Manual.NASA TM-105186, Aug. 1991
6. Burkardt, L.A.; Franciscus, L.C.: RAMSCRAM -
A Flexible Ramjet/Scramjet Engine SimulationProgram. NASA TM-102451, 1990
7. Salas, M.D.: Shock Fitting Method for
Complicated Two Dimensional Supersonic Flows.AIAA Journal, Vol. 14, No 5, May 1976.
8 Midea, A.C.: Mach 6.5 Air Induction SystemDesign for the Beta II Two-Stage-to-Orbit BoosterVehicle. AIAA 91-3196, August 1991.
9. Ball, W.H.: Propulsion System InstallationCorrections Volume 1: Engineers Manual. AFFDL-TR-72-147, The Boeing Company, F 33615-72-C-1580, 1972.
10. Vlases, W.G.; Paris, S.W.; Lajoie, R.M.;
Martens, P.J.; Hargraves, C.R.: Optimal TrajectoriesBy Implicit Simulation Version 2.0. WRDC-TR-90-3056, December, 1990.
GLOW = 1.0 M lb.
EW = 440 K lb.
Growth Mar. = 20% E.W.
MaterialsRene 41Iconel 718
Propulsion8 HSCT TBEs
4 LH ramjets
Stages M = 6.5
L255' 142'
>ti'
Figure 1. Beta Ii Configuration.
_urbine Bypass
Engines (4)
Ramjet Burner
Figure 2. Beta II Nacelle Configuration.
High pressure compressor\
\
--Turbine bypass duct/
Mixing area
Combustor I I \I I'- High pressureI I turbine
Figure 3. Turbine Bypass Engine Flowpath.
7
Thrust
Overspeed
Thrust
Base
1.08
1.07
1.06
1.05
1.04
1.03
1.02
1 .Ol
1.0o
0.99
0.98
0.9
7%"
Base
I ,, I I I ,, I
1.1 1.3
Mach Number
1.5
Figure 4. Effect of Transonic Overspeed on Thrust.
Airflow
Overspeed
Airflow
Base
1.08
1.07
1.06
1.05
1.04
1.03
1.02
1.01
1.00
0.99
0.98
0.9
77%"
Base _
, I I t I I
1.1 1.3
Mach Number
1.5
Figure 5. Effect of Transonic Overspeed on Airflow.

SFCOverspeed
SFCBase
1.08
1.07
1.06
1.05
1.04
1.03
1.02
1.01
1.00
0.99
0.980.9
10%
SBase
L E I I
1.1 1.3
Mach Number
1.5
Figure 6. Effect of Transonic Overspeed on SFC..
1.07
ThrustWater
ThrustBase
1.06
1.05
1.04
1.03
1.02
1.01
1.00
Main
,,//i Engine
/// Face
I I I I i I 1 I i
0 10 20 30 40
(Water Flow/Component Mass flow), Percent
5O
Figure 7. Effect of Water Injection at Mach 0.9.

Thrust
Water
ThrustBase
1.07
1.06
1.05
1,04
1.03
1.02
1.01
1.00
Main
__,/__ Engine
FaceI I I I I I I I I
0 10 2O 30 40 50
(Water Flow/Component Mass flow), Percent
Figure 8. Effect of Water Injection at Mach 1.5.
ThrustWater Inj.
ThrustBase
1.08
1.07
1.06
1.05
1.04
1.03
1.02
1.01
1.00
0.99
0.980.9
8.5% Burner
8.5% After_
0.5% Engine Face
7Base
I 1 t I
1.1 1.3
Mach Number
1.5
Figure 9. Effect of Transonic Water Injection on Thrust.
lo

Airflow
Water Inj.
AirflowBase
1.06
1.05
1.04
1.03
1.02
1.01
1.oo
0.99
0.98
0.97
0.960.9
0.5% Engine Face
fBase, 8.5% Burner & "
8.5% Afterburner Cases
I I 1 I
1.1 1.3
Mach Number
1.5
Figure 10. Effect of Transonic Water Injection on Airflow.
SFCWater Inj.
SFCBase
2.8
2.4
2.o
1.6
1.2
0.8
8.5% Afterburner ,,_
8.5% Burner
0.5% Engine Face
Base
0.4 t i I
0.9 1.1 1.3
Mach Number
1.5
Figure 11. Effect of Transonic Water Injection on SFC.
t]

0.12
Water Flow
Airflow
0.09
0.06
0.03
02.0
Mach Number
Figure 12. Amount of Water Required to MaintainMach 2.4 Temperatures.
Corrected
Airflow,Ib/s
3OOO
25OO
20OO
1500
1000 Base
500 = I I I i J0 1 2 3
Mach Number
Figure 13. Effect of Water Injection at High Mach Numbersto Maintain Mach 2.4 Conditions on Airflow.
12

Corrected
Thrust,
1000s Ibf
400
3oo
2oo
lOO
o
Water Inj.
Base
0 1 2 3Mach Number
Figure 14. Effect of Water Injection at High Mach Numbers
to Maintain Mach 2.4 Conditions on Thrust.
SFC,
Ibm/Ibf-hr
Figure 15.
5
4
3
2
0
Wote
Base
I f I I I I
0 1 2 3
Mach Number
Effect of Water Injection at High Mach Numbres
to Maintain Mach 2.4 Conditions on SFC.
]3
40
30
Percent
Change in 20Propellant
Use lO
o
7% 10% 0.5% 8.5% 8.5% Water Injection at the Engine F_.e
Over Over Water Water Water Mach Mach Machspeed Spt_d atEngir_ inMain inAfter- 2.4-3 2.4-3.25 2.4-3.5
Face Burner Burner
Figure 16. Vehicle Propellant Use Relative to the Baseline Case.
6000O
Altitude,ft
40000
20000
Ba
7 & 10%
Ovetspeed
) J 1 I I I00 1 2 3
Mach Number
Figure 17. Flight Trajectory for Baseline and Overspeed Cases.
14
60000
Altitude,
ft
40000
20000 -
8.5% After-
Burner
Base & f
8,5% Burner
0 I I I
0 1 2 3
Mach Number
Figure 18. Flight Trajectory for the Baseline and Water
Injection in the Transonic Region Cases.
Altitude,
ft
60000
40000
20000
Water to 3,5 -_
Water to 3.25 .f_
/_ '_ Bas\Water e
/ to 3,0
0 I I I I I 1
0 1 2 3 4
Mach Number
Figure 19. Flight Trajectory for the Baseline and Water Injections
to Maintain Mach 2.4 Conditions at High Speed Cases.
15
I Form Approved
REPORT DOCUMENTATION PAGE I OMB NO 0704-0188Pub ic reportng burden for this collection of informationis estimated to average 1 hour per response, includingthe time for reviewing instructions,searchingexisting data sources,gatherng and maintaining the data needed, and completingand reviewing the collectionof information. Send comments regardingthis burdenestimate or any other aspect of thiscollection of information, Including suggestionsfor reducingthis burden, to WashingtonHeadquartersServices, Directoratefor informat=onOperabonsand Reports, 1215 JeffersonDavis Highway, Suite 1204, Arlington,VA 22202-4302, and to the Office of Management and Budget, PaperworkReductionProject(0704-0188), Washington. DC 20503.
1. AGENCY USE ONLY (Leave b/ank) 2. REPORT DATE 3. REPORT TYPE AND DATES COVERED
December 1993 Technical/_emorandum
4. TITLEANDSUBTITLE
Thrust Augmentation Options for the Beta II Two-Stage-to-Orbit Vehicle
6. AUTHOR(S)
Christopher A. Snyder
7. PERFORMING ORGANIZATION NAME(S) AND ADDRESS(ES)
National Aeronautics and Space Administration
Lewis Research Center
Cleveland, Ohio 44135-3191
9. SPONSORING/MONITORING AGENCY NAME(S) AND ADDRESS(ES)
National Aeronautics and Space Administration
Washington, D.C. 20546--0001
11. SUPPLEMENTARY NOTES
5. FUNDING NUMBERS
WU-505-70--00
8. PERFORMING ORGANIZATION
REPORT NUMBER
E-8301
10. SP ON SORINC-,R_ ONITO Ri'I_IG
AGENCY REPORT NUMBER
NASA TM-106448
Prepared for the AIAA Aircraft Design, Systems and Operations Meeting sponsored by the American Institute ofAeronautics and Astronautics Monterey, California, August 1 i-13, 1993. Responsible person, Christopher A. Snyder,
(216) 977-7018.
12a. DISTRIBUTION/AVAILABILITY STATEMENT
Unclassified - Unlimited
Subject Category 07
12b, DISTRIBUTION CODE
13. ABSTRACT (Maximum 200 words)
NASA Lewis Research Center is continuing to study propulsion concepts for a horizontal takeoff and landing, fully
reusable, two-stage-to-orbit vehicle. This will be capable of launching and returning a 1(3,000 pound payload to a
I00 nautical mile polar orbit using low-risk technology. The vehicle, Beta II, is a derivative of the USAF/Boeing Betavehicle which was designed to deliver a 50,000 pound payload to a similar orbit. Beta 1"Istages at Mach 6.5 and about
100,000 feet altitude. The propulsion system for the booster is an over/under turbine bypass engine/ramjet configura-
don. In this paper, several options for thrust augmentation were studied in order to improve the performance of this
engine where there was a critical need. Options studies were turbine engine overspeed in the transonic region, water
injection at a various turbine engine locations also during the transonic region, and water injection at the turbine engine
face during high speed operation. The methodology, constraints, propulsion performance and mission study results are
presented.
14. SUBJECT TERMS
Air breathing engines; Transatmospheric vehicles; Gas turbine engines;
Air breathing boosters; Aerospace planes
1_'. SECURITY CLASSIFICATION 181" SECURITY CLASSIFICATION
OF REPORT OF THIS PAGE
Unclassified Unclassified
NSN 7540-01-280-5500
19. SECURITY CLASSIRCATION
OF ABSTRACT
Unclassified
15. NUMBER OF PAGES
1716. PRICE CODE
A0320. LIMITATION OF ABSTRACT
Standard Form 298 (Rev. 2-89)
Prescribed by ANSI Std. Z39-18298-102

![Orbit type: Sun Synchronous Orbit ] Orbit height: …...Orbit type: Sun Synchronous Orbit ] PSLV - C37 Orbit height: 505km Orbit inclination: 97.46 degree Orbit period: 94.72 min ISL](https://img.dokumen.tips/doc/110x75/5f781053e671b364921403bc/orbit-type-sun-synchronous-orbit-orbit-height-orbit-type-sun-synchronous.jpg)