Embed Size (px)
Citation preview

ISSN: 1439-2305
Number 111 – August 2010
Throwing Foreign Aid at HIV/AIDSin Developing Countries:
Missing the Target?
Peter Nunnenkamp Hannes Öhler
Throwing Foreign Aid at HIV/AIDS in Developing Countries:
Missing the Target?
Peter Nunnenkampa and Hannes Öhlerb
August 2010
Abstract: We assess empirically whether foreign official development assistance (ODA) has
been effective in alleviating HIV/AIDS epidemics, which figures prominently among the
Millennium Development Goals. We employ a difference-in-difference-in-differences
approach to identify the treatment effect of ODA specifically meant to fight sexually
transmitted diseases on HIV/AIDS-related outcome variables. We do not find that ODA has
prevented new infections to an extent that would have reduced the number of people living
with HIV. By contrast, ODA has contributed effectively to the medical care of infected
people. However, conclusive evidence on significant treatment effects on AIDS-related deaths
only exists for the major bilateral source of ODA, the United States. In particular, targeted US
assistance programs appear to be more effective than the activities of multilateral
organizations.
JEL code: F35; I19
Keywords: HIV prevalence, AIDS-related deaths, official development assistance, aid
effectiveness, major donors, difference-in-difference-in-differences
a Kiel Institute for the World Economy, D-24100 Kiel, Germany; e-mail:
[email protected]; phone: +49-431-8814209. b University of Goettingen, Platz der Goettinger Sieben 3, D-37073 Goettingen, Germany; e-
mail: [email protected]; phone: +49-551-3910782.
Acknowledgements: We thank Eran Bendavid for advising us on UNAIDS data. Michaela
Rank provided excellent research assistance.

1
1. Introduction
Five years after starting operations in 2002, the Global Fund to Fight AIDS, Tuberculosis and
Malaria boasted of having saved 1.8 million lives as the result of financially supported
programs.1 By the end of 2009, the number of lives the Global Fund claims to have saved had
reached almost five million.2 The public-private partnership which is funded by various
governments, multilateral institutions and private foundations is less explicit in explaining
how it arrives at these impressive numbers.3 Yet the specific claims of the Global Fund are in
striking contrast to the general verdict of Easterly (2006) that foreign aid has done “so much
ill and so little good.” They also contradict Allen’s (2004: 1123) earlier conclusion that
HIV/AIDS policies have been “seriously inadequate.”
The Global Fund is the most important multilateral donor engaged in the fight against
HIV/AIDS, contributing about one-fifth of total official development assistance (ODA)
disbursed in 2008 to prevent and treat sexually transmitted diseases – notably HIV/AIDS.4
The United States stands out among the bilateral donors. The Bush administration launched
the President’s Emergency Plan for AIDS Relief (PEPFAR) in 2003. PEPFAR originally
committed US$ 15 billion over five years to contain the HIV/AIDS pandemic. In 2006-2008
the United States directed 14 percent of its overall ODA commitments to HIV/AIDS.
Commitments from all sources of ODA, as reported by the OECD’s Creditor Reporting
System (CRS), for preventing and treating sexually transmitted diseases soared from US$
200-400 million annually in 1995-1998 to US$ 7.8 billion in 2008 (in constant prices of
2008).
Nevertheless UNAIDS, the Joint United Nations Programme on HIV/AIDS, estimates
that 33.4 million people were living with HIV in 2008.5 This number was still increasing even
though the number of new infections had slightly declined to an estimated 2.7 million since
the peak in the mid-1990s. New infections continued to exceed the number of adult and child
deaths due to AIDS of about two million in 2008.
1 See: http://www.theglobalfund.org/documents/publications/brochures/whoweare/TGFBrochure_FundingInAction.pdf; accessed: July 2010. 2 See: http://www.theglobalfund.org/documents/replenishment/2010/Progress_Report_Summary_2010_en.pdf; accessed: July 2010. 3 In its 2007 Results Report, the Global Fund states: “Based on the reported ARV [antiretroviral treatment] figures each year, we computed scenarios with and without treatment to see the difference as ‘lives saved’. Annual survival rates were assumed in line with the mortality assumptions in UNAIDS estimation models” (Global Fund 2007: 76, Box 24). In addition, a so-called resource input model is used to estimate lives saved due to averted HIV infections. See also Global Fund (2009: 5-63). 4 See section 3 for details on HIV/AIDS-related ODA. 5 See: http://data.unaids.org/pub/FactSheet/2009/20091124_FS_global_en.pdf, accessed: July 2010.

2
The combination of donor generosity and persistent human suffering calls for an
assessment of bold claims about the effectiveness of HIV/AIDS-related ODA. We argue in
Section 2 that analyzing the effects of specific ODA items on specific outcome variables may
help overcome the stalemate with respect to the effectiveness of aggregate ODA in promoting
economic growth or alleviating poverty in the recipient countries. We propose a difference-in-
difference-in-differences (DDD) approach to identify the treatment effect of ODA specifically
meant to fight sexually transmitted diseases on HIV/AIDS-related outcome variables (Section
3). While ODA has not reduced the number of people living with HIV, we find that ODA has
contributed effectively to the medical care of infected people. However, conclusive evidence
on significant treatment effects on AIDS-related deaths only exists for the major bilateral
source of ODA, the United States (Section 4).
2. Assessing aid effectiveness: An alternative approach
The aid effectiveness literature has been preoccupied with the nexus between aggregate ODA
and economic growth until recently. A consensus has remained elusive; even surveys on this
strand of the literature come to opposite conclusions (McGillivray et al. 2006; Doucouliagos
and Paldam 2009). A more focused view on aid effectiveness may offer a way out of this
stalemate. Donors typically stress the multidimensionality of their objectives, which suggests
assessing the impact of specific ODA items on narrower outcome variables than economic
growth. Previous examples of this more modest approach include: the effects of aid for
education on school enrollment (e.g., Michaelowa and Weber 2007; Dreher et. 2008); the
impact of aid for health on outcome variables such as infant mortality (e.g., Williamson 2008;
Mishra and Newhouse 2009); aid for promoting democracy and better governance (e.g.,
Finkel et al. 2007; Busse and Gröning 2009; Kalyvitis and Vlachaki 2010). Öhler et al. (2010)
employ a DDD approach, as we will do in the following, to assess whether an innovative US
aid scheme, the Millennium Challenge Corporation, was successful in fighting corruption in
recipient countries.
There are very few studies assessing the links between specific ODA items and
HIV/AIDS-related variables such as the prevalence and incidence of HIV and the number of
deaths due to AIDS. Lieberman (2007) finds that ethnic fractionalization in recipient countries
has a negative influence on the policy responses to HIV/AIDS epidemics, including the
responses of foreign donors. This study addresses the allocation of ODA, rather than its
effectiveness. Burns (2010) laments a dearth of funding and conceptual flaws that undermine
the effectiveness of Japan’s HIV/AIDS programs in Asian recipient countries. Peiffer and

3
Boussalis (2010) consider antiretroviral treatment coverage rates and some other intermediate
outcomes (tuberculosis treatment of HIV infected persons and HIV education in schools) in
one particular year, as reported in UNAIDS Country Progress Reports in 2008, as dependent
variables. According to their cross-country regressions, an increase in HIV/AIDS-related
ODA by one dollar per capita of the recipient countries’ population would increase the odds
of complete coverage with antiretroviral treatment by 3-5 percent.
We are aware of just one study whose approach is similar to ours. Bendavid and
Bhattacharya (2009) analyze the effects of PEPFAR on HIV/AIDS-related outcome variables
in sub-Sahara Africa. The authors perform separate regressions with annual data for the
periods 1997-2002 and 2004-2007, i.e., before and after PEPFAR started operations.
Bendavid and Bhattacharya find a significant difference between PEPFAR’s focus countries
and the control group with respect to the number of deaths due to AIDS in the period 2004-
2007. Their study pays only scant attention to the fact that other major donors such as the
Global Fund scaled up operations in line with PEPFAR. Moreover, their results may be biased
as their estimation strategy does not systematically control for variables possibly affecting the
link between ODA and HIV/AIDS outcomes.
The scarcity of empirical evaluations of the effectiveness of ODA in containing
HIV/AIDS is surprising. Human suffering has been as severe and widespread, notably in sub-
Sahara Africa, for the fight against the pandemic to be listed among the so-called Millennium
Development Goals (MDGs). MDG 6 requests the international community to “have halted
by 2015 and begun to reverse the spread of HIV/AIDS” and to “achieve, by 2010, universal
access to treatment for HIV/AIDS for all those who need it.” Both altruistic donors being
committed to alleviate the suffering in the afflicted countries as well as self-interested donors
mainly concerned about security repercussions of the pandemic at home should be interested
to assess the effectiveness of their ODA.6
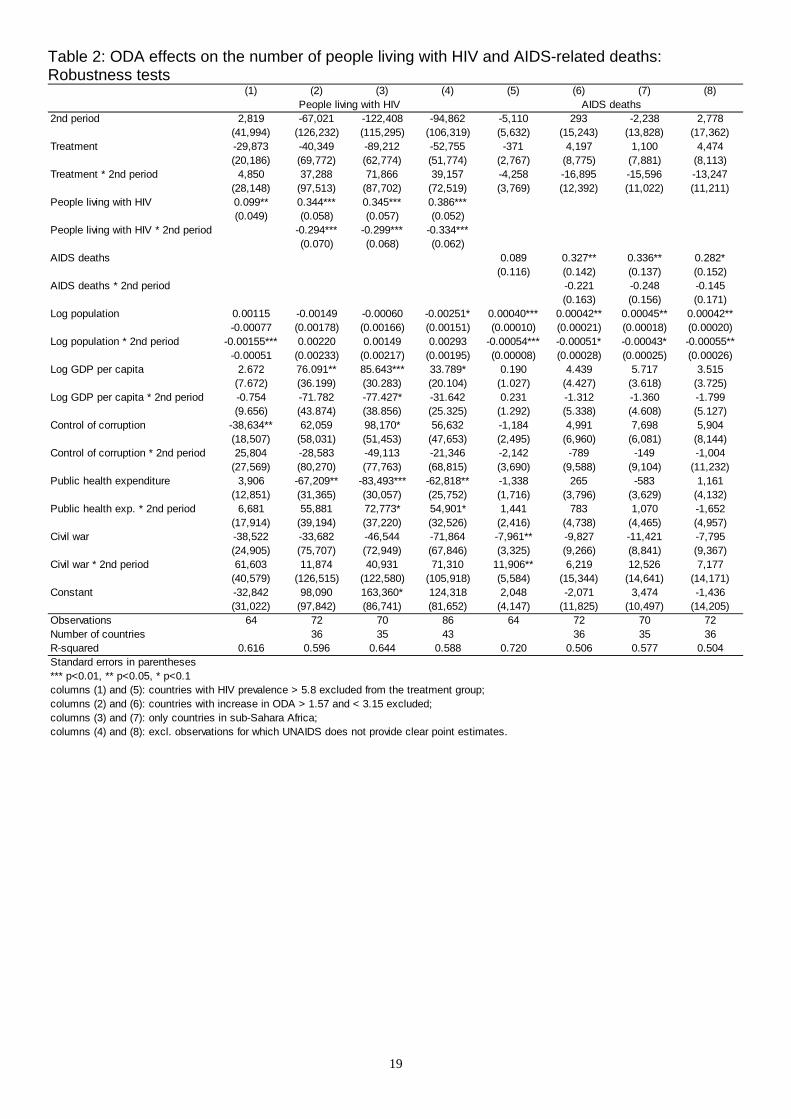
3. Data and method
We assess the effects of ODA on two HIV/AIDS outcome variables: the number of AIDS-
related deaths of adults and children and the number of people living with HIV. UNAIDS
provides point estimates for both variables covering a large number of countries and the
period 1990-2007.7 The number of AIDS-related deaths should decline if ODA is effective in
6 For example, the United States has considered the HIV/AIDS pandemic to be a national security issue since the late 1990s; see Allen (2004) and, for a detailed discussion of US foreign policy in the context of HIV/AIDS, Fidler (2004). 7 See Appendix A for the definition of variables and details on the sources used. Note that the HIV/AIDS outcomes relate to the national level of developing countries. By contrast, the theoretical analysis of Sonntag

4
providing better treatment of HIV infected people.8 By contrast, ODA may have ambiguous
effects on the number of people living with HIV.9 On the one hand, this number rises to the
extent that ODA helps infected people to live longer. On the other hand, the number declines
to the extent that ODA helps preventing new infections. To isolate both effects, one would
optimally perform estimations with the number of new infections and the number of deaths as
alternative dependent variables. Regrettably, country-specific estimates of the number of new
HIV infections are not available from UNAIDS. We experimented with the difference in the
number of people living with HIV in t and t-1, plus the number of AIDS-related deaths in t as
a proxy of the number of new infections in t. However, the resulting number of new infections
proved to be extremely volatile and we failed to detect any effect of ODA on this variable.10
Apart from ODA effects on AIDS-related deaths, we therefore present estimation results only
for the number of people living with HIV. ODA could be considered to be particularly
effective if the impact on both outcome variables were significantly negative.11
The data on ODA are drawn from the OECD’s Creditor Reporting System (CRS).12
The CRS reports HIV/AIDS-related ODA mainly under purpose code 13040, i.e., “all
activities related to sexually transmitted diseases and HIV/AIDS control, e.g., information,
education and communication; testing; prevention; treatment and care”
(http://www.oecd.org/dac/stats/crs/hivaids).13 Another purpose code (16064) was created in
2005 to separately identify special ODA programs for social mitigation of HIV/AIDS.
Examples include: supporting vulnerable groups and children orphaned by HIV/AIDS and the
human rights of HIV/AIDS affected people. Overall ODA reported under purpose code 16064
was just a small fraction of ODA reported under purpose code 13040 (three percent in 2005-
2007). Yet we employ the sum of both purpose codes in our estimations performed below.
(2010) focuses on specific HIV/AIDS interventions such as developing a vaccine from the perspective of effectively financing international public goods. For some countries and years, we take UNAIDS’ lower or upper bound estimates, the average of the two (if both are available), or an estimate given by UNAIDS as “smaller than x” in order not to lose observations. We assess whether the results are sensitive to this procedure by excluding all observations for which a precise point estimate is lacking from UNAIDS in a robustness test (see below). 8 Data on potentially superior measures of effective treatment, notably the number of disability adjusted life years (DALYs) gained, are not available for a sufficiently large panel of countries and years. For a discussion of measurement, notably on DALYs, see World Bank (1999), Gaffeo (2003), and Global Fund (2009). 9 The same applies to the rate of HIV prevalence among adults, in percent of the population cohort aged 15-49. Taking the rate of HIV prevalence as the dependent variable, instead of the number of people living with HIV, does not offer additional insights. These results are not reported for the sake of brevity. 10 These results are available on request. See also World Bank (1999: 54-56) on the relationship between HIV incidence (= new infections), HIV prevalence, and AIDS mortality. 11 A significantly negative effect on the number of people living with HIV would then imply that the decline in new infections is larger than the decline in AIDS-related deaths. 12 These data are available online since 1995. 13 For a detailed description of aid activities related to HIV/AIDS as reported by the CRS, see OECD (2007).

5
Principally, disbursements of ODA should be preferred over commitments when
assessing the effectiveness of ODA. Commitment data may be inflated by donor promises that
are not kept at all or only with delay. However, data on ODA disbursements for specific
purposes such as the fight against HIV/AIDS are available from the CRS database since 2002
only. Hence, we use commitments which are in constant prices of 2008. ODA is defined in
per-capita terms of the recipient countries’ population.
We perform difference-in-difference-in-differences (DDD) estimations to assess the
effects of ODA on the number of AIDS-related deaths and the people living with HIV. While
the data on HIV/AIDS and ODA are available for essentially all developing countries, our
overall sample comprises only those developing countries for which the rate of HIV
prevalence exceeded one percent of the adult population in 2003. In other words, we exclude
all developing countries in which the HIV/AIDS epidemic cannot be considered
“generalized.”14 This is in order to avoid our results to be biased in favor of finding ODA to
be effective. Countries without pressing HIV/AIDS problems are unlikely to receive higher
HIV/AIDS-related ODA, while HIV prevalence could only rise from practically zero. On the
other hand, a higher threshold than one percent reduces the number of remaining observations
considerably. Moreover, the World Bank (1999: 280) argued that donors should pay particular
attention to countries with “nascent” epidemics where prevention is most cost-effective; this
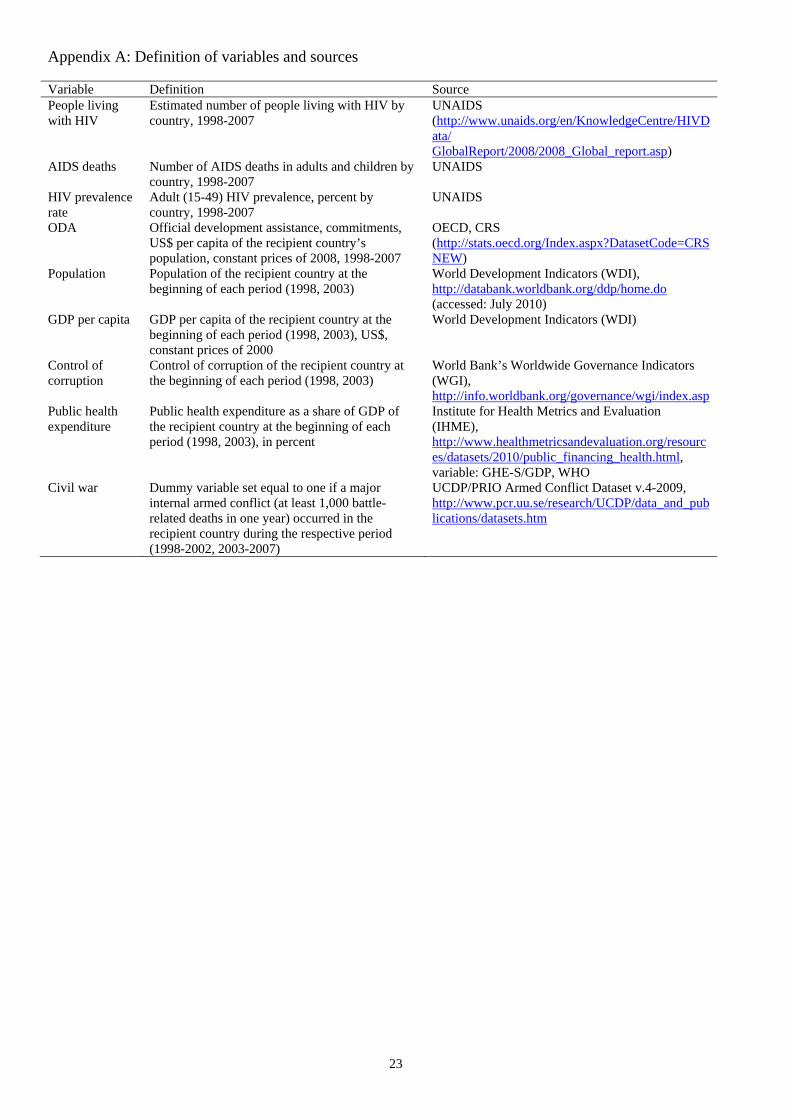
suggests that setting the threshold too high would miss relevant observations. The 47 sample
countries included in the baseline estimations are listed in Appendix C.15
The overall sample is split into two almost equally large sub-samples, the treatment
and the control group. The treatment group comprises those countries for which the increase
in per-capita ODA from all (bilateral and multilateral) donors was relatively high, while the
control group comprises those countries for which the increase in ODA was relatively low
(plus two countries for which ODA declined). As stressed by the Global Fund (2009), there
are major differences in external funding between countries with similar epidemics. The
change in ODA is calculated by subtracting the period average for 1998-2002 from the period
average for 2003-2007.16 It appears to be most reasonable to base the before-and-after
comparison on these periods. As noted by Allen (2004: 1125), international funding for
HIV/AIDS control programs was “very limited” until recently. In June 2001, heads of state
14 Note that the epidemic is often considered “generalized” if HIV prevalence exceeds one percent in antenatal clinics (e.g., Bendavid and Bhattacharya 2009). For reasons of data availability the one percent threshold applied here relates to HIV prevalence among all adults. 15 In Section 4 we present several robustness tests with reduced samples. 16 In the treatment group the average increase in ODA amounts to 8.75 US$ per capita. In the control group the average increase is just 0.97 US$. See the robustness tests below for alternative classifications of the treatment and control groups.

6
and government issued the Declaration of Commitment on HIV and AIDS at the special
session of the United Nations General Assembly on HIV/AIDS. This UN session is
considered “a major milestone in the AIDS response” helping “to guide and secure action,
commitment, support and resources for the AIDS response.”17 The Global Fund to Fight
AIDS, Tuberculosis and Malaria became operational in 2002, and PEPFAR was launched in
2003 as “the largest effort by any nation to combat a single disease”
(http://www.pepfar.gov/about/index.htm). Overall ODA commitments for the control of
sexually transmitted diseases, notably HIV/AIDS, by all donors more than doubled from US$
1.47 billion in 2002 to US$ 3.08 billion in 2003 (in constant prices of 2008 as reported in the
CRS database).
By applying the DDD estimator, we remove any fixed country effects (first
differences) and any fixed time trends (second differences).18 Formally, the DDD estimator
for our baseline specification is as follows:
))()((
))()((
1998200219982002
2003200720032007
CCTT
CCTT
HIVHIVHIVHIV
HIVHIVHIVHIVDDD
with HIV being the level of either the number of people living with HIV or the number of
AIDS-related deaths in treatment group T and control group C, respectively, in the years
indicated. The estimator corresponds to the coefficient of the interaction term between a
dummy for the treatment group and a dummy for the period 2003-2007 in the basic regression
specification without control variables. This specification is then extended in several steps.
First, we add the level of the dependent variable at the beginning of the first and second
periods (i.e., 1998 and 2003). In this way we take into account that changes in the outcome
variables may depend on their levels at the beginning of the periods of observation. Ignoring
this factor may bias the effects of ODA.
Second, we include various other control variables (at the beginning of the first and
second period) that may affect the changes in the outcome variables.19 We include the
countries’ population as both dependent variables are defined in absolute numbers. The
countries’ GDP per capita may affect the dependent variables as higher average incomes
provide better opportunities for costly treatment and prevention programs. The chances to
fight HIV/AIDS might also be relatively favorable in countries with better control of
17 See: http://www.unaids.org/en/AboutUNAIDS/Goals/UNGASS/default.asp. 18 See also Johnson and Zajonc (2006). 19 See Appendix A for definitions and sources, and Appendix B for summary statistics.

7
corruption. By contrast, local conditions appear to be particularly unfavorable in countries
suffering from civil war.20 Public health expenditure (as a share of GDP) may reflect the local
government’s commitment to tackle health problems, including HIV/AIDS.
Finally, we interact the level of the dependent variable as well as the other control
variables with the dummy variable for the second period 2003-2007. The identifying
assumption of our DDD estimator is that, in the absence of the treatment, the difference in the
dependent variable between the two periods would have been the same, on average, in the
treatment and control group. The plausibility of this assumption is debatable if the treatment
and control group differ from each other in certain aspects that might be associated with the
dynamics of the outcome variable (Abadie 2005). In our case, the two groups differ
particularly with respect to the level of the outcome variables (see Appendix B). A relatively
high initial level of the outcome variables is strongly associated with a relatively large
increase in the outcome variables in the first period, while these correlations weaken
considerably in the second period.21 Ignoring these dynamics in the outcome variables would
violate the identifying assumption and bias the results with respect to the treatment effect. The
treatment and control groups also differ with respect to other control variables, though to a
lesser extent. Again, the interaction of the control variables with the dummy variable for the
second period accounts for different dynamics in the two groups.
4. Results
Baseline results
Table 1 reports our baseline results with the number of people living with HIV (columns 1-5)
and the number of AIDS-related deaths (columns 6-10) as dependent variables. We also
considered the rate of HIV prevalence and the number of new infections as dependent
variables. For the reasons stated in Section 3 these estimations are not shown, however. We
proceed in several steps to evaluate the treatment effect of ODA. In columns (1) and (6) of
Table 1, we present the basic DDD estimations without any additional controls. In the next
step, we add the number of people living with HIV in 1998 and 2003 (column 2) and,
respectively, the number of AIDS-related deaths in 1998 and 2003 (column 7). In columns (3)
and (8), we enter the full list of control variables introduced above, in order to account for the
20 Civil war conditions are proxied by setting a dummy variable equal to one if a major internal armed conflict (at least 1,000 battle-related deaths in one year) occurred in the recipient country during the respective period (1998-2002, 2003-2007). 21 In the first period, the correlation between the initial level and the change in People living with HIV (AIDS deaths) amounts to 0.72 (0.64). In the second period, the correlation declines to 0.50 (0.12).

8
effects of these variables on the changes in the outcome variable. In columns (4) and (9), we
interact the level of the dependent variable with the dummy variable for the second period.
Finally, we interact all control variables with the second period dummy in columns (5) and
(10).
The results of the basic DDD estimations differ considerably between the two outcome
variables. In column (1) with the change in the number of people living with HIV as the
dependent variable, the negative coefficient of Treatment * 2nd period fails to pass
conventional significance levels. In other words, there is no convincing evidence that ODA
has been effective in causing a more favorable dynamic in the treatment group with respect to
the change in the number of people living with HIV. It should be noted that this also holds
when considering the rate of HIV prevalence, instead of the absolute number of people, as the
dependent variable (not shown). The lack of convincing evidence might be attributed to the
countervailing effects of ODA on this outcome variable. As noted above, effective prevention
through ODA tends to reduce the number of people living with HIV, whereas effective
medical care of infected persons tends to increase this number.
Indeed, the basic DDD estimation reported in column (6) of Table 1 reveals a
significant treatment effect of ODA on the change in the number of AIDS-related deaths.
Note that the dynamic of AIDS-related deaths is relatively unfavorable in the treatment group
when considering the first period 1998-2002, compared to the control group.22 However, the
relatively unfavorable dynamic in the treatment group disappears in the second period 2003-
2007. In other words, no significant difference between the treatment and the control group
can be observed anymore.23 Taken together the treatment effect of ODA is significant at the
ten percent level. According to this estimate, the stronger increase in ODA in the treatment
group, compared to the control group, led to 16,665 fewer AIDS-related deaths, on average, in
a country of the treatment group in the second period.24
The different results for the two outcome variables are hardly affected when
controlling for their levels at the beginning of the first and the second period in columns (2)
and (7). This is even though the changes in the outcome variables strongly depend on initial
levels. Higher initial levels are associated with a higher increase (or a smaller decline) in the
number of people living with HIV as well as AIDS-related deaths, both at the one percent
level of significance. Yet the treatment effect of ODA remains as before – insignificant with
22 The marginal effect is significant at the five percent level. 23 Throughout this section, the marginal effects and the significance levels of variables included in interaction terms are calculated with the “margins” command of Stata 11.0. 24 The difference in the increase in ODA between the treatment and the control group amounts to 7.78 US$ per capita, on average.
9
respect to the number of people living with HIV, but significant (now at the five percent level)
with respect to AIDS-related deaths. The major results also hold when adding the levels of a
broader set of control variables at the beginning of the first and the second period. In fact,
most of the additional control variables do not affect the changes in the outcome variables in
columns (3) and (8) of Table 1. The only exception is the positive impact of a larger
population on the change in the number of deaths (larger increase or smaller decline).
By contrast, the interaction of the level of the dependent variable with the dummy
variable for the second period proves to be relevant. The results reported in columns (4) and
(9) indicate that the positive effects of the levels on the changes in the outcome variables
weaken considerably in the second period.25 Given that the levels are, on average,
considerably larger in the treatment group than in the control group, we can infer that the
treatment effect of ODA would be overestimated if we ignored these dynamics. This bias
appears to be minor in column (4). The treatment effect of ODA changes its sign from
negative to positive, but it remains insignificant at conventional levels. The bias is more
pronounced in column (9) where the treatment effect of ODA with respect to AIDS-related
deaths is no longer significant. In other words, we no longer find ODA to be effective in
reducing the number of AIDS-related deaths once it is taken into account that the treatment
and control groups differ in the level of the number of deaths and that this difference is
associated with the dynamics of this outcome variable.
Apart from the levels of the dependent variables, the relevance of most other control
variables continues to be weak when taking account of the dynamics of their levels between
the first and second period. In column (5), the positive effect of logged GDP per capita on the
number of people living with HIV in the first period implies an unfavorable dynamic for
countries that were relatively rich. However, the unfavorable dynamic disappears in the
second period. This may indicate that relatively rich countries were able to take advantage of
their relative wealth in providing costly treatment and prevention programs. Public health
expenditure appears to have reduced the increase in the number of people living with HIV,
but only in the first period. Importantly, the treatment effect of ODA on this outcome variable
remains insignificant. In column (10) larger countries show an unfavorable dynamic in the
first period, but this effect disappears in the second period. Considering that the countries in
the control group are, on average, larger than the countries in the treatment group, we can
infer that the treatment effect of ODA would be underestimated if we did not consider these
25 In column (9) the effect of the level proves to be even insignificant in the second period.
10
dynamics. In fact, the treatment effect is, in absolute terms, larger in column (10) than in
column (9). However, it still remains insignificant.
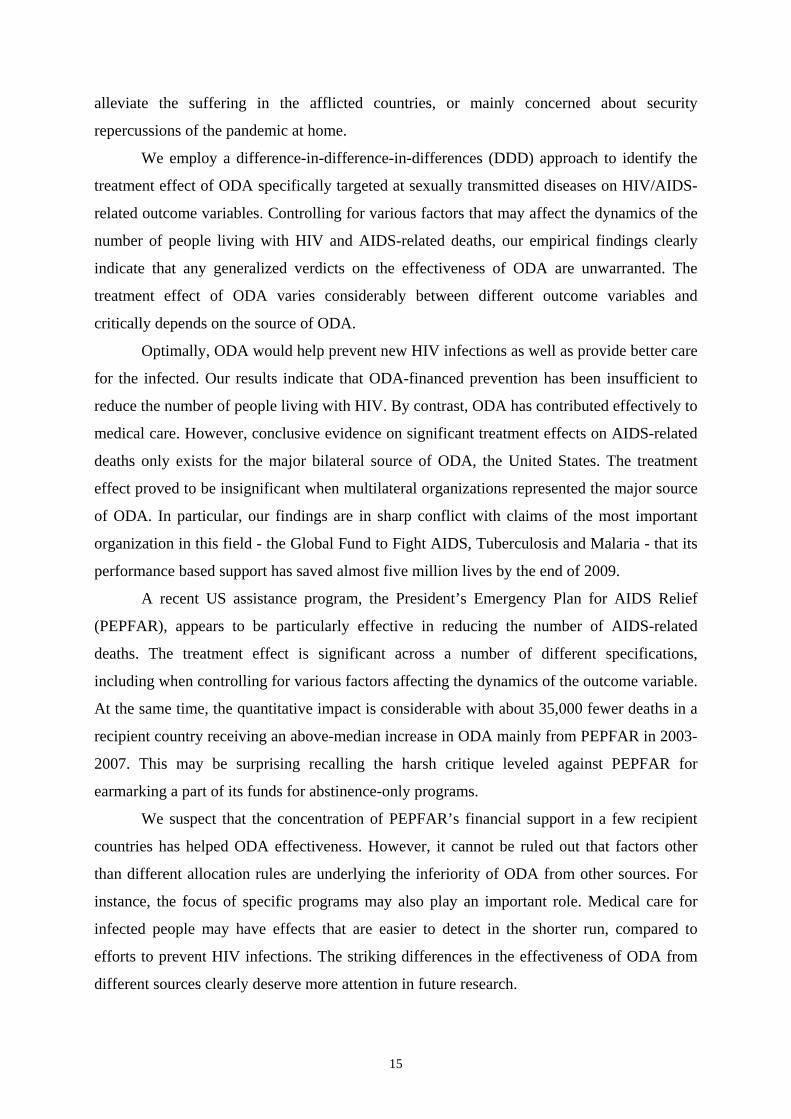
ODA from all donors: robustness tests
In Table 2 we report the results of four robustness tests. As before, the classification of the
treatment and control groups is based on the increase in ODA per capita from all donors, as
reported under purpose codes 13040 and 16064 in the CRS database. Once again we assess
the treatment effect of ODA with regard to the number of people living with HIV and the
number of AIDS-related deaths. The two periods under consideration, 1998-2002 and 2003-
2007, are also the same as before.
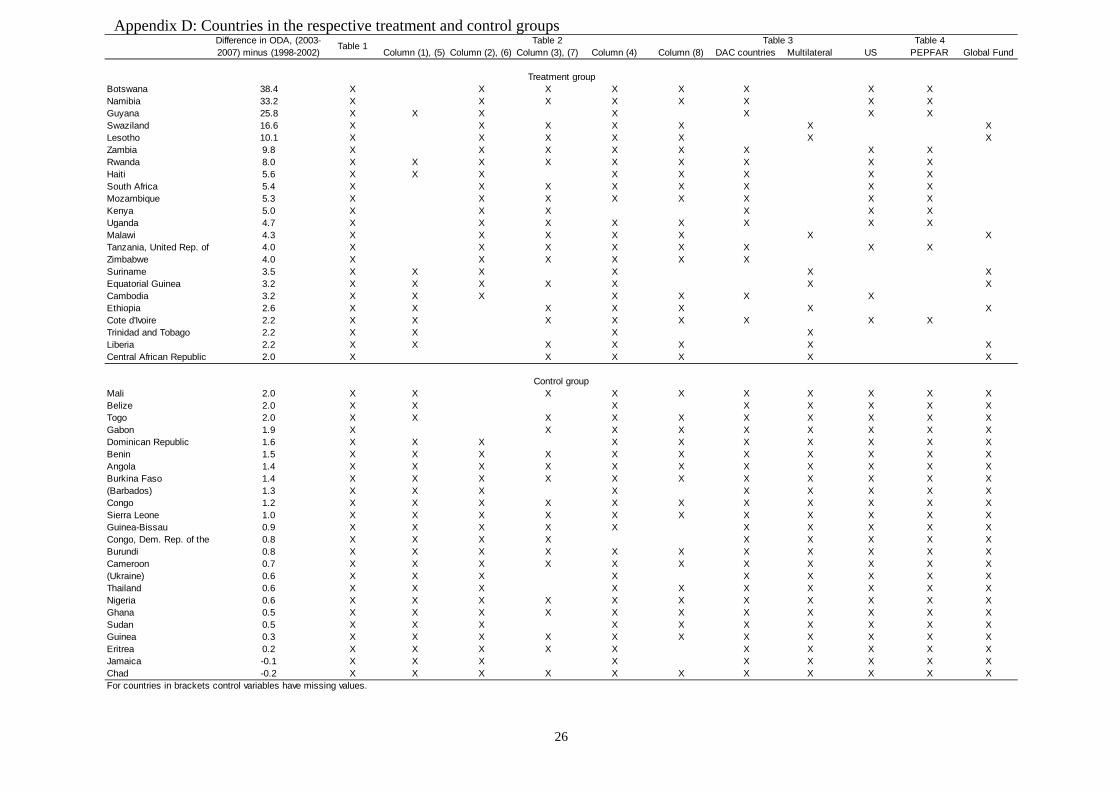
The first robustness test reported in columns (1) and (5) excludes 13 countries from
the treatment group that have HIV prevalence rates greater than the maximum level of HIV
prevalence rates in the control group, i.e., 5.8 percent (in 2003).26 Reducing the treatment
group in this way serves to remove the considerable difference in the level of the outcome
variables compared to the control group.27 In other words, it provides an alternative to
including the interactions of the level of dependent variables with the dummy variable for the
second period. Importantly, this robustness test corroborates the previous finding that the
treatment effect of ODA is insignificant for both outcome variables once we control for
differences between the treatment and control groups in the level of the dependent variables.
The next robustness test reported in columns (2) and (6) excludes the middle range of
the overall sample, i.e., the nine countries with an increase in ODA per capita between the
first and the second period of more than 1.6 US$ and less than 3.2 US$. This reduces the
treatment and the control group to essentially the same extent and widens the gap between the
groups with regard to the increase in ODA.28 Compared to columns (5) and (10) in Table 1,
the results are hardly affected. A minor exception is that the interaction of the level of AIDS-
related deaths with the dummy variable for the second period loses its significance in column
(6) of Table 2. Both treatment effects are insignificant once again.
Our major result also holds when restricting the estimations to sample countries
located in sub-Sahara Africa (columns 3 and 7). This is not surprising as the 11 sample
countries located in other regions spread across the whole spectrum as concerns the increase
26 See Appendix D for the countries in the respective treatment and control groups. 27 Now, the levels are even somewhat higher in the control group than in the treatment group: The level of the number of people living with HIV (AIDS-related deaths) amounts to 194,560 (17,430) in the treatment group and 251,013 (18,050) in the control group, on average. 28 Now, the average increase in ODA amounts to 11 US$ per capita in the treatment group. In the control group it corresponds to 0.77 US$ only.

11
in ODA, even though their HIV prevalence rate was relatively low and varied only modestly
(Appendix C). Finally, the exclusion of observations for which an exact point estimate of the
outcome variables was not available from UNAIDS does not change our results either.
Differences between major donors
So far we have separated the treatment group from the control group on the basis of the
increase in total HIV/AIDS-related ODA per capita received by a developing country from all
sources. Subsequently we take into account that the effectiveness of ODA may differ between
major sources. In particular, ODA from multilateral donors such as the Global Fund to Fight
AIDS, Tuberculosis and Malaria is widely perceived to be superior to ODA from selfish
bilateral donors, notably major DAC countries such as the United States.29 The empirical
evidence supporting this view is inconclusive, however (Ehrenfeld 2004). Ram (2003) even
finds that positive economic growth effects of bilateral ODA are largely offset by negative
growth effects of multilateral ODA.
Against this backdrop we replicate the estimations with changes in AIDS-related
deaths as the dependent variable, reported in columns (6)-(10) of Table 1, by refining the
treatment group.30 In addition to belonging to the upper half of the sample in terms of the
increase in ODA from all sources, we restrict the treatment group to either those recipient
countries for which HIV/AIDS-related ODA comes mainly from bilateral sources (all DAC
countries) or those for which ODA comes mainly from (all) multilateral sources. The results
for the treatment group with the DAC countries as the major source of ODA are reported in
columns (1)-(5) in Table 3, and those for the treatment group with multilateral organizations
as the major source in columns (6)-(10). It may be noted that multilateral organizations
contributed almost one third to ODA flows reported by the CRS under purpose codes 13040
and 16064 to all recipient countries during the period 2003-2007.
Table 3 reveals that the results for the control variables, including the levels of the
dependent variables, are largely as before in Table 1. This implies that the effects that most of
the control variables exert on the change in the number of AIDS-related deaths do not differ
considerably between the estimations with DAC countries as the major source of ODA and
those with multilateral organizations as the major source. An exception is the dynamics of the
29 For instance, The Economist has argued repeatedly that multilateral organizations “reach the poor more accurately” (March 14th, 2002), whereas “bilateral aid is of dubious quality” (June 2nd, 2005) because of strategic and commercial self-interest of donor countries such as the United States. 30 We also replicated the estimations with changes in the number of people living with HIV as the dependent variable. These estimations did not offer additional insights and are not reported. The results are available on request.

12
output variable due to a country’s population, which can be observed in the case of bilateral
aid only. At the same time, the results clearly show that the treatment effects presented before
for ODA from all sources are driven by ODA effects in those countries receiving ODA
mainly from DAC countries. The treatment effect proves to be insignificant throughout
columns (6)-(10) with multilateral organizations as the major source of ODA. This finding
sharply contradicts the widely held belief that multilateral ODA is more effective in
promoting economic and social development, including by fighting HIV/AIDS.
By contrast, the treatment effect is significantly negative in columns (1)-(3) with
bilateral donors as the major source of ODA. According to these estimates, the stronger
increase in ODA in the treatment group, compared to the control group, leads to 25,000-
29,000 fewer AIDS-related deaths, on average, in a country of the treatment group in the
second period.31 The impact is thus more pronounced than that reported in columns (6)-(8) of
Table 1. As before in Table 1, the treatment effect loses its significance when controlling for
the dynamics in the outcome variable by the interaction of its level at the beginning of the two
periods with the dummy variable for the second period (column 4). In other words, the
treatment effect is overestimated once again if we do not control for these dynamics.
However, when controlling for the dynamics due to the countries’ population in the full
specification (column 5), the treatment effect is only insignificant at the margin. It also
increases in size, compared to column (4).32
Importantly, the results in Table 3 point to striking differences when accounting for
the source of ODA. It should be noted in this context that, in most countries with a
particularly large increase in ODA, the funds come mainly from bilateral sources (see
Appendix D). This implies that the difference in the increase of ODA between the treatment
and the control group is more pronounced when bilateral donors represent the major source,
compared to multilateral donors being the major source. The differences found in the
effectiveness of bilateral and multilateral ODA are probably related to this pattern. In
particular, bilateral donors are more likely to make a difference as they tend to focus on a few
recipient countries.33 The World Bank (1999) observed more than a decade ago already that
the allocation of HIV/AIDS-related ODA across recipient countries differed between bilateral
31 Now, the average increase in ODA amounts to 11.04 US$ per capita in the treatment group. Thus, the difference in the increase in ODA between the treatment and the control group amounts to 10.07 US$ per capita, on average. 32 Note that, as in Table 1, the treatment effect is biased downwards if we do not account for the dynamics due to the countries’ population. Interestingly, the coefficients of the level of the outcome variable and of its interaction with the second period lose almost their significance when controlling for the dynamics due to the countries’ population. 33 This becomes apparent when looking at the countries in the control group where HIV/AIDS-related ODA comes mainly from multilateral sources.

13
and multilateral donors: Bilateral donors appeared to be particularly concerned about
HIV/AIDS in recipient countries where the epidemic was most severe – either because they
were altruistically responding to serious suffering in these countries, or because they viewed
“their self-interest as jeopardized most acutely by countries where there are large numbers of
infected people” (World Bank 1999: 250). The World Bank posited that, compared to bilateral
donors, multilateral organizations were less focused, spreading ODA more widely including
to countries with nascent epidemics and minor HIV/AIDS problems.
This issue is investigated further by concentrating on two dominant donors, the United
States among DAC countries and the Global Fund among multilateral organizations. Both
donors accounted for about 70 percent of bilateral and, respectively, multilateral ODA flows
reported under purpose codes 13040 and 16064 to all recipient countries during the period
2003-2007. At the same time, the United States and the Global Fund represent examples of
the different allocation behavior noted above. According to Bendavid and Bhattacharya
(2009: 688), PEPFAR, the major US scheme, “is unique in its distinctive approaches and
disproportionate funding of a few countries.” Indeed, about 72 percent of country-specific
ODA reported by the United States under the above purpose codes was concentrated in just
ten recipient countries in 2003-2007; the corresponding share of the top-10 recipients of ODA
from the Global Fund accounted for just 46 percent of the Fund’s overall commitments (CRS
database).
The results shown in Table 4 indicate that the US approach was quite successful in
containing the number of AIDS-related deaths.34 Similar to the previous procedure, two
criteria apply for countries in the treatment group: an increase in ODA from all sources above
the median of the overall sample, and either the United States (columns 1-10) or the Global
Fund (columns 11-15) representing the major donor. The results for the Global Fund mirror
those for all multilateral organizations as the major source of ODA for countries in the
treatment group: the treatment effect remains insignificant throughout at conventional levels.
This is not surprising as the treatment group comprises almost the same set of countries
independent of whether all multilateral organizations or the Global Fund is regarded as the
major donor (Appendix D). By contrast, the results with the United States as the major donor
show a significant treatment effect not only in the specifications without the interactions of
the control variables with the second period dummy (as before for all DAC countries), but
even in the full specification in column (5). Moreover, the quantitative impact increases to
almost 30,000 fewer AIDS-related deaths. Note that the level of the outcome variable and its 34 Again, we do not report the results with the number of people living with HIV as the dependent variable. US ODA did not appear to be superior to ODA from the Global Fund in this regard.

14
interaction with the second period dummy are no longer significant when controlling for the
dynamics due to the countries’ population. The results indicate that the treatment effect is
underestimated if no dynamics of any kind are taken into account (as in columns 1-3).
The quantitative impact increases further to about 35,000 fewer deaths when
replicating the full specification with an additional requirement for countries to be included in
the treatment group. In columns (6)-(10) the United States must not only be the major donor,
but the recipient countries must also be on the list of PEPFAR’s so-called focus countries.
The significant treatment effect of ODA in PEPFAR’s focus countries is in line with the
earlier findings of Bendavid and Bhattacharya (2009). In all other respects, the results in
columns (6)-(10) differ only marginally from those in columns (1)-(5) of Table 4. This is
plausible considering that the overlap between recipient countries where the United States is
the major donor and the focus countries of PEPFAR is almost perfect, with Cambodia
representing the only exception (Appendix D).
Finally, we show in Table 5 that the treatment effects of ODA reported in this sub-
section are robust to the exclusion of observations for which UNAIDS does not provide exact
point estimates of the number of AIDS-related deaths.35 Once again, multilateral ODA as well
as ODA from the Global Fund proves to be ineffective.36 Also as before, the treatment effect
is significant at the five percent level and quantitatively most pronounced when the treatment
group is restricted to PEPFAR’s focus countries. The concentration on a few needy recipient
countries appears to have helped ODA effectiveness. This is even though PEPFAR was
widely criticized for earmarking a part of its funds for abstinence-only programs and refusing
to cooperate with partner organizations offering counseling on abortion (e.g., Burns 2010:
160).
5. Summary and conclusion
We contribute to the nascent literature on the effectiveness of foreign official development
assistance (ODA) that focuses on particular items of ODA meant to achieve specific
objectives. The fight against HIV/AIDS epidemics figures prominently among the
Millennium Development Goals agreed by the international community in 2000. Donor
countries and multilateral organizations have mobilized steeply increasing resources in recent
years to halt and reverse the spread of HIV/AIDS. Donors should know about the
effectiveness of their ODA independent of whether they are altruistically committed to
35 We report only the preferred full specification with the interactions included. 36 Note that the treatment group is identical for the estimations with all multilateral donors and the Global Fund reported in Table 5.
15
alleviate the suffering in the afflicted countries, or mainly concerned about security
repercussions of the pandemic at home.
We employ a difference-in-difference-in-differences (DDD) approach to identify the
treatment effect of ODA specifically targeted at sexually transmitted diseases on HIV/AIDS-
related outcome variables. Controlling for various factors that may affect the dynamics of the
number of people living with HIV and AIDS-related deaths, our empirical findings clearly
indicate that any generalized verdicts on the effectiveness of ODA are unwarranted. The
treatment effect of ODA varies considerably between different outcome variables and
critically depends on the source of ODA.
Optimally, ODA would help prevent new HIV infections as well as provide better care
for the infected. Our results indicate that ODA-financed prevention has been insufficient to
reduce the number of people living with HIV. By contrast, ODA has contributed effectively to
medical care. However, conclusive evidence on significant treatment effects on AIDS-related
deaths only exists for the major bilateral source of ODA, the United States. The treatment
effect proved to be insignificant when multilateral organizations represented the major source
of ODA. In particular, our findings are in sharp conflict with claims of the most important
organization in this field - the Global Fund to Fight AIDS, Tuberculosis and Malaria - that its
performance based support has saved almost five million lives by the end of 2009.
A recent US assistance program, the President’s Emergency Plan for AIDS Relief
(PEPFAR), appears to be particularly effective in reducing the number of AIDS-related
deaths. The treatment effect is significant across a number of different specifications,
including when controlling for various factors affecting the dynamics of the outcome variable.
At the same time, the quantitative impact is considerable with about 35,000 fewer deaths in a
recipient country receiving an above-median increase in ODA mainly from PEPFAR in 2003-
2007. This may be surprising recalling the harsh critique leveled against PEPFAR for
earmarking a part of its funds for abstinence-only programs.
We suspect that the concentration of PEPFAR’s financial support in a few recipient
countries has helped ODA effectiveness. However, it cannot be ruled out that factors other
than different allocation rules are underlying the inferiority of ODA from other sources. For
instance, the focus of specific programs may also play an important role. Medical care for
infected people may have effects that are easier to detect in the shorter run, compared to
efforts to prevent HIV infections. The striking differences in the effectiveness of ODA from
different sources clearly deserve more attention in future research.

16
References
Abadie, A. (2005). Semiparametric difference-in-differences estimators. Review of Economic
Studies 72 (1): 1-19.
Allen, T. (2004). Introduction: Why don’t HIV/AIDS policies work? Journal of International
Development 16 (8): 1123-1127.
Bendavid, E. and J. Bhattacharya (2009). The President’s emergency plan for AIDS relief in
Africa: An evaluation of outcomes. Annals of Internal Medicine 150 (10): 688-695.
Burns, K. (2010). Japanese foreign aid and the spread of HIV/AIDS to women in Asia. In: D.
Leheny and K. Warren (eds.), Japanese aid and the construction of global
development: Inescapable solutions. London (Routledge): 147-166.
Busse, M. and S. Gröning (2009). Does foreign aid improve governance? Economics Letters
104 (2): 76-78.
Doucouliagos, H. and M. Paldam (2009). The aid effectiveness literature: The sad results of
40 years of research. Journal of Economic Surveys 23 (3): 433-461.
Dreher, A., P. Nunnenkamp and R. Thiele (2008). Does aid for education educate children?
Evidence from panel data. World Bank Economic Review 22 (2): 291-314.
Easterly, W. (2006). The white man’s burden: Why the West’s efforts to aid the rest have done
so much ill and so little good. New York (Penguin Press).
Ehrenfeld, D. (2004). Foreign aid effectiveness, political rights and bilateral distribution.
Journal of Humanitarian Assistance, http://www.jha.ac/articles/a128.htm (accessed:
August 2010).
Fidler, D.P. (2004). Fighting the axis of illness: HIV/AIDS, human rights, and US foreign
policy. Harvard Human Rights Journal 17: 99-136.
Finkel, S.E., A.S. Pérez Linan and M.A. Seligson (2007). The effects of US foreign assistance
on democracy building, 1990-2003. World Politics 59 (3): 404-440.
Global Fund (2007). Partners in impact: Results report 2007. Geneva.
http://www.theglobalfund.org/documents/publications/progressreports/ProgressReport
2007_en_low.pdf.
Global Fund (2009). Final report. Global Fund five-year evaluation: Study area 3 “The
impact of collective efforts on the reduction of the disease burden of AIDS,
tuberculosis, and malaria.” Geneva.
http://www.theglobalfund.org/documents/terg/TERG_SA3.pdf.
Johnson, D. and T. Zajonc (2006). Can foreign aid create an incentive for good governance?
Evidence from the Millennium Challenge Corporation. Center for International

17
Development, Harvard University.
http://www.people.fas.harvard.edu/~tzajonc/mcc_wp_apr06.pdf (accessed: June
2010).
Kalyvitis, S. and I. Vlachaki (2010). Democratic aid and the democratization of recipients.
Contemporary Economic Policy 28 (2): 188-218.
McGillivray, M., S. Feeny, N. Hermes and R. Lensink (2006). Controversies over the impact
of development aid: It works; it doesn’t; it can, but that depends….Journal of
International Development 18 (7): 1031-1050.
Michaelowa, K. and A. Weber (2007). Aid effectiveness in the education sector: A Dynamic
panel analysis. In: S. Lahiri (ed.), Theory and practice of foreign aid. Amsterdam
(Elsevier): 357-385.
Mishra, P. and D. Newhouse (2009). Does health aid matter? Journal of Health Economics 28
(4): 855-872.
OECD (2007). Creditor Reporting System: Aid activities in support of HIV/AIDS control,
2000-2007. Paris (OECD).
Öhler, H., P. Nunnenkamp and A. Dreher (2010). Does conditionality work? A test for an
innovative US aid scheme. Kiel Working Paper 1630. Institute for the World
Economy. Kiel.
Peiffer, C.A. and C. Boussalis (2010). Foreign assistance and the struggle against HIV/AIDS
in the developing world. Journal of Development Studies 46 (3): 556-573.
Lieberman, E.S. (2007). Ethnic politics, risk, and policy-making: A cross-national statistical
analysis of government responses to HIV/AIDS. Comparative Political Studies 40
(12): 1407-1432.
Ram, R. (2003). Roles of bilateral and multilateral aid in economic growth of developing
countries. Kyklos 56 (1): 95-110.
Sonntag, D. (2010). AIDS and aid: A public good approach. Berlin (Springer Physica).
Williamson, C.R. (2008). Foreign aid and human development: The impact of foreign aid to
the health sector. Southern Economic Journal 75 (1): 188-207.
World Bank (1999). Confronting AIDS: Public priorities in a global epidemic. Revised
edition. Oxford (Oxford University Press).

18
Table 1: ODA effects on the number of people living with HIV and AIDS-related deaths: Baseline results (1) (2) (3) (4) (5) (6) (7) (8) (9) (10)
2nd period -15,379 -22,055 -31,468 30,805 -67,584 -6,700 -7,811 -9,356 -2,532 512(57,922) (48,915) (53,609) (43,392) (103,765) (5,943) (5,653) (6,019) (5,353) (12,451)
Treatment 74,840 15,246 20,561 -50,243 -59,788 12,285** 8,839 8,159 1,753 2,683(58,548) (50,386) (55,519) (45,175) (51,718) (6,007) (5,800) (6,234) (5,601) (6,396)
Treatment * 2nd period -71,225 -82,195 -72,585 23,073 48,131 -16,665* -18,994** -16,303* -8,130 -11,572(82,800) (69,929) (74,256) (63,423) (71,992) (8,496) (8,098) (8,357) (7,895) (8,942)
People living with HIV 0.144*** 0.136*** 0.303*** 0.356***(0.024) (0.032) (0.035) (0.050)
People living with HIV * 2nd period -0.240*** -0.303***(0.043) (0.060)
AIDS deaths 0.155*** 0.094 0.473*** 0.335***(0.047) (0.062) (0.088) (0.121)
AIDS deaths * 2nd period -0.419*** -0.245*(0.101) (0.138)
Log population 0.00040 -0.00181 0.00022* 0.00038**(0.00107) (0.00144) (0.00012) (0.00017)
Log population * 2nd period 0.00232 -0.00047**(0.00187) (0.00022)
Log GDP per capita 11.038 33.553* 1.199 1.124(14.295) (20.116) (1.606) (2.425)
Log GDP per capita * 2nd period -31.688 0.451(25.337) (3.048)
Control of corruption 48,414 55,411 4,953 5,114(38,926) (46,208) (4,316) (5,498)
Control of corruption * 2nd period -23,527 -1,042(67,175) (7,960)
Public health expenditure -14,608 -50,623** 1,339 1,320(17,877) (24,754) (2,001) (2,962)
Public health exp. * 2nd period 42,287 -811(31,568) (3,776)
Civil war -19,388 -38,680 -4,262 -10,103(59,059) (64,837) (6,633) (7,894)
Civil war * 2nd period 32,761 10,204(103,647) (12,475)
Constant 37,817 8,288 54,362 -24,162 96,350 6,254 4,575 2,912 1,121 -996(40,957) (34,916) (66,505) (30,779) (78,663) (4,202) (4,023) (7,477) (3,793) (9,466)
Observations 94 94 90 94 90 94 94 90 94 90Number of countries 47 47 45 47 45 47 47 45 47 45R-squared 0.033 0.319 0.353 0.495 0.566 0.158 0.250 0.331 0.372 0.489Standard errors in parentheses*** p<0.01, ** p<0.05, * p<0.1
People living with HIV AIDS deaths
19
Table 2: ODA effects on the number of people living with HIV and AIDS-related deaths: Robustness tests
(1) (2) (3) (4) (5) (6) (7) (8)
2nd period 2,819 -67,021 -122,408 -94,862 -5,110 293 -2,238 2,778(41,994) (126,232) (115,295) (106,319) (5,632) (15,243) (13,828) (17,362)
Treatment -29,873 -40,349 -89,212 -52,755 -371 4,197 1,100 4,474(20,186) (69,772) (62,774) (51,774) (2,767) (8,775) (7,881) (8,113)
Treatment * 2nd period 4,850 37,288 71,866 39,157 -4,258 -16,895 -15,596 -13,247(28,148) (97,513) (87,702) (72,519) (3,769) (12,392) (11,022) (11,211)
People living with HIV 0.099** 0.344*** 0.345*** 0.386***(0.049) (0.058) (0.057) (0.052)
People living with HIV * 2nd period -0.294*** -0.299*** -0.334***(0.070) (0.068) (0.062)
AIDS deaths 0.089 0.327** 0.336** 0.282*(0.116) (0.142) (0.137) (0.152)
AIDS deaths * 2nd period -0.221 -0.248 -0.145(0.163) (0.156) (0.171)
Log population 0.00115 -0.00149 -0.00060 -0.00251* 0.00040*** 0.00042** 0.00045** 0.00042**-0.00077 (0.00178) (0.00166) (0.00151) (0.00010) (0.00021) (0.00018) (0.00020)
Log population * 2nd period -0.00155*** 0.00220 0.00149 0.00293 -0.00054*** -0.00051* -0.00043* -0.00055**-0.00051 (0.00233) (0.00217) (0.00195) (0.00008) (0.00028) (0.00025) (0.00026)
Log GDP per capita 2.672 76.091** 85.643*** 33.789* 0.190 4.439 5.717 3.515(7.672) (36.199) (30.283) (20.104) (1.027) (4.427) (3.618) (3.725)
Log GDP per capita * 2nd period -0.754 -71.782 -77.427* -31.642 0.231 -1.312 -1.360 -1.799(9.656) (43.874) (38.856) (25.325) (1.292) (5.338) (4.608) (5.127)
Control of corruption -38,634** 62,059 98,170* 56,632 -1,184 4,991 7,698 5,904(18,507) (58,031) (51,453) (47,653) (2,495) (6,960) (6,081) (8,144)
Control of corruption * 2nd period 25,804 -28,583 -49,113 -21,346 -2,142 -789 -149 -1,004(27,569) (80,270) (77,763) (68,815) (3,690) (9,588) (9,104) (11,232)
Public health expenditure 3,906 -67,209** -83,493*** -62,818** -1,338 265 -583 1,161(12,851) (31,365) (30,057) (25,752) (1,716) (3,796) (3,629) (4,132)
Public health exp. * 2nd period 6,681 55,881 72,773* 54,901* 1,441 783 1,070 -1,652(17,914) (39,194) (37,220) (32,526) (2,416) (4,738) (4,465) (4,957)
Civil war -38,522 -33,682 -46,544 -71,864 -7,961** -9,827 -11,421 -7,795(24,905) (75,707) (72,949) (67,846) (3,325) (9,266) (8,841) (9,367)
Civil war * 2nd period 61,603 11,874 40,931 71,310 11,906** 6,219 12,526 7,177(40,579) (126,515) (122,580) (105,918) (5,584) (15,344) (14,641) (14,171)
Constant -32,842 98,090 163,360* 124,318 2,048 -2,071 3,474 -1,436(31,022) (97,842) (86,741) (81,652) (4,147) (11,825) (10,497) (14,205)
Observations 64 72 70 86 64 72 70 72Number of countries 36 35 43 36 35 36R-squared 0.616 0.596 0.644 0.588 0.720 0.506 0.577 0.504Standard errors in parentheses*** p<0.01, ** p<0.05, * p<0.1columns (1) and (5): countries with HIV prevalence > 5.8 excluded from the treatment group;columns (2) and (6): countries with increase in ODA > 1.57 and < 3.15 excluded;columns (3) and (7): only countries in sub-Sahara Africa;columns (4) and (8): excl. observations for which UNAIDS does not provide clear point estimates.
People living with HIV AIDS deaths

20
Table 3: ODA effects on AIDS-related deaths: DAC countries versus multilateral organizations as major donors (1) (2) (3) (4) (5) (6) (7) (8) (9) (10)
2nd period -6,700 -7,969 -10,004 -3,287 1,735 -6,700** -7,646** -7,529** 745 -1,551(6,391) (6,043) (6,446) (5,952) (15,433) (3,068) (2,937) (3,202) (2,109) (5,652)
Treatment 18,667** 12,262* 12,064 1,851 6,215 2,357 2,289 3,842 2,031 1,023(7,446) (7,314) (8,068) (7,784) (9,007) (4,154) (3,950) (4,174) (2,560) (3,114)
Treatment * 2nd period -25,193** -29,245*** -25,269** -13,697 -21,543 -3,400 -3,767 -414 -2,969 -2,367(10,530) (10,018) (10,190) (10,865) (13,056) (5,874) (5,587) (5,788) (3,622) (4,382)
AIDS deaths 0.177*** 0.107 0.463*** 0.289* 0.132*** -0.184 0.633*** 0.601***(0.056) (0.075) (0.111) (0.152) (0.048) (0.129) (0.062) (0.203)
AIDS deaths * 2nd period -0.374*** -0.160 -0.664*** -0.481**(0.126) (0.175) (0.072) (0.237)
Log population 0.00024* 0.00046** 0.00033** 0.00002(0.00014) (0.00020) (0.00013) (0.00015)
Log population * 2nd period -0.00056** -0.00021(0.00028) (0.00021)
Log GDP per capita 1.667 2.710 -0.736 -0.508(2.672) (3.476) (0.889) (0.999)
Log GDP per capita * 2nd period -1.687 0.676(5.195) (1.260)
Control of corruption 5,883 6,191 -1,090 -1,005(5,459) (6,854) (2,809) (2,596)
Control of corruption * 2nd period -687 -2401(10,537) (3,910)
Public health expenditure 1,264 849 309 -119(2,928) (3,707) (1,450) (1,813)
Public health exp. * 2nd period 534 -977(5,788) (2,200)
Civil war -6,798 -8,646 -4,080 -6,625*(7,522) (9,032) (4,212) (3,652)
Civil war * 2nd period 5,144 8,802(15,111) (5,827)
Constant 6,254 4,337 3,397 1,220 -2,155 6,254*** 4,825** 3,363 -617 930(4,519) (4,307) (8,809) (4,223) (10,855) (2,169) (2,127) (4,397) (1,499) (4,409)
Observations 76 76 72 76 72 66 66 62 66 62Number of countries 38 38 36 38 36 33 33 31 33 31R-squared 0.191 0.290 0.388 0.369 0.507 0.125 0.222 0.346 0.679 0.739Standard errors in parentheses*** p<0.01, ** p<0.05, * p<0.1
Treatment group: DAC countries major donor Treatment group: Multilateral major donor

21
Table 4: ODA effects on AIDS-related deaths: United States and Global Fund as major donor (1) (2) (3) (4) (5) (6) (7) (8) (9) (10) (11) (12) (13) (14) (15)
2nd period -6,700 -8,140 -10,351 -3,762 -8,630 -6,700 -8,148 -10,423 -3,873 -10,653 -6,700** -7,648** -7,525** 720 -620(6,366) (5,935) (6,408) (5,936) (15,955) (6,422) (5,996) (6,495) (6,030) (16,336) (3,101) (2,970) (3,249) (2,147) (6,046)
Treatment 16,738** 10,435 9,882 1,853 7,436 18,321** 11,441 10,523 2,327 8,806 3,371 3,124 4,051 2,187 172(7,595) (7,295) (8,223) (7,727) (9,361) (7,865) (7,603) (8,825) (8,197) (10,552) (4,386) (4,172) (4,478) (2,720) (3,740)
Treatment * 2nd period -21,492** -25,632** -22,730** -12,967 -29,879** -22,917** -27,480** -24,454** -14,036 -35,049** -4,600 -5,124 -1,428 -3,234 -1,971(10,741) (10,060) (10,378) (10,793) (13,440) (11,123) (10,447) (10,814) (11,434) (14,933) (6,203) (5,902) (6,125) (3,851) (4,910)
AIDS deaths 0.200*** 0.144 0.473*** 0.257 0.201*** 0.149 0.468*** 0.239 0.132*** -0.181 0.631*** 0.615***(0.058) (0.088) (0.118) (0.171) (0.060) (0.093) (0.122) (0.184) (0.049) (0.131) (0.064) (0.209)
AIDS deaths * 2nd period -0.351** 0.013 -0.343** 0.061 -0.662*** -0.500**(0.134) (0.200) (0.138) (0.214) (0.074) (0.242)
Log population 0.00019 0.00049** 0.00018 0.00050** 0.00033** 0.00001(0.00015) (0.00021) (0.00160) (0.00022) (0.00013) (0.00016)
Log population * 2nd period -0.00083*** -0.00088*** -0.00020(0.00030) (0.00031) (0.00021)
Log GDP per capita 1.719 3.162 1.772 3.314 -1.020 -0.963(2.820) (3.594) (2.884) (3.667) (1.177) (1.475)
Log GDP per capita * 2nd period -3.980 -4.536 0.648(5.246) (5.341) (1.784)
Control of corruption 4,358 6,531 4,209 6,309 -1,128 -1,550(5,625) (6,707) (5,707) (6,816) (2,935) (2,929)
Control of corruption * 2nd period -8,568 -8,558 -2,227(10,742) (10,877) (4,196)
Public health expenditure 1,361 -200 1,303 -695 404 473(3,577) (4,623) (3,779) (4,967) (1,540) (2,308)
Public health exp. * 2nd period 6,544 8,187 -1,430(6,662) (7,047) (2,637)
Civil war -7,886 -8,475 -8,085 -8,878 -4,165 -7,033*(7,529) (8,763) (7,673) (8,957) (4,339) (3,825)
Civil war * 2nd period 1,397 2,358 8,786(14,726) (14,948) (6,011)
Constant 6,254 4,077 2,893 1,114 -683 6,254 4,065 2,941 1,166 -25 6,254*** 4,821** 3,508 -602 114(4,502) (4,234) (9,226) (4,217) (11,282) (4,541) (4,279) (9,446) (4,286) (11,615) (2,193) (2,151) (4,484) (1,526) (4,866)
Observations 74 74 70 74 70 72 72 68 72 68 64 64 60 64 60Number of countries 37 37 35 37 35 36 36 34 36 34 32 32 30 32 30R-squared 0.156 0.281 0.369 0.347 0.518 0.163 0.285 0.371 0.346 0.525 0.133 0.229 0.351 0.678 0.743Standard errors in parentheses*** p<0.01, ** p<0.05, * p<0.1
Treatment group: US major donor Treatment group: US major donor + PEPFAR Treatment group: Global Fund major donor

22
Table 5: ODA effects on AIDS-related deaths: Robustness tests for major donors (1) (2) (3) (4)
DAC countriesMultilateral
(Global Fund) US PEPFAR2nd period 6,377 14,925 -6,779 -8,326
(19,952) (9,629) (20,592) (21,078)Treatment 5,964 -2,736 6,865 7,843
(10,702) (4,359) (10,556) (11,929)Treatment * 2nd period -19,854 -849 -29,319* -33,963**
(14,988) (5,780) (14,910) (16,645)AIDS deaths 0.237 0.632*** 0.209 0.197
(0.187) (0.219) (0.198) (0.211)AIDS deaths * 2nd period -0.068 -0.519* 0.134 0.174
(0.210) (0.275) (0.228) (0.243)Log population 0.00051** 0.00003 0.00053** 0.00054**
(0.00024) (0.00016) (0.00024) (0.00025)Log population * 2nd period -0.00064* -0.00022 -0.00096*** -0.00101***
(0.00032) (0.00025) (0.00034) (0.00350)Log GDP per capita 3.094 -3.114* 3.519 3.599
(4.274) (1.776) (4.274) (4.363)Log GDP per capita * 2nd period -0.818 2.174 -4.341 -4.752
(6.201) (2.274) (6.164) (6.290)Control of corruption 6,593 -12,992** 7,419 7,227
(9,672) (5,468) (9,550) (9,756)Control of corruption * 2nd period -712 6,027 -11,282 -11,264
(13,081) (7,162) (13,264) (13,515)Public health expenditure 2,116 6,792** 895 574
(4,733) (3,279) (5,884) (6,218)Public health exp. * 2nd period -3,509 -7,466** 4,519 5,827
(7,072) (3,616) (8,167) (8,559)Civil war -6,073 -7,261* -5,869 -6,189
(10,541) (4,189) (10,047) (10,349)Civil war * 2nd period 1,729 7,633 -4,159 -3,264
(16,829) (6,819) (16,174) (16,535)Constant -3,766 -17,381** -1,596 -1,190
(15,932) (8,459) (16,582) (16,985)
Observations 60 48 58 56Number of countries 30 24 29 28R-squared 0.517 0.812 0.546 0.552Standard errors in parentheses*** p<0.01, ** p<0.05, * p<0.1
23
Appendix A: Definition of variables and sources Variable Definition Source People living with HIV
Estimated number of people living with HIV by country, 1998-2007
UNAIDS (http://www.unaids.org/en/KnowledgeCentre/HIVData/ GlobalReport/2008/2008_Global_report.asp)
AIDS deaths Number of AIDS deaths in adults and children by country, 1998-2007
UNAIDS
HIV prevalence rate
Adult (15-49) HIV prevalence, percent by country, 1998-2007
UNAIDS
ODA Official development assistance, commitments, US$ per capita of the recipient country’s population, constant prices of 2008, 1998-2007
OECD, CRS (http://stats.oecd.org/Index.aspx?DatasetCode=CRSNEW)
Population Population of the recipient country at the beginning of each period (1998, 2003)
World Development Indicators (WDI), http://databank.worldbank.org/ddp/home.do (accessed: July 2010)
GDP per capita GDP per capita of the recipient country at the beginning of each period (1998, 2003), US$, constant prices of 2000
World Development Indicators (WDI)
Control of corruption
Control of corruption of the recipient country at the beginning of each period (1998, 2003)
World Bank’s Worldwide Governance Indicators (WGI), http://info.worldbank.org/governance/wgi/index.asp
Public health expenditure
Public health expenditure as a share of GDP of the recipient country at the beginning of each period (1998, 2003), in percent
Institute for Health Metrics and Evaluation (IHME), http://www.healthmetricsandevaluation.org/resources/datasets/2010/public_financing_health.html, variable: GHE-S/GDP, WHO
Civil war Dummy variable set equal to one if a major internal armed conflict (at least 1,000 battle-related deaths in one year) occurred in the recipient country during the respective period (1998-2002, 2003-2007)
UCDP/PRIO Armed Conflict Dataset v.4-2009, http://www.pcr.uu.se/research/UCDP/data_and_publications/datasets.htm

24
Appendix B: Descriptive statistics (year 2003)
Obs. Mean Std. Dev. Min Max Obs. Mean Std. Dev. Min MaxPeople living with HIV (level) 24 251,013 486,786 2,200 2,400,000 23 740,244 1,138,644 4,600 5,300,000AIDS deaths (level) 24 18,050 33,607 200 160,000 23 55,404 69,160 200 270,000HIV prevalence rate (level) 24 2.3 1.4 1.1 5.9 23 9.7 8.6 1.2 26.6Population 24 20,100,000 30,200,000 251,955 134,000,000 23 14,700,000 17,800,000 487,301 70,900,000GDP per capita 23 1,006 1,285 83 4,020 23 1,364 1,961 124 8014.387Control of corruption 24 -0.65 0.58 -1.51 1.22 23 -0.63 0.65 -1.74 1.07Public health expenditure 23 1.68 0.94 0.00 4.56 23 2.35 1.61 0.55 7.29Civil war 24 0.08 0.28 0 1 23 0.09 0.29 0 1
Control group Treatment group
25
Appendix C: HIV prevalence and ODA in sample countries (treatment and control group) Country HIV prevalence rate
2003ODA pc 1998 -2002
(mean)ODA pc 2003 - 2007
(mean)Difference Treatment
groupBotswana 25.9 1.85 40.25 38.40 1Namibia 15.2 2.90 36.09 33.20 1Guyana 2.5 1.11 26.86 25.75 1Swaziland 26.6 1.85 18.48 16.62 1Lesotho 23.7 0.88 10.97 10.09 1Zambia 15.2 2.30 12.13 9.82 1Rwanda 3.7 1.03 9.06 8.03 1Haiti 2.2 0.68 6.28 5.60 1South Africa 17.9 0.41 5.80 5.38 1Mozambique 11.5 1.23 6.56 5.33 1Kenya 7.0 1.15 6.16 5.00 1Uganda 6.9 1.39 6.09 4.70 1Malawi 12.8 1.95 6.28 4.33 1Tanzania, United Rep. of 6.7 0.83 4.83 3.99 1Zimbabwe 22.7 1.50 5.48 3.98 1Suriname 1.7 0.07 3.59 3.52 1Equatorial Guinea 3.7 0.49 3.71 3.22 1Cambodia 1.2 0.89 4.05 3.16 1Ethiopia 2.2 0.32 2.93 2.61 1Cote d'Ivoire 5.3 0.21 2.42 2.20 1Trinidad and Tobago 1.4 0.22 2.40 2.18 1Liberia 1.5 0.04 2.20 2.16 1Central African Republic 6.4 0.57 2.61 2.04 1Mali 1.5 0.35 2.36 2.01 0Belize 2.1 0.15 2.14 1.99 0Togo 3.5 0.08 2.04 1.97 0Gabon 5.9 0.14 1.99 1.85 0Dominican Republic 1.2 0.44 2.02 1.58 0Benin 1.3 0.74 2.23 1.49 0Angola 1.9 0.14 1.59 1.45 0Burkina Faso 1.9 0.82 2.19 1.37 0Barbados 1.2 0.00 1.25 1.25 0Congo 4.0 0.41 1.56 1.16 0Sierra Leone 1.5 0.30 1.26 0.96 0Guinea-Bissau 1.9 0.29 1.19 0.90 0Congo, Dem. Rep. of the 1.4 0.08 0.92 0.84 0Burundi 2.9 0.87 1.68 0.80 0Cameroon 5.7 0.40 1.14 0.74 0Ukraine 1.1 0.00 0.64 0.64 0Thailand 1.5 0.06 0.64 0.59 0Nigeria 3.2 0.60 1.18 0.58 0Ghana 2.2 1.08 1.59 0.51 0Sudan 1.4 0.01 0.51 0.50 0Guinea 1.4 0.71 0.98 0.27 0Eritrea 1.2 2.02 2.20 0.18 0Jamaica 1.5 2.92 2.81 -0.11 0Chad 3.5 0.63 0.43 -0.21 0Ranked according to difference in ODA, (2003-2007) minus (1998-2002)
26
Appendix D: Countries in the respective treatment and control groups
Column (1), (5) Column (2), (6) Column (3), (7) Column (4) Column (8) DAC countries Multilateral US PEPFAR Global Fund
Botswana 38.4 X X X X X X X XNamibia 33.2 X X X X X X X XGuyana 25.8 X X X X X X XSwaziland 16.6 X X X X X X XLesotho 10.1 X X X X X X XZambia 9.8 X X X X X X X XRwanda 8.0 X X X X X X X X XHaiti 5.6 X X X X X X X XSouth Africa 5.4 X X X X X X X XMozambique 5.3 X X X X X X X XKenya 5.0 X X X X X XUganda 4.7 X X X X X X X XMalawi 4.3 X X X X X X XTanzania, United Rep. of 4.0 X X X X X X X XZimbabwe 4.0 X X X X X XSuriname 3.5 X X X X X XEquatorial Guinea 3.2 X X X X X X XCambodia 3.2 X X X X X X XEthiopia 2.6 X X X X X X XCote d'Ivoire 2.2 X X X X X X X XTrinidad and Tobago 2.2 X X X XLiberia 2.2 X X X X X X XCentral African Republic 2.0 X X X X X X
Mali 2.0 X X X X X X X X X XBelize 2.0 X X X X X X X XTogo 2.0 X X X X X X X X X XGabon 1.9 X X X X X X X X XDominican Republic 1.6 X X X X X X X X X XBenin 1.5 X X X X X X X X X X XAngola 1.4 X X X X X X X X X X XBurkina Faso 1.4 X X X X X X X X X X X(Barbados) 1.3 X X X X X X X X XCongo 1.2 X X X X X X X X X X XSierra Leone 1.0 X X X X X X X X X X XGuinea-Bissau 0.9 X X X X X X X X X XCongo, Dem. Rep. of the 0.8 X X X X X X X X XBurundi 0.8 X X X X X X X X X X XCameroon 0.7 X X X X X X X X X X X(Ukraine) 0.6 X X X X X X X X XThailand 0.6 X X X X X X X X X XNigeria 0.6 X X X X X X X X X X XGhana 0.5 X X X X X X X X X X XSudan 0.5 X X X X X X X X X XGuinea 0.3 X X X X X X X X X X XEritrea 0.2 X X X X X X X X X XJamaica -0.1 X X X X X X X X XChad -0.2 X X X X X X X X X X XFor countries in brackets control variables have missing values.
Control group
Treatment group
Table 2Table 1 Table 4Table 3Difference in ODA, (2003-2007) minus (1998-2002)

Bisher erschienene Diskussionspapiere
Nr. 111: Nunnenkamp, Peter; Öhler, Hannes: Throwing Foreign Aid at HIV/AIDS in Developing Countries: Missing the Target?, August 2010
Nr. 110: Ohr, Renate; Zeddies, Götz: „Geschäftsmodell Deutschland“ und außenwirtschaftliche Ungleichgewichte in der EU, Juli 2010
Nr. 109: Nunnenkamp, Peter; Öhler, Hannes: Funding, Competition and the Efficiency of NGOs: An Empirical Analysis of Non-charitable Expenditure of US NGOs Engaged in Foreign Aid, Juli 2010
Nr. 108: Krenz, Astrid: La Distinction reloaded: Returns to Education, Family Background, Cultural and Social Capital in Germany, Juli 2010
Nr. 107: Krenz, Astrid: Services sectors' agglomeration and its interdependence with industrial agglomeration in the European Union, Juli 2010
Nr. 106: Krenz, Astrid; Rübel, Gerhard: Industrial Localization and Countries' Specialization in the European Union: An Empirical Investigation, Juli 2010
Nr. 105: Schinke, Jan Christian: Follow the Sun! How investments in solar power plants in Sicily can generate high returns of investments and help to prevent global warming, Juni 2010
Nr. 104: Dreher, Axel; Sturm, Jan-Egbert; Vreeland, James Raymon: Does membership on the Security Council influence IMF conditionality?, Juni 2010
Nr. 103: Öhler, Hannes; Nunnenkamp, Peter; Dreher, Axel: Does Conditionality Work? A Test for an Innovative US Aid Scheme, Juni 2010
Nr. 102: Gehringer, Agnieszka: Pecuniary Knowledge Externalities in a New Taxonomy: Knowledge Interactions in a Vertically Integrated System, Juni 2010
Nr. 101: Gehringer, Agnieszka: Pecuniary Knowledge Externalities across European Countries – are there leading Sectors?, Juni 2010
Nr. 100: Gehringer, Agnieszka: Pecuniary Knowledge Externalities and Innovation: Intersectoral Linkages and their Effects beyond Technological Spillovers, Juni 2010
Nr. 99: Dreher, Axel; Nunnenkamp, Peter; Öhler, Hannes: Why it pays for aid recipients to take note of the Millennium Challenge Corporation: Other donors do!, April 2010
Nr. 98: Baumgarten, Daniel; Geishecker, Ingo; Görg, Holger: Offshoring, tasks, and the skill-wage pattern, März 2010
Nr. 97: Dreher, Axel; Klasen, Stephan; Raymond, James; Werker, Eric: The costs of favoritism: Is politically-driven aid less effective?, März 2010
Nr. 96: Dreher, Axel; Nunnenkamp, Peter; Thiele, Rainer: Are ‘New’ Donors Different? Comparing the Allocation of Bilateral Aid between Non-DAC and DAC Donor Countries, März 2010
Nr. 95: Lurweg, Maren; Westermeier, Andreas: Jobs Gained and Lost through Trade – The Case of Germany, März 2010
Nr. 94: Bernauer, Thomas; Kalbhenn, Anna; Koubi, Vally; Ruoff, Gabi: On Commitment Levels and Compliance Mechanisms – Determinants of Participation in Global Environmental Agreements, Januar 2010
Nr. 93: Cho, Seo-Young: International Human Rights Treaty to Change Social Patterns – The Convention on the Elimination of All Forms of Discrimination against Women, Januar 2010
Nr. 92: Dreher, Axel; Nunnenkamp, Peter; Thiel, Susann; Thiele, Rainer: Aid Allocation by German NGOs: Does the Degree of Public Refinancing Matter?, Januar 2010
Nr. 91: Bjørnskov, Christian; Dreher, Axel; Fischer, Justina A. V.; Schnellenbach, Jan: On the relation between income inequality and happiness: Do fairness perceptions matter?, Dezember 2009

Nr. 90: Geishecker, Ingo: Perceived Job Insecurity and Well-Being Revisited: Towards Conceptual Clarity, Dezember 2009
Nr. 89: Kühl, Michael: Excess Comovements between the Euro/US dollar and British pound/US dollar exchange rates, November 2009
Nr. 88: Mourmouras, Alex, Russel, Steven H.: Financial Crises, Capital Liquidation and the Demand for International Reserves, November 2009
Nr. 87: Goerke, Laszlo, Pannenberg, Markus: An Analysis of Dismissal Legislation: Determinants of Severance Pay in West Germany, November 2009
Nr. 86: Marchesi, Silvia, Sabani, Laura, Dreher, Axel: Read my lips: the role of information transmission in multilateral reform design, Juni 2009
Nr. 85: Heinig, Hans Michael: Sind Referenden eine Antwort auf das Demokratiedilemma der EU?, Juni 2009
Nr. 84: El-Shagi, Makram: The Impact of Fixed Exchange Rates on Fiscal Discipline, Juni 2009
Nr. 83: Schneider, Friedrich: Is a Federal European Constitution for an Enlarged European Union Necessary? Some Preliminary Suggestions using Public Choice Analysis, Mai 2009
Nr. 82: Vaubel, Roland: Nie sollst Du mich befragen? Weshalb Referenden in bestimmten Politikbereichen – auch in der Europapolitik – möglich sein sollten, Mai 2009
Nr. 81: Williamson, Jeffrey G.: History without Evidence: Latin American Inequality since 1491, Mai 2009
Nr. 80: Erdogan, Burcu: How does the European Integration affect the European Stock Markets?, April 2009
Nr. 79: Oelgemöller, Jens; Westermeier, Andreas: RCAs within Western Europe, März 2009
Nr. 78: Blonski, Matthias; Lilienfeld-Toal, Ulf von: Excess Returns and the Distinguished Player Paradox, Oktober 2008
Nr. 77: Lechner, Susanne; Ohr, Renate: The Right of Withdrawal in the Treaty of Lisbon: A game theoretic reflection on different decision processes in the EU, Oktober 2008
Nr. 76: Kühl, Michael: Strong comovements of exchange rates: Theoretical and empirical cases when currencies become the same asset, Juli 2008
Nr. 75: Höhenberger, Nicole; Schmiedeberg, Claudia: Structural Convergence of European Countries, Juli 2008
Nr. 74: Nowak-Lehmann D., Felicitas; Vollmer, Sebastian; Martinez-Zarzoso, Inmaculada: Does Comparative Advantage Make Countries Competitive? A Comparison of China and Mexico, Juli 2008
Nr. 73: Fendel, Ralf; Lis, Eliza M.; Rülke, Jan-Christoph: Does the Financial Market Believe in the Phillips Curve? – Evidence from the G7 countries, Mai 2008
Nr. 72: Hafner, Kurt A.: Agglomeration Economies and Clustering – Evidence from German Firms, Mai 2008
Nr. 71: Pegels, Anna: Die Rolle des Humankapitals bei der Technologieübertragung in Entwicklungsländer, April 2008
Nr. 70: Grimm, Michael; Klasen, Stephan: Geography vs. Institutions at the Village Level, Februar 2008
Nr. 69: Van der Berg, Servaas: How effective are poor schools? Poverty and educational outcomes in South Africa, Januar 2008
Nr. 68: Kühl, Michael: Cointegration in the Foreign Exchange Market and Market Efficiency since the Introduction of the Euro: Evidence based on bivariate Cointegration Analyses, Oktober 2007

Nr. 67: Hess, Sebastian; Cramon-Taubadel, Stephan von: Assessing General and Partial Equilibrium Simulations of Doha Round Outcomes using Meta-Analysis, August 2007
Nr. 66: Eckel, Carsten: International Trade and Retailing: Diversity versus Accessibility and the Creation of “Retail Deserts”, August 2007
Nr. 65: Stoschek, Barbara: The Political Economy of Enviromental Regulations and Industry Compensation, Juni 2007
Nr. 64: Martinez-Zarzoso, Inmaculada; Nowak-Lehmann D., Felicitas; Vollmer, Sebastian: The Log of Gravity Revisited, Juni 2007
Nr. 63: Gundel, Sebastian: Declining Export Prices due to Increased Competition from NIC – Evidence from Germany and the CEEC, April 2007
Nr. 62: Wilckens, Sebastian: Should WTO Dispute Settlement Be Subsidized?, April 2007
Nr. 61: Schöller, Deborah: Service Offshoring: A Challenge for Employment? Evidence from Germany, April 2007
Nr. 60: Janeba, Eckhard: Exports, Unemployment and the Welfare State, März 2007
Nr. 59: Lambsdoff, Johann Graf; Nell, Mathias: Fighting Corruption with Asymmetric Penalties and Leniency, Februar 2007
Nr. 58: Köller, Mareike: Unterschiedliche Direktinvestitionen in Irland – Eine theoriegestützte Analyse, August 2006
Nr. 57: Entorf, Horst; Lauk, Martina: Peer Effects, Social Multipliers and Migrants at School: An International Comparison, März 2007 (revidierte Fassung von Juli 2006)
Nr. 56: Görlich, Dennis; Trebesch, Christoph: Mass Migration and Seasonality Evidence on Moldova’s Labour Exodus, Mai 2006
Nr. 55: Brandmeier, Michael: Reasons for Real Appreciation in Central Europe, Mai 2006
Nr. 54: Martínez-Zarzoso, Inmaculada; Nowak-Lehmann D., Felicitas: Is Distance a Good Proxy for Transport Costs? The Case of Competing Transport Modes, Mai 2006
Nr. 53: Ahrens, Joachim; Ohr, Renate; Zeddies, Götz: Enhanced Cooperation in an Enlarged EU, April 2006
Nr. 52: Stöwhase, Sven: Discrete Investment and Tax Competition when Firms shift Profits, April 2006
Nr. 51: Pelzer, Gesa: Darstellung der Beschäftigungseffekte von Exporten anhand einer Input-Output-Analyse, April 2006
Nr. 50: Elschner, Christina; Schwager, Robert: A Simulation Method to Measure the Tax Burden on Highly Skilled Manpower, März 2006
Nr. 49: Gaertner, Wulf; Xu, Yongsheng: A New Measure of the Standard of Living Based on Functionings, Oktober 2005
Nr. 48: Rincke, Johannes; Schwager, Robert: Skills, Social Mobility, and the Support for the Welfare State, September 2005
Nr. 47: Bose, Niloy; Neumann, Rebecca: Explaining the Trend and the Diversity in the Evolution of the Stock Market, Juli 2005
Nr. 46: Kleinert, Jörn; Toubal, Farid: Gravity for FDI, Juni 2005
Nr. 45: Eckel, Carsten: International Trade, Flexible Manufacturing and Outsourcing, Mai 2005
Nr. 44: Hafner, Kurt A.: International Patent Pattern and Technology Diffusion, Mai 2005
Nr. 43: Nowak-Lehmann D., Felicitas; Herzer, Dierk; Martínez-Zarzoso, Inmaculada; Vollmer, Sebastian: Turkey and the Ankara Treaty of 1963: What can Trade Integration Do for Turkish Exports, Mai 2005
Nr. 42: Südekum, Jens: Does the Home Market Effect Arise in a Three-Country Model?, April 2005

Nr. 41: Carlberg, Michael: International Monetary Policy Coordination, April 2005
Nr. 40: Herzog, Bodo: Why do bigger countries have more problems with the Stability and Growth Pact?, April 2005
Nr. 39: Marouani, Mohamed A.: The Impact of the Mulitfiber Agreement Phaseout on Unemployment in Tunisia: a Prospective Dynamic Analysis, Januar 2005
Nr. 38: Bauer, Philipp; Riphahn, Regina T.: Heterogeneity in the Intergenerational Transmission of Educational Attainment: Evidence from Switzerland on Natives and Second Generation Immigrants, Januar 2005
Nr. 37: Büttner, Thiess: The Incentive Effect of Fiscal Equalization Transfers on Tax Policy, Januar 2005
Nr. 36: Feuerstein, Switgard; Grimm, Oliver: On the Credibility of Currency Boards, Oktober 2004
Nr. 35: Michaelis, Jochen; Minich, Heike: Inflationsdifferenzen im Euroraum – eine Bestandsaufnahme, Oktober 2004
Nr. 34: Neary, J. Peter: Cross-Border Mergers as Instruments of Comparative Advantage, Juli 2004
Nr. 33: Bjorvatn, Kjetil; Cappelen, Alexander W.: Globalisation, inequality and redistribution, Juli 2004
Nr. 32: Stremmel, Dennis: Geistige Eigentumsrechte im Welthandel: Stellt das TRIPs-Abkommen ein Protektionsinstrument der Industrieländer dar?, Juli 2004
Nr. 31: Hafner, Kurt: Industrial Agglomeration and Economic Development, Juni 2004
Nr. 30: Martinez-Zarzoso, Inmaculada; Nowak-Lehmann D., Felicitas: MERCOSUR-European Union Trade: How Important is EU Trade Liberalisation for MERCOSUR’s Exports?, Juni 2004
Nr. 29: Birk, Angela; Michaelis, Jochen: Employment- and Growth Effects of Tax Reforms, Juni 2004
Nr. 28: Broll, Udo; Hansen, Sabine: Labour Demand and Exchange Rate Volatility, Juni 2004
Nr. 27: Bofinger, Peter; Mayer, Eric: Monetary and Fiscal Policy Interaction in the Euro Area with different assumptions on the Phillips curve, Juni 2004
Nr. 26: Torlak, Elvisa: Foreign Direct Investment, Technology Transfer and Productivity Growth in Transition Countries, Juni 2004
Nr. 25: Lorz, Oliver; Willmann, Gerald: On the Endogenous Allocation of Decision Powers in Federal Structures, Juni 2004
Nr. 24: Felbermayr, Gabriel J.: Specialization on a Technologically Stagnant Sector Need Not Be Bad for Growth, Juni 2004
Nr. 23: Carlberg, Michael: Monetary and Fiscal Policy Interactions in the Euro Area, Juni 2004
Nr. 22: Stähler, Frank: Market Entry and Foreign Direct Investment, Januar 2004
Nr. 21: Bester, Helmut; Konrad, Kai A.: Easy Targets and the Timing of Conflict, Dezember 2003
Nr. 20: Eckel, Carsten: Does globalization lead to specialization, November 2003
Nr. 19: Ohr, Renate; Schmidt, André: Der Stabilitäts- und Wachstumspakt im Zielkonflikt zwischen fiskalischer Flexibilität und Glaubwürdigkeit: Ein Reform-ansatz unter Berücksichtigung konstitutionen- und institutionenökonomischer Aspekte, August 2003
Nr. 18: Ruehmann, Peter: Der deutsche Arbeitsmarkt: Fehlentwicklungen, Ursachen und Reformansätze, August 2003
Nr. 17: Suedekum, Jens: Subsidizing Education in the Economic Periphery: Another Pitfall of Regional Policies?, Januar 2003
Nr. 16: Graf Lambsdorff, Johann; Schinke, Michael: Non-Benevolent Central Banks, Dezember 2002

Nr. 15: Ziltener, Patrick: Wirtschaftliche Effekte des EU-Binnenmarktprogramms, November 2002
Nr. 14: Haufler, Andreas; Wooton, Ian: Regional Tax Coordination and Foreign Direct Investment, November 2001
Nr. 13: Schmidt, André: Non-Competition Factors in the European Competition Policy: The Necessity of Institutional Reforms, August 2001
Nr. 12: Lewis, Mervyn K.: Risk Management in Public Private Partnerships, Juni 2001
Nr. 11: Haaland, Jan I.; Wooton, Ian: Multinational Firms: Easy Come, Easy Go?, Mai 2001
Nr. 10: Wilkens, Ingrid: Flexibilisierung der Arbeit in den Niederlanden: Die Entwicklung atypischer Beschäftigung unter Berücksichtigung der Frauenerwerbstätigkeit, Januar 2001
Nr. 9: Graf Lambsdorff, Johann: How Corruption in Government Affects Public Welfare – A Review of Theories, Januar 2001
Nr. 8: Angermüller, Niels-Olaf: Währungskrisenmodelle aus neuerer Sicht, Oktober 2000
Nr. 7: Nowak-Lehmann, Felicitas: Was there Endogenous Growth in Chile (1960-1998)? A Test of the AK model, Oktober 2000
Nr. 6: Lunn, John; Steen, Todd P.: The Heterogeneity of Self-Employment: The Example of Asians in the United States, Juli 2000
Nr. 5: Güßefeldt, Jörg; Streit, Clemens: Disparitäten regionalwirtschaftlicher Entwicklung in der EU, Mai 2000
Nr. 4: Haufler, Andreas: Corporate Taxation, Profit Shifting, and the Efficiency of Public Input Provision, 1999
Nr. 3: Rühmann, Peter: European Monetary Union and National Labour Markets, September 1999
Nr. 2: Jarchow, Hans-Joachim: Eine offene Volkswirtschaft unter Berücksichtigung des Aktienmarktes, 1999
Nr. 1: Padoa-Schioppa, Tommaso: Reflections on the Globalization and the Europeanization of the Economy, Juni 1999
Alle bisher erschienenen Diskussionspapiere zum Download finden Sie im Internet unter: http://www.uni-goettingen.de/de/60920.html.