Embed Size (px)
Citation preview

Thresholds of thermal damage andthermal dose models
Pavel S. Yarmolenko, Ph.D.
Image-GuidedNon-Invasive
TherapeuticEnergy
Objectives Biological effects of heat
Physiologic effects Adaptive response Damage
Overview of thermal dosimetry Thresholds of thermal damage
Interpretability of results Highlights from our recent reviews
Brain Testis Other tissues
Conclusions What effects are significant? Clarity through categorization
Thermoregulation: a unique autonomic system
Evolved to regulate: a stable core T over wide range of ambient T heat loads from work and exercise, and fever
Relies on: behavior conscious awareness of the environment
Courtesy of Dr. Elizabeth Repasky
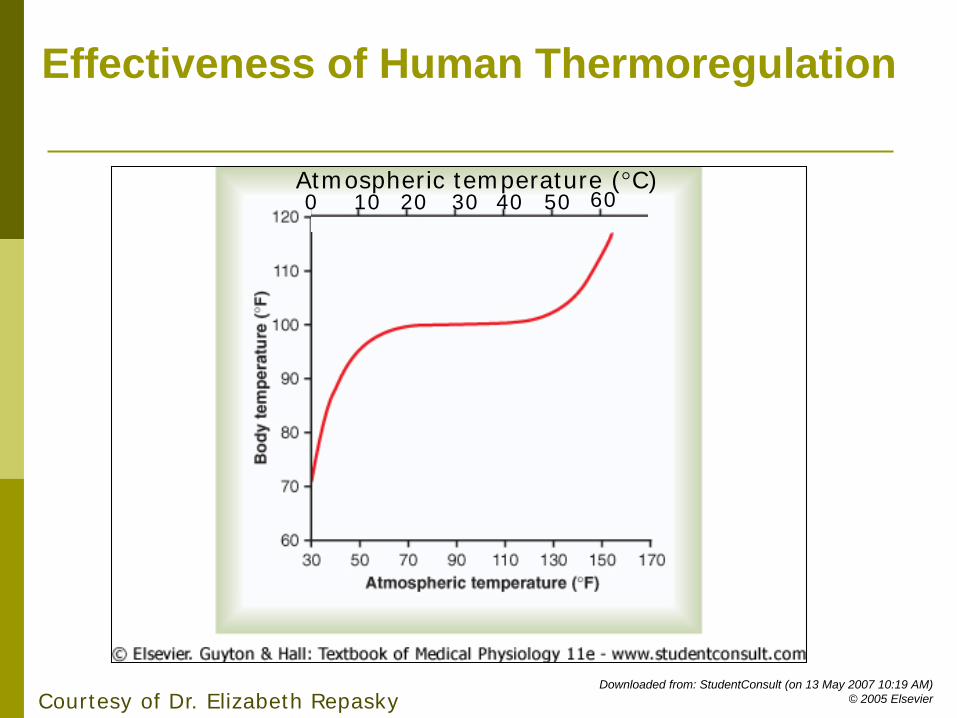
Downloaded from: StudentConsult (on 13 May 2007 10:19 AM)© 2005 Elsevier
Effectiveness of Human Thermoregulation
0 10 20 30 40 50 60Atmospheric temperature (°C)
Courtesy of Dr. Elizabeth Repasky

Thermoregulatory Control in a “Typical” Rodent
Adapted from Gordon (1993)
ReactionAnalysis Result
Courtesy of Dr. Elizabeth Repasky
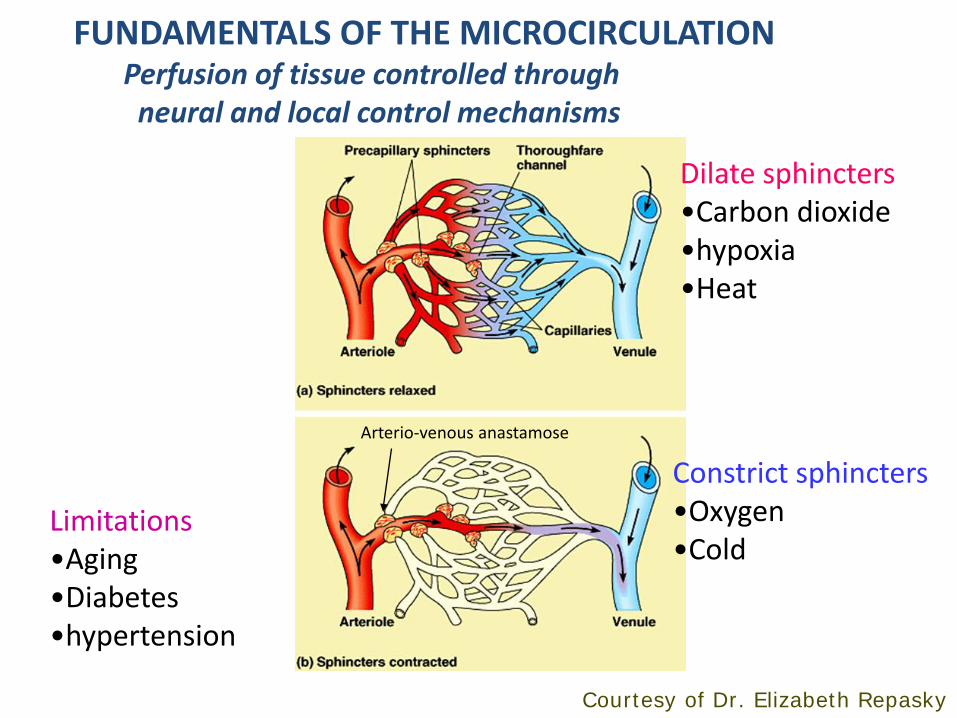
FUNDAMENTALS OF THE MICROCIRCULATIONPerfusion of tissue controlled throughneural and local control mechanisms
Dilate sphincters•Carbon dioxide•hypoxia•Heat
Constrict sphincters•Oxygen•Cold
Limitations•Aging•Diabetes•hypertension
Arterio-venous anastamose
Courtesy of Dr. Elizabeth Repasky

Heart
CNS
Muscle
GI trac
tLive
rSkin
Kidney Fat0
100
200
300
400
500BasalMax dilated
Blo
od fl
ow, m
l/(m
in 1
00 g
)Overall capacity to increase organ blood flow in 70 kg human
X5.7
X2.8
X24.0
X7.8
X6.0 X19.0
X1.16
X3.7
From Mellander & Johansson, 1968
CARDIOVASCULAR CAPACITY following Thermal Stimulation
Courtesy of Dr. Elizabeth Repasky
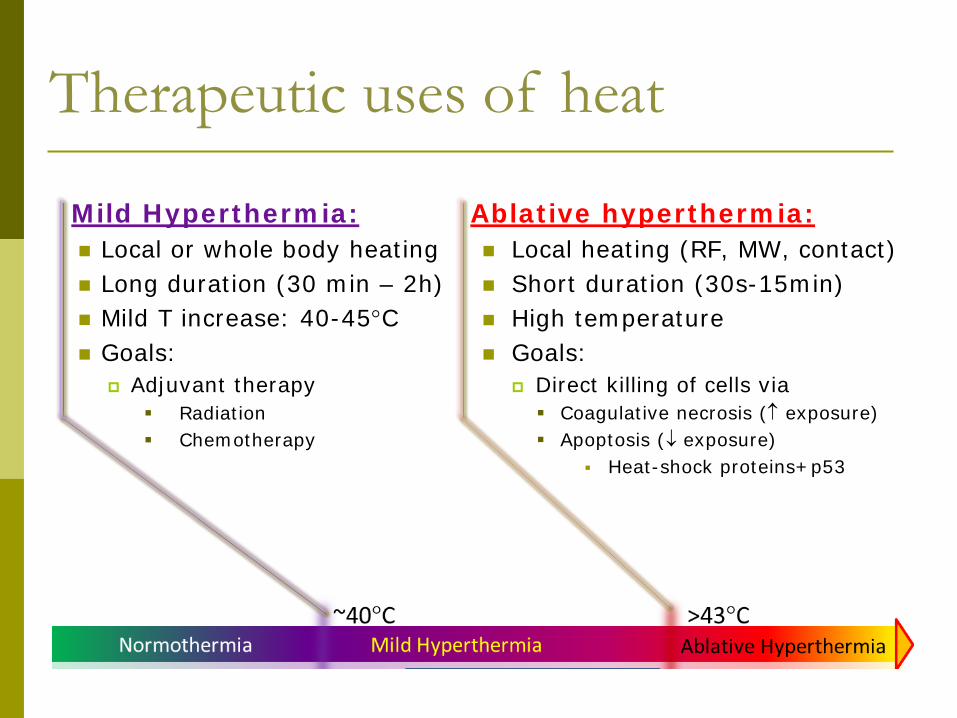
Therapeutic uses of heat
Ablative hyperthermia: Local heating (RF, MW, contact) Short duration (30s-15min) High temperature Goals:
Direct killing of cells via Coagulative necrosis (↑ exposure) Apoptosis (↓ exposure)
Heat-shock proteins+p53
Mild Hyperthermia: Local or whole body heating Long duration (30 min – 2h) Mild T increase: 40-45°C Goals:
Adjuvant therapy Radiation Chemotherapy
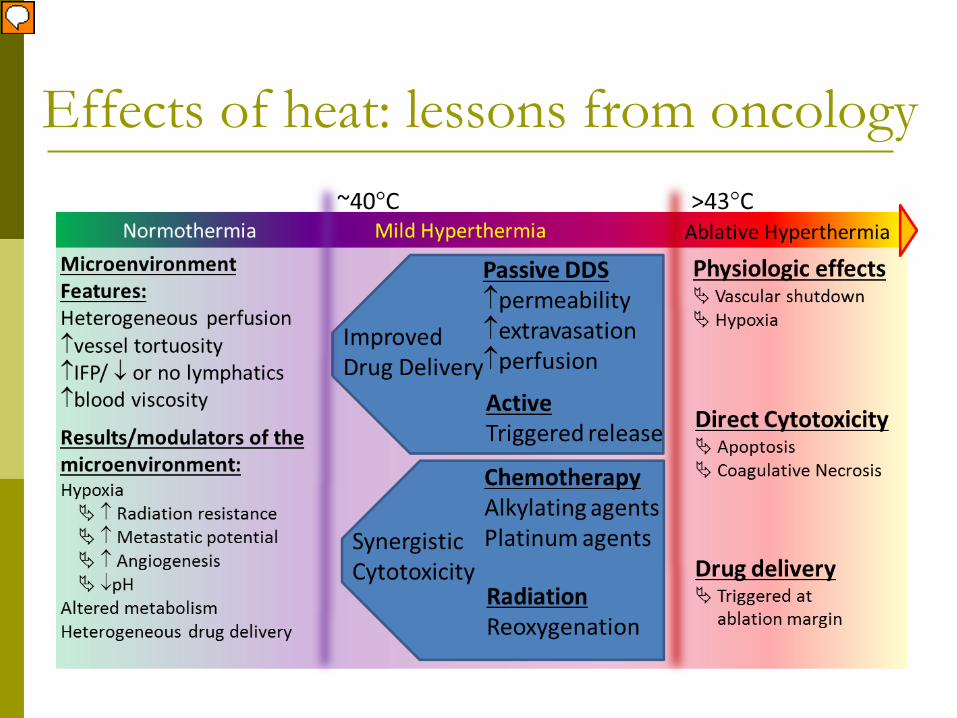
Effects of heat: lessons from oncology
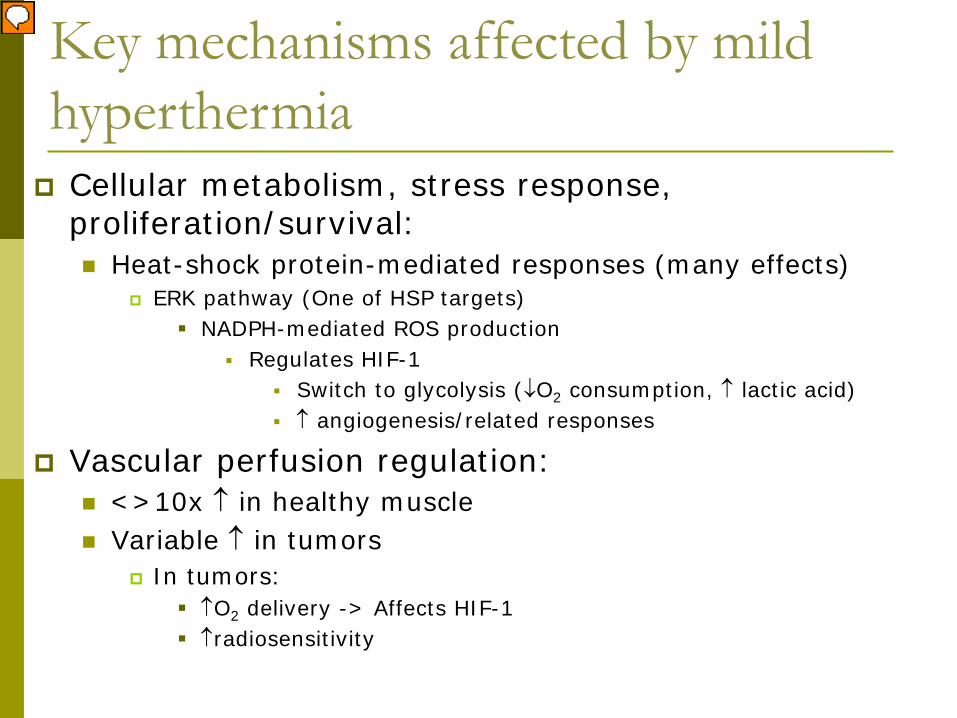
Key mechanisms affected by mild hyperthermia Cellular metabolism, stress response,
proliferation/survival: Heat-shock protein-mediated responses (many effects)
ERK pathway (One of HSP targets) NADPH-mediated ROS production
Regulates HIF-1 Switch to glycolysis (↓O2 consumption, ↑ lactic acid) ↑ angiogenesis/related responses
Vascular perfusion regulation: <>10x ↑ in healthy muscle Variable ↑ in tumors
In tumors: ↑O2 delivery -> Affects HIF-1 ↑radiosensitivity

ERK pathway
NADPH oxidaseROS ROS
HIF-1
Perfusion/Vascularization
VEGF
Oxygen ConsumptionLDHA
PDK1
ReoxygenationMoon et al. 2010. PNAS
HeatHeat response and hypoxia in tumors

Thermal Dosimetry ↑ Variability across:
Species Cell/tissue types Organs
Relate damage to: Exposure type Temperature Duration
Guide: Therapeutic hyperthermia Diagnostic imaging Exposure safety
From Roizin-Towle
Heat: effect on survival of Human Cells
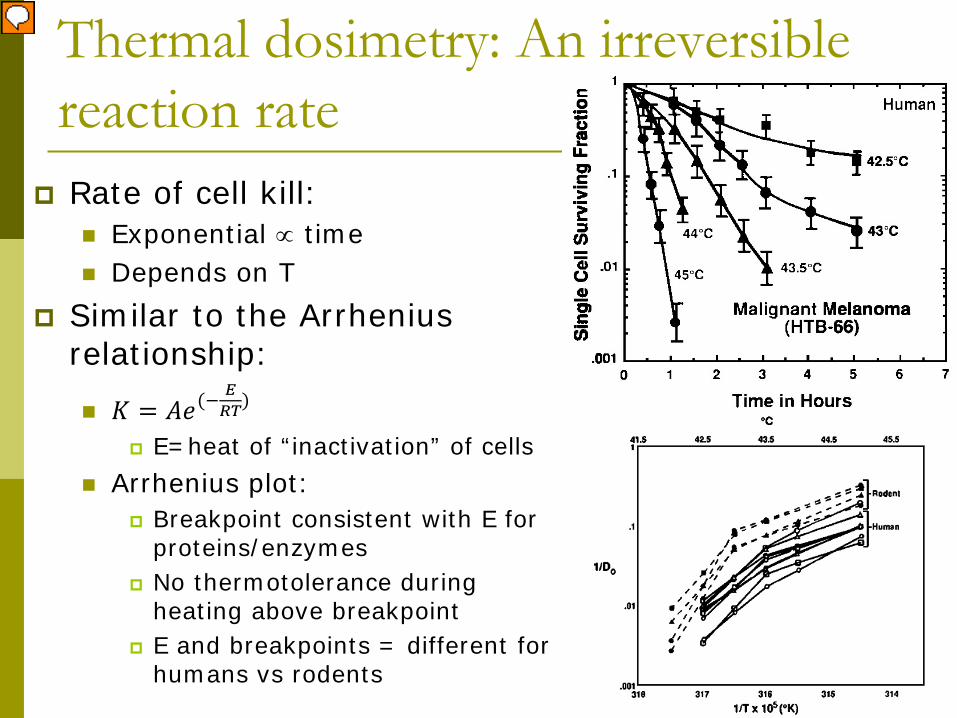
Thermal dosimetry: An irreversible reaction rate
Rate of cell kill: Exponential ∝ time Depends on T
Similar to the Arrhenius relationship:
𝐾𝐾 = 𝐴𝐴𝑒𝑒(− 𝐸𝐸𝑅𝑅𝑅𝑅)
E=heat of “inactivation” of cells Arrhenius plot:
Breakpoint consistent with E for proteins/enzymes
No thermotolerance during heating above breakpoint
E and breakpoints = different for humans vs rodents

Assessment of thermal damage using Damage IndexDerived from Arrhenius relationship, assumes that damage occurswith 1st order Kinetics
C= % undamaged tissueK = 1st order reaction constantt= timeA= frequency factor 1/sEa = activation energy (J/mole)R = universal gas constantT= time dependent function of temperature, K

Assessment of thermal damage using damage index
Ratio of damage at time 0 vs. time (τ)
For complete necrosis or collagen denaturation:
log-linear relationshipbetween Ea and ln(A) across many tissues

Severity of skin damage does not exhibit intuitive relationship with Ea.
Data from Moritz et al.

Requirements to establish damage index as common platform to compare across tissues
Need to establish a range of time-temperature combinations that yield the same isoeffect Such data are difficult to find
Need to see a predictable relationship between Ea and severity of damage
Because there requirements are not yet met: Thermal isoeffect dose = most established
method for standardization/estimation of dose
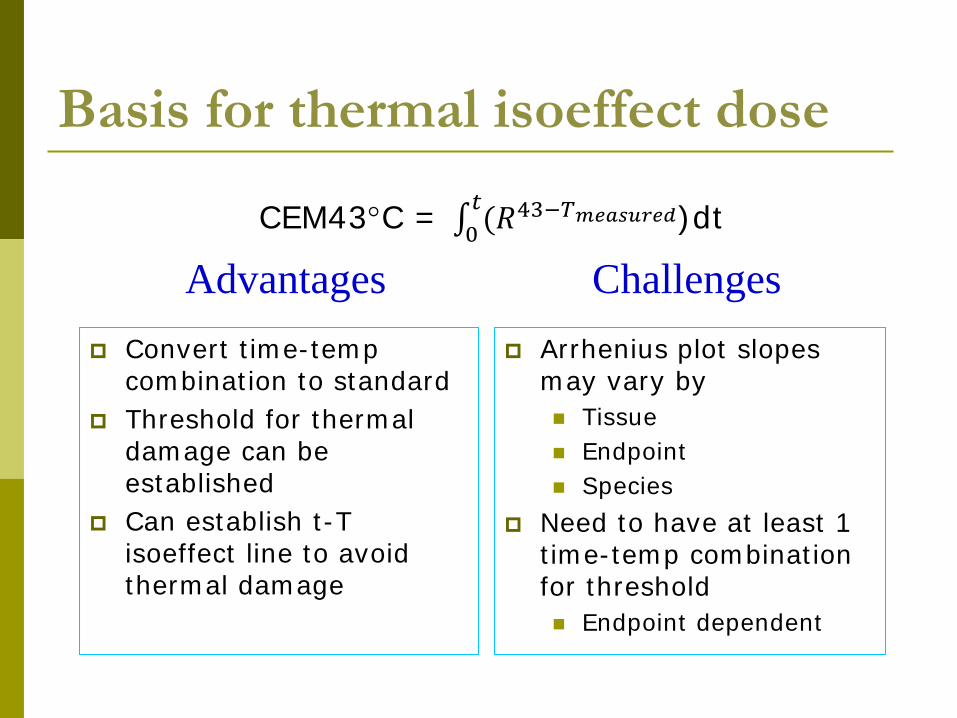
Basis for thermal isoeffect dose
Convert time-temp combination to standard
Threshold for thermal damage can be established
Can establish t-T isoeffect line to avoid thermal damage
Arrhenius plot slopes may vary by Tissue Endpoint Species
Need to have at least 1 time-temp combination for threshold Endpoint dependent
Advantages ChallengesCEM43°C = ∫0
𝑡𝑡(𝑅𝑅43−𝑇𝑇𝑚𝑚𝑚𝑚𝑚𝑚𝑚𝑚𝑚𝑚𝑚𝑚𝑚𝑚𝑚𝑚)dt

Isoeffect lines for pain vs. thermal damage – human skin
Pain Blister
Full Necrosis
NOTE: Lines are parallelPain occurs beforeinjury
Tim
e to
reac
h is
oeffe
ct(m
in)
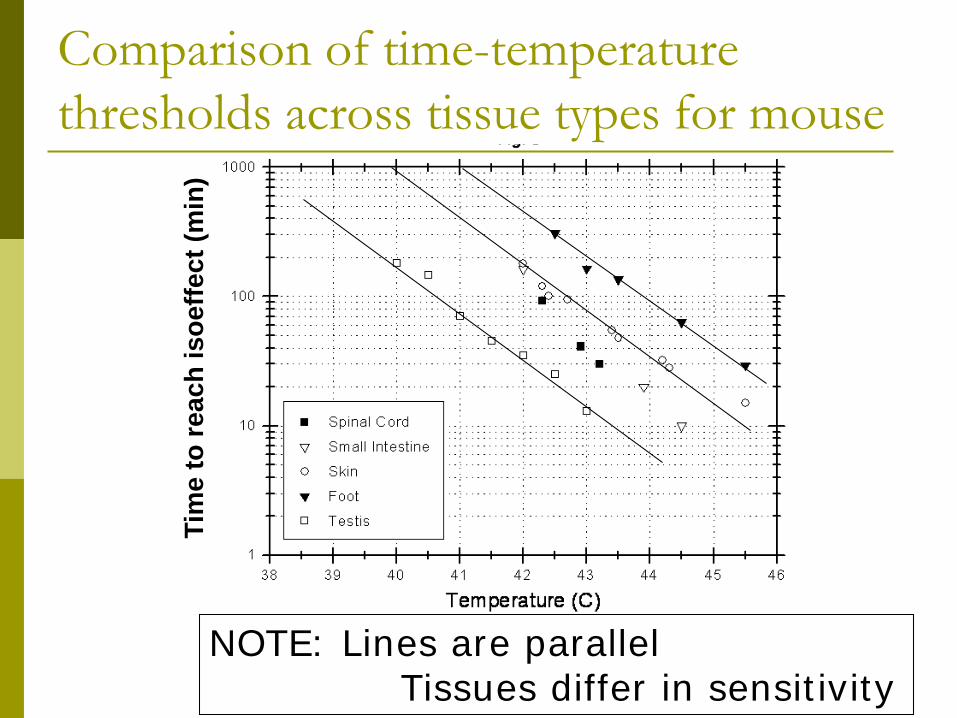
Comparison of time-temperature thresholds across tissue types for mouse
NOTE: Lines are parallelTissues differ in sensitivity

Arrhenius slope characteristics for mouse vs. human cells
Species Breakpoint <Breakpoint >BreakpointMouse 43.0°C 0.25 0.5Man 43.5°C 0.13 0.72
R value
NOTE: Breakpoint for mouse cells provides a more conservative estimate of thresholds for damage
CEM43°C = ∫0𝑡𝑡(𝑅𝑅43−𝑇𝑇𝑚𝑚𝑎𝑎𝑎𝑎(𝑡𝑡))dt
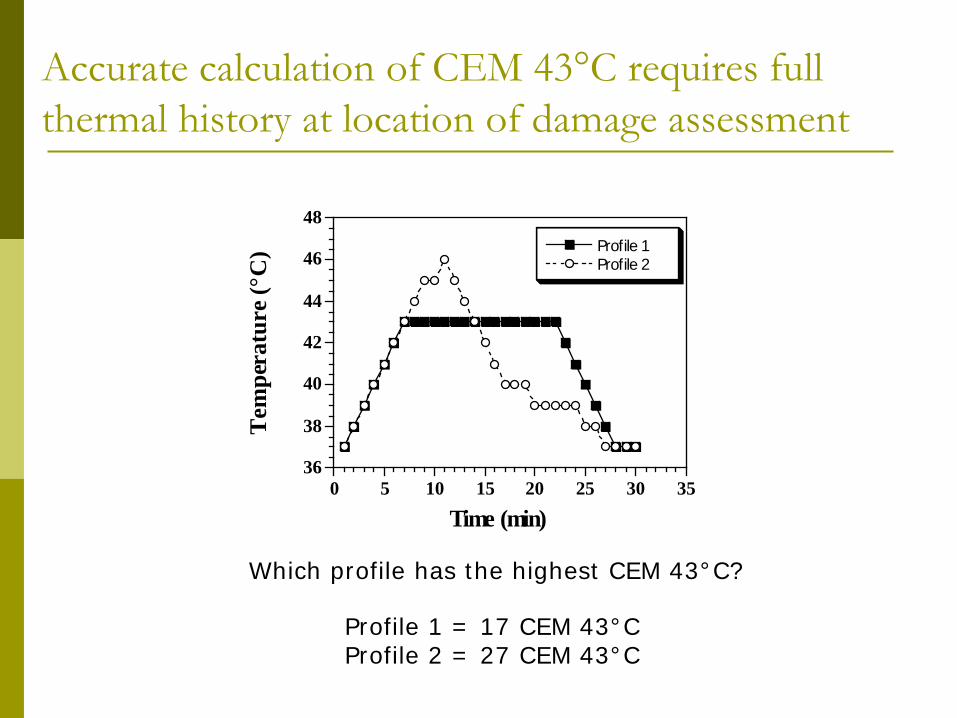
Accurate calculation of CEM 43°C requires full thermal history at location of damage assessment
36
38
40
42
44
46
48
0 5 10 15 20 25 30 35
Profile 1Profile 2
Tem
pera
ture
(°C
)
Time (min)
Which profile has the highest CEM 43°C?
Profile 1 = 17 CEM 43°CProfile 2 = 27 CEM 43°C
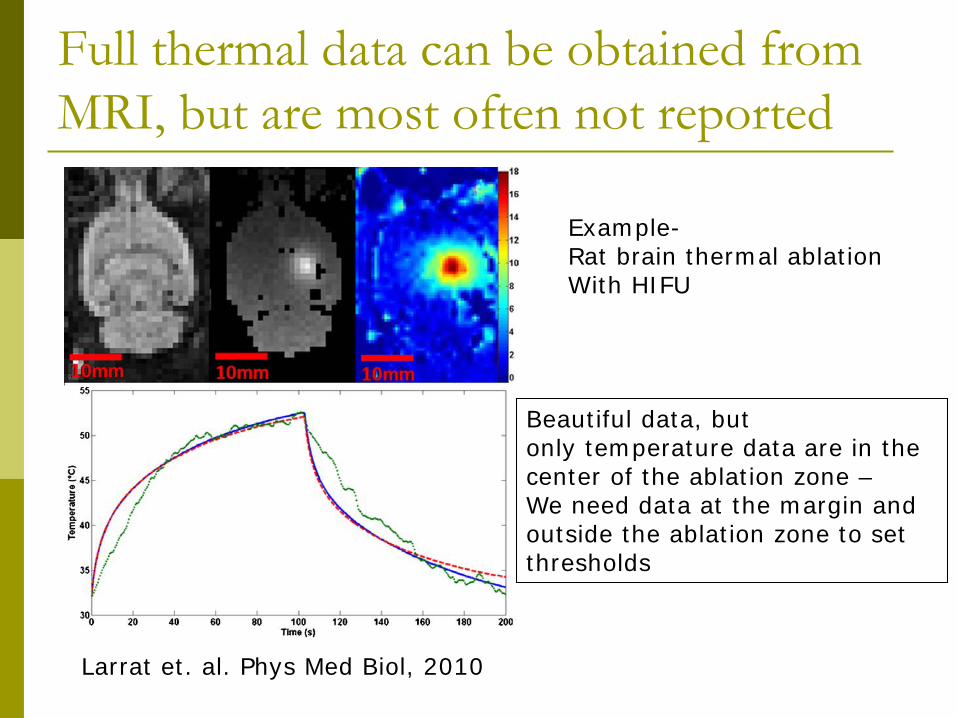
Full thermal data can be obtained from MRI, but are most often not reported
Beautiful data, butonly temperature data are in the center of the ablation zone –We need data at the margin and outside the ablation zone to set thresholds
Larrat et. al. Phys Med Biol, 2010
Example-Rat brain thermal ablationWith HIFU

Thermal damage thresholds – a review
463 papers identified since the previous review in 2003

Why are so many papers hard to interpret?
117 papers included
Had to exclude: Lack of thermal data
131 papers Temperature not measured
adequately Temperature not measured at
site of damage assessment
Laser data (doses grossly exceed damage threshold)
Modeling papers without data
Reviews Done on excised tissues
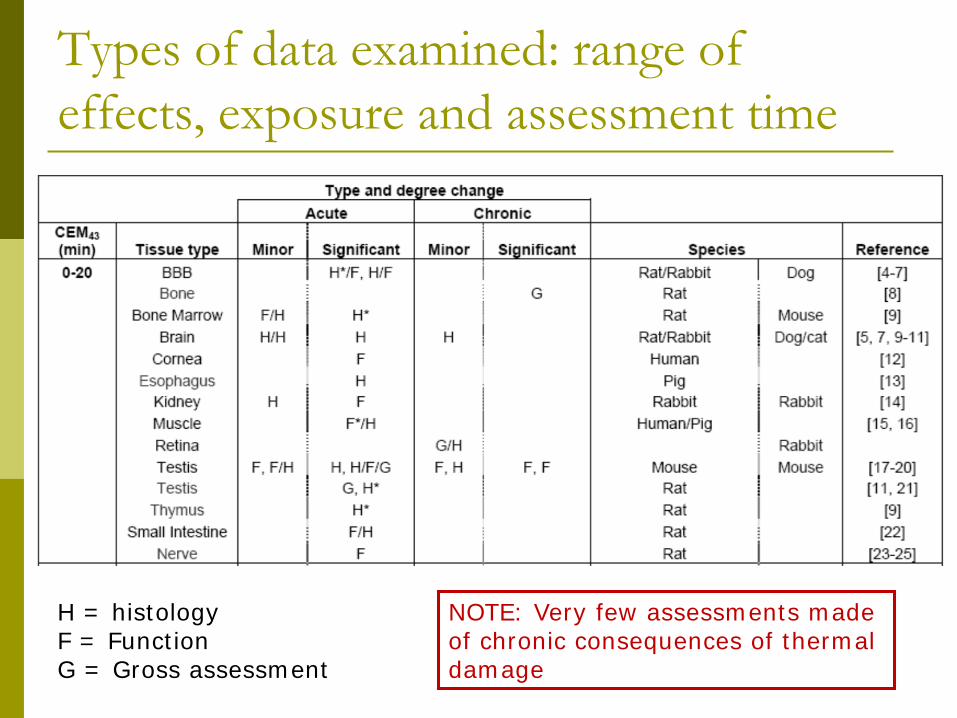
Types of data examined: range of effects, exposure and assessment time
H = histologyF = FunctionG = Gross assessment
NOTE: Very few assessments madeof chronic consequences of thermal damage

Differences across species and tissues: thermal sensitivity
10 30 7050 90 110 130
TestisBrain
Kidney
Optic DiskChoroid
Lens Cornea
Bowel
FatMuscleProstateMouse footBladder
CEM 43°C
MouseRabbitDogPigMultiple
150
Mouse Skin
Skin

Functional effects detected at low thermal doses
Data from Kiyatkin et al., indicate very low threshold forchange in BBB permeability – but threshold is likely to be much higher for local heating- Estimates from J Hoopes in dog = 10-20 CEM 43°C

Sub-regions of brain vary in thermal sensitivity: age and time of assessmentAssessment of cell
death Several brain regions
examinedWhole body HT Assessed at different
times Thermal dose:
5.9CEM43

Effects of HT on hippocampal neuronal excitability –has implications regarding seizure activity
Dentate gyrus Pyramidal cells
Stimulating electrode
Recording electrode
Inhibitory neurons function to dampen excitatory response
Reduction in neuronal responseIndicates that inhibitory neurons are sensitive to HT – young >matureNeurotransmitter, GABA is likely involved
P1 spike intensity
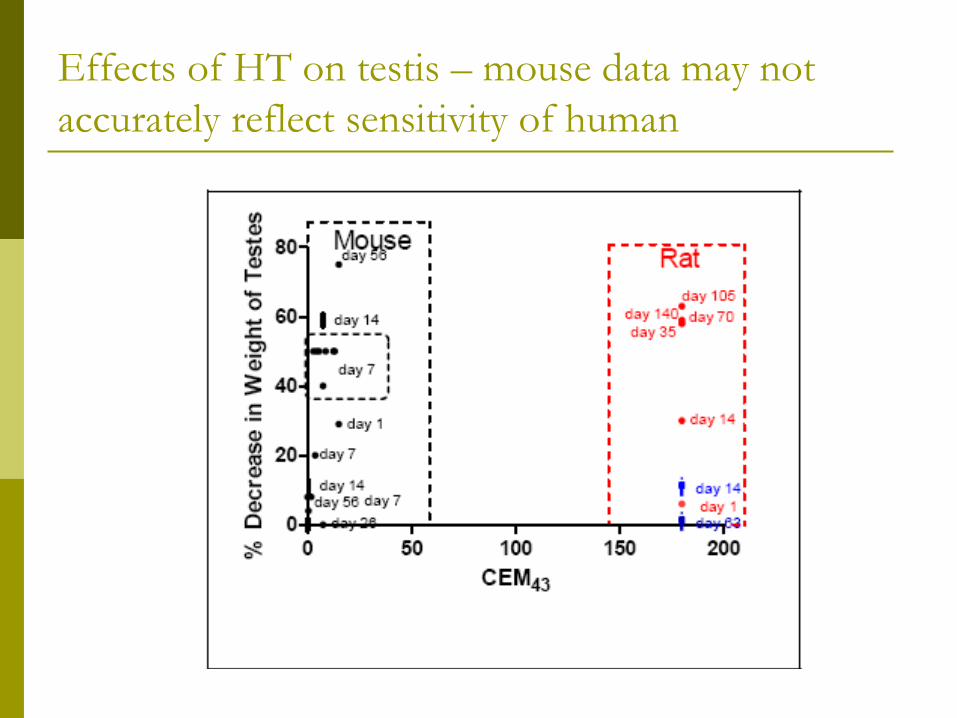
Effects of HT on testis – mouse data may not accurately reflect sensitivity of human

Effect of HT in testis dependent upon time after exposure
Germ cell killing
Note: A threshold for sperm damage is not yet determinedparticularly for humans. Monkey and human data are similar.

HT effects on sperm function show recovery over time
Mouse Human

Skin- Thresholds for pain are dependent on prior thermal exposure
Initial thermal dose112 CEM43°C
% C
hang
e

Thermotolerance: dependence on heating exposure
Data from: Nielson, 1982 & Law, 1979
Time to max thermotolerance dependent severity of initial exposure
Rate of thermotolerance decay depends on severity of initial exposure

Conclusions: effects of heat Effects of heat vary depending on species,
tissue type and exposure Heat stimulates a myriad of physiological
responses, some of which are controlled by stress-related pathways and others are more associated with thermoregulation
There is a clear link between biological response to heat and regulation of angiogenesis and oxygen homeostasis
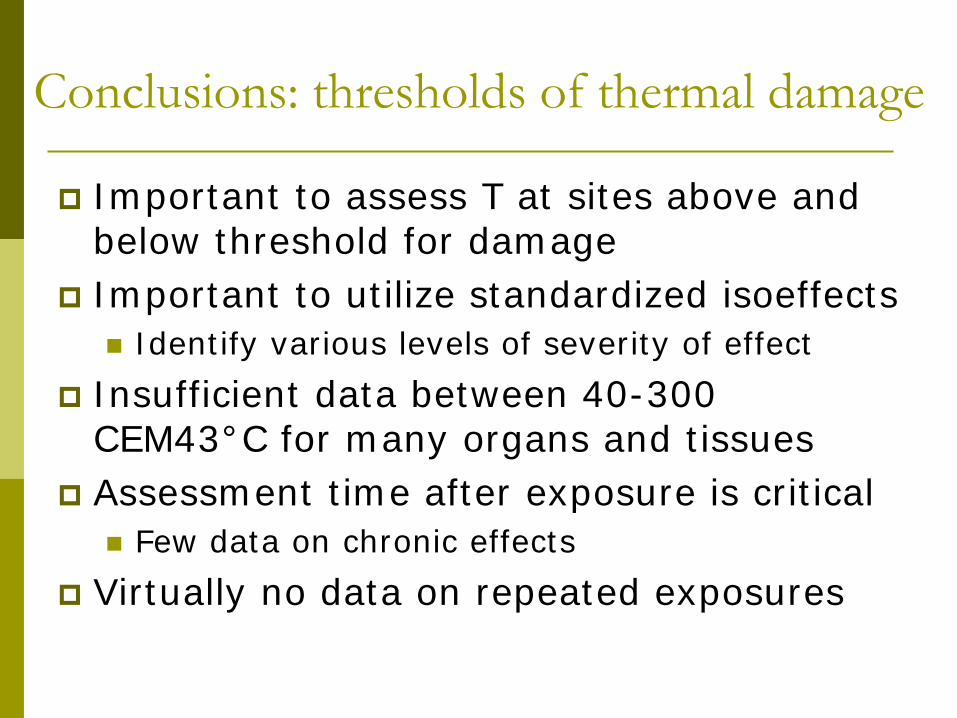
Conclusions: thresholds of thermal damage
Important to assess T at sites above and below threshold for damage
Important to utilize standardized isoeffects Identify various levels of severity of effect
Insufficient data between 40-300 CEM43°C for many organs and tissues
Assessment time after exposure is critical Few data on chronic effects
Virtually no data on repeated exposures

Thank you!
10 20 30 4034
35
36
37
38
39100%
Basal
50%
Environmental temperature, °C
Effe
ctor
res
pons
e
Core tem
perature,° C
●●●●
●●●●
●●●●●●●●●●●●●●●●●
Thermoneutral zone
Metabolic heat production
Tcore
●●●●●●●●●●●●●●●
Skin blood flow
●●●●●●●●●●●●●●●●●Evaporation
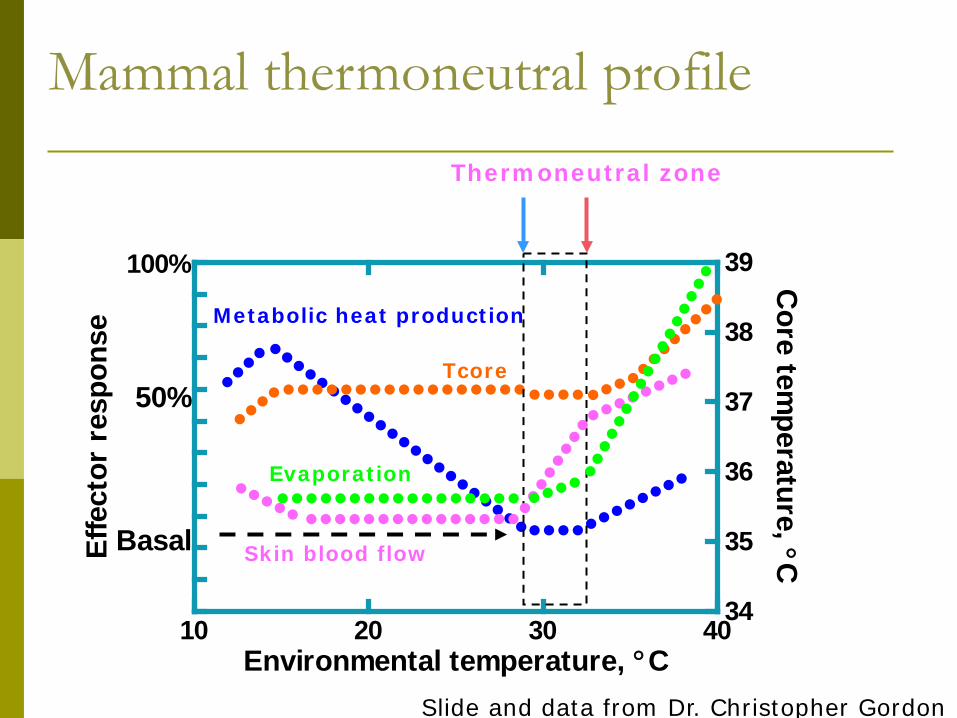
Mammal thermoneutral profile
Slide and data from Dr. Christopher Gordon


![Thermal Dose Expression in Clinical Hyperthermia and Correlation with Tumor Response ... · 2020. 9. 20. · [CANCER RESEARCH (SUPPL.) 44, 4818s-4825s, October 1984] Thermal Dose](https://img.dokumen.tips/doc/110x75/60401e4dc817456114090c43/thermal-dose-expression-in-clinical-hyperthermia-and-correlation-with-tumor-response.jpg)