Embed Size (px)
Citation preview

Thresholds and complementarities in an economic model ofpreserving and conserving biodiversity
Robert E. Kohn*
Department of Economics, Southern Illinois University at Edwardsville, Edwardsville, IL 62026, USA
Abstract
When production destroys habitat, the number of species diminishes. Endangered species can berescued by conservation biology and restoration ecology, which are represented in this paper by aproduction function for biological diversity. Until the number of species satis®es the classical species-arearelationship for the total land area of the ecological economy, it is assumed that there are increasingreturns to scale in rescuing species. It follows mathematically that there is a threshold level ofbiodiversity, which has implications comparable to ecological thresholds. There are alsocomplementarities, because increases in the target number of species increase the optimal humanpopulation and the optimal level of total production. A numerical example is presented that yields resultsdescriptive of the ecological economy of Costa Rica. # 1999 Elsevier Science Ltd. All rights reserved.
1. Introduction
As the human population increases, unprotected natural habitat is converted to commercial
use and the number of wildlife species diminishes. To counter the decline in biodiversity,
commercially productive resources are devoted to rescuing and sustaining endangered species.
This is accomplished at the micro level by conservation biology, a discipline that includes
captive breeding programs, supplemental feeding stations, predator, competitor and pesticide
control, transplantation, etc., and at the macro level by restoration ecology, whereby degraded
ecosystems or parts of ecosystems are rehabilitated and strategic wilderness areas are actively
managed to boost their biological productivity. In this paper, a simple model is developed in
Socio-Economic Planning Sciences 33 (1999) 151±172
0038-0121/99/$ - see front matter # 1999 Elsevier Science Ltd. All rights reserved.
PII: S0038-0121(99 )00006-3
* Fax: +1-618-650-3047.E-mail address: [email protected] (R.E. Kohn)

which land can be left as natural habitat, converted to commercial production, or dedicated toconservation biology and restoration ecology for the rescue of endangered species and themanagement of ecosystems critical to their survival.The second productive resource in this model, needed for rescuing endangered species and
restoring their ecosystems, as well as for commercial production, is human labor. Although thequantity of land is ®xed, the human population is treated as a variable, and the solution thatmaximizes output per person, for any target number of species, implies an optimal size humanpopulation. This concept of taking ``the preferred stock (of species) as given'' and using``increased management'' to rescue species is taken from [42]. The idea of modelling the optimalsize human population in the context of an environmental problem is taken from [1]. Theapproach here is comparable to [1], except that in that model there are increasing returns to laborin production, and the undesirable congestion of public wilderness causes the optimal populationto be some non-trivial number. In the present model, there are decreasing returns to labor inproduction, but initially increasing returns to scale in rescuing species, so that the optimalpopulation is also a non-trivial number. To preclude a trivial solution with virtually no people,there must be some threshold level of biodiversity. This economic threshold has some of the sameproperties as the ``ecological thresholds'' modeled in [47,71] and scienti®cally tested in [38,74].The results of the model include a conventional tradeo� of species for per capita
consumption of goods. The larger the number of species, the smaller the commercialproduction per person. But, whereas consumption per capita decreases as the number ofspecies increases, optimal population and optimal output both increase, the former morerapidly than the latter. This complementarity of the number of species and total output re¯ectsa similar philosophy in [4, p. 205], while the complementarity of the human population and thenumber of species is consonant with the ``ecologic-economic interdependence within a bio-physical subsystem of humans, wildlife, and habitat resources'' in [28, p. 75] as well as with thedependence of the ``human carrying capacity'' on the ``other components of the ecosystems ofwhich we are part'' in [8, p. 64]. Such complementarity is likewise implied in [14, p. 37] and[15, p. 1883] by the crucial role that biodiversity plays in preserving and regenerating soil,recycling nutrients, pollinating crops, controlling pests, etc. Whereas commercial productionultimately depends upon biological diversity in [8,14,15,28], in the present highly stylizedmodel, people are able to rescue endangered species and are needed for that purpose. This needfor people exempli®es the ``adaptive institutions'' that provide ``positive demographic-economicfeedbacks'' in [11, p. 13].Given an e�cient ecological economy, with optimal numbers of people and species, an
increase in the target number of species implies a simultaneous increase in the humanpopulation. Although the shift to a new optimum is accompanied by a diminution in naturalhabitat, the consequent decline in the number of species preserved in that habitat is exceeded bythe number of species rescued and sustained by conservation biology and restoration ecology.
2. The ecological economy
The ecological economic model consists of two productive resources and three outputs. Theresources are homogeneous inputs of land (L ) and identical humans (H ), each of whom
R.E. Kohn / Socio-Economic Planning Sciences 33 (1999) 151±172152

supplies one unit of labor. The outputs include gross national product (X ), species preserved intheir natural habitat (N ), and species conserved or rescued (R ) through human intervention.There are three uses of land in this model. First, there is protected, untouched wilderness thatis original habitat for N species of wildlife. A second part of the total land area is usedcommercially, while the third part is used for the rescue of endangered species. At the microlevel, conservation biology is applied to the rescue of individual species while at the macrolevel, critical ecosystems are acquired, replanted, and more intensively populated according toprinciples of restoration ecology. Species conserved at both the micro and the macro levelscomprise the R rescued species in this model. Although they are no less natural than the Nspecies in their unmanaged habitat, this distinction makes for mathematical rigor. It is assumedhere, and the experience with restoration ecology in Costa Rica is conditionally supportive ofthis assumptionÐthat land may be freely allocated between the three arbitrarily distinct uses.In this ecological economy, the gross national product, X, is sustainably produced according
to a general production function, X(Lx, Hx ), that for computational purposes is assumed tohave the speci®c Cobb±Douglas form,
X � X�Lx,Hx� � yLaxH
bx, �1�
in which
a� b � 1: �2�Constant returns to scale implies an industry of identical ®rms each operating at the point oflocally constant returns to scale [31, pp. 4±12]. There are no externalities associated withproduction in Eq. (1), although in reality some commercial uses of land simultaneously sustainwildlife [7,13]. It would be realistic to include in the production function some proxy forecosystem services, such as the number of species, along with Lx and Hx. However, to keep themodel simple and more narrowly focused, this is not done in the present paper.The biodiversity of natural habitat is de®ned here as the number of living species that
¯ourish within it. Designating LN as the quantity of contiguous square miles of land neitherused commercially nor managed, but left in its natural state, and N as the total number ofspecies that LN supports, the general and then speci®c relationship between them is
N � N�LN� � sLEN: �3�
This numerical formula, in which epsilon (e ) is less than one, is the well known species-areaequation of Arrhenius [3]. It is the same formula that is used in the United Nations' GlobalBiodiversity Assessment program for estimating extinction rates when habitats are lost [54, p.20]. The assumption that natural habitat is contiguous land rules out the unfortunatefragmentation of wilderness and consequent decline in its biological productivity. Although``utterly undisturbed land may have nearly vanished'' [52, p. 322], there are still wildernessareas, like the protected ACE Basin in South Carolina that is claimed [35] ``to have all thespecies that it's supposed to have . . .all operating in a natural setting.'' Realistically, thenumber of species supported by natural habitat is subject to opposing rates of extinction andimmigration over long periods of time, so that the Arrhenius Eq. (3) actually represents a longrun equilibrium state [37, pp. 19±22].
R.E. Kohn / Socio-Economic Planning Sciences 33 (1999) 151±172 153

In this model, the LN square miles of natural habitat are publicly owned protectedwilderness, without roads and free of commercial and vehicular activities. In the United States,there are over 600 such primeval wilderness areas, covering more than a hundred million acresof land [55]. Species that are endangered and cannot survive on this land without humanmanagement are not counted among the N species. In economic terms, the Arrhenius Eq. (3)implies that indigenous biodiversity is subject to decreasing returns with respect to land area.Because of such decreasing returns, conservation biology and restoration ecology can be asbiologically productive in this model as natural habitat is at the margin.
3. Conservation biology and restoration ecology
The total number of biological species S includes the N that are ¯ourishing in theiruntouched natural habitat, that is in situ, plus the additional R that are rescued and survive exsitu because of human intervention, or that are still living in situ but on habitat that is beingrestored or actively managed to ensure their survival. Following the terminology in [45, pp. 73,101], the N species are preserved, whereas the R species are conserved. The two are mutuallyexclusive and, therefore,
N� R � S: �4�As in the model of Eiswerth and Haney [17, pp. 238±241], in which e�cient conservation ismeasured solely by the number of di�erent species, it is assumed that biological diversity ismeasured by S. The strong assumption implied by Eq. (4), that species are perfectlysubstitutable and that each should be preserved or conserved ``for its own sake'', is argued ordiscussed in [48±50]. That some species are taxonomically or ecologically more unique thanothers and hence more crucial to the preservation of diversity [41,64,77], or that some speciesare more important to the functioning of their ecosystems [48, pp. 3, 6, 16±17, 307], is ignored.Neither is the size of the population of individual species a criterion [17] nor the ``diversity ofpopulations'' of the same species [14]; only the number of species. Although not withoutcontroversy [23], the assumptionÐthat biodiversity is richer and ecosystems more healthy thegreater the number of individual speciesÐis central to the present model.Endangered species are rescued and sustained in zoos, botanical gardens, nature reserves,
sanctuaries, compounds and, in the case of microorganisms, in repositories. Entire groups ofspecies are rescued when their habitats are restored. In the United States, the historic purchasein the 1930s of some ten million acres of submarginal farmland by the RooseveltAdministration, for conversion to bird and mammal habitat, has evolved into the 92 millionacre National Wildlife Refuge System [32,76]. In 1976, Congress passed the National ForestManagement Act, directing the Forest Service to preserve the diversity of plants and animals inits 191 million acres of forests, habitat for a third of the threatened or endangered species inthe United States [16]. Some very large habitat restoration programs are being planned underthe Conservation Reserve Program of the US Department of Agriculture. In addition toconservation and restoration by the US Forest Service, the Fish and Wildlife Service, theNational Park Service, the Bureau of Land Management, other federal and state agencies, aswell as private groups such as the Nature Conservancy are acquiring and restoring ecosystems.
R.E. Kohn / Socio-Economic Planning Sciences 33 (1999) 151±172154

Laws are being passed at the state level to enable private land owners to sell or donatedevelopment rights to their properties, with land trusts as intermediaries to supervise theseconservation easements.Following a large scale restoration project in the Grand Canyon, there is now discussion of
removing certain marginal dams from once salmon-rich rivers of the Paci®c Northwest andeven of draining the increasingly costly Lake Powell so that Glen Canyon can be restored [12].Some of the most dramatic recent examples of conservation in the United States are therestoration of wetlands along the Mississippi and Missouri rivers following the devastating¯oods of 1993, the establishment of the extensive Joshua Tree National Park in California, thehuge Grand StaircaseÐEscalante National Monument in Utah, and the Federal-State projectto restore natural water ¯ows to the Florida Everglades [26]. Restoration ecology is even moreof a national commitment in Costa Rica, where land is being acquired by the governmentalong a central corridor connecting the country's national parks. Keystone species of trees arestrategically planted on land that had been formerly cleared for farmland, and there is suchrapid tropical growth that, in ten years, secondary forests begin to resemble primary forests.In the present model, the land allocated to conservation biology or to wilderness restoration
is designated by the variable LR. We may think of LR as land that is intensively managed withlabor, whereas LN is natural wilderness that is extensively protected by law. Althoughconservation biology tends to be labor intensive and restoration ecology to be land intensive,there is a strong complementarity between the two remedial approaches that justi®es theircharacterization by a single production function,
R � R�LR,HR� � cLmRH
nR: �5�
Eq. (5) is not unlike the species production function in [17, p. 239] or the ``production functionfor biological diversity'' in [66, p. 230]. Such a function exempli®es the ``neoclassical'' approachin [75, p. 405], in which diminutions of natural capital (in this case, preserved species) are fullyremediable1 The labor employed in rescuing species is HR, the total human population, H, is
H � Hx �HR, �6�and
L0 � Lx � LN � LR �7�is the total land area of the ecological economy.
4. Returns to scale in rescuing species
Following [44, p. 123], it is assumed that the species production function in Eq. (5) exhibitsincreasing and then decreasing returns to scale. More speci®cally, there are increasing returns
1 Given the unprecedented rate of species extinction in recent years [21,53,54,62,68], the assumption of fullremediability may be counterfactual. However, the technologies of conservation biology and restoration ecology arerapidly improving [57,65,68,70].
R.E. Kohn / Socio-Economic Planning Sciences 33 (1999) 151±172 155

to scale in rescuing species; that is,
m� n > 1, �8�until the number of species satis®es the Arrhenius equation,
S0 � sLE0, �9�
where S0 is the number of species that would be preserved if the entire land area, L0, of theecological economy had been left as natural habitat.Increasing returns to scale imply that doubling the resources, LR and HR, devoted to
rescuing species more than doubles the output, R. There are a number of reasons for this. Atthe single-species rescue stage, it is observed [6, 59, pp. 39±45] that small populations ofspecies, which is typically the case in rescue projects, are vulnerable to extinction because ofinbreeding, disease, and predation. At this stage, the probability of species survival increases atan increasing rate with respect to the resources expended [43, pp. 3±5]. Moreover, theexperience gained, as more and more species are rescued, contributes new knowledge thatmakes conservation biology more cost e�ective [65]. Because it is likely to ``cost less to protecta number of species together in naturally-occurring groups than to protect the same number ofspecies as scattered, disjoint entities'', there is a further case for ``economies of scale in speciesprotection'' [2, p. 8]. Such economies of scale in conservation biology are being reported in®eld research [73].As conservation shifts from individual and groups of species to entire ecosystems, the
productivity of rescue inputs is intensi®ed [34]. At this macro level, satellite imaging and otheradvanced, cost-saving technologies become feasible [57,67,70]. When su�ciently large amountsof land are restored as to create corridors that connect one wilderness area to another, genepools are enlarged, and species that require extensive territories can again thrive. With theconservation of large ecosystems, sustaining entire communities of related but threatened species,there is a kind of agglomeration economy that further connotes increasing returns to scale.When the total number of species is increased to S0, which may be called ``the Arrhenius
level'', it is assumed that there are decreasing returns to scale in introducing new and exoticspecies into the ecological economy, each new species requiring more inputs than the precedingone. A possible justi®cation for this assumption is the extensive economic damage caused bymany alien species, which is estimated to be in the hundreds of millions of dollars each year inthe United States [60, p. 13] without including their toll on native species [20, pp 31±32]. Theassumption of decreasing returns to scale when the number of native species is exceeded, i.e.when N plus R exceeds S0, implies that the inequality in (8) is then reversed. Whether in realitythis transition to decreasing returns actually occurs before S0 or after it, is not critical to themore general results of this model.
5. First-order conditions for ecological economic e�ciency
The objective of the proposed model is to determine the allocation of the land, L0, betweenLX, LN, and LR, along with the optimal size population, H, and the allocation of that optimal
R.E. Kohn / Socio-Economic Planning Sciences 33 (1999) 151±172156

population between HX and HR such that gross national product per capita, Z=X/H, ismaximized for any given number of preserved and conserved species, S. Interpretation of theoptimal population size as the number that maximizes per capita income is given precedence in[39, pp. 259±272]. Although it may be controversial to de®ne optimal size population in thecontext of a single environmental issue [72, p. 17] or to treat the optimum human populationas endogenous with respect to the number of species preserved, this approach provides insighton the complementarity of population, total output, and biological diversity in an e�cientecological economy. It would more meaningfully motivate this model to maximize, not percapita consumption Z, but a utility function U(Z,S ) in which ecological services, representedby the biodiversity variable S, is an argument along with Z. However, this would yield a singleoptimal solution rather than the locus of optimal combinations of species, as well as a percapita consumption that reveals thresholds and complementarities that may be of interest.The general optimization problem can be expressed in the context of the Lagrangian
expression,
L � X=H� l�Xÿ X�Lx,Hx�
�� g�SÿN�LN� ÿ R�LR,HR�
�� r�HÿHx ÿHR � � t�L0
ÿ Lx ÿ LN ÿ LR �: �10�
Setting the derivatives of Eq. (10) with respect to X, H, LX, HX, LN, LR, and HR equal to zeroand eliminating the Lagrangian multipliers yields the marginal conditions for ecologicaleconomic e�ciency; i.e. the conditions for the allocation of resources that maximizesconsumption per capita while attaining the target level of biodiversity. The subscripts of L andH identify the activities, X, N, or R, to which these inputs are applied, whereas the subscriptsof X, N, and R in turn denote derivatives of these functions with respect to the correspondingargument, L or H. (superscripts in this paper are reserved exclusively for exponents ofvariables). The general e�ciency conditions for an interior solution are accompanied (inparentheses) by the corresponding numerical relationships when the speci®c computationalforms are substituted.The ®rst marginal condition is Meade's [39, p. 263] rule that the population size is optimal
when consumption per capita equals the production of the marginal person:
X
H� @X
@HX� XH �specifically, HX � bH �: �11�
The marginal person accordingly consumes exactly as much as he or she produces. There is ane�cient allocation of land and humans between production and rescuing species when
@X=@HX
@X=@LX� XH
XL� @R=@HR
@R=@LR� RH
RL
�specifically,
bLX
aHX� uLR
mHR
�, �12�
which is the well known condition for equal marginal rates of technical substitution inalternative production activities. The marginal condition for the e�cient allocation of landbetween natural habitat and rescue is
R.E. Kohn / Socio-Economic Planning Sciences 33 (1999) 151±172 157

@R
@LR� RL � @N
@LN� NL
0@specifically, HR �"esLeÿ1
N
mcLmÿ1R
#1=n1A, �13�
which states that the quantity of land used for rescuing species, in combination with labor,saves the same number of species on the marginal acre of land as that engendered by themarginal acre of natural habitat. This condition is comparable to the ``marginal speciesproducts'' equation in Eiswerth and Haney [17, p. 240] and connotes in economic terms the``balanced conservation strategy'' advocated in [58, p. 44].In Appendix A, per capita consumption, Z=X/H, is conveniently reduced to a function of
two variables, LN and S. The ®rst order condition, @Z/@LN=0 yields Appendix Eq. (A7),which, because a plus b equal unity, simpli®es to
S ��sLE
N
m� n
��EL0
LN� m� nÿ E
�: �14�
The implication of Eq. (14) is that, for any target level of biodiversity S, the optimal quantityof wilderness land LN is implicitly determined, as, in turn, are all of the remaining variables ofthe model. If all the land were left as natural habitat (LN=L0), the right-hand side of Eq. (14)would readily collapse to sLE
N which equals N. However, this special case violates the second-order condition (discussed in the next section of the paper) that requires some minimumnumber of rescued species. The reason that an ecological economy can attain the Arrheniuslevel of biodiversity S0 and still use part of its land for commercial production is that theaverage biodiversity, R/LR, on restored habitat and on land used for conservation biology ishigher than the marginal biodiversity, NL, engendered by primary habitat. In e�ect, naturalprocesses are replicated at a lower cost through human intervention, although the averagebiodiversity of restored habitat, R/LR, is likely to be less than that of primary habitat, N/LN.
6. Second-order condition for ecological economic e�ciency and the threshold level of biodiversity
In Appendix A the second order condition, @2Z/(@LN )2<0, for maximum consumption percapita, reduces to Inequality (A14), which is expressed in terms of the variables LN and S.Expanding it, then eliminating and combining variables, yields the quadratic inequality,
ÿm�m� n��1ÿ E�2�
S
sLEN
�2
��1ÿ E���m� n��2mÿ E� ÿ Em��
S
sLEN
�� �Eÿ m��m� n
ÿ E�<0, �15�
which factors out to�ÿ �m� n��1ÿ E�
�S
sLEN
�� �m� nÿ E�
���1ÿ E�m
�S
sLEN
�� �Eÿ m�
�<0: �16�
Inequality (16) implies either that the ®rst square-bracketed term is negative and the second
R.E. Kohn / Socio-Economic Planning Sciences 33 (1999) 151±172158

positive, in which case,
m� nÿ E�1ÿ E��m� n�<
S
sLEN
>mÿ E�1ÿ E�m , �17�
or else that the ®rst square-bracketed term is positive and the second negative, in which case,
m� nÿ E�1ÿ E��m� n� >
S
sLEN
<mÿ E�1ÿ E�m : �18�
Whereas the right-hand side ratio in (17) and (18) is less than unity, it follows from Eq. (4)that S/(sLE
N, which equals S/N, is greater than unity. Accordingly, Inequality (17) alone holds.Moreover, the ratio on the left-hand side of (17) necessarily (because m+n>1>E ) exceeds theratio on the right-hand side. Consequently,
S
sLEN
>m� nÿ E�1ÿ E��m� n� �19�
is a binding inequality. Inverting (19), substituting Eqs. (3) and (4), and multiplying through byminus one, yields
R
S>
E�m� nÿ 1�m� nÿ E
, �20�
which is the minimum ratio of rescued to total species. Unless this ratio is attained, there areinsu�cient increasing returns to scale in the ecological economy to preclude a trivial solution,such as that described in [1], in which the optimal population approaches zero. Although theconcept of a minimum ratio has purely mathematical±economic signi®cance in this model, it isrelevant that Perrings and Pearce [47] focus on ``threshold e�ects'' at ``critical values'' ofbiodiversity, below which ``ecological discontinuities'' appear and ``the ecosystem losesresilience''. Swanson [71, pp. 1, 2] likewise warns of a ``threshold'' level of biodiversity, belowwhich there would be a ``disastrous collapse'' of ecological and dependent economicproductivity. Farmer and Randall [19] likewise address ``the intolerable cost'' of speciesextinctions, but they focus on individual ``threshold crises'' rather than the collapse of entireecosystems. It is that kind of broad ecological collapse to which the laboratory and ®eld workof Tilman and Downing [74] and McGrady-Steed et al. [38] is directed. The critical sensitivityof ecosystems to minimum numbers of species is explained by the extensive interdependence ofspecies within ecosystems. Also relevant here is the vulnerability of particular species to naturaldisasters such as drought, and the consequent importance of the availability of other speciesthat can take their place by increasing their own productivity and thereby support thecontinued ¯ow of ecosystem services [5, p. 25].Although it is based here on increasing returns, there is also a threshold level of biodiversity
in the present model. Substituting Eq. (14) into (19) thus yields
L0
LN>
m� nÿ E1ÿ E
, �21�
R.E. Kohn / Socio-Economic Planning Sciences 33 (1999) 151±172 159

where the numerator is the di�erence between biological returns to scale in rescue minusbiological returns to primary habitat. This ratio is comparable to the ``minimum ratio ofnatural to human-dominated habitat'' in [14, p. 43]. Because there are initially increasingreturns to scale in conservation biology and restoration ecology, m plus n exceed 1.0, and theright-hand side of (21) necessarily exceeds unity. Raising both sides of (21) to the exponent E,multiplying the numerator and the denominator on the left-hand side by s, substituting N inthat denominator, and then rearranging terms yields
N<sLE0
�1ÿ E
m� nÿ E
�E, �22�
which implies a maximum number of natural species.It follows from Eq. (19) that
S >
�m� nÿ E�1ÿ E��m� n�
�N: �23�
This constraint on S binds when N has its maximum value, which is the right-hand side of(22). Substituting that expression for N into (23) yields
S >
�sLE
0
m� n
��1ÿ E
m� nÿ E
�Eÿ1: �24�
This inequality de®nes the threshold level of S, which shall be called s. It follows from (24)that the threshold number of species is greater, and the economy more vulnerable to ecologicalcollapse, the smaller are the increasing returns to scale as measured by the sum of m plus n. Itis interesting that such a ``limit'' and consequent ``irreversibility'', typically perceived as beingoutside of conventional economic theory [69], are simulated here with a standard neoclassicaleconomic model.
7. The competitive market analogue and the complementarity of biodiversity, people, and totalproduction
In theory, the marginal conditions for ecological economic e�ciency can be achieved in acompetitive market economy in which the price of good X is, say, one dollar, the wage rate isXH dollars, the rental price of privately owned land is XL dollars, and gross national income isXHH plus XL[LX+LR ] dollars. Households pay taxes of XL[LX+LR ] dollars to thegovernment, which grants these funds to non-pro®t institutions such as the NatureConservancy and Wilderness Society for rescuing R species at a total cost of XHHR plus XLLR
dollars. This is a simple version of Fraser Smith's [63, p. 199] proposal for subsidizing theconservation of biodiversity. The total income of households, after taxes, equals X dollars,which, in turn, is equal to the total cost of private production, XHHX plus XLLX. No rent isexplicitly paid or received for the publicly owned wilderness habitat, LN.There is an implicit price per saved species, equal to XH/RH dollars, which, in turn, equals
XL/RL dollars. It follows from Eq. (13) that
R.E. Kohn / Socio-Economic Planning Sciences 33 (1999) 151±172160

XL
NL� XL
RL, �25�
which states that the marginal cost of preserving species equals the marginal cost of rescuingand conserving species. Finally, it is assumed that the government of this ecological economysuccessfully fosters the optimal size population, encouraging increases in the population whenthe marginal product of people XH exceeds average consumption X/H and decreases when XH
is less than X/H. This di�ers from the more sophisticated models of Harford [24, 25], in whichthe government controls population with a ``child-bearing tax''.Dividing Eq. (A16) in the Appendix by (A15) yields the derivative of population with respect
to the number of species, which simpli®es to
@H
@S� 1
ans
�sc
�1=n� Em
�m=n�� Em� n
��L0 ÿ LN�
��1ÿmÿn�=n
�x�L�Eÿ1��1ÿn�=nN
� �Eÿ 1��L0=LN� � mÿ E�Eÿ 1��L0=LN� � mÿ E� n
�:
�26�
It follows from Inequality (21) that the denominator of the ®nal square-bracketed term in (26)is negative, and therefore that the numerator must be likewise. Because all the multiplicands inEq. (26) are positive, @H/@S is also positive. Similarly, dividing Eq. (A17) in the Appendix by(A15) yields the derivative of total output with respect to biodiversity, which simpli®es to
@X
@S� y
Es�bH �bna
�L0 ÿ LN
m� n
�aÿ1L1ÿEN �x�
�ÿa� �b=n���Eÿ 1��L0=LN� � mÿ E��Eÿ 1��L0=LN� � mÿ E� n
�: �27�
Again, it follows from Inequality (21) that the numerator and denominator of the ®nalmultiplicand are both negative. Because all the multiplicands of Eq. (27) are positive, so also is@X/@S. That both H and X increase with S means that population and total production arecomplements of biodiversity. However, this complementarity does not imply that increases inpopulation and production always increase biodiversity; indeed, the reverse is likely to be thecase [29]. It does say that when the levels of population and production are optimal for a givenlevel of biodiversity, then when the target level of biodiversity is increased, more people andmore production are e�cient. This implies that some wilderness is converted to production, butsome is also converted to conservation biology for intensive ecological management. This ise�cient because the biological productivity of the managed land exceeds that of the marginalnatural habitat. This is not unrealistic since it is generally the case [79, p. 6] that conservationbiology ``can target critical areas for protection'' and thereby ``protect a great manyendangered species on a relatively small amount of land.'' It is thus relevant that more speciesof birds in Costa Rica thrive in the restored forests than in the primary forests.In the present model, there is a complementarity of people, production, and biodiversity, but
it is also the case that when the target number of species is increased, optimal populationincreases by a larger percentage than optimal output, so that per capita consumption declines.That Z=X/H declines in this model when S is increased is proved by dividing Eq. (26) byAppendix Eq. (A8) and simplifying to obtain
R.E. Kohn / Socio-Economic Planning Sciences 33 (1999) 151±172 161

@H=@S
H��
1
nEs
��m� n
L0 ÿ LN
�L1ÿEN
� �Eÿ 1��L0=LN� � mÿ E�Eÿ 1��L0=LN� � mÿ E� n
�: �28�
This is the proportional increase in optimal population when S is increased by one unit.Dividing Eq. (27) by Appendix Eq. (A9) and simplifying yields
@X=@S
X��1
Es
��m� n
L0 ÿ LN
�L1ÿEN
�ÿa� �b=n���Eÿ 1��L0=LN� � mÿ E��Eÿ 1��L0=LN� � mÿ E� n
�, �29�
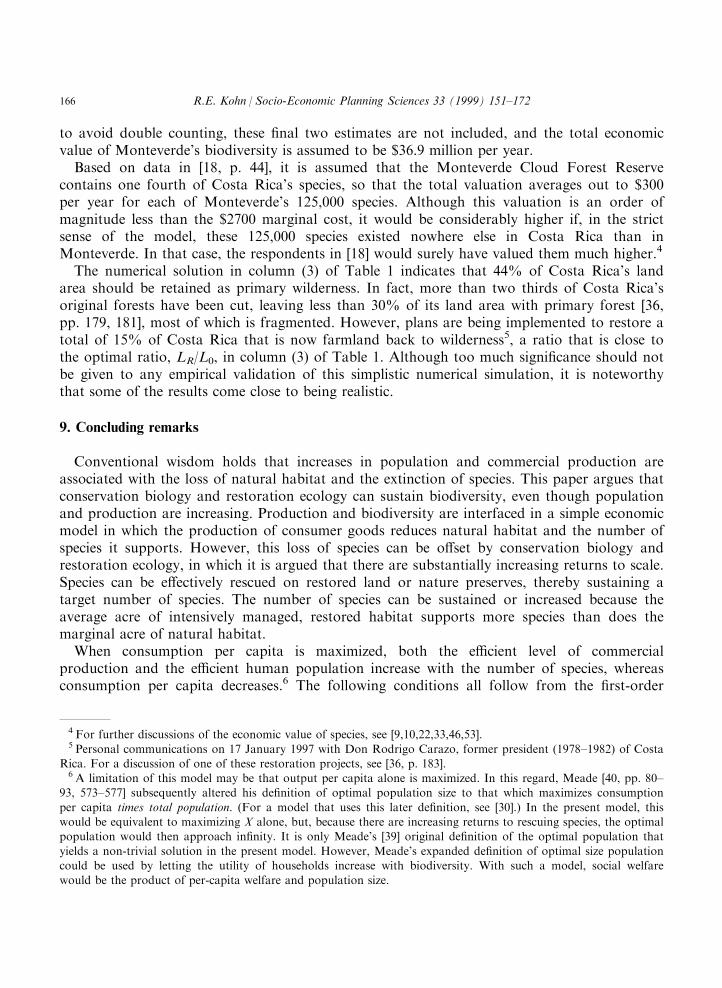
Fig. 1. The relationship between the number of species and maximum per capita consumption, maximumproduction and the optimal size human population.
R.E. Kohn / Socio-Economic Planning Sciences 33 (1999) 151±172162

which is the proportional increase in optimal output when S is increased by one unit. Itfollows that
@H=@S
H� K
n��Eÿ 1��L0=LN� � mÿ E
�and �30�
@X=@S
X� K
�ÿ a� �b=n���Eÿ 1��L0=LN� � mÿ E��, �31�
where the constant K, which equals
K ��1
Es
��m� n
L0 ÿ LN
� L1ÿEN
�Eÿ 1��L0=LN� � mÿ E� n
!, �32�
is negative. The proportional change in optimal population is larger than the proportionalchange in total output; i.e.
K
n��Eÿ 1��L0=LN� � mÿ E
�> K
�ÿ a� �b=n���Eÿ 1��L0=LN� � mÿ E��: �33�
This is the case since, if Inequality (33) is multiplied through by ÿn/K, terms are collected,and a is substituted for (1ÿb ), it becomes identical to Inequality (21), which holds by virtueof the second order condition. Because the proportional change in optimal population alwaysexceeds the proportional change in optimal output when S changes in the same direction, itfollows that consumption per capita decreases (increases) when biodiversity is increased(decreased).The production possibility frontier for this ecological economy is characterized at the top of
Fig. 1, beginning at the threshold level s. More appropriately, it is a quasi productionpossibility frontier because one of the two inputs, labor, is endogenous. The vertical axis in thetop graph is per capita consumption, Z=X/H. The mathematical structure of the model issuch that if S is less than this threshold level, output and optimal population drop to zero.Although per capita consumption Z declines as S increases, output X and optimal populationH both increase, though at a decreasing rate. Because of the initially increasing returns to scalein conservation, the shadow price of rescued species, which is H[ÿ@Z/@S ]=XH/RH=XL/RL,declines as S increases. Along the quasi production possibility frontier, the marginal rate oftransformation is ÿ@Z/@S. Because the derivative ÿ@Z/@S decreases as S increases, the frontieris convex rather than concave from below. When the total number of species preserved andconserved equals S0, the Arrhenius level of the ecological economy is reached, and additionalspecies can be secured only under decreasing returns to scale (m+n<1). At the very beginningof this new range, consumption per capita declines at an increasing rate as S increases, and theoptimal size population and total output increase at an increasing rate, the former more rapidlythan the latter. These abrupt changes in curvature when S>S0 are characterized in Fig. 1.Although there is this non-convexity at the lower end of the production possibility frontier, itdoes not appear to pose a problem for public policy.
R.E. Kohn / Socio-Economic Planning Sciences 33 (1999) 151±172 163

8. A numerical example
An e�cient ecological economy is simulated according to ``the fourth-root law'' in [51, p.191], so called because of empirical determination that the exponent in Arrhenius' species-arearelation is approximately one fourth. The remaining parameters of the numerical model arechosen so that the optimal solution is comparable to data for Costa Rica, whose 19,575 squaremiles of land support an estimated 499,000 di�erent biological species.2 The respectiveparameters of the simulation model are y=2400, a=0.05, b=0.95, s=42,000, e=0.25,c=0.03, m=0.45, and n=0.95. To approximate in a round number the land area of CostaRica, the total land constraint L0 is set equal to 20,000. The population of Costa Rica in 1989was estimated at 2.954 million. Its gross national product in 1988 was equivalent to $4.7 billionand its per capita income to $1760. These census data are close to the seven-digit solutionvalues in rows 9, 10, and 11 of column (3) in Table 1. All entries in Table 1 are carried toseven signi®cant digits for the bene®t of any reader who wishes to plug them into the formulas
Table 1Solutions of the numerical example
(1) (2) (3) (4)Threshold level
of biodiversity
Arrhenius level
minus 1000
Arrhenius level
of biodiversity
Decreasing
returns to scale
s S0ÿ1000 S0 S0+10
1 S 491,593.6 498,467.0 499,467.0 499,477.02 LN 13,043.48 8975.873 8751.352 8267.7623 N 448,846.3 408,807.1 406,226.3 400,494.2
4 LR 2236.025 3543.470 3615.637 3677.7295 HR 77,817.36 136,453.0 140,843.8 148,767.86 R 42,747.26 89,659.86 93,240.64 98,972.747 LX 4720.496 7480.657 7633.010 7909.301
8 HX 1,478,530 2,592,607 2,676,032 2,879,4529 X 2,662,251,000 4,644,703,000 4,791,403,000 5,145,913,00010 H 1,556,347 2,729,060 2,816,876 3,031,003
11 Z=XH 1710.577 1701.943 1700.963 1697.76012 XL 28,198.85 31,044.75 31,386.07 32,530.7713 RH 0.5218617 0.6242212 0.6289137 0.6320191
14 RL 8.602886 11.38628 11.60467 12.1101215 NL 8.602886 11.38628 11.60467 12.1101216 @2Z/(@LN )2 0.0 ÿ6.705151�10ÿ7 ÿ7.079430�10ÿ717 @H/@S ± 90.44561 85.3641718 @X/@S ± 151,206.8 142,496.719 @Z/@S ± ÿ9.990648�10ÿ4 ÿ9.601443�10ÿ4
2 The demographic, geographic, and economic data on Costa Rica used in this paper are taken from [80, p. 291].
The number of species in Costa Rica is reported by Wille [78, p. 15], who cites the following subtotals from INBio,Costa Rica's biodiversity institute: an estimated 1500 species of vertebrates, 2500 species of fungi, 10,000 species ofplants, 365,000 insects, spiders, ticks, etc., 85,000 other invertebrates, and 35,000 species of bacteria, viruses, etc.
R.E. Kohn / Socio-Economic Planning Sciences 33 (1999) 151±172164

and equations in this paper to test the equalities and directions of the inequalities. Thus, it canbe con®rmed that the data in rows 9, 10, and 11 satisfy the Meade condition from Eq. (11),that the data in rows 11, 12, 13, and 14 satisfy the condition for technical e�ciency from Eq.(12), and that the data in rows 14 and 15 satisfy the Eiswerth and Haney condition from Eq.(13). The numerical value of the second derivative, @2Z/(@LN )2, and the ®rst derivatives, @H/@S,@X/@S, and @Z/@S, are in rows 16±19.Columns (1), (2), and (3) of Table 1 contain the optimal solutions for S, equal, respectively,
to s, the lowest level for which there is a non-trivial solution, to S0 minus 1000, and to S0.These solutions satisfy all the conditions for e�ciency, except that the second derivative incolumn (1) of row 16 is zero for the edge solution. Finally, column (4) contains the optimalsolution in which only ten incremental species above S0 are conserved. The decreasing returnsto scale in this range are simulated by creating two auxiliary variables, Lr and Hr, and byassuming that the r additional species above S0 are rescued according to the function,
r � 0:03L0:45r H 0:45
r : �34�Eq. (34) is identical to the increasing returns to scale function except that the value of nhas been arbitrarily reduced.3 The Meade condition (11) and the Eisworth and Haneycondition (13) hold in this expanded model, whereas the condition for technical e�ciencyexpands to
XH
XL� RH
RL� rH
rL: �35�
It is unlikely that an ecological economy would surpass its natural level of biodiversity, but ifit did it is realistic to presume that such an objective would be especially costly. In thisnumerical example, the shadow price of rescuing species escalates from XH/RH=2705 dollarsper year at S0 to XH/rH=1,049,750 dollars at S0+10.It may be instructive to compare the marginal cost of preserving or conserving S0 species,
which is XL/NL=XL/RL=$2700 from column (3) of Table 1, to published estimates of relatedannual bene®ts. EscheverrõÂ a et al. [18, pp. 46±48] ®nd that Costa Rican park visitors are``willing to make a one-time payment'' of $137.41 per person to prevent the conversion of theMonteverde Cloud Forest Reserve to commercial use. At a 6% discount rate, this is equivalentto $8.25 per person per year. Extrapolating to the entire Costa Rican population of 2,954,000people yields an annual willingness to pay of $24.4 million. In addition, there is the dollarvalue of biodiversity-related tourism, estimated in [27, p. 18] to be $1250 per hectare for CostaRica, that adds $12.5 million per year for Monteverde's 10,000 hectares. There is also thewillingness of foreigners to pay to preserve the Monteverde Cloud Forest, estimated at $18.00per hectare [56, p. 74], and the willingness to pay by pharmaceutical companies to preservebiodiversity ``hot spots'', although this is no more than $2.30 per hectare [61, p. 14]. In order
3 With the addition of the two new variables, the mathematical problem becomes more complicated. Instead of
reformulating the derivatives, the results characterized in Fig. 1 are simply obtained from computer solutions forr=10, 20 and 30. The solution in column (4) of Table 1 includes Lr=145.2077, Hr=2782.325, rL=0.0309901, andrH=0.001617353. The derivatives in rows 16, 17, 18 and 19 are not calculated for column (4).
R.E. Kohn / Socio-Economic Planning Sciences 33 (1999) 151±172 165
to avoid double counting, these ®nal two estimates are not included, and the total economicvalue of Monteverde's biodiversity is assumed to be $36.9 million per year.Based on data in [18, p. 44], it is assumed that the Monteverde Cloud Forest Reserve
contains one fourth of Costa Rica's species, so that the total valuation averages out to $300per year for each of Monteverde's 125,000 species. Although this valuation is an order ofmagnitude less than the $2700 marginal cost, it would be considerably higher if, in the strictsense of the model, these 125,000 species existed nowhere else in Costa Rica than inMonteverde. In that case, the respondents in [18] would surely have valued them much higher.4
The numerical solution in column (3) of Table 1 indicates that 44% of Costa Rica's landarea should be retained as primary wilderness. In fact, more than two thirds of Costa Rica'soriginal forests have been cut, leaving less than 30% of its land area with primary forest [36,pp. 179, 181], most of which is fragmented. However, plans are being implemented to restore atotal of 15% of Costa Rica that is now farmland back to wilderness5, a ratio that is close tothe optimal ratio, LR/L0, in column (3) of Table 1. Although too much signi®cance should notbe given to any empirical validation of this simplistic numerical simulation, it is noteworthythat some of the results come close to being realistic.
9. Concluding remarks
Conventional wisdom holds that increases in population and commercial production areassociated with the loss of natural habitat and the extinction of species. This paper argues thatconservation biology and restoration ecology can sustain biodiversity, even though populationand production are increasing. Production and biodiversity are interfaced in a simple economicmodel in which the production of consumer goods reduces natural habitat and the number ofspecies it supports. However, this loss of species can be o�set by conservation biology andrestoration ecology, in which it is argued that there are substantially increasing returns to scale.Species can be e�ectively rescued on restored land or nature preserves, thereby sustaining atarget number of species. The number of species can be sustained or increased because theaverage acre of intensively managed, restored habitat supports more species than does themarginal acre of natural habitat.When consumption per capita is maximized, both the e�cient level of commercial
production and the e�cient human population increase with the number of species, whereasconsumption per capita decreases.6 The following conditions all follow from the ®rst-order
4 For further discussions of the economic value of species, see [9,10,22,33,46,53].5 Personal communications on 17 January 1997 with Don Rodrigo Carazo, former president (1978±1982) of Costa
Rica. For a discussion of one of these restoration projects, see [36, p. 183].6 A limitation of this model may be that output per capita alone is maximized. In this regard, Meade [40, pp. 80±
93, 573±577] subsequently altered his de®nition of optimal population size to that which maximizes consumption
per capita times total population. (For a model that uses this later de®nition, see [30].) In the present model, thiswould be equivalent to maximizing X alone, but, because there are increasing returns to rescuing species, the optimalpopulation would then approach in®nity. It is only Meade's [39] original de®nition of the optimal population that
yields a non-trivial solution in the present model. However, Meade's expanded de®nition of optimal size populationcould be used by letting the utility of households increase with biodiversity. With such a model, social welfarewould be the product of per-capita welfare and population size.
R.E. Kohn / Socio-Economic Planning Sciences 33 (1999) 151±172166

condition for maximizing consumption per capita: (1) the Meade condition on the marginalproduct per capita equaling consumption per capita, (2) the marginal condition on the e�cientmarginal rate of substitution of labor for land and, (3) the Eiswerth and Haney condition onthe equal marginal biological productivity of preserved and restored habitat. It follows fromthe second-order condition that optimal population and optimal output are complements ofbiodiversity, that there is a threshold level of biodiversity, and that a change in the number ofspecies causes a larger proportional change in population than in total output. Thus, anincrease in biodiversity reduces per capita consumption.Although economic production generally does exhibit increasing and then decreasing returns
to scale, it is the initially strong increasing returns to scale in conservation biology andrestoration ecology that drive the present model. In this respect, the results may be somewhat``forced'', but the threshold level of biodiversity that the model mandates does have a realisticanalogue in the foreboding thresholds in [47,71], while the complementarities in the solutionare a striking metaphor for the ``ecological±economic interdependence'' in [28]. What makesthe results more remarkable is that these thresholds and complementarities emerge from asimple economic model in which production does not explicitly depend upon biodiversity.The model is numerically solved using data for the Costa Rican economy and previously
published estimates of the value of biodiversity in Costa Rica's Monteverde Cloud ForestReserve. The marginal cost of preserving and conserving species in the simulation is an orderof magnitude greater than the estimated bene®t per species. However, the willingness ofrespondents to pay for biodiversity in the Cloud Forest would certainly be higher, and morecomparable with the model's marginal cost of preservation, if the species in the Reserve existednowhere else in Costa Rica. Interestingly, the numerical simulation yields an optimal ratio ofrestored to total land area that is close to the o�cial target ratio for Costa Rica. However, themodel presented here is not primarily intended to be realistic, but rather to represent as simplyas possible the twofold interdependence of human activity and biodiversity and the remediatingpotential of conservation biology and restoration ecology.The integrity of the model does depend on the empirical validity of increasing returns to scale in
rescuing species, for, without these increasing returns, there are no thresholds norcomplementarities. Although there are scienti®c explanations for ecological thresholds andcomplementarities of biodiversity, production and population, the highly stylized model presentedhere serves as a strong metaphor for both the vulnerability of economic productivity to the loss ofbiodiversity and the vital role that conservation biology and restoration ecology can play ineconomies where population and production are increasing and wilderness habitat is shrinking.
Acknowledgements
For their help and inspiration, I am grateful to Peter D. Capen, Mario A. Esquivel Garrote,Leonid Hurwicz, Jonathan B. Losos, H. Jack Ruitenbeek and Fraser Smith.
Appendix A
Combining the identities, (4), (6), and (7), the production and ecological relationships, (1)±
R.E. Kohn / Socio-Economic Planning Sciences 33 (1999) 151±172 167

(5), and the numerical equivalents of the e�ciency conditions, (11), (12), and (13), convenientlyreduces consumption per capita, Z, to a function of LN and S:
Z � X=H � Z�LN,S� � OABC, �A1�where
O � yaabb�s=c��bÿ1�=n�e=m�m�bÿ1�=n, A � L�bÿ1��eÿm�=nN , B �
�S
sLEN
ÿ 1
��bÿ1��1ÿm�=n
and C �"L0 ÿ mS
EsLEÿ1N
� LN
�mEÿ 1
�#a
:
�A2�
The ®rst order condition for an optimal allocation is
dZ
dLN� O�A 0BC� AB 0C� ABC 0� � 0, �A3�
where primes denote ®rst derivatives with respect to LN, as follows:
A 0 ���bÿ 1��Eÿ m�
n
�L��bÿ1��Eÿm�=n�ÿ1N , �A4�
B 0 ���bÿ 1��mÿ 1�
n
��S
sLEN
ÿ 1
����bÿ1��1ÿm�=n�ÿ1�" ESsLE�1
N
#, �A5�
and
C 0 � a
"L0 ÿ mS
EsLEÿ1N
� LN
�mEÿ 1
�#aÿ1��Eÿ 1� mS
EsLEN
� mEÿ 1
�: �A6�
Multiplying the ®rst order condition, (A3), by LN/(OABC ) and then simplifying yields
�bÿ 1� Es�L0
LN
�ÿ m
�S
LEN
�� msÿ Es
!� an
��S
LEN
�ÿ s
�� 0: �A7�
Using the identities (4), (6) and (7), and (11), (12), and (13) from the main body of the paper,it also follows that
H � 1
a
�sc
�1=n� em
�m=nL�Eÿm�=nN
�S
sLEN
ÿ 1
��1ÿm�=n, �A8�
and
R.E. Kohn / Socio-Economic Planning Sciences 33 (1999) 151±172168

X � y�
n�L0 ÿ LN�m� n
�a�bH �b: �A9�
Eq. (A7) makes LN a function of S. It follows from (A8) and (A9) that H and X can also beexpressed as functions of S.The second order condition, that optimal Z is a maximum and not a minimum, is
@2Z
�@LN�2� O�A0BC� AB0C� ABC0� 2A 0B 0C� 2AB 0C 0 � 2A 0BC 0�<0, �A10�
where A0, B0, and C0 are the second derivatives with respect to LN, as follows:
A0 ���bÿ 1��Eÿ m�
n
���bÿ 1��Eÿ m�n
ÿ 1
�L���bÿ1��Eÿm�=n�ÿ2�N , �A11�
B0 ��E�bÿ 1��mÿ 1�
sn
�"S
LE�2N
#�S
sLEN
ÿ 1
����bÿ1��1ÿm�=n�ÿ2����
"�1ÿ �bÿ 1��1ÿ m�
n
�
��
ESsLE
N
�ÿ�
S
sLEN
ÿ 1
��E� 1�
#, �A12�
and
C0 � a
"L0 ÿ mS
EsI Eÿ1N
� LN
�mEÿ 1
�#aÿ2���
24��Eÿ 1� mSEsLE
N
� mEÿ 1
�2
�aÿ 1�
� L0 ÿ mS
EsLEÿ1N
� LN
�mEÿ 1
�! �1ÿ E� mS
sLE�1N
!35:�A13�
Multiplying the second order condition, (A1), by LN2/(OABC ), substituting (A2) and (A7),
replacing (1ÿb ) with a, and multiplying through by [(S/LEN )ÿs ]n 2/a, which is necessarily
positive, reduces (A1) to
�Eÿ m��aEÿ am� n���S=LEN� ÿ s� � E�1ÿ m��S=LE
N�
���
E��2a� n�sÿ a�1� m��S=LEN��
�S=LEN� ÿ s
�� 2amÿ n
�� ��1ÿ E�m�S=LE
N� ÿ s�mÿ E��
�264�a� 1�
� �Eÿ 1�m�S=LEN� ÿ s�Eÿ m�
�S=LEN� ÿ s
�� nEm�S=LE
N�m�S=LE
N� ÿ s�Eÿ mEÿ 1
�375<0:�A14�
The relationship between optimal population, H, optimal production, X, and the number of
R.E. Kohn / Socio-Economic Planning Sciences 33 (1999) 151±172 169

species, S, is derived from Eqs. (A7), (A8) and (A9). The partial derivatives of these equations,with respect to LN, are as follows:
@S
@LN��
Esm� n
�LEÿ1N
��Eÿ 1�L0
LN� m� nÿ E
�, �A15�
@H
@LN��1
an
��sc
�1=n� Em
�m=nhL���Eÿm�=n�ÿ1�N
i�S
sLEN
ÿ 1
����1ÿm�=n�ÿ1����
"L1ÿEN
�1ÿ ms
�
��@S
@LNÿ ES
LN
�� �Eÿ m�
�S
sLEN
ÿ 1
�#, �A16�
and
@X
@LN� y�bH �b
�n�L0 ÿ LN�
m� n
�a" ÿa�L0 ÿ LN� �
�bH
��@H
@LN
�#: �A17�
References
[1] Anas A. Optimal preservation and pricing of natural public lands in general equilibrium. Journal ofEnvironmental Economics and Management 1998;15:158±72.
[2] Ando AW. Ecosystems, interest groups, and the Endangered Species Act. Resources 1998;No. 130:7±9 Winter.
[3] Arrhenius O. Statistical investigations in the constitution of plant associations. Ecology 1923;4:68±73.
[4] Barbier EB, Burgess JC, Folke C. Paradise lost? The ecological economics of biodiversity. London: Earthscan,1994.
[5] Baskin Y. The work of nature: how the diversity of life sustains us. Washington, DC: Island Press, 1997.
[6] Bishop RC. Endangered species and uncertainty: the economics of a safe minimum standard. American Journalof Agricultural Economics 1978;60:10±8.
[7] Brown Jr GR, Shogren JF. Economics of the endangered species act. Journal of Economic Perspectives1998;12:3±20 (Summer).
[8] Catton WR Jr, What have we done to carrying capacity?, Wild Earth 1997/8;64±70 (Winter).
[9] Chambers CM, Chambers PE, Whitehead JC. Conservation organizations and the option value to preserve: anapplication to debt-for-nature swaps. Ecological Economics 1994;9:135±43.
[10] Chester CC. Controversy over Yellowstone's biological resources. Environment 1996;38:10±5, 34±36 (October).
[11] Cincotta RP. Economics and rapid change: the in¯uence of population growth. In: Occasional Paper No. 3.Washington, DC, Population Action International: , 1997.
[12] Collier MP, Webb RH, Andrews ED. Experimental ¯ooding in Grand Canyon. Scienti®c American1997;276:82±9 (January).
[13] Crumpacker DW, Hodge SW, Friedley D, Gregg Jr WP. A preliminary assessment of the status of major ter-restial and wetland ecosystems on federal and Indian lands in the United States. Conservation Biology1998;2:103±15.
[14] Daily GC, Ehrlich PR, Population extinction and the biodiversity crisis, Wild Earth 1997/1998;35±45 (Winter).
[15] Dasgupta P. The population problem: theory and evidence. Journal of Economic Literature 1995;33:1879±902.
[16] Durbin K. High noon in the national forests: on the hill and in the White House, biodiversity in federal forestsfaces a showdown. Amicus Journal 1996;18:26±30 (Summer).
R.E. Kohn / Socio-Economic Planning Sciences 33 (1999) 151±172170

[17] Eiswerth ME, Haney JC. Allocating conservation expenditures: accounting for inter-species genetic distinctive-ness. Ecological Economics 1992;5:235±49.
[18] Escheverrõ a J, Hanrahan M, Solo rzano R. Valuation of non-priced amenities provided by the biological
resources within the Monteverde Cloud Forest Preserve, Costa Rica. Ecological Economics 1995;13:43±52.
[19] Farmer MC, Randall A. The rationality of a Safe Minimum Standard. Land Economics 1998;74:287±302
(August).
[20] Gilbert LE. Food web organization and the conservation of neotropical diversity. In: Soule ME, Wilcox BA,
editors. Conservation biology. MA: Sinauer, 1980. p. 11±33.
[21] Gowdy JM, McDaniel CN. One world, one experiment: addressing the biodiversity±economics con¯ict.
Ecological Economics 1995;15:181±92.
[22] Gowdy JM. The value of biodiversity: markets, society and ecosystems. Land Economics 1997;73:25±41
(February).
[23] Grime JP. Biodiversity and ecosystem function: the debate deepens. Science 1997;29:1260±1.
[24] Harford JD. Stock pollution, child-bearing externalities, and the social discount rate. Journal of EnvironmentalEconomics and Management 1997;33:94±105.
[25] Harford JD. The ultimate externality. American Economic Review 1998;88:260±5.
[26] Helvarg D. Destruction to reconstruction: restoring the everglades. National Parks 1998;72:22±7 March/April.
[27] Janetos AC. Do we still need nature? the importance of biodiversity. Consequences 1997;3(1):7±26.
[28] John KH, Walsh RG, Johnson RL. An integrated model of human-wildlife interdependence. EcologicalEconomics 1994;11:65±75.
[29] Kasperson JX, Kasperson RE, Turner BL II. Regions at risk: exploring environmental criticality. Environment1996;38:4±15, 26±30 (December).
[30] Kohn RE. Pollution and population. Rivista Internazionale di Scienze Economiche e Commerciali 1996;43:1±1.
[31] Kohn RE. Pollution and the ®rm. Cheltenham: Elgar, 1998.
[32] Line L. A system under siege. Wilderness 1995;59:10±27.
[33] Loomis JB, White DS. Economic bene®ts of rare and endangered species: summary and meta-analysis.
Ecological Economics 1996;18:197±206.
[34] Losos E. The future of the US Endangered Species Act. TREE 1993;8:332±6.
[35] Lucas G. Out on a limb. Nature Conservancy 1996;46:25±9 (November/December).
[36] Lutz E, Daly H. Incentives, regulations, and sustainable land use in Costa Rica. Environmental and ResourceEconomics 1991;1:179±94.
[37] MacArthur RH, Wilson EO. The theory of island biogeography. Princeton, NJ: Princeton University Press,1967.
[38] McGrady-Steed J, Harris PM, Morin PJ. Biodiversity regulates ecosystem predictability. Nature 1997;390:162±5(November 13).
[39] Meade JE. An introduction to cconomic analysis and policy. Oxford: Clarendon Press, 1036.
[40] Meade JE. The theory of international economic policy, volume 2, trade and welfare. London: OxfordUniversity Press, 1955.
[41] Metrick A, Weitzman ML. Patterns of behavior in endangered species preservation. Land Economics1996;72:1±6.
[42] Miller JR. A simple economic model of endangered species preservation in the United States. Journal ofEnvironmental Economics and Management 1978;5:292±300.
[43] Montgomery C, Brown Jr GM. Economics of species preservation: the spotted owl case. Contemporary PolicyIssues 1992;10:1±2.
[44] Montgomery CA, Brown Jr GM, Adams DM. The marginal cost of species preservation: the northern spottedowl. Journal of Environmental Economics and Management 1994;26:111±28.
[45] Passmore J. Man's responsibility for nature. London: Duckworth, 1974.
[46] Pearce D, Moran D. The economic value of biodiversity. London: Earthscan, 1994.
[47] Perrings C, Pearce D. Threshold e�ects and incentives for the conservation of biodiversity. Environmental andResource Economics 1994;4:13±28.
[48] Perrings C, MaÈ ler K-G, Folke C, Holling CA, Jansson B-O. Biodiversity loss: economic and ecological issues.Cambridge: Cambridge University, 1995.
R.E. Kohn / Socio-Economic Planning Sciences 33 (1999) 151±172 171

[49] Plourde C. Conservation of extinguishable species. Natural Resources Journal 1975;15:791±7.[50] Polasky S, Solow AR. On the value of a collection of species. Journal of Environmental Economics and
Management 1995;29:298±303.[51] Preston FW. The canonical distribution of commoness and rarity: part I. Ecology 1962;43:185±215.[52] Pyle RM. Management of nature reserves. In: Soule ME, Wilcox B, editors. Conservation biology. MA:
Sinauer, 1980. p. 319±27.[53] Raustiala K, Victor DG. The future of the convention on biological diversity. Environment 1996;38:17±20, 37±
45 (May).
[54] Reid WV. Strategies for conserving biodiversity. Environment 1997;39:16±20, 39±43 (September).[55] Robbins J. For some, roughing it in wilderness isn't what it used to be. New York Times 1997;13:10A January.[56] Ruitenbeck HJ. The rainforest supply price: a tool for evaluating rainforest conservation expenditures.
Ecological Economics 1992;6:57±78.[57] Sawhill JC. Conservation science comes of age. Nature Conservancy 1996;46(1):5±9.[58] Scott JM, Csuti B, Smith K, Estes JE, Caicco S. Beyond endangered species: an integrated conservation strat-
egy for the preservation of biological diversity. Endangered Species Update 1988;5:43±8.
[59] Shafer CL. Nature reserves: island theory and conservation practice. Washington, DC: Smithsonian Press,1990.
[60] Simberlo� D. Impacts of introduced species in the United States. Consequences 1996;2:13±22.
[61] Simpson RD. Biodiversity prospecting. Resources 1997;126:12±5 (Winter).[62] Smith FDM, May RM, Pellew R, Johnson TH, Walter KS. Estimating extinction rates. Nature 1993;364:494±
6.
[63] Smith F. Biological diversity, ecosystem stability, and economic development. Ecological Economics1996;16:191±203.
[64] Solow A, Polasky S, Broadus J. Journal of Environmental Economics and Management 1993;24:68.
[65] Soule ME, Kohm KA. Research priorities for conservation biology. Washington, DC: Island Press, 1989.[66] StaÈ hler F. Biological diversity: the international management of genetic resources and its impact on biotechnol-
ogy. Ecological Economics 1994;11:227±36.[67] Stein BA. Putting nature on the map. Nature Conservancy 1996;46(1):24±7.
[68] Stein BA, Flack SR. Conservation priorities: the state of U.S. plants and animals. Environment 1997;39:6±11,34±39 (May).
[69] Stern DI. Limits to substitution and irreversibility in production and consumption: a neoclassical interpretation
of ecological economics. Ecological Economics 1997;21:197±215.[70] Stolzenburg W. Building a better refuge. Nature Conservancy 1996;46(1):18±23.[71] Swanson T. The reliance of northern economies on southern biodiversity: biodiversity as information.
Ecological Economics 1996;17:1±8.[72] Teitelbaum M, Winter J. The missing links: the population±environment debate in historical perspective. In:
Ness GD, Drake WD, Brechin SR, editors. Population±environment dynamics: ideas and observations. AnnArbor, MI: University of Michigan, 1993. p. 17±31.
[73] Temple SA. Easing the travails of migratory birds. Environment 1998;40:6±9, 28±32 (January/February).[74] Tilman D, Downing JA. Biodiversity and stability in grasslands. Nature 1994;367:363±5 (January).[75] Toman MA. Economics and sustainability: balancing trade-o�s and imperatives. Land Economics 1994;70:399±
413.[76] Vaughn GF, Meine CD, Acting on principle: Aldo Leopold and biodiversity conservation. Choices 1996;32±35
(Third Quarter).
[77] Weitzman ML. What to preserve? an application of diversity theory to crane conservation. Quarterly Journalof Economics 1993;108:157±83.
[78] Wille C, Environmental resources of the rain forest. Nature Conservancy 1993;10±17.
[79] Youth H. Ecologist David Wilcove's life is for the birds. EDF Letter 1996;27:2.[80] Academic American encyclopedia, volume 5. Danbury: Grolier 1991.
R.E. Kohn / Socio-Economic Planning Sciences 33 (1999) 151±172172