Embed Size (px)
Citation preview

The Florida LegislatureOffice of Economic and
Demographic Research850.487.1402http://edr.state.fl.us
Presented by:
Florida:Long-Range Financial Outlook
Appropriations Subcommittee on EducationThe Florida Senate
September 25, 2013

Economy RecoveringFlorida growth rates are gradually returning to more typical levels. But, drags are more persistent than past events, and it will take a few more years to climb completely out of the hole left by the recession. In the various forecasts, normalcy has been largely achieved by FY 2016-17. Overall...
The recovery in the national economy is well underway. While most areas of commercial and consumer credit are strengthening – residential credit still remains sluggish and difficult for consumers to access but has shown recent improvement.
The subsequent turnaround in Florida housing will be led by:Low home prices that begin to attract buyers and clear the inventory.Long-run sustainable demand caused by continued population growth and household formation that has been pent-up.Florida’s unique demographics and the aging of the baby-boom generation (2011 marked the first wave of boomers hitting retirement).
1

Debt AnalysisIn Fitch’s August 2013 rating of the state, they highlighted the state’s strong financial management practices saying “The state employs sound financial management practices, including the use of consensus revenue estimating, and has a history of prompt action to maintain fiscal balances and reserves.” Further, “The Florida legislature consistently and promptly addressed numerous large negative revenue estimate revisions during the downturn, maintaining budget balance and an adequate reserve position.”
Highest Level Credit Ratings: Fitch “AAA” with stable outlook (improved from negative outlook); Moody’s “Aa1” with stable outlook (unchanged); Standard and Poor’s “AAA” with stable outlook (unchanged).
Total state debt outstanding at June 30, 2012, was $26.2 billion. Of this, net tax-supported debt totaled $21.6 billion for programs supported by state tax revenues or tax-like revenues. Based on existing borrowing plans, total state debt outstanding is expected to continue to slowly decline as annual debt retirement increases and new debt issuance decreases. (Total state direct debt outstanding for June 30, 2013, is projected to have declined another $1.5 billion to $24.6 billion).
During the Outlook period, debt service payments will total about $1.9 billion per year, a decrease from previous years due to the retirement of the Preservation 2000 bonds.
2

Budget Gaps Identified in Previous Outlooks
Each Long-Range Financial Outlook provides the first look at the likely scenario facing the Legislature in its preparation of the budget for the following fiscal year. Four of the seven constitutionally required Outlooks showed substantial budget gaps, or potential shortfalls between revenues and expenditures, at the time of adoption. The gaps indicated that a structural imbalance—where budget growth outpaces revenue growth—was plaguing the state. The most recent three years have presented a different story.
OutlookFor the Period
BeginningYEAR 1
($ Millions)YEAR 2
($ Millions)YEAR 3
($ Millions)Level of
Reserves2007 Fiscal Year 2008-09 ($2,334.5) ($2,860.7) ($3,066.0) $0.02008 Fiscal Year 2009-10 ($3,306.3) ($2,482.5) ($1,816.8) $0.02009 Fiscal Year 2010-11 ($2,654.4) ($5,473.2) ($5,228.6) $0.02010 Fiscal Year 2011-12 ($2,510.7) ($2,846.3) ($1,930.3) $0.02011 Fiscal Year 2012-13 $273.8 $692.1 $840.6 $1,000.02012 Fiscal Year 2013-14 $71.3 $53.5 $594.0 $1,000.02013 Fiscal Year 2014-15 $845.7 $1,426.7 $3,295.3 $1,000.0
3

Impact of Prior Year’s Actions...Legislative actions, particularly during the 2011 and 2012 Sessions, to close the projected budget gap through recurring means positively impacted the state’s bottom line in subsequent years.
In this regard, total estimated expenditures for future years were constrained by the amount of recurring expenditure reductions taken in prior fiscal years.
Along with the improving economy, this has greatly improved the Long-Range Financial Outlook’s bottom line.
The results shown in the 2013 Outlook are the most encouraging in the seven-year history of the document’s production.
4

General Revenue Forecast
5
LR Growth: Averages 6%
Fiscal YearPost-Session
ForecastAugust
Forecast Difference Incremental
Growth Growth2005-06 27074.8 8.4%2006-07 26404.1 #REF! -670.7 -2.5%2007-08 24112.1 #REF! -2292.0 -8.7%2008-09 21025.6 21025.6 0.0 -3086.5 -12.8%2009-10 21523.1 21523.1 #REF! 497.5 2.4%2010-11 22551.6 22551.6 0.0 1028.5 4.8%2011-12 23618.8 23618.8 0.0 1067.2 4.7%2012-13 25020.6 25314.6 294.0 1695.8 7.2%2013-14 26006.4 26184.2 177.8 869.6 3.4%2014-15 27075.6 27333.2 257.6 1149.0 4.4%2015-16 28144.6 28560.9 416.3 1227.7 4.5%2016-17 29401.1 29920.8 519.7 1359.9 4.8%2017-18 30942.6 31354.9 412.3 1434.1 4.8%
The growth rates for FY 2012-13 and FY 2013-14 are slightly distorted by the receipt of the $200.1 million deposit from the National Mortgage Settlement Agreement. After adjusting for this deposit, the underlying growth rates are 6.3% and 4.3%, respectively.

GR Unallocated & Other Reserves
The final General Revenue reserve balance has since increased by $241.2 million, as a result of greater than expected 2012-13 revenue collections and the new revenue forecast for 2013-14. The balance is now projected to be $1,893.5 million for the fiscal year. Combined with the $924.8 million expected in the Budget Stabilization Fund and approximately $536.3 million that is available in the Lawton Chiles Endowment Fund, the total across all sources that are traditionally mentioned as reserves is $3,354.6 million or 12.8 percent of General Revenue collections for FY 2013-14. 6

Budget DriversCritical Needs are mandatory increases based on estimating conferences and other essential items. The eighteen Critical Needs drivers represent the minimum cost to fund the budget without significant programmatic changes. For the General Revenue Fund, the greatest burden occurs in FY 2015-16.
The twenty-five Other High Priority Needs drivers represent a conservative approach to issues that have been funded in most of the recent budget years. Unlike the Critical Needs, the greatest General Revenue burden occurs in the first year.
GENERAL REVENUE FUNDFiscal Year
2014-15Fiscal Year
2015-16Fiscal Year
2016-17Total Tier 1 - Critical Needs 408.2 623.3 283.8 Total - Other High Priority Needs 455.7 321.7 248.3 Total Tier 2 - Critical and Other High Priority Needs 863.9 945.0 532.1
DOLLAR VALUE OFCRITICAL AND OTHER HIGH PRIORITY NEEDS
7
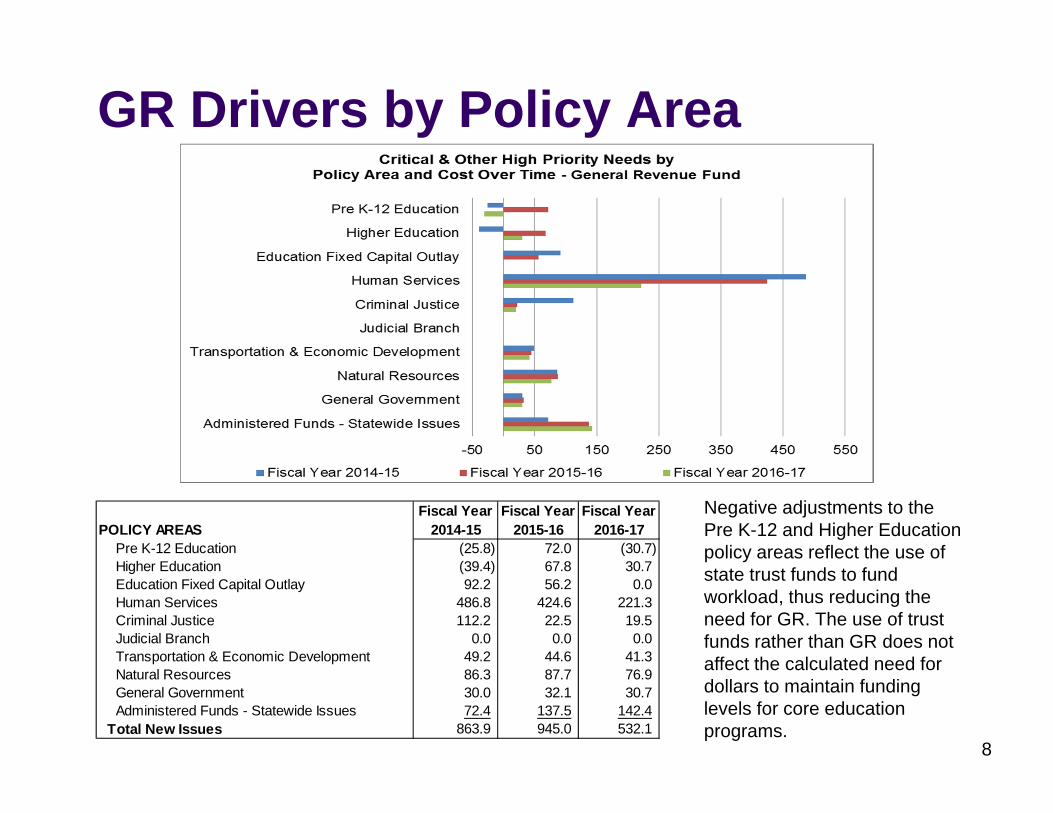
GR Drivers by Policy Area
POLICY AREASFiscal Year
2014-15Fiscal Year
2015-16Fiscal Year
2016-17Pre K-12 Education (25.8) 72.0 (30.7)Higher Education (39.4) 67.8 30.7Education Fixed Capital Outlay 92.2 56.2 0.0Human Services 486.8 424.6 221.3Criminal Justice 112.2 22.5 19.5Judicial Branch 0.0 0.0 0.0Transportation & Economic Development 49.2 44.6 41.3Natural Resources 86.3 87.7 76.9General Government 30.0 32.1 30.7Administered Funds - Statewide Issues 72.4 137.5 142.4
Total New Issues 863.9 945.0 532.1
Negative adjustments to the Pre K-12 and Higher Education policy areas reflect the use of state trust funds to fund workload, thus reducing the need for GR. The use of trust funds rather than GR does not affect the calculated need for dollars to maintain funding levels for core education programs.
8

Use of Education Trust Funds
Both the EETF and the SSTF are projected to have significant carry forward funds from FY 2013-14 into FY 2014-15. In addition, each fund is projected to have revenue growth over the three-year forecast period. The 2013 Outlook maximizes the use of state trust funds to maintain funding levels for core education programs while maintaining a healthy reserve in each fund (3.66% of the revenue estimate).
9
FY 2013-14
FY 2014-15
FY 2015-16
FY 2016-17
Educational Enhancement Trust Fund (EETF)Funds Available 1,721.4 1,734.2 1,705.4 1,736.0
Estimated Expenditures 1,609.5 1,675.0 1,646.2 1,676.8
Ending Balance 111.9 59.2 59.2 59.2
State School Trust Fund (SSTF)Funds Available 284.9 266.3 208.6 227.8
Estimated Expenditures 204.7 259.6 201.9 221.1
Ending Balance 80.2 6.7 6.7 6.7

Pre K-12 Education Drivers
10
FY 2014-15 FY 2015-16 FY 2016-17Critical Needs GR Trust GR Trust GR Trust
FEFP Maintain Current Budget (55.3) 143.7 61.4 (61.3) (40.5) 40.5
FEFP Workload & Enrollment 257.8 0.0 289.6 0.0 319.4 0.0
FEFP Adjustment to Offset Tax Roll Changes (232.7) 0.0 (289.6) 0.0 (319.4) 0.0
VPK Workload & Enrollment (0.7) 0.0 5.7 0.0 5.0 0.0
Other High Priority NeedsFEFP EETF Adjustment – Bright Futures TuitionIncreases
5.1 (5.1) 4.9 (4.9) 4.8 (4.8)
TOTAL NEEDS (25.8) 138.6 72.0 (66.2) (30.7) 35.7

FEFP Impact
11
AD VALOREM REVENUE FY 2013-14
FY 2014-15
FY 2015-16
FY 2016-17
School Taxable Value Growth 3.32% 3.87% 4.11%
FEFP Local Revenue $7,835 million
$8,068 million
$8,358 million
$8,677 million
Increase in Ad Valorem Revenue $232.7 million
$289.6 million
$319.4 million
Adjustment to Offset Tax Roll Changes ($232.7) million
($289.6) million
($319.4) million
BUDGET DRIVERS FY 2014-15 FY 2015-16 FY 2016-17
Maintain Current Budget $88.4 million $0 $0
Workload and Enrollment $257.8 million
$289.6 million
$319.4 million
Adjustment to Offset Tax Roll Changes ($232.7) million
($289.6) million
($319.4) million
FEFP State Funds Needed in the Outlook $113.5 million $0 $0

FEFP Funding & Enrollment
12
Using a combination of General Revenue, state trust funds (Educational Enhancement and State School), and local ad valorem revenues, the 2013 Outlook maintains the level of total state funds per student for FY 2014-15 by funding the growth in students with state funds by increasing the BSA. The Outlook then maintains the level of total state funds for FYs 2015-16 and 2016-17.
Enrollment Changes...• Slight increase in FY 2014-15 (6,483 FTE or less than 1%) • Declines in the two out years from smaller birth cohorts.
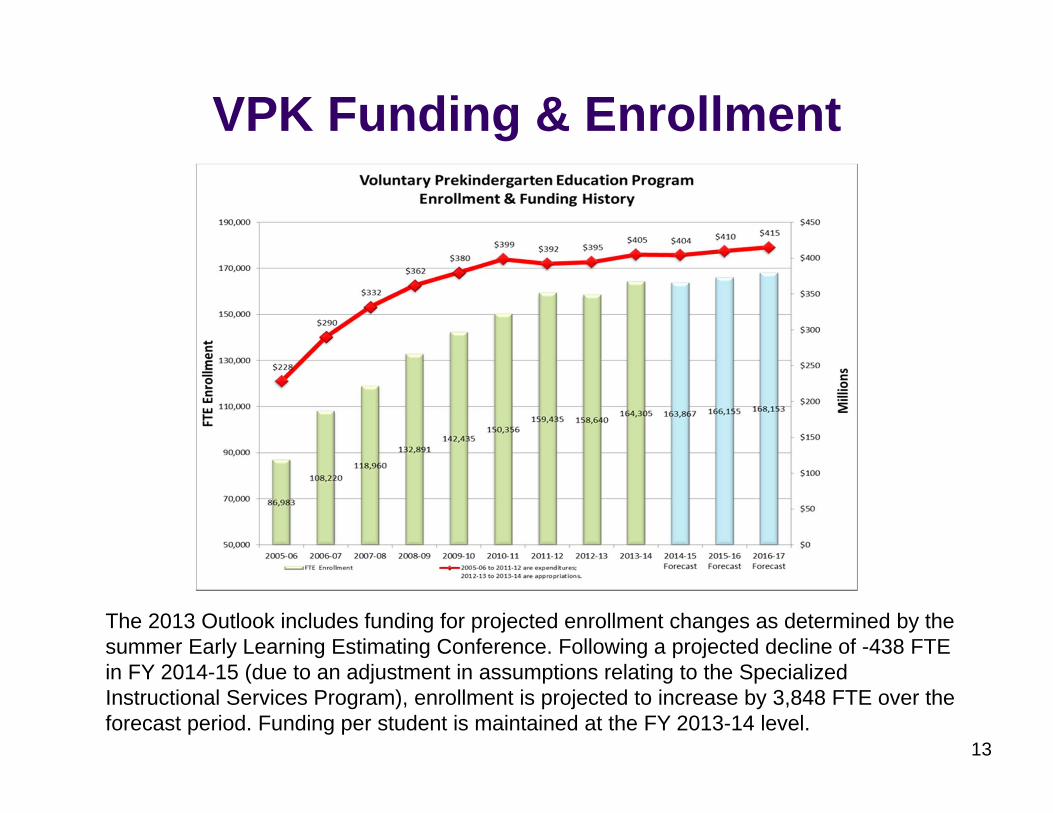
VPK Funding & Enrollment
13
The 2013 Outlook includes funding for projected enrollment changes as determined by the summer Early Learning Estimating Conference. Following a projected decline of -438 FTE in FY 2014-15 (due to an adjustment in assumptions relating to the Specialized Instructional Services Program), enrollment is projected to increase by 3,848 FTE over the forecast period. Funding per student is maintained at the FY 2013-14 level.

Higher Education Drivers
14
FY 2014-15 FY 2015-16 FY 2016-17Critical Needs GR Trust GR Trust GR Trust
Maintain Current Budget 0.2 0.0 0.0 0.0 0.0 0.0
Bright Futures; CSDDV Workload & Enrollment 0.2 (33.1) 0.2 (19.8) 0.2 (22.1)
EETF Adjustment (98.2) 98.2 5.4 (5.4) (31.4) 31.4
Other High Priority NeedsFlorida Colleges Workload 13.7 0.0 13.7 0.0 13.7 0.0
State Universities Workload 16.7 0.0 15.7 0.0 15.7 0.0

Higher Education Drivers
15
FY 2014-15 FY 2015-16 FY 2016-17Other High Priority Needs, cont’d. GR Trust GR Trust GR Trust
Workforce Education Workload (1.5) 0.0 (1.5) 0.0 (1.5) 0.0
Bright Futures - Adjust Award Levels for Tuition Increases
0.0 12.6 0.0 12.3 0.0 11.9
EETF Adjustment - Bright Futures Tuition Increases 7.5 (7.5) 7.3 (7.3) 7.0 (7.0)
Other ProgramsWorkload (FRAG, ABLE) 3.3 0.0 3.3 0.0 3.3 0.0
College and University New Space Operations 18.7 0.0 23.7 0.0 23.7 0.0
TOTAL NEEDS (39.4) 70.2 67.8 (20.2) 30.7 14.2

Bright Futures Funding & Awards
16
The Outlook provides Critical Needs funding for the number of eligible recipients projected by the most recent Student Financial Aid Estimating Conference. The forecast projects 40,657 fewer eligible students over the three-year period due to increased eligibility requirements. Other High Priority Needs include EETF revenues to increase Bright Futures awards to account for average annual tuition increases of 5.25 percent for Florida colleges, and 4.43 percent for state universities.
Education Fixed Capital Outlay
17
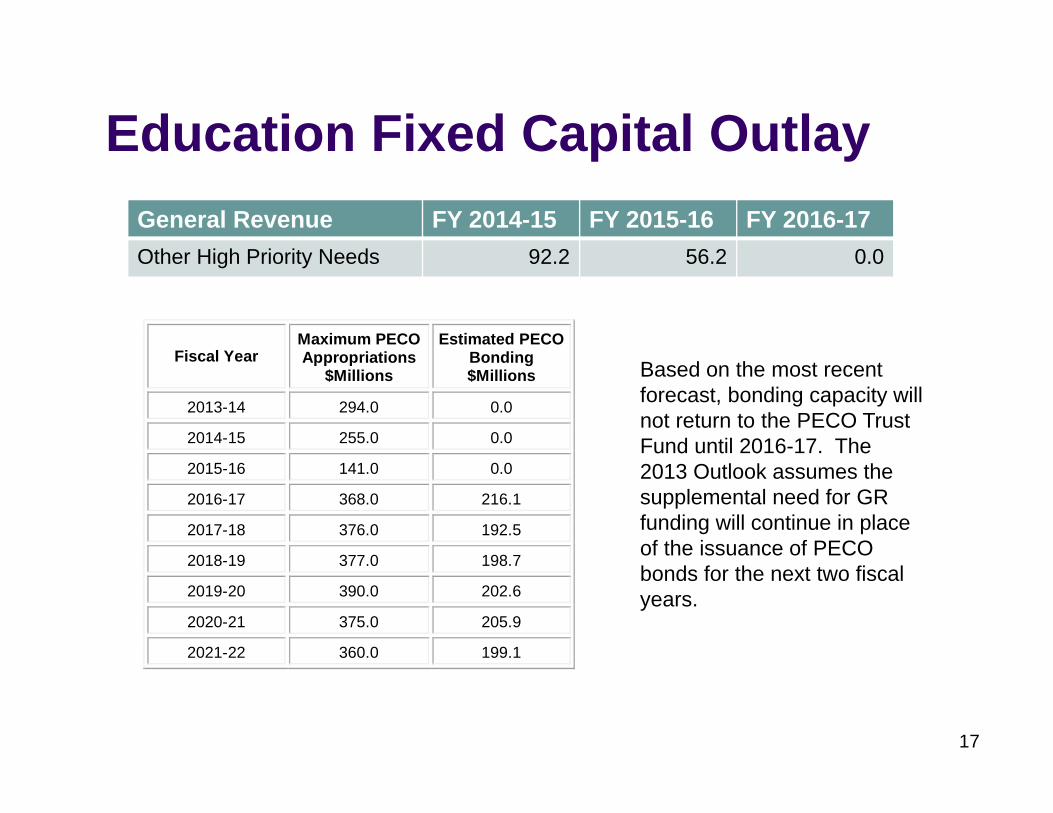
General Revenue FY 2014-15 FY 2015-16 FY 2016-17Other High Priority Needs 92.2 56.2 0.0
Fiscal Year Maximum PECOAppropriations
$Millions
Estimated PECO Bonding $Millions
2013-14 294.0 0.0
2014-15 255.0 0.0
2015-16 141.0 0.0
2016-17 368.0 216.1
2017-18 376.0 192.5
2018-19 377.0 198.7
2019-20 390.0 202.6
2020-21 375.0 205.9
2021-22 360.0 199.1
Based on the most recent forecast, bonding capacity will not return to the PECO Trust Fund until 2016-17. The 2013 Outlook assumes the supplemental need for GR funding will continue in place of the issuance of PECO bonds for the next two fiscal years.

Putting It Together for the First Year
Combined, recurring and nonrecurring General Revenue program needs – with a minimum reserve of $1 billion – are less than the available General Revenue dollars, meaning there is no budget gap for FY 2014-15. Anticipated expenditures (including the reserve) can be fully funded. The budget will be in balance as constitutionally required.
18
RECURRINGNON
RECURRING TOTALAVAILABLE GENERAL REVENUE $27,310.0 $1,967.2 $29,277.2
Base Budget $26,353.1 $0.0 $26,353.1 Transfer to Budget Stabilization Fund $0.0 $214.5 $214.5
Critical Needs $370.9 $37.3 $408.2 Other High Priority Needs $189.3 $266.4 $455.7
Reserve $0.0 $1,000.0 $1,000.0 TOTAL $26,913.3 $1,518.2 $28,431.5
BALANCE $396.7 $449.0 $845.7
OUTLOOK PROJECTION – FISCAL YEAR 2014-15 (in millions)

The Bottom Line...Fiscal Years 2014-15, 2015-16, and 2016-17 all show projected budget needs within the available revenue for Critical and Other High Priority Needs, including the set-aside of a $1 billion GR reserve in each year.
No Fiscal Strategies are required for any year in the Outlook period, since there is no budget gap during the period, the anticipated reserve is fully funded, and the budget is growing more slowly than available revenues.
For the third time since the adoption of the constitutional amendment requiring the development of Long-Range Financial Outlooks, sufficient funds exist to meet all Critical and Other High Priority Needs identified for the three years contained in the Outlook.
19

RiskThe positive budget outlook is heavily reliant on the projected balance forward levels being available, the $1 billion reserve not being used, and future growth levels for General Revenue being achieved. Assuming the $1 billion reserve is strictly adhered to each year:
An additional $845.7 million in nonrecurring expenditures or tax reductions could be undertaken in 2014-15 without causing a budget gap in 2015-16.An additional $845.7 million in recurring expenditures or tax reductions in 2014-15 would create a budget gap of ($264.7) million in 2015-16.Additional recurring expenditures or tax reductions of no more than $713.3 million could be undertaken in 2014-15 without creating a budget gap in the following year.
As part of the decision-making process regarding whether to increase spending, replace lost federal funding, or reduce tax revenues, two factors should be considered by the Legislature:
1. The impact of recurring versus nonrecurring expenditures or tax reductions on future budget years—53 percent, or $449 million, of the $845.7 million is nonrecurring.
2. The sections of the Outlook entitled “Significant Risks to the Forecast” and “Florida Economic Outlook” which describe a number of issues that have the potential to alter key assumptions and, therefore, the level of revenues and/or expenditures used to build the Outlook. Key among these are Sequester effects and a fragile housing market still vulnerable to increasing mortgage rates and the pace of foreclosures.
20

A New “Fiscal Cliff” in Fall 2013Automatic Sequester – Many of the Sequester’s expected early effects were muted through the use of federal reserves, targeted congressional fixes, and contracting delays. These solutions will be largely unavailable if the Sequester continues into future fiscal years, meaning that the cumulative effects will come closer to the original predictions. While it is clear that there is no meaningful support for the current Sequester provisions, agreement has not been reached on a long-term replacement. It is likely that any of the proposed alternatives will attempt to generate a similar amount of savings and have an equal or greater detrimental impact on Florida’s economy.
Statutory Debt Ceiling Reached – The House and Senate passed and the President signed “The No Budget, No Pay Act” to waive the statutory debt limit through May 18, 2013, allowing the Treasury to borrow above the current $16.4 trillion limit until then. Due to technical adjustments available to the Treasury, continued borrowing is available for a limited time. It is likely those measures will be exhausted sometime in mid-October.
DefenseFFIS: Direct Impact of Full Sequester (Federal Grants and Contracts) 1.877 billionGeorge Mason: Direct, Indirect & Induced Impact of Full Sequester (Economy) 3.632 billion 41,905
Domestic Discretionary SpendingFFIS: Direct Impact of Full Sequester (Federal Grants and Contracts) 0.362 billionGeorge Mason: Direct, Indirect & Induced Impact of Full Sequester (Economy) 4.366 billion 37,554
TOTALFFIS: Direct Impact of Full Sequester (Federal Grants and Contracts) 2.239 billionGeorge Mason: Direct, Indirect & Induced Impact of Full Sequester (Economy) 7.998 billion 79,459
Impact ($) All Jobs in Florida Economy
PROJECTED SEQUESTER IMPACTS FOR FLORIDA DEVELOPED PRIOR TO JANUARY 1, 2013Range from Initial Impact (FFIS) to Total Florida Economic Shock (George Mason)
Impact ($) Defense‐Related Jobs
Impact ($) Non‐Defense Jobs
21