Embed Size (px)
Citation preview

ARL-TR-7922 ● JAN 2017
US Army Research Laboratory
Three-Dimensional Sensor Common Operating Picture (3-D Sensor COP)
by Damon M Conover and John F Dammann, Jr Approved for public release; distributed is unlimited.

NOTICES
Disclaimers
The findings in this report are not to be construed as an official Department of the Army position unless so designated by other authorized documents. Citation of manufacturer’s or trade names does not constitute an official endorsement or approval of the use thereof. Destroy this report when it is no longer needed. Do not return it to the originator.

ARL-TR-7922 ● JAN 2017
US Army Research Laboratory
Three-Dimensional Sensor Common Operating Picture (3-D Sensor COP)
by Damon M Conover Sensors and Electron Devices Directorate, ARL John F Dammann, Jr Booz Allen Hamilton Approved for public release; distribution is unlimited.

ii
REPORT DOCUMENTATION PAGE Form Approved OMB No. 0704-0188
Public reporting burden for this collection of information is estimated to average 1 hour per response, including the time for reviewing instructions, searching existing data sources, gathering and maintaining the data needed, and completing and reviewing the collection information. Send comments regarding this burden estimate or any other aspect of this collection of information, including suggestions for reducing the burden, to Department of Defense, Washington Headquarters Services, Directorate for Information Operations and Reports (0704-0188), 1215 Jefferson Davis Highway, Suite 1204, Arlington, VA 22202-4302. Respondents should be aware that notwithstanding any other provision of law, no person shall be subject to any penalty for failing to comply with a collection of information if it does not display a currently valid OMB control number. PLEASE DO NOT RETURN YOUR FORM TO THE ABOVE ADDRESS.
1. REPORT DATE (DD-MM-YYYY)
January 2017 2. REPORT TYPE
Technical Report 3. DATES COVERED (From - To)
10/2015–09/2016 4. TITLE AND SUBTITLE
Three-Dimensional Sensor Common Operating Picture (3-D Sensor COP) 5a. CONTRACT NUMBER
5b. GRANT NUMBER
5c. PROGRAM ELEMENT NUMBER
6. AUTHOR(S)
Damon M Conover and John F Dammann, Jr 5d. PROJECT NUMBER
5e. TASK NUMBER
5f. WORK UNIT NUMBER
7. PERFORMING ORGANIZATION NAME(S) AND ADDRESS(ES)
US Army Research Laboratory ATTN: RDRL-SES-E 2800 Powder Mill Road Adelphi, MD 20783-1138
8. PERFORMING ORGANIZATION REPORT NUMBER
ARL-TR-7922
9. SPONSORING/MONITORING AGENCY NAME(S) AND ADDRESS(ES)
10. SPONSOR/MONITOR'S ACRONYM(S)
11. SPONSOR/MONITOR'S REPORT NUMBER(S)
12. DISTRIBUTION/AVAILABILITY STATEMENT
Approved for public release; distribution is unlimited.
13. SUPPLEMENTARY NOTES
14. ABSTRACT
Fusion3D is a software application for stereoscopic visualization of 3-D terrain data. It uses a 3-D display, 3-D glasses, and a 3-D mouse to quickly view province-sized 3-D maps in stereo. It includes many features intended to provide users with improved situational awareness and aid in mission planning; however, recently, in an attempt to further improve situational awareness, it was modified to overlay real-time data onto the 3-D terrain data. The modifications consisted of monitoring a network of sensors; retrieving the positions, status, and data associated with each sensor; and then displaying that information in real time on a 3-D map. We are calling the result a 3-D Sensor Common Operating Picture (3-D Sensor COP). To test the 3-D Sensor COP, we took advantage of a sensor network that had been deployed for the Enterprise Challenge 2016 at Fort Huachuca in Sierra Vista, Arizona. The sensor network consisted of approximately 30 US and Canadian sensors of various types (proximity, acoustic, visible/IR cameras), distributed on the ground across a test range, and an airborne sensor that transmitted the positions of moving objects on the test range down to a ground station. 15. SUBJECT TERMS
3-D terrain, Light Detection and Ranging, LiDAR, photogrammetry, stereoscopic visualization, augmented reality
16. SECURITY CLASSIFICATION OF: 17. LIMITATION OF ABSTRACT
UU
18. NUMBER OF PAGES
20
19a. NAME OF RESPONSIBLE PERSON
Damon Conover a. REPORT
Unclassified b. ABSTRACT
Unclassified c. THIS PAGE
Unclassified 19b. TELEPHONE NUMBER (Include area code)
(301) 394-0240 Standard Form 298 (Rev. 8/98) Prescribed by ANSI Std. Z39.18

Approved for public release; distribution is unlimited. iii
Contents
List of Figures iv
1. Introduction 1
2. The 3-D Sensor COP 2
3. Virtual Sensor Placement 7
4. Conclusions 10
5. References 11
List of Symbols, Abbreviations, and Acronyms 12
Distribution List 13

Approved for public release; distribution is unlimited. iv
List of Figures
Fig. 1 Overhead view from the 3-D Sensor COP showing sensor locations ...3
Fig. 2 Overhead view from the 3-D Sensor COP showing sensor locations and observations.....................................................................................4
Fig. 3 Observation from an acoustic sensor showing the lines of bearing of the detections .........................................................................................5
Fig. 4 Observation from an imaging sensor .....................................................6
Fig. 5 Moving objects identified by the IRMD aircraft ...................................7
Fig. 6 NASA’s Jet Propulsion Laboratory demonstrating the use of the HoloLens to visualize the surface of Mars (NASA 2015) .....................8
Fig. 7 Two images from a virtual tour of Rome, captured by the onboard HoloLens camera, while running the Microsoft HoloTour app .............9

Approved for public release; distribution is unlimited. 1
1. Introduction
Fusion3D is a software application for stereoscopic visualization of 3-D terrain data. It was developed in the Image Processing Branch at the US Army Research Laboratory by Dr John F Dammann, Jr. It uses a 3-D display, 3-D glasses, and a 3-D mouse to quickly view province-sized 3-D maps in stereo. Its robustness and flexibility allow it to ingest large 3-D data sets from a variety of sources, and it incorporates many useful features to aid a user in the exploitation of 3-D terrain data. Many of those features were intended to provide users with improved situational awareness and aid in mission planning; however, recently, in an attempt to further improve situational awareness, Fusion3D was modified to support overlaid real-time data onto the 3-D terrain data. The modifications consisted of monitoring a network of sensors; retrieving the positions, status, and data associated with each sensor; and then displaying that information in real time on a 3-D map. We are calling the result a 3-D Sensor Common Operating Picture (3-D Sensor COP). To test the 3-D Sensor COP, we took advantage of a sensor network that had been deployed for the Enterprise Challenge 2016 (EC16) at Fort Huachuca in Sierra Vista, Arizona. The sensor network consisted of approximately 30 US and Canadian sensors of various types (proximity, acoustic, visible/IR cameras), distributed on the ground across a test range, and an airborne sensor that transmitted the positions of moving objects on the test range down to a ground station. Using the data from the sensor network, we were able to demonstrate the advantage, from the point of view of the user, of seeing real-time data integrated with the 3-D terrain data.
Fusion3D contains novel features not provided in comparable software applications for visualizing 3-D terrain data. The first novel feature is stereoscopic viewing of 3-D data. Other tools display 3-D data on a 2-D screen, thus limiting the benefit of the 3-D data. Fusion3D uses a 3-D display and 3-D glasses to view the data in stereo. This allows users to experience 3-D data in a more realistic way and provides them with an improved understanding of the terrain. The next novel feature is that it displays the orthophoto data in full resolution. The orthophoto data are applied as a texture over the 3-D data that are provided by LiDAR. The typical pixel size of LiDAR-derived Digital Elevation Model (DEM) data is 1 m; however, the pixel sizes of the corresponding orthophoto data can be much smaller (for example, BuckEye orthophoto data have 10- to 20-cm pixels). Many other software applications downsample the orthophoto data to some degree, thereby reducing the spatial content of the orthophoto data. The result of this is that small objects disappear and the displayed 3-D terrain looks less realistic. Fusion3D retains the full-resolution imagery by applying 2-D tiles of orthophoto pixels at the elevations

Approved for public release; distribution is unlimited. 2
and angles indicated by the LiDAR DEM data, thus providing a more realistic view of the scene and more useful information to the user. Fusion3D also has a patented method for applying the texture where locally smooth regions are joined with adjacent regions in a technique called draping (this is what other applications use) and regions identified as rough are left disconnected from their neighbors (Dammann 2012). This novel texturing method gives natural features, such as bushes and trees, a more realistic appearance.
Fusion3D is capable of visualizing data from a variety of sensors and 3-D reconstruction approaches. For example, Fusion3D has been optimized for reading and displaying DEMs derived from LiDAR and othophotos co-collected by the BuckEye program; however, it is also capable of using other LiDAR data, such as that from the High Altitude LiDAR Operations Experiment (HALOE) and Airborne Laser Detection and Radar Imaging Research Testbed (ALIRT) programs. Fusion3D can visualize either the raw LiDAR point clouds (in .las format) or the DEMs that have been computed from the point clouds. Additionally, Fusion3D can also display 3-D data created using photogrammetry software. Photogrammetry is the 3-D reconstruction of an area from images, using a structure-from-motion algorithm, and is used to reconstruct the geometry of a static scene, given a moving camera perspective (Spicer 2016). Again, the display of the 3-D data can be done using photogrammetry-derived point clouds or by generating DEMs from those point clouds.
Fusion3D contains a variety of useful features that can assist users in doing their jobs. For example, missions can be planned by overlaying potential routes on the terrain along with the labels of significant landmarks. A fly-through can then be performed, where the point of view is moved to the start of the planned route and then the route is followed. This gives those viewing the fly-through some idea of the appearance of the terrain, as well as the relative positions of the landmarks, prior to departing on the mission. Measurements can be made of distances or elevation differences between points, as well as distances along a route. Additionally, a line-of-sight tool can be used to shade areas that are visible from a selected point on the map. These features allow different routes to be compared according to factors such as total distance, change in elevation, proximity to an enemy position, or the vulnerability of the route.
2. The 3-D Sensor COP
The objective of the 3-D Sensor COP is to provide an interactive operator interface for visualizing real-time sensor data overlaid on a 3-D terrain map for enhanced situational awareness. Fusion3D has, therefore, been modified to incorporate

Approved for public release; distribution is unlimited. 3
additional features so that it can be used as a real-time COP. Those modifications include the ability to 1) read sensor data that have been collected and stored on a private network, 2) show sensors at the correct positions on the map, and 3) show the status of the sensors and the sensor data that have been collected.
At EC16, Fusion3D’s ability to perform as a real-time COP was demonstrated. The 3-D terrain map that was used for the exercise was a BuckEye map collected in September 2015. Fusion3D was able to read sensor data stored as extensible markup language (XML) files on a shared folder on the roll on, roll off (Ro-Ro) platform via a private local area network and then show the positions of sensors that had been deployed in the field, as shown in Fig. 1.
Fig. 1 Overhead view from the 3-D Sensor COP showing sensor locations
A user was then able to interact with the data by clicking on a sensor icon, and information about that sensor was displayed. Any data that are included in the XML file for each sensor can potentially be displayed, if desired. When sensors are triggered, the corresponding sensor data are shown on the 3-D map. The sensor types currently supported are proximity detectors, acoustic sensors showing the line

Approved for public release; distribution is unlimited. 4
of bearing of a detection, and imaging sensors. When a sensor is triggered, its icon changes from a small green circle to a large red circle, as shown in Fig. 2. As time passes, that red circle gradually decreases in size until a time threshold is passed and the icon becomes green again. By looking at the sizes of the red circles, a user is able to see the sequence in which the sensors were triggered. This gives the user an idea of the direction of travel for the object being tracked.
Fig. 2 Overhead view from the 3-D Sensor COP showing sensor locations and observations
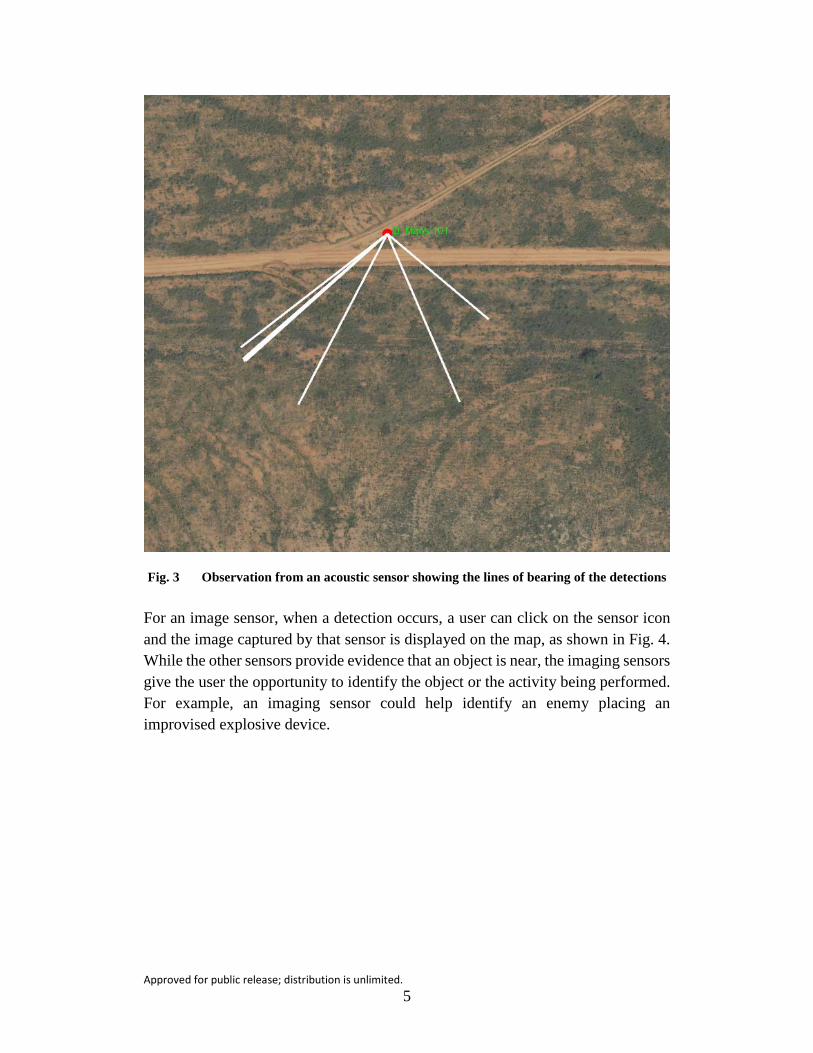
Proximity detections are shown as solid red circles that gradually decrease in size. If a new detection does not occur, they will eventually turn green again, indicating that they have been reset back to a listening state. If the sensor data include a line of bearing, that bearing is a shown on the map as a line pointing from the sensor position toward the location of the object that caused the detection, as shown in Fig. 3. These directional sensors are acoustic, so lines point in the direction of loud noises, such as passing vehicles or explosions.
Approved for public release; distribution is unlimited. 5
Fig. 3 Observation from an acoustic sensor showing the lines of bearing of the detections
For an image sensor, when a detection occurs, a user can click on the sensor icon and the image captured by that sensor is displayed on the map, as shown in Fig. 4. While the other sensors provide evidence that an object is near, the imaging sensors give the user the opportunity to identify the object or the activity being performed. For example, an imaging sensor could help identify an enemy placing an improvised explosive device.

Approved for public release; distribution is unlimited. 6
Fig. 4 Observation from an imaging sensor
Additionally, Fusion3D was modified to read STANAG-4607 (2010)-compliant tracks transmitted down from the IR motion detection (IRMD) aircraft and place icons indicating moving objects on the 3-D map. Fig. 5 shows blue icons for detected moving objects. The moving object icons will gradually decrease in size and eventually disappear after a time threshold is exceeded. The icons along the road seem reasonable, while those off the road may be false detections. With some improvements to the IRMD moving target detection algorithm, a user would be able to see icons, indicating detected moving objects, appear in areas where ground sensors were not placed.

Approved for public release; distribution is unlimited. 7
Fig. 5 Moving objects identified by the IRMD aircraft
3. Virtual Sensor Placement
A primary focus of Fusion3D is its ability to visualize 3-D terrain, and one area where that ability is useful in the 3-D Sensor COP is in the simulation of sensor placements. Using a 3-D map, a user can zoom in on a potential sensor location and get an idea of what the sensor would “see”. This would allow the user to determine if the sensor location meets the desired requirements prior to undertaking the mission to deploy it. For example, the field of view of an imaging sensor can be checked prior to placement to make sure that the desired area for surveillance is visible and free of obstructions. This functionality makes it easier to plan sensor networks by verifying that the desired coverage is achieved with as few sensors as possible and reducing the number of times sensors have to be moved after placement. Together, this reduces the risk to users who are placing the sensor by minimizing the amount of time they need to be in the field.

Approved for public release; distribution is unlimited. 8
Going forward, new technologies can be used to further improve virtual sensor placement. For example, using either LiDAR or photogrammetry data, collected at or near ground-level, a 3-D model of the potential sensor location can be created. Additionally, a 3-D model of the sensor itself can be created. Using these 3-D models, along with emerging virtual and augmented reality tools, such as the Oculus Rift and the Microsoft HoloLens (Microsoft 2016), a user can virtually enter the potential sensor location and place a virtual copy of the sensor. Fig. 6 shows an example from the National Aeronautics and Space Administration (NASA) Jet Propulsion Laboratory where the HoloLens was used to visualize the surface of Mars (NASA 2015).
Fig. 6 NASA’s Jet Propulsion Laboratory demonstrating the use of the HoloLens to visualize the surface of Mars (NASA 2015)
Another method for visualizing terrain and virtually placing a sensor is using data collected from a multi-camera rig, such as the GoPro Odyssey (GoPro 2016), which contains 16 synchronized HERO4 Black cameras. Rigs such as this can capture 360° imagery and video that can be visualized in either a YouTube360 video or the HoloLens. Figure 7 shows images, captured by the onboard HoloLens camera, of a HoloLens app, published by Microsoft, called HoloTour (Microsoft 2016), during a virtual tour of Rome. Similarly, this technique could be used to acquire and visualize high-resolution 360° imagery of sites of strategic importance to the Army. Three-dimensional models of sensors could then be virtually placed and evaluated in an accurate representation of the terrain.

Approved for public release; distribution is unlimited. 9
Fig. 7 Two images from a virtual tour of Rome, captured by the onboard HoloLens camera, while running the Microsoft HoloTour app

Approved for public release; distribution is unlimited. 10
4. Conclusions
The modified version of Fusion3D, developed for EC16 and called the 3-D Sensor COP, allows a user to visualize sensor data collected by the US military and its partners, while at the same time visualizing the terrain in which the sensors have been placed. For example, while users are monitoring a large area, they are able to see sensors being triggered in a local region, using detections from either ground-based or aerial sensors. They can then follow those detections and click on the sensor icons to get more information. The 3-D Sensor COP provides a way for users to keep track of a large number of sensors that have been placed over a large area. Additionally, it is a useful tool for planning where to place sensors, because it makes it possible to see the terrain from multiple locations and orientations prior to selecting the optimal location and orientation for a given sensor.

Approved for public release; distribution is unlimited. 11
5. References
Dammann JF, inventor; The United States of America as represented by the Secretary of the Army, assignee. Three-dimensional imaging method and apparatus. United States patent US 8,249,346. 2012 Aug 21.
HoloTour. Redmond (WA): Microsoft; 2016 [accessed 2016 Oct 19]. https://www.microsoft.com/microsoft-hololens/en-us/apps/HoloTour.
Microsoft HoloLens. Redmond (WA): Microsoft; 2016 [accessed 2016 Oct 19]. https://www.microsoft.com/microsoft-hololens/en-us.
Odyssey. San Mateo (CA): GoPro; 2016 [accessed 2016 Oct 19]. https://gopro.com/odyssey.
Spicer R, McAlinden R, Conover D. Producing usable simulation terrain data from UAS-collected Imagery. Interservice/Industry Training, Simulation, and Education Conference (I/ITSEC); 2016 (accepted).
STANAG-4607. NATO ground moving target indicator format (GMTI) format. New York (NY): North Atlantic Treaty Organization; 2010 Sep 14.
Walking on Mars w/ HoloLens. Pasadena (CA): NASA Jet Propulsion Laboratory; 2015 Jan 28 [accessed 2016]. https://www.youtube.com/watch?v=DXT-ynvI3Lg.

Approved for public release; distribution is unlimited. 12
List of Symbols, Abbreviations, and Acronyms
2-D 2-dimensional
3-D 3-dimensional
ALIRT Airborne LaDAR Imaging Research Testbed
COP common operating picture
DEM Digital Elevation Model
EC16 Enterprise Challenge 2016
IR infrared
HALOE High Altitude LiDAR Operations Experiment
IRMD infrared motion detection
LaDAR Laser Detection and Ranging
LiDAR Light Detection and Ranging
Ro-Ro roll-on roll-off
XML extensible markup language

Approved for public release; distribution is unlimited. 13
1 DEFENSE TECHNICAL (PDF) INFORMATION CTR DTIC OCA 2 DIRECTOR (PDF) US ARMY RESEARCH LAB RDRL CIO L IMAL HRA MAIL & RECORDS MGMT 1 GOVT PRINTG OFC (PDF) A MALHOTRA 14 DIR USARL (PDF) RDRL HRS D J RUBINSTEIN RDRL SE K KAPPRA RDRL SES A LADAS RDRL SES E R RAO A CHAN H KWON S YOUNG D ROSARIO S HU M THIELKE P RAUSS C BOREL-DONOHUE D CONOVER C REALE

Approved for public release; distribution is unlimited. 14
INTENTIONALLY LEFT BLANK.