Embed Size (px)
Citation preview
THREE-DIMENSIONAL FINITE-DIFFERENCE TIME-DOMAIN SIMULATION
OF COAXIAL TRANSMISSION LINE FOR BROADBAND DIELECTRIC
CHARACTERIZATION
SARIMAH BINTI NOOR AHMAD
UNIVERSITI TEKNOLOGI MALAYSIA

THREE-DIMENSIONAL FINITE-DIFFERENCE TIME-DOMAIN SIMULATION
ON COAXIAL TRANSMISSION LINE FOR BROADBAND DIELECTRIC
CHARACTERIZATION
SARIMAH BINTI NOOR AHMAD
A thesis submitted in fulfillment of the
requirements for the award of the degree of
Master of Science (Physics)
Faculty of Science
Universiti Teknologi Malaysia
AUGUST 2014

iii
To my beloved parents,
Father, Noor Ahmad Bin Sakiban
Mother, Mestijah Binti Md Said
Thanks for all the sacrifies and love…
Dedicated to all my friends,
Izzati, Diana, Farhah, Asmahani, lab mates of computer instrumentation, and my
husband Muhd Dinie
For the support given will not forgotten
Thank you for supporting me

iv
ACKNOWLEDGEMENT
Bismillahirrahmanirrahim, Alhamdulillah.
Thanks to God the almighty for grace and mercy for His guidance and giving
me the strength to complete this project.
Special appreciation goes to my supervisor, Dr. Amiruddin Bin Shaari for his
supervision, advice and guidance from the early stage of this project as well as
giving me extraordinary experiences throughout the work. Sincere thanks to all my
friends and everyone that helped me throughout the dissertation, for their kindness,
and moral support during my study.
My deepest and special appreciation to my beloved family, my parents, Noor
Ahmad Bin Sakiban and Mestijah Binti Md Said for their support, endless love,
prayers, and encouragement from the beginning until the end of this project.
Finally, my further appreciation dedicated to the Ministry of High Education
for providing part of the financial support through GUP funding vot 03J69. To those
who indirectly contribute in this project, your kindness means a lot to me. May God
reward their services and sacrifies. God willings.
Sarimah, UTM Skudai

v
ABSTRACT
In this work, a part of a coaxial transmission line is used as a sample holder
where the propagation of electromagnetic waves in the range of 500 MHz is studied
using three-dimensional (3D) finite-difference time domain (FDTD) method. This
study presents the results from the numerical simulations of electromagnetic waves in a
mixture of dielectric materials. The effective relative permittivity of the mixture is
calculated by recording one of the electric field components (Ey) of the transmitted and
reflected electromagnetic pulses in the transmission line. The complex frequency
spectra of these time-domain signals are then obtained by taking the Fourier transforms
of the respective signals. These spectra are then used to calculate the complex
transmission and reflection coefficients for the sample. The analysis of raw data is
performed using open source package, GNU Octave. Finally a numerical procedure is
developed to convert the raw data into an effective dielectric property of the mixture of
materials. The influence of water contents on dielectric properties is studied using
samples made from different mixtures of soil, water, and air. The results show that the
effective dielectric permittivities of the mixtures are highly dependent on the soil’s
moisture content. Strong frequency dependence in the dielectric properties is observed
especially at the low end of frequency range which can be attributed to the presence of
the DC conductivity of water (5 𝜇S/m) in the mixture. In general the results are
consistent with those calculated using Maxwell-Garnett mixing formula especially at
the high end of the frequency range.

vi
ABSTRAK
Dalam kajian ini, sebahagian daripada talian penghantaran sepaksi digunakan
sebagai pemegang sampel di mana perambatan gelombang elektromagnet dalam julat
500 MHz dikaji dengan menggunakan kaedah perbezaan terhingga domain masa
(FDTD) tiga dimensi (3D). Kajian ini membentangkan hasil simulasi berangka daripada
gelombang elektromagnet dalam campuran bahan dielektrik. Ketelusan relatif berkesan
campuran dihitung dengan merekodkan salah satu komponen medan elektrik (Ey) dalam
denyut elektromagnet yang dipancar dan dipantulkan dalam talian penghantaran.
Spektrum frekuensi kompleks bagi isyarat domain masa ini diperoleh dengan
menggunakan transformasi Fourier signal berkaitan. Spektrum ini kemudiannya
digunakan untuk menghitung pekali pantulan dan penghantaran kompleks bagi sampel.
Semua analisis data asal ini dilakukan dengan menggunakan pakej sumber terbuka,
GNU Octave. Kemudian, suatu prosedur berangka dibangunkan untuk menukar data
asal kepada sifat dielektrik berkesan campuran bahan. Pengaruh kandungan air pada
sifat dielektrik dikaji menggunakan sampel yang diperbuat daripada campuran tanah,
air, dan udara yang berbeza. Keputusan menunjukkan bahawa ketelusan dielektrik
berkeasan bagi campuran adalah amat bergantung kepada kandungan kelembapan
tanah. Pergantungan kuat terhadap frekuensi dalam sifat dielektrik dapat diperhatikan
terutamanya di hujung julat frekuensi rendah yang boleh dikaitkan dengan kehadiran
kekonduksian DC air (5 𝜇S/m) dalam campuran. Secara umumnya, keputusan adalah
konsisten dengan hasil yang dihitung menggunakan formula percampuran Maxwell-
Garnett terutamanya di hujung julat frekuensi tinggi.

vii
TABLE OF CONTENTS
CHAPTER TITLE PAGE
DECLARATION ii
DEDICATION iii
ACKNOWLEDGEMENT iv
ABSTRACT v
ABSTRAK vi
TABLE OF CONTENTS vii
LIST OF TABLES xi
LIST OF FIGURES xii
LIST OF SYMBOLS xvi
LIST OF ABBREVIATIONS xix
LIST OF APPENDICES xx
1 INTRODUCTION
1.1 Background of Study 1
1.1.1 Effective Permittivity of Dielectric Mixtures 2
1.1.2 Transmission Line Method 3
1.2 Problem Statement 4
1.3 Objective of Research 4
1.4 Scope of Study 5
viii
1.5 Significance of Study 5
2 THEORY
2.1 Electromagnetic Theory 6
2.2 Coaxial and Shielding of Transmission Lines 8
2.3 Principle of The Transmission Line Method 11
2.4 Scattering Matrices S-Parameters 14
2.5 Plane Wave Reflection and Transmission at an
Interface
16
2.6 Material Properties 18
2.6.1 Material Classifications 19
2.6.2 Intrinsic Impedance and Propagation
Coefficient
20
2.7 Dielectrics, Permittivity, and The Electric Field in a
Dielectric
20
2.7.1 Dielectric Properties of Inhomogeneous
Media
21
2.7.2 Dielectric Properties Measuring Technique 22
2.8 Transmission and Reflection Line Measurements
Method
24
2.9 Dielectric Mixtures 25
2.9.1 Three- Dimensional Mixing Models 27
2.9.2 Theoretical Bounds for The Effective
Permittivity
28
2.9.3 Principle of Numerical Mixture Calculations 28
2.9.4 Maxwell-Garnett Formula for Multiphase
Composites
30
2.10 FDTD Simulation 32
2.10.1 Time Domain Measurements 33
2.10.2 Stability Requirements and Boundary
Conditions
34
ix
3 METHODOLOGY
3.1 EastFDTD 36
3.2 Modelling Steps 37
3.2.1 Modelling In Windows 37
3.3 Simulation Steps 38
3.3.1 Step 1: Establish The Project and Set Project
Properties
38
3.3.2 General Parameters 39
3.3.3 Boundary Parameters 40
3.3.4 Calculation Domain and Mesh Grid Setting 42
3.3.5 Calculation Model 44
3.4 Step 2: Establish Simulation Model 45
3.5 Step 3: Create Source 47
3.6 Step 4: Create Records and Data PostProcessing 48
3.6.1 Point 48
3.7 Source (Natural Parameter in The Domain) 49
3.7.1 Gaussian Pulse 49
3.7.2 Spatial Character Parameter 50
3.7.2.1 3D Gaussian Beam 50
3.8 Utilities 52
3.8.1 Calculation In LINUX 52
3.8.2 Visualization Tools 53
3.8.3 Calculating The Transmission and
Reflectance Spectra
53
3.9 Transmission Line Measurements 55
3.9.1 Transmission Line Modeling 55
3.10 Measuring S-parameters From FDTD Simulation 60

x
3.10.1 Effective Material Properties 61
3.11 Three - Dimensional Mixing Models 62
3.11.1 Simulation Setup 62
3.12 Random Mixtures 63
3.12.1 Local Permittivity Near Material Interfaces 64
4 RESULTS
4.1 Properties of TEM Waves in Coaxial Transmission
Line
66
4.1.1 TEM Waves Along z-axis on The
Transmission Line
67
4.1.2 TEM Waves around of The Transmission
Line
69
4.1.2.1 Three Points Check TEM Waves at
Four Difference Axis (X and Y)
69
4.2 Air–Filled Transmission Line 70
4.3 Material-Filled Transmission Line 71
4.4 Calculations of Transmission and Reflection
Coefficient
72
4.5 Random Mixtures 77
4.5.1 Mixture without Clustering (Dilute Mixture) 77
4.5.2 Three Phase Mixture 78
4.6 Soil and Sand Mixture Models 79
4.7 Wet Granular Materials 83
5 CONCLUSIONS AND RECOMMENDATIONS
5.1 Conclusions 90
5.2 Recommendations 92
REFERENCES 94
Appendices A - F 99 - 112

xix
LIST OF ABBREVIATIONS
ABC - Absorbing Boundary Conditions
3D - Three dimensional
FDTD - Finite Difference Time Domain
PML - Perfectly match layer
UPML - Unixial anisotropic perfectly match layer
PEC - (Ideal electric conductor)
PMC - (Ideal magnetic conductor)
ta - Polarization in the next direction of the axis of the light incident
axis
tb - Polarization in the more next direction of the axis of the light
incident axis
ra - Reflection in the next direction of the axis of the light incident
axis
rb - Reflection in the more next direction of the axis of the light
incident axis
TEM - Transverse electromagnetic

xx
LIST OF APPENDICES
APPENDIX TITLE PAGE
A INSTALLATIONS 99
B INPUT SOURCE 101
C RAW DATA OUTPUT 102
D GNU OCTAVE SCRIPT 103
E CALCULATIONS (DIELECTRIC PERMITTIVITY
AND CONDUCTIVITY)
108
F MATERIAL-FILLED RESULTS 112

xii
LIST OF FIGURES
FIGURE NO. TITLE PAGE
2.1 Cross section of coaxial cable 8
2.2 Coaxial line (shielded) 9
2.3 E and H field in a coaxial transmission line 13
2.4 Signal Flows in a Two-Port Network 15
2.5 Plane wave reflection and transmission in a medium
interface
18
3.1 Linux server IP setting dialog box 37
3.2 EastFDTD modeling interface 37
3.3 Create project document 38
3.4 Global preferences setting 40
3.5 Specific parameter setting 41
3.6 Computational domain and time setting 43
3.7 Calculation modes 44
3.8 Symbol setting 45
3.9 Material parameter setting 46
3.10 Structure parameter setting 46
3.11 Gauss source parameter setting 47
3.12 Point record setting 48
3.13 The time domain parameter meaning of Gaussian pulse. 50
3.14 Parameter setting of Gaussian pulse 51
3.15 The field distribution schematic diagram of the field of each
component of the electric field at the cross section of beam-
waist of 3D Gaussian beam.
52
3.16 The styles of data files 54
3.17 Dimensions of coaxial transmission line sample holder 56

xiii
3.18 Three different readings at the X-axis (620 mm, 500 mm,
and 580 mm) to calibrate the simulation process on the
coaxial transmission line holder. Five difference points to
record each fields along the transmission lines at z-axis
where Point 1 (290 mm), Point 2 (445 mm), Point 3 (600
mm), Point 4 (755mm), and Point 5 (910 mm)
57
3.19(a) Four different points along the circular Z-axis to calibrate
the simulation process on the coaxial transmission line
holder. Four difference points (Point A, B, C and D) to
record each fields around the center of cylinder model (600
mm along z-axis)
57
3.19(b) Three different points along the Z-axis to calibrate the
simulation process on the coaxial transmission line holder
(Point A at 350 mm along z-axis, Point B at 600 mm along
z-axis and Point C at 850 mm along z-axis.
58
3.20 Empty specimen coaxial transmission line holder 58
3.21 Coaxial transmission line holders with presence of material 59
3.22 Dielectric conformal approximations for a small gap 65
4.1 The signal at Point 3 at 600 mm along z-axis for reading 1 67
4.2 The signal from five different points on all three readings
(P=Point record)
68
4.3 The signal at Point B along the z-axis (-X, +X, -Y, and +Y
axis) to record each fields around the center of cylinder
model (600 mm along z-axis)
69
4.4 The signal at Point A (350 mm), Point B (600 mm) and
Point C (850 mm) along z-axis
70
4.5 Transmission and reflection signals on the air-filled
transmission line
71
4.6 Transmission and reflection signals on the material-filled
transmission line
72
4.7 Spectra of reflected signals for the air filled and material 74

xiv
filled transmission lines
4.8 Spectra of transmitted signals for the air filled and material
filled transmission lines
74
4.9 Magnitude of the transmission and reflection coefficients
versus frequency
75
4.10 Phases of the transmission and reflection coefficients versus
frequency
75
4.11 Real (red line) and imaginary (green line) part of the
relative dielectric permittivity calculated from the FDTD
simulations
76
4.12 DC conductivity calculated from the FDTD simulations 76
4.13 The effective relative permittivity of dilute mixtures from
FDTD simulation compared to those mixture formulas at
500 MHz
77
4.14 The effective relative permittivity of three mixtures (air-
solid-water) from FDTD simulation compared to those
mixture formulas at 500 MHz
78
4.15 Frequency dependency of effective relative permittivity of
sandy loam at soil volumetric wetness of 4.3%
79
4.16 Frequency dependency of effective relative permittivity of
sandy loam at soil volumetric wetness of 24.3%
80
4.17 Frequency dependency of the effective relative permittivity
of soils calculated from FDTD simulations
81
4.18 Effective relative complex permittivity on volumetric
wetness at frequency 100 MHz and 400 MHz
82
4.19 Effective relative complex permittivity of sand
dependencies on volumetric wetness at a frequency of 100
MHz and 400 MHz
82
4.20(a) Measured relative permittivity vs. volumetric moisture
content of pure sand from FDTD simulation compared to
Maxwell-Garnett formula at 400 MHz frequency
84

xv
4.20(b) Measured relative permittivity vs. volumetric moisture
content of pure sand from FDTD simulation compared to
Maxwell-Garnett formula at 100 MHz frequency
84
4.21(a) Measured relative permittivity vs. volumetric moisture
content of sand + 10% clay from FDTD simulation
compared to Maxwell-Garnett formula at 400 MHz
frequency
85
4.21(b) Measured relative permittivity vs. volumetric moisture
content of sand + 10% clay from FDTD simulation
compared to Maxwell-Garnett formula at 100 MHz
frequency
85
4.22(a) Measured relative permittivity vs. volumetric moisture
content of sand + 20% clay FDTD simulation compared to
Maxwell-Garnett formula at 400 MHz frequency
86
4.22(b) Measured relative permittivity vs. volumetric moisture
content of sand + 20% clay FDTD simulation compared to
Maxwell-Garnett formula at 100 MHz frequency
86
4.23(a) Conductivity vs. volumetric moisture content of pure sand
from FDTD simulation compared to Maxwell-Garnett
formula at 400 MHz frequency
87
4.23(b) Conductivity vs. volumetric moisture content of sand + 10%
clay from FDTD simulation compared to Maxwell-Garnett
formula at 400 MHz frequency
88
4.23(c) Conductivity vs. volumetric moisture content of sand + 20%
clay from FDTD simulation compared to Maxwell-Garnett
formula at 400 MHz frequency
88

xvi
LIST OF SYMBOLS
α - Polarizability
β - Fitting parameter for constant phase element
ɛ - Dielectric permittivity or dielectric constant
ɛr - Complex dielectric permittivity
ɛeff - Effective dielectric permittivity
σ - Conductivity
μ - Relative permeability
μr - Complex relative permeability
μeff - Effective relative permeability
n - Refractive index
neff - Effective refractive index
λ - Wavelength
λn - Wavelength in the medium
δ - Loss angle
c - Speed of light in vacuum or air (300mm/ns)
v - Phase velocity

xvii
π - Radian
θ - Phase angle
t - Time
k - Phase constant or wave number
f - Frequency
fc - Centre frequency
fco - Cut – off frequency
fmax, fm - Maximum frequency
fmin - Minimum frequency
Γ - Reflection coefficient
Δ - Delta or interval
Δt - Time interval
ω - Angular frequency
rin - Inner radius
rout - Outer radius
Nt - Fitting parameter for constant phase element
B - Magnetic induction vector
D - Electric displacement vector
E - Electric field
Ei - Incident electric field
Er - Reflected electric field

xviii
Et - Transmitted electric field
H - Magnetic field
J - Current density vector
L - Length of transmission line
S - Pointing vector
S11 - Reflection coefficient
S21 - Transmission coefficient
│S11│ , │S21│- Magnitude of the S-parameters (Complex S-parameters)
T - Transmission coefficient
Z - Impedance
z - Effective impedance

xi
LIST OF TABLES
TABLE NO. TITLE PAGE
2.1 Comparison Between The Measurement Methods 23
2.2 Polarization Factors For Ellipsoids 31
4.1 Composition For Soil Model 84
F.1 Attenuation and Relative Permittivity of Subsurface
Material Measured at 500 MHz
113
F.2 Dielectric Constant of Soil at Various Porosity Values 114

1
CHAPTER 1
INTRODUCTION
1.1 Background of Study
Accurate extraction of reflection coefficient, 𝛤 from finite-different time-domain
(FDTD) simulations is an important practical problem. The value of 𝛤 is used to obtain
the S-parameters of the analysed circuit. A common approach consists of matching the
outputs by means of high quality absorbing boundary conditions (ABC’s) which
permits to assume 𝑆11 to be equal to 𝛤 at the input. Recently, a more elaborate method
has been proposed by Sharkov in 1995, which multiple calculations of reflection
coefficient at different ports allow to obtain the S parameters with good accuracy, even
for relatively poor ABC’s. In either case, the main problem of Γ extraction resides in
separating the incident and reflected waves at the considered port. To solve this
problem, two basic approaches have been reported so far (Sharkov, 1995).
The first approach consists of running the simulation twice or concurrently on
two models, one run is for the analyzed circuit and the other for a nonreflecting
structure with the identical input. The second simulation provides a pure incident wave.
It can be reduced to the two-dimensional (2D) simulation of the cross section of the line
(V.J.Brankovic, 1995), but at the expense of repcating it independently for each relevant
frequency. Although good results in applying this approach have been reported, it is

2
clear advantage is the necessity of double simulation, which significantly increases the
employed computer resources and complicates the use of program.
The second approach (W.K. Gwarek, 1988) assumes that for reference, either
wave impedance or characteristic impedance of the line is a priori known (analytically
or heuristically). After application of correction factors due to the shifts between the E
and H fields in time and space, this method gives very good results for homogeneously
filled transverse electromagnetic (TEM) lines (J. Fang, 1995) which are when the wave
impedance does not change with frequency or waveguides when it changes according to
an analytically known rule. However, in application to inhomogeneous quasi-TEM
lines, even if the quasi-static wave impedance is known, significant errors appear due to
dispersive properties that are difficult to predict.
1.1.1 Effective Permittivity of Dielectric Mixtures
The study of the electromagnetic behavior and characterization of dielectric
mixtures is a classical problem which was already been addressed by Maxwell more
than a century ago. Nowadays, this initial interest has not decayed at all. On the
contrary, new artificial materials have renewed and drastically increased this attention
due to the design of new and even unknown applications non-existing in natural media.
The quasi-static initial works have been substituted or completed with high frequency
applications, such as perfect lens manufacturing, sub-wavelength microwave devices,
enhanced radiation by small antennas and others.
In addition, the availability of powerful computers has also modified the way in
which these and other related problems are addressed. In this sense, the first attempts to
model dielectric mixtures were concentrated on obtaining theoretical formulas to predict
the effective permittivity of composite materials consisting of mixtures with several
homogeneous components.

3
The Maxwell Garnett (MG) mixing rule yields;
𝜀𝑒𝑓𝑓 − 𝜀2
𝜀𝑒𝑓𝑓 + (𝑑 − 1)𝜀2= 𝑝1
𝜀1 − 𝜀2
𝜀1 + (𝑑 − 1)𝜀2 (1.1)
Another famous mixing rule is the Bruggeman formula (D.A.G Bruggeman, 1935);
𝑝1 𝜀1 − 𝜀𝑒𝑓𝑓
𝜀1 + 𝑑 − 𝑎 𝜀𝑒𝑓𝑓= 𝑝2
𝜀2 − 𝜀𝑒𝑓𝑓
𝜀2 + 𝑑 − 1 𝜀𝑒𝑓𝑓 (1.2)
In both equations, the dimensionally d equals 2 if the problem is two-dimensional or
equal to 3 in the case of considering a three-dimensional media. Besides the two simple
approximation described above, many other mixing models exists. Nevertheless, it can
be shown that in most case, it is impossible to completely determine the effective
permittivity by the volume fractions and effective permittivity of phases.
1.1.2 Transmission Line Method
The transmission line method (P.B. Johns, 1971) is used for the modeling of
composite mixtures. As it happens with the FDTD method, transmission line method is
a low frequency numerical method which has been extensively used for the modeling of
wave propagation problems, mainly electromagnetic nature but also for problems in
acoustic or particle diffusion. The method is not only a numerical model to solve certain
phenomenon, but also a conceptual approach which does not consider analytical
equations governing the phenomenon, but directly considers the original phenomenon
by means of equivalent transmission line. This conceptual nature of transmission line
method makes this method a powerful tool transmission which allows considering
challenging problems from a hybrid numerical-theoretical point of view in an elegant
and suitable way.
4
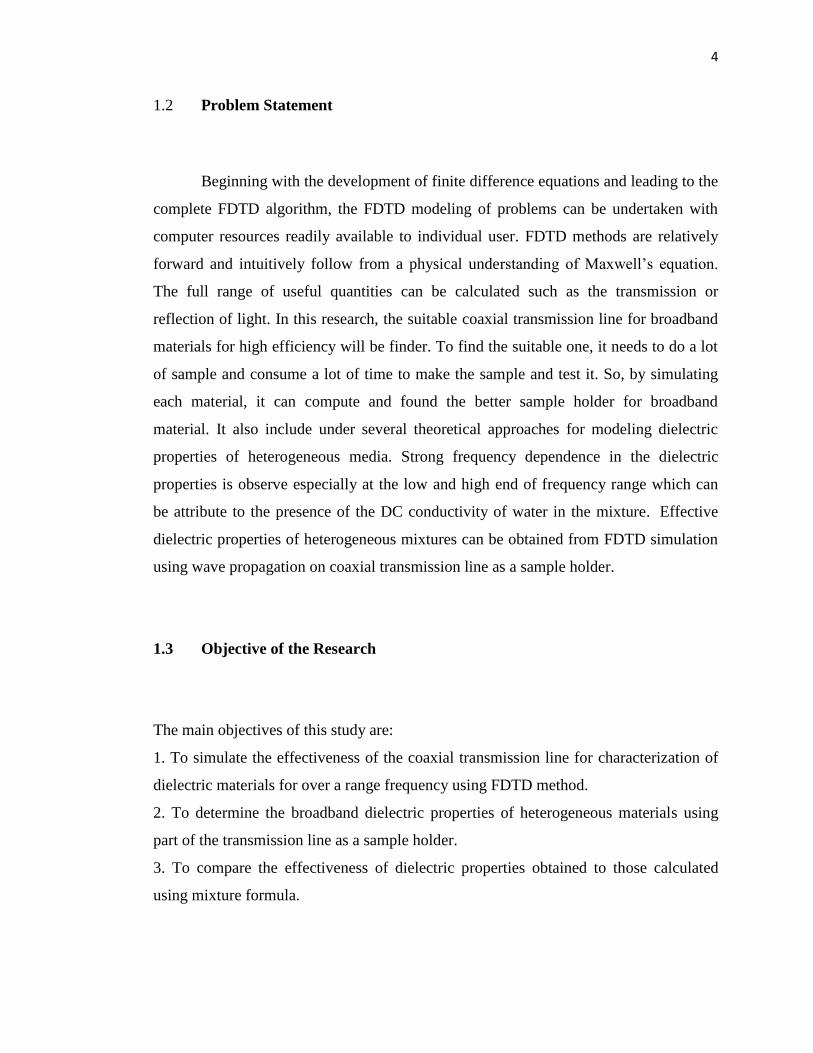
1.2 Problem Statement
Beginning with the development of finite difference equations and leading to the
complete FDTD algorithm, the FDTD modeling of problems can be undertaken with
computer resources readily available to individual user. FDTD methods are relatively
forward and intuitively follow from a physical understanding of Maxwell’s equation.
The full range of useful quantities can be calculated such as the transmission or
reflection of light. In this research, the suitable coaxial transmission line for broadband
materials for high efficiency will be finder. To find the suitable one, it needs to do a lot
of sample and consume a lot of time to make the sample and test it. So, by simulating
each material, it can compute and found the better sample holder for broadband
material. It also include under several theoretical approaches for modeling dielectric
properties of heterogeneous media. Strong frequency dependence in the dielectric
properties is observe especially at the low and high end of frequency range which can
be attribute to the presence of the DC conductivity of water in the mixture. Effective
dielectric properties of heterogeneous mixtures can be obtained from FDTD simulation
using wave propagation on coaxial transmission line as a sample holder.
1.3 Objective of the Research
The main objectives of this study are:
1. To simulate the effectiveness of the coaxial transmission line for characterization of
dielectric materials for over a range frequency using FDTD method.
2. To determine the broadband dielectric properties of heterogeneous materials using
part of the transmission line as a sample holder.
3. To compare the effectiveness of dielectric properties obtained to those calculated
using mixture formula.

5
1.3 Scope of Study
This research are studied using three-dimensional finite-difference time-domain
(3D FDTD) method comes with commercial package otherwise known as EastFDTD.
This research is using a transmission line model as a sample holder and uses the input
for range of frequencies 100-500 MHz. This research includes three mixtures using
sand, water, air, and soil models.
1.5 Significance of Study
FDTD methods are well suited for analysis of problems with complex
geometrical features as well as those containing arbitrarily inhomogeneous materials.
FDTD method actually can save more costs than the vector analyzer network (VNA)
and others method to get the propagation electromagnetic wave due to the different
frequencies. Also, the FDTD method does not require the derivation of a Green’s
function or the solution of matrix equation. FDTD methods have emerged as the
methods with arguably the broadest range of applicability. This is especially true for
electromagnetic problems involving complex and dispersive media, photonics
applications, and modeling of high speed circuits and devices.

94
REFERENCES
A. Taflove and S. Hagness (2005) Computational Electrodynamics : The Finite –
Difference Time – Domain Method. (3rd Ed.). Norwood: Artech House, Inc., MA.
A. Taflove (1998). Review of Formulation and Applications of the Finite Difference
Time Domain Method for Numerical Modelling of Electromagnetic Wave
Interactions with Arbitary Structures. Wave motion, Vol. 10. (pp. 574-582).
A. Taflove (1980). Application of the finite-difference time-domain method to
sinusoidal steady state electromagnetic penetration problems. IEEE Transactions on
Electromagnetic Compatibility 22 (3): 191–202.
A. Taflove and M. E. Brodwin (1975). Numerical solution of steady-state
electromagnetic scattering problems using the time-dependent Maxwell's
equations. IEEE Transactions on Microwave Theory and Techniques 23 (8): 623–
630.
A. Sihlova and I. Lindell (1992). “Polarizability modelling of heterogeneous media,” in
Dielectric Properties of Heterogeneous Materials, PIER 6 Progress in
Electromagnetics Research, A. Priou, Ed. New York:El-sevier. (pp. 101-151).
A. Sihlova (July, 1989). “Self consistency aspects of dielectric mixing theories,” IEEE
Trans. Geosci. Remote Sensing. Vol. 27. (pp. 403-415).
Blackband, WT (1986). Coaxial Transmission Lines and Components in the Handbook
of Antenna Design. Editors, Rudge, AW.et al. Peter Peregrinus. (pp. 1555).
D. Polder and J.H. van Santen. (1946). The effective permeability of mixtures of solids.
Physica. Vol. 12, no. 5. (pp. 257-271).

95
G. Liu, C. A. Grimes, and K. G. Ong (1999). A Method for FDTD Computation of
Field Values at Spherical Coordinate Singularity Points Applied To Antenna,” IEEE
Microwave and Opt. Tech. Lett. Vol. 20. (pp. 367-369).
H. Dib, T. Weller, M. Scardelletti, and M. Imparato (1999). Analysis of Cylindrical
Transmission Lines With the Finite Difference Time Domain Method. IEEE Trans.
Microwave Theory and Tech. Vol. 47. (pp. 509-512).
Hallikainen, M. T., F. T. Ulaby, M. C. Dobson, M. A. El-Rayers, and L. K. Wu (1985).
Microwave dielectric behavior of wet soil- Part I: Empirical models and
experimental observations. IEEE Transactions on Geoscience and Remote Sensing.
Vol. GE-23. (pp. 25-34).
J.C.M. Garnett (1904). Colors in metal glasses and metal films,” Trans. Roy. Soc. Vol.
53. (pp. 385-420).
J. P. Berenger (1994). A Perfectly Matched Layer for the Absorption of
Electromagnetic Waves. J. Comput. Phys. Vol. 114. (pp. 185-200).
J. G. Maloney and G. S. Smith. (1992). The Efficient Modeling of Thin Material Sheets
In The Finite Difference Time Domain (FDTD) Method. IEEE Trans. Ant. Prop.
Vol. 40, (pp. 323-330).
K. Yee (1966). Numerical solution of initial boundary value problems involving
Maxwell's equations in isotropic media. IEEE Transactions on Antennas and
Propagation 14 (3): 302–307.
Kearns, DM. and Beatty, RW (1967). Basic Theory of Waveguide Junctions and
Introductory Microwave Network analysis. Pergamon Press. (pp. 45-48).
L. Dou and A. R. Sebak (2006). 3D FDTD Method For Arbitary Anisotropic Materials.
IEEE Microwave Opt. Technol. Lett. Vol. 48, (pp. 2083-2090)
96
Matthews, SL. et al. (1998). Permittivity Measurements and Analytical Dielectric
Modelling of Plain Structural Concrete. Proc. Of the 7th
Inter. Conf. on Ground
Penetrating Radar (GPR ’98). University of Kansas. Vol.1.(pp. 363-368).
M. Kuzuoglu and R. Mittra (1996). Frequency Dependence of the Constitutive
Parameters of Causal Perfectly Matched Anisotropic Absorbers. IEEE Microwave
and Guided Wave Lett. Vol. 6. (pp. 447-449).
M. S. Bigelow, N. N. Lepeshkin, H. Shin, and R. W. Boyd (2006). Propagation of a
Smooth and Discontinous Pulses Through Materials With Very Large or Very Small
Group Velocities. J. Phys: Cond. Matt. Vol. 18. (pp. 3117-3126).
Njoku, E. G. and D. Entekhabi (1996). Passive microwave remote sensing of soil
moisture. Journal of Hydrology. Vol. 184. (pp. 101-129).
Nelson, S. O (2005). Density permittivity relationships for powdered and granular
materials. IEEE Transactions on Instrumentations and Measurement.
P. Grivet and P. W. Hawkes (1970). The Physics of Transmission Lines at High and
Very High Frequencies. Academic Press Inc. (London) LTD. Vol 1.
Perdok, U. D., B. Kroesbergen, and M. A. Hilhorst (1996). Influence of gravimetric
water content and bulk density on the dielectric properties of soil. Europian Journal
of Soil Science. Vol. 47, 367-371.
R. Joseph, S. Hagness, and A. Taflove (1991). Direct Time Integration of Maxwell’s
Equations In Linear Dispersive Media With Absorption For Scattering and
Propagation of Femtosecond Electromagnetic Pulses. Optics Lett. Vol. 16. (pp.
1412).
R. J. Elliott, J. A. Krumhansl, and P. L. Leath (July 1974). The theory and properties
randomly disordered crystals and related physical systems. Rev. Mod. Phys. Vol. 46.
(pp. 465-543).

97
R. L. Higdon (1987). Numerical Absorbing Boundary Conditions for the Wave
Equation. Math. Comp. Vol. 49. (pp. 65-90).
Ramo, S. et al. (1993). Fields and Waves in Communications Electronics. (3rd
Ed.) New
York: John Wiley & Sons.
R. Luebbers, F. Hunsberger, K. Kunz, R. Standler, and M. Schneider (1990). A
frequency-dependent finite-difference time-domain formulation for dispersive
materials. Electromagnetic Compatibility, IEEE Transactions on 32 (3): 222–227.
Sharkov, E. A (1995). Precision relaxation model of dielectric properties of fresh water
for remote sensing problems. Earth Observation and Remote Sensing. Vol. 6. (pp.
18-28).
Steinmetz, Charles Proteus (August 27, 1898), "The Natural Period of a Transmission
Line and the Frequency of lightning Discharge Therefrom", The Electrical World:
203–205.
Seshadari, S.R. (1971), Fundamentals of Transmission Lines and Electromagnetic
Fields. Addison-Wesley Publishing Company, Inc. Philipines.
Scott, W. R. and G. S. Smith. (1992). Measured electrical constitutive parameters of soil
as functions of frequency and moisture content. IEEE Transactions on Geoscience
and Remote Sensing. Vol. 30, No. 3, 621-623.
Schon, J. H., (1996). Physical Properties of Rocks, Handbook of Geophysical
Exploration. Pergamon, Oxford.
Sarranketo, T., (1998). Electrical properties of water in clay and silty soils. Journal of
Applied Geophysics, Vol. 40, 73-88.
Topp, G. C., J. L. Davis, and A. P. Annan (1980). Electromagnetic determination of soil
water content: Measurements in coaxial transmission lines. Water Resources
Research. Vol. 16, No. 3, 574-582.

98
Tikhonov, V. V., (1996). Electrodynamic Models of Natural Dispersed Media in a
Microwave Range, The Moscow State Pedagogical University, Moscow. Russian.
Trabelsi, S., A. Krazewski, and S. O. Nelson (1998). New density independent
calibration function for microwave sensing of moisture content in particulate
materials. IEEE Transactions on Instrumentation and Measurement. Vol. 47. (pp.
613-622).
Umran S.Inan and Robert A.Marshall (2011). Numerical Electromagnetics: The FDTD
Method. Cambridge University Press, New York.
Wenhua Yu., Xiaoling Yang., Yongjun Liu and Raj Mittra (2009). Electromagnetic
Simulation Techniques Based on the FDTD Method. A John Wiley & Sons, Inc.,
Publications, New York.
W. C. Chew and W. H. Weedon (1994). A 3D Perfectly Matched Medium From
Modified Maxwell’s Equations With Stretched Coordinates. Microwave Opt.
Technol. Lett. Vol. 7. (pp. 599-604).
Wensink, WA (1993). Dielectric Properties of Wet Soils in the Frequency Range 1-
3000MHz. Geophysical Prospecting. Vol. 41. (pp. 671-696).
Y. Chen, R. Mittra, and P. Harms (1996). Finite Difference Time Domain Algorithm
For Solving Maxwell’s Equations In Rotationally Symmetric Geometries. IEEE
Trans. Microwave Theory and Tech. Vol. 44. (pp. 832-839).