Embed Size (px)
Citation preview
Journal of Biomedical Optics 5(2), 237–247 (April 2000)
Downloade
Three-dimensional diffuse optical mammographywith ultrasound localization in a human subject
M. J. HolbokeUniversity of PennsylvaniaDepartment of Physics and AstronomyPhiladelphia, Pennsylvania 19104
B. J. TrombergUniversity of California IrvineBeckman Laser InstituteIrvine, California 92612
X. LiMassachusetts Institute of TechnologyDepartment of Electrical EngineeringBoston, Massachusetts
N. ShahJ. FishkinUniversity of California IrvineBeckman Laser InstituteIrvine, California 92612
D. KidneyUniversity of California Irvine Medical CenterDepartment of RadiologyIrvine, California 92612
J. ButlerUniversity of California Irvine Medical CenterDepartment of SurgeryIrvine, California 92612
B. ChanceUniversity of PennsylvaniaDepartment of Biochemistry and BiophysicsPhiladelphia, Pennsylvania 19104
A. G. YodhUniversity of PennsylvaniaDepartment of Physics and AstronomyPhiladelphia, Pennsylvania 19104
Abstract. We describe an approach that combines clinical ultrasoundand photon migration techniques to enhance the sensitivity and infor-mation content of diffuse optical tomography. Measurements wereperformed on a postmenopausal woman with a single 1.830.9 cmmalignant ductal carcinoma in situ approximately 7.4 mm beneaththe skin surface (UCI IRB protocol 95-563). The ultrasound-derivedinformation about tumor geometry enabled us to segment the breasttissue into tumor and background regions. Optical data was obtainedwith a multifrequency, multiwavelength hand-held frequency-domainphoton migration backscattering probe. The optical properties of thetumor and background were then computed using the ultrasound-derived geometrical constraints. An iterative perturbative approach,using parallel processing, provided quantitative information aboutscattering and absorption simultaneously with the ability to incorpo-rate and resolve complex boundary conditions and geometries. Athree to four fold increase in the tumor absorption coefficient andnearly 50% reduction in scattering coefficient relative to backgroundwas observed (l5674, 782, 803, and 849 nm). Calculations of themean physiological parameters reveal fourfold greater tumor total he-moglobin concentration @Hbtot# than normal breast (67 mM vs 16 mM)and tumor hemoglobin oxygen saturation (SOx) values of 63% (vs73% and 68% in the region surrounding the tumor and the oppositenormal tissue, respectively). Comparison of semi-infinite to heteroge-neous models shows superior tumor/background contrast for the latterin both absorption and scattering. Sensitivity studies assessing the im-pact of tumor size and refractive index assumptions, as well as scandirection, demonstrate modest effects on recovered properties. © 2000Society of Photo-Optical Instrumentation Engineers. [S1083-3668(00)01502-1]
Keywords: diffuse optical tomography; near infrared imaging; photon migration;breast optical properties
Paper JBO-024 received Oct. 30, 1999; revised manuscript received April 10, 2000;accepted for publication April 10, 2000.
n
l
s
r
d
bin-re.if-
e,eringofs to
n-ge-
, butthe
1 IntroductionThe unique functional information and deep tissue penetratioprovided by near-infrared~NIR! light makes it well suited forcharacterizing and imaging breast tumors. However, opticacontrast elements associated with malignant and benign lesions as well as normal breast tissue physiological fluctuationare poorly understood. Consequently, NIR transilluminationtechniques that do not separate light absorption from scatteing may not provide sufficient diagnostic information to beclinically useful. In order to address this issue, time- andfrequency-domain photon migration~PM! techniques havebeen developed to facilitate quantitative tissue analysis anseparation of tissue absorption and scattering propertiesinvivo. When multiwavelength time- or frequency-domain pho-ton migration~FDPM! are combined with tomographic tech-niques, such as diffuse optical tomography~DOT!, then it is
Address all correspondence to B. J. Tromberg. Tel: 949-824-8705; Fax: 949-824-6969; E-mail: [email protected] and A. G. Yodh, Tel: 215-898-6345,E-mail: [email protected]
d From: http://biomedicaloptics.spiedigitallibrary.org/ on 09/17/2012 Terms
-
-
possible to construct low-resolution~0.5–1 cm! functionalimages of intrinsic tissue physiology; e.g., tissue hemoglo~total, oxy-, and deoxyforms!, oxygen saturation, blood volume fraction, water content, fat content, and cellular structu
In order to perform DOT, measurements of remitted dfuse light intensity and time-of-flight~or photon density wavephase and amplitude! are made on the boundary of the tissuand are then used to reconstruct the absorption and scattoptical properties of the underlying medium. A varietymethods have been developed for DOT. These include fitanalytic solutions,1–3 backprojection methods,4–7
diffraction tomography in k-space,8–14 perturbationapproaches,15–30 elliptic systems method~ESM!,31–33 and adirect method.34 All of these approaches have various advatages and disadvantages. Simple boundary conditions andometries reduce computational cost and increase speedalso reduce quantitative information about the system. On
1083-3668/2000/$15.00 © 2000 SPIE
Journal of Biomedical Optics d April 2000 d Vol. 5 No. 2 237
of Use: http://spiedl.org/terms
a
t-
is
l
-z
s
-
t-i
t-
ndd
n
sf
e
timeper-d-
e 1sed
s.al
odent
rv-67assperol-d a
ialthef
Holboke et al.
Downloade
other hand, DOT reconstructions are sensitive to many parameters including complex internal geometry of tissues, and athigh computational cost provide access to this information. Inthis article we employ an iterative perturbative approach thayields quantitative information about scattering and absorption simultaneously, and has the ability to resolve complexboundary conditions and geometries. However, the methodslow and computationally expensive, especially in three-dimensions~3D!. Therefore, we have implemented the algo-rithm using parallel processing to reduce the computationaprocessing time.
Our reconstruction is enhanced by the use of clinical ultrasound measurements to locate the tumor and assess its siUsing this information about tumor geometry, we segment thebreast into two regions: tumor and background. Our data iderived at multiple frequencies using a simple, hand-heldbackscattering probe that contains relatively few sourcedetector separations.35 This scheme of combining ultrasoundand optical information has been suggested as a meansimprove breast tumor diagnostics and an instrument employing these modalities simultaneously has been demonstratedphantoms.36 To our knowledge, this work represents the firstin vivo investigation along these lines.
The optical properties of the tumor and background arecomputed based on the data and the geometrical constrainWe compare our results to analytic models in order to demonstrate the utility of image segmentation for quantitative tu-mor spectroscopy. Factors that influence the recovered properties, such as tumor size, refractive index, and scan directioare examined. Finally, the resultant optical properties are useto calculate tumor and normal tissue hemoglobin content anhemoglobin oxygen saturation in order to gain insight into therelationship between optical and physiological changes associated with malignant tumor growth.
2 Methods2.1 FDPM InstrumentFDPM instrumentation and theoretical background have beedescribed in detail.35 Briefly, the core component of theFDPM apparatus is a network analyzer~Hewlett Packard,model 8753C!, which is used to produce modulation sweptfrom 300 kHz to 1 GHz@20 dBm radio-frequency~rf! output#.rf from the network analyzer is serially superimposed@via thealternating-current~ac! switch# on the direct current of up toeight different diode lasers~e.g., 674, 782, 803, 849, 894, and956 nm! using individual bias tees~model 5575 A, Picosec-ond Pulse Labs! and an rf switch~model 8768 K, HewlettPackard!. 100-mm-diam gradient-index fibers are used tocouple each light source to an838 optical multiplexer~model GP700, DiCon Instruments!. The838 optical multi-plexer allows for up to eight different diode laser light sourcesand eight different optical fiber positions.
Light is launched onto the tissue~or test object! using theabove-mentioned unique wavelengths and one source fibeAn avalanche photodiode@~APD!, Hamamatsu, model C5658#is used to detect the diffuse optical signal that propagatethrough the biological tissue. Both the APD and probe end othe source optical fiber are fabricated into a hand-held probeThe probe is in direct contact with the patient and can bescanned over the surface. The optical power coupled into th
238 Journal of Biomedical Optics d April 2000 d Vol. 5 No. 2
d From: http://biomedicaloptics.spiedigitallibrary.org/ on 09/17/2012 Terms
-
e.
o
n
s.
-
-
r.
.
tissue averages approximately 10–30 mW. Measurementdepends on the precision required, the number of sweepsformed, and rf optical switch times. For human subject stuies, approximately 0.1 s is used to sweep over the entirGHz band of modulation frequencies. However, total elaptime for four diodes~typically 12–16 sweeps/diode!, datatransfer, display, and source switching is approximately 40Most components, including the network analyzer, rf opticswitches, diode power supplies, and temperature of dimounts are controlled by computer using virtual instrumesoftware~LabView, National Instruments!.
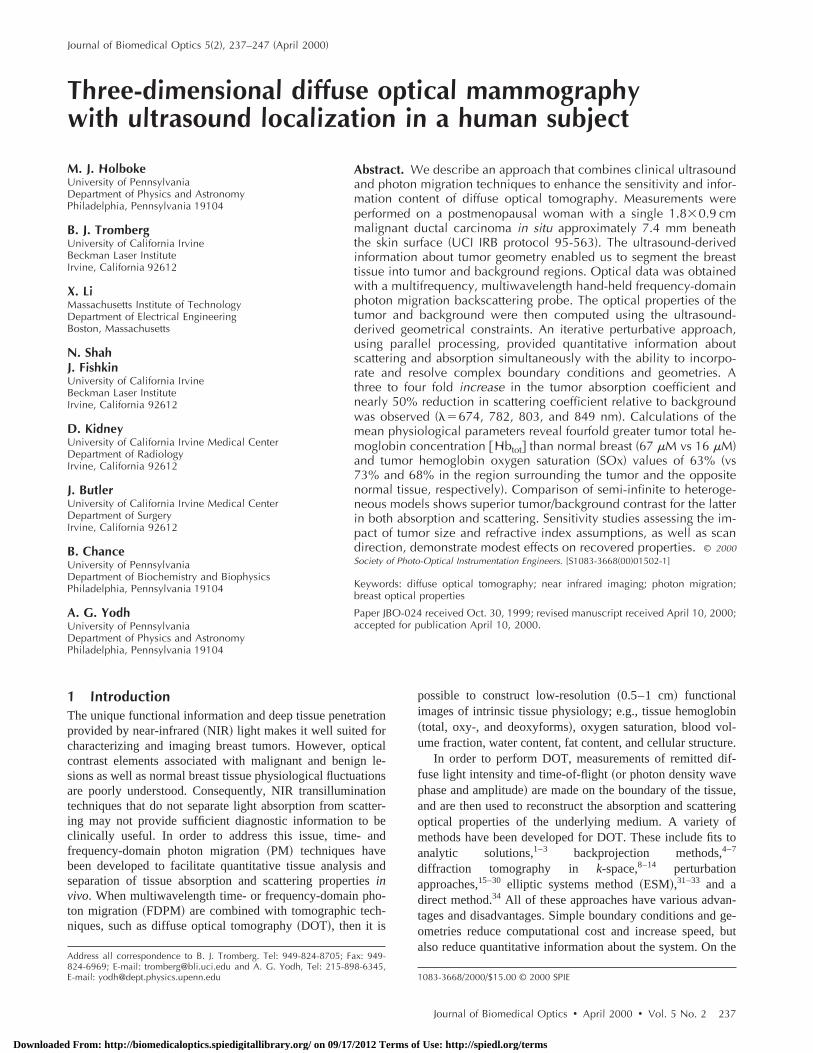
2.2 MeasurementsExperiments were performed under the guidelines of UC Iine IRB-approved protocol No. 95-563. The patient was ayear old postmenopausal woman with a single palpable mapproximately 7.4 mm beneath the skin surface in the upouter quadrant of the left breast. Histological examination flowing surgical biopsy and prebiopsy ultrasound revealeroughly 1.830.9 cmductal carcinomain situ ~DCIS! ~malig-nant tumor!. Ultrasound images along the sagittal and axplanes supplied geometry and location information abouttumor ~see Figure 1!. The location, dimension, and depth othe tumor are reported in Table 1.
Fig. 1 (A) saggital and (B) axial ultrasound images of breast tumor.
Table 1 Elliptical tumor geometry: a is along the y axis (sagittal), b isalong the x axis (axial), c is along the z axis, zc is the depth of thecenter of the tumor below the skin surface. Relative positioning of thetumor to the source-detector pairs can be seen in Figure 1.
Plane a b c zc
Sagittal 2.13 cm 1.17 cm 1.325 cm
Axial 1.68 cm 1.09 cm 1.065 cm
of Use: http://spiedl.org/terms
Three-Dimensional Diffuse Optical Mammography
Downloade
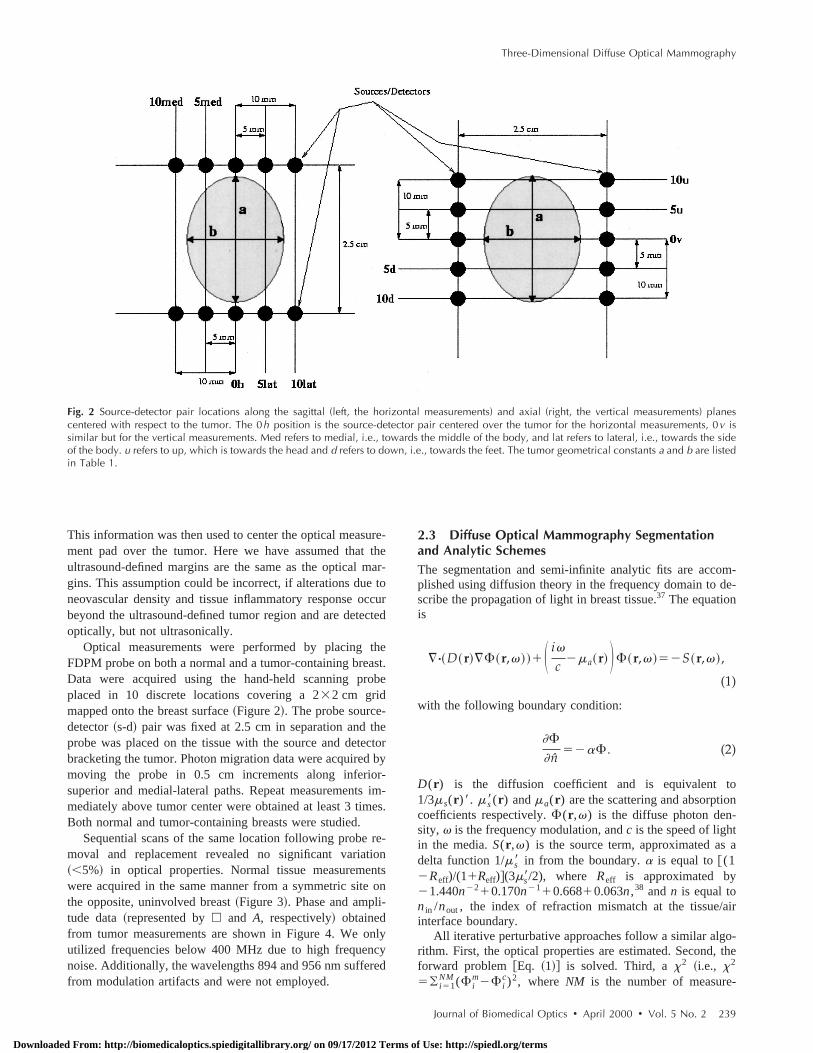
Fig. 2 Source-detector pair locations along the sagittal (left, the horizontal measurements) and axial (right, the vertical measurements) planescentered with respect to the tumor. The 0h position is the source-detector pair centered over the tumor for the horizontal measurements, 0v issimilar but for the vertical measurements. Med refers to medial, i.e., towards the middle of the body, and lat refers to lateral, i.e., towards the sideof the body. u refers to up, which is towards the head and d refers to down, i.e., towards the feet. The tumor geometrical constants a and b are listedin Table 1.
r
u
te
oy
s
-
n
m-e-
on
a
ir
o-the
-
This information was then used to center the optical measurement pad over the tumor. Here we have assumed that thultrasound-defined margins are the same as the optical magins. This assumption could be incorrect, if alterations due toneovascular density and tissue inflammatory response occbeyond the ultrasound-defined tumor region and are detecteoptically, but not ultrasonically.
Optical measurements were performed by placing theFDPM probe on both a normal and a tumor-containing breasData were acquired using the hand-held scanning probplaced in 10 discrete locations covering a232 cm gridmapped onto the breast surface~Figure 2!. The probe source-detector~s-d! pair was fixed at 2.5 cm in separation and theprobe was placed on the tissue with the source and detectbracketing the tumor. Photon migration data were acquired bmoving the probe in 0.5 cm increments along inferior-superior and medial-lateral paths. Repeat measurements immediately above tumor center were obtained at least 3 timeBoth normal and tumor-containing breasts were studied.
Sequential scans of the same location following probe removal and replacement revealed no significant variation~,5%! in optical properties. Normal tissue measurementswere acquired in the same manner from a symmetric site othe opposite, uninvolved breast~Figure 3!. Phase and ampli-tude data~represented byh and A, respectively! obtainedfrom tumor measurements are shown in Figure 4. We onlyutilized frequencies below 400 MHz due to high frequencynoise. Additionally, the wavelengths 894 and 956 nm sufferedfrom modulation artifacts and were not employed.
d From: http://biomedicaloptics.spiedigitallibrary.org/ on 09/17/2012 Terms
-e-
rd
.
r
-.
2.3 Diffuse Optical Mammography Segmentationand Analytic SchemesThe segmentation and semi-infinite analytic fits are accoplished using diffusion theory in the frequency domain to dscribe the propagation of light in breast tissue.37 The equationis
¹ ·~D~r!¹F~r,v!!1S ivc
2ma~r! DF~r,v!52S~r,v!,
(1)
with the following boundary condition:
]F
]n52aF . (2)
D(r ) is the diffusion coefficient and is equivalent t1/3ms(r )8. ms8(r ) andma(r ) are the scattering and absorptiocoefficients respectively.F(r ,v) is the diffuse photon den-sity, v is the frequency modulation, andc is the speed of lightin the media.S(r ,v) is the source term, approximated asdelta function1/ms8 in from the boundary.a is equal to@(12Reff)/(11Reff)#(3ms8/2), where Reff is approximated by21.440n2210.170n2110.66810.063n,38 andn is equal tonin /nout, the index of refraction mismatch at the tissue/ainterface boundary.
All iterative perturbative approaches follow a similar algrithm. First, the optical properties are estimated. Second,forward problem@Eq. ~1!# is solved. Third, ax2 ~i.e., x2
5( i 51NM (F i
m2F ic)2, where NM is the number of measure
Journal of Biomedical Optics d April 2000 d Vol. 5 No. 2 239
of Use: http://spiedl.org/terms

Holboke et al.
Downloade
Fig. 3 Measurements for each optical wavelength over the entire modulation frequency range for the normal breast. Source-detector pairs alongsagittal planes (left, horizontal measurements) have blue for 10 med, green for 5 med, red for 0h, cyan for 5 lat, and magenta for 10 lat; along axialplanes (right) vertical measurements have blue for 10d, green for 5d, red for 0v, cyan for 5u, and magenta for 10u. See Figure 1, for detectorpositioning. Measurements over 400 MHz suffer from systematic noise and the 894 and 956 nm wavelengths have significant artifacts below 400MHz also. These measurements, therefore, are not used in the semi-infinite analytic fits.
rto
,
ments,Fm is the measured data, andFc is the numericallycalculated data! is calculated and convergence is checked.Fourth, the inverse problem is setup~i.e., the Jacobian is de-termined!. Fifth, the optical property perturbations are solvedfor ~i.e., the inverse problem is solved!. Finally, the opticalproperties are updated and a return to the second step occuWithin these approaches there are a couple of methodssolving the forward problem and for determining the Jacobian@for a review see Ref. 39#. Additionally, there have been avariety of methods developed for solving the inverseproblem.40–48 We have chosen to follow a Green’s function240 Journal of Biomedical Optics d April 2000 d Vol. 5 No. 2
d From: http://biomedicaloptics.spiedigitallibrary.org/ on 09/17/2012 Terms
s.
~or adjoint! method.15–18,27,28The inverse problem, thereforeis formulated in the following way:
E F~r,v!G~r,v!Dma~r!dn
1E ¹F~r,v!·¹G~r,v!DD~r!dn
52~Fm~rd ,v!2Fc~rd ,v!! (3)
of Use: http://spiedl.org/terms

Three-Dimensional Diffuse Optical Mammography
Downloade
Fig. 4 Similar to Figure 3, but for the breast with lesion. Measurements over 400 MHz suffer from systematic noise and the 894 and 956 nmwavelengths have significant artifacts below 400 MHz as well. Similar to the normal breast these measurements are not used in the semi-infiniteanalytic fits nor are they used in the segmented reconstruction.
t
nd
r-
at-
nta-d
f the
or in matrix form:
@J#$Dma~r!,DD~r!%T52$Fs~rd ,v!%, (4)
where rd is the position of the detectors,Fm refers to themeasurements,Fc are the calculated values,Fs5Fm2Fc,andJ is the Jacobian. The Green’s function satisfies the fol-lowing adjoint problem:
¹ ·~D~r!¹G~r,v!!1S ivc
2ma~r! DG~r,v!52d~rd ,v!.
(5)
The equations are solved numerically utilizing a finite dif-ference method. The tumor location and geometry are used
d From: http://biomedicaloptics.spiedigitallibrary.org/ on 09/17/2012 Terms
o
segment the inverse problem into two regions, tumor abackground, over which the volume integrals in Eq.~3! arecomputed. Equation~4! is then solved for the absorption peturbationsDmao ~background! andDmat ~tumor! and for thediffusion perturbationsDDo ~background! andDDt ~tumor!.The diffusion perturbations are easily transformed into sctering perturbations using the following equation:
Dms85ms8~ i21 !S 1
113ms8~ i21 !DD
21 D . (6)
Two assumptions were necessary to attempt the segmetion. First the different tumor information from the ultrasounimages were averaged together to give a single estimate o
Journal of Biomedical Optics d April 2000 d Vol. 5 No. 2 241
of Use: http://spiedl.org/terms

a
r
e
-
h
n
e-
s
pix
y
truc-usare
tectoror-
fitsast
Holboke et al.
Download
size and location. Second, it was assumed that the tumor wsymmetric; this assumption removed any dependence on threlative position of the sources and detectors to the tumoAdditionally, it reduced the number of forward and adjointproblems, five source-detector positions became three indpendent positions along a given direction, see Figure 2.
The algorithm is depicted in Figure 5. The initial estimatesfor the optical properties are based on a semi-infinite homogeneous analytic fit. Each box containingF or G represents athree-dimensional finite-difference computation for [email protected]., a solution to Eq.~1! or ~5!, respectively#. Thesecomputations for each source/detector position and for eacfrequency are done in parallel. The building of the Jacobianand its solution are done on a single processor. The solutioof Eq. ~4! is found using simultaneous iterative reconstructiontechnique~SIRT!. The algorithm iterates until convergence isachieved.
The size of the domain was approximated to be8 cm38 cm34 cm, with a grid size resolution of 0.125 cm. Thenumber of forward problem solutions for horizontal or verti-cal simulations was 18(6 frequencies33 source positions),equivalent to the number of adjoint problem solutions. Thessimulations took approximately 3 min/iteration on 19 processors. The number of forward problem solutions for both di-rections was 36(6 frequencies36 source positions), equiva-lent to the number of adjoint problem solutions. Thesesimulations took 6 min/iteration on 19 processors.
The source strength, an unknown experimental quantity, iremoved from the analysis by normalizing the data witha single frequency [email protected]., Fm(r ,v i)5Fm(r ,v i)/F
m(r ,vo), wherevoÞv i#. A series of numeri-cal tests were conducted on this segmented reconstruction aproach using the experimental geometry and we found that sfrequencies~includingvo! were adequate to yield good least-squares fits for a single source-detector pair.
The semi-infinite homogeneous analytic fits are done biteratively fitting to the semi-infinite analytic solution
F~r,v!5So
4pD S eikr1
r12
eikr2
r2D , (7)
Fig. 5 Flow chart depicting our segmented reconstruction algorithmutilizing parallel processing.
242 Journal of Biomedical Optics d April 2000 d Vol. 5 No. 2
ed From: http://biomedicaloptics.spiedigitallibrary.org/ on 09/17/2012 Terms
se.
-
-
where
r15A~x2xs!21~y2ys!
21~z2zs!2,
r25A~x2xs!21~y2ys!
21~z1zs12zb!2,
k5A ivcD
2ma
D, ~xs ,ys ,zs!
is the source location andzb is defined as 1/a. The fitting wasdone by using a Taylor series expansion ofF(r ,v) with re-spect to the optical properties, that is,
Fm~r,v!5Fc~r,v!1]Fc~r,v!
]maDma1
]Fc~r,v!
]DDD
1 . . . ,
where the derivatives are easily determined from Eq.~6!. Thesame six frequencies are used in the segmented reconstion. Additionally, because we are fitting to a homogeneosolution here, the measurements for the different positionsaveraged together as they all share the same source-deseparation and are not supplying additional positional infmation to the semi-infinite solution.
3 Results and Discussion3.1 Semi-infinite AnalyticThe results from the homogeneous semi-infinite analyticfor the normal breast are listed in Table 2 and for the bre
Table 2 Normal breast semi-infinite homogeneous analytic fits forma and ms8 and their xv
2 (SNM(F im2F i
c)2/s i2/DOF) values for ampli-
tude and phase. The direction refers to the measurement sets, i.e.,horizontal refers to the source-detector pairs oriented parallel to thesagittal plane (medial-lateral), vertical refers to the source-detectorpairs oriented parallel to the axial plane (up-down), both refers tousing both horizontal and vertical together.
l (nm) Direction ma (cm−1) ms8 (cm−1) xv2 (amp) xv
2 (phase)
674 Horizontal 0.041 9.6 0.020 0.087
674 Vertical 0.043 9.5 0.015 0.19
674 Both 0.042 9.6 0.019 0.14
782 Horizontal 0.045 8.9 0.16 0.41
782 Vertical 0.044 9.0 0.11 0.57
782 Both 0.045 8.9 0.14 0.49
803 Horizontal 0.035 8.4 0.094 0.38
803 Vertical 0.034 8.5 0.049 1.4
803 Both 0.035 8.5 0.075 0.91
849 Horizontal 0.049 8.2 0.023 0.093
849 Vertical 0.046 8.4 0.025 0.55
849 Both 0.046 8.3 0.025 0.33
of Use: http://spiedl.org/terms

be-ient.astthesistionro-
ble 4ies.ase.aseor
-ose
Three-Dimensional Diffuse Optical Mammography
Downlo
with the lesion in Table 3. Thexv2 values validate the good-
ness of fit since the values are 1.5 or less. The number odegrees of freedom~DOF! is the number of source-detectorpairs (10 or 5)3numberof frequencies~74!—the number ofparameters~two for semi-infinite and four for segmented re-construction!. Generally, for testing goodness of fit one wouldwant the values to lie between 1.5 and 0.5, when the valueare less than 0.5 it is generally believed that the noise waoverestimated.
In Figure 6, the homogeneous semi-infinite analytic opticaproperties for both breasts are plotted versus wavelength. Thabsorption coefficient shows anincreaseof approximately48% from the normal breast, consistent with the presence othe tumor. The scattering coefficient exhibits adecreaseof;11% for the horizontal measurements and anincreaseof;11% for the vertical measurements from the normal breas
Table 3 Breast with lesion semi-infinite homogeneous analytic fitsfor ma and ms8 and their xv
2 values for amplitude and phase, similar toTable 2. These are also the initial conditions for the segmented recon-struction.
l (nm) Direction ma (cm−1) ms8 (cm−1) xv2 (amp) xv
2 (phase)
674 Horizontal 0.061 8.3 0.033 0.19
674 Vertical 0.071 9.8 0.036 0.18
674 Both 0.066 9.0 0.034 0.40
782 Horizontal 0.056 8.0 0.16 0.52
782 Vertical 0.064 9.8 0.086 0.41
782 Both 0.059 8.8 0.12 0.84
803 Horizontal 0.046 7.6 0.094 0.50
803 Vertical 0.066 9.8 0.044 0.20
803 Both 0.056 8.6 0.11 1.5
849 Horizontal 0.061 7.4 0.034 0.19
849 Vertical 0.072 9.7 0.0081 0.059
849 Both 0.065 8.4 0.027 0.93
Fig. 6 Semi-infinite homogeneous analytic fits for the optical proper-ties of the normal breast (open triangles, see Table 2) and the breastwith lesion (solid triangles, see Table 3).
aded From: http://biomedicaloptics.spiedigitallibrary.org/ on 09/17/2012 Terms
f
ss
le
f
t.
Using both sets of measurements, the average differencetween the breasts is less than 1% for the scattering coefficThese semi-infinite analytic results provide a simple and fway of determining the presence of a tumor, howeveroptical properties are clearly insufficient for further diagnoof the tumor. Therefore, we have advanced the reconstrucby assuming the presence of a tumor with the geometry pvided by the ultrasound images.
3.2 Segmented ReconstructionThe segmented reconstruction parameters are listed in Taalong with the parameters for a series of sensitivity studThe optimal estimate of all the parameters is the base cThe results of the segmented reconstruction fit for the bcase are listed in Table 5. For all four wavelengths, the tumproperties hadincreasedabsorption, on average3.43 thebackground, anddecreasedscattering, on average0.413 thebackground. Thexn
(2) are again very good, in fact the segmented reconstruction values are improved compared to th
Table 4 Simulation parameters for the base case and the sensitivitystudies. Direction is the set of measurements used for the given simu-lation, a is the y-axis length of the tumor, b is the x-axis length of thetumor, c is the z-axis length of the tumor, and zc is the center of thetumor below the skin surface. nin /nout is the index mismatch betweenthe tissue (nin) and the air (nout). The base case is the optimal choiceof the listed parameters. The sensitivity studies focus on directionalsensitivity of the measurements (horizontal and vertical), size of thetumor (bigger and smaller), and the index mismatch of the tissue–airinterface (greater and less).
Experiment Direction a b c zc n in /nout
Base Both 2.13 1.68 1.135 1.1975 1.36
Horizontal Horizontal 2.13 1.68 1.135 1.1975 1.36
Vertical Vertical 2.13 1.68 1.135 1.1975 1.36
Bigger Both 2.343 1.848 1.2485 1.1975 1.36
Smaller Both 1.917 1.512 1.0215 1.1975 1.36
Greater Both 2.13 1.68 1.135 1.1975 1.40
Less Both 2.13 1.68 1.135 1.1975 1.333
Table 5 Base case results from the segmented reconstruction andtheir xv
2 values for amplitude and phase (mao,ms8o are backgroundand mat,ms8t are tumor values). The base case represents the optimalchoice for the simulation parameters listed in Table 4.
l(nm)
mao(cm−1)
ms8o(cm−1)
mat(cm−1)
ms8t(cm−1)
xv2
(amp)xv
2
(phase)
674 0.057 9.5 0.17 4.1 0.032 0.29
782 0.050 9.4 0.18 3.6 0.12 0.68
803 0.047 9.0 0.15 4.2 0.16 1.1
849 0.054 8.9 0.21 3.3 0.020 0.64
Journal of Biomedical Optics d April 2000 d Vol. 5 No. 2 243
of Use: http://spiedl.org/terms

-ni-dt
-
-astf
r
-
-
r-
-
and
stn
ortentothth-on-i-
ingThisthe
withe-di-f all-dge
ies.ea-ea-
asedas
icalken.
op-to-
er-
in-the
ow-each
a-
ec-
altruc-ntsre-
Holboke et al.
Download
recovered using the homogeneous semi-infinite model~usingboth measurement directions! further validating our seg-mented model.
The background absorption coefficients from the segmented reconstruction are generally similar to the absorptiocoefficients determined for the breast lesion using the seminfinite homogeneous model. The segmented backgrounscattering coefficients are also close to the semi-infinite scatering properties.
Overall, the optical properties of the tumor show dramaticcontrast with both normal tissue and tumor-breast background. Theincreasein ma is due to hemoglobin absorption;the principal NIR-absorbing component of highly vascular tu-mors. Previousin vivo studies suggest that tumors can displaytwo to fivefold higher blood volume fractions than uninvolvedbreast tissue.49–51 Our segmentation scheme reveals substantially higher tumor/background contrast than observed usinghomogeneous semi-infinite analytical model that averageproperties over a large volume. In addition, the reduced scatering (ms8) values in the tumor were, on average, about halthose of normal tissue. This feature suggests the core of thtumor has a low cellular and/or extracellular matrix density.Interestingly, since fluid content also provides contrast foultrasound images, combining optical and ultrasound observations indicates the tumor core is likely to be a necrotic, bloodfilled region dominated by particles that have low scatteringcross sections and/or low density~compared to normal, well-differentiated breast tissue!. This view coincides well withhistopathology data showing the tumor to be poorly differentiated and malignant.
Further diagnostic insight is provided by calculating thephysiological properties of normal breast, tumor, and tumobreast outside the tumor region. Assuming the principal absorbers are oxy- and deoxyhemoglobin~HbOx and Hb, re-spectively!, least squares fits of calculatedma values~fromTables 2 and 5 for normal and tumor breast, respectively! tomolecular extinction coefficients for each component at thefour measured wavelengths1 can be used to determine@HbOx#, @Hb#, and percentage hemoglobin saturation(SOx51003@HbOx#/@Hbtot#; and @Hbtot#5@Hb#1@HbOx#).
These results, summarized in Figure 7, show clear differences between tumor and normal tissue. Most dramatic is th
Fig. 7 Physiological parameters calculated from wavelength-dependent absorption: Tissue deoxyhemoglobin [Hb], oxyhemoglo-bin [HbOx], and total @Hbtot# concentration (mM); Hemoglobin oxy-gen saturation (%SOx). Values determined for normal breast, tumor,and tumor-containing breast outside of tumor region.
244 Journal of Biomedical Optics d April 2000 d Vol. 5 No. 2
ed From: http://biomedicaloptics.spiedigitallibrary.org/ on 09/17/2012 Terms
-
-
e
-
e
approximately fourfoldincreasein total hemoglobin contentat the tumor~67 mM! vs normal tissue~16 mM!. Hemoglobincontrast is reduced to a factor of 2.6 when the tumor sitesurrounding tumor-containing breast tissue~25.5 mM! arecompared. SOx values are lower at the tumor site~63%! vsnormal ~68%! and surrounding tumor-containing brea~73%!. Differences are likely due to the oxygen extractiodemands of rapidly proliferating, metabolically active tumcells. The reduced saturation value at the tumor is consiswith the measured elevation in tumor hemoglobin, since bblood and oxygen are required to sustain tumor growth. Oers have measured similar elevated tumor hemoglobin ccentration and low SOx values noninvasively with photon mgration techniques.48,49 Interestingly, both total hemoglobinand SOx values are slightly elevated in the tumor-containsurrounding breast versus the contra-lateral normal side.suggests that physiological changes occur beyondultrasound-designated tumor margin that are detectablelight. For example, a high blood flow, well-vascularized rgion could extend beyond the ultrasound-defined tumormension. This observation is consistent with the notion ohypoxic, necrotic tumor core surrounded by a wevascularized, normoxic cortex that provides the leading efor growth.
3.3 Sensitivity StudiesTable 4 lists the parameters for a series of sensitivity studWe examined the sensitivity of the optical properties to msurement direction, tumor size, and boundary condition. Msurement direction had two options: horizontal~along theaxial plane! or vertical ~along the sagittal plane!. Tumor sizewas enlarged by 10% along each major axis or was decreby 10% along each major axis. The boundary condition weither based on an index mismatch of 1.333 or 1.40.
3.3.1 Measurement directionThese results tested the sensitivity of the calculated optproperties to the direction that the measurements were taFigure 8~a! lists optical property andxn
2 values for the fourparameter fits. Some of thexn
2 values are increased relative tthe semi-infinite fit. This is caused by the symmetry assumtion and is minimized when using both measurement setsgether. The tumor absorption was on average4.13 the back-ground for the horizontal and2.33 the background for thevertical. The tumor scattering for the horizontal was on avage 0.33 the background and0.553 for the vertical. The base case values lie directlybetween these values illustrating the impact of minimizingerror between the two directions.
The sensitivity can best be depicted by a bar graph shing the average percentage change from the base case forof the four parameters, see Figure 8~b!. The background prop-ertiesdecreasedfrom the base case for the horizontal mesurements;10% andincreasedfor the vertical;15%. Thetumor properties showed more sensitivity to the vertical dirtion, especially the scattering~;45%!. Finally, the base caseoptical properties were more similar to the horizontal opticproperties, indicating that the base case segmented reconstion fits were more sensitive to the horizontal measuremethan the vertical. This is consistent with the vertical measu
of Use: http://spiedl.org/terms

r
-et
e
s
t
morrp-in-
sed
the
thethe
ud-.4
ter-
Three-Dimensional Diffuse Optical Mammography
Download
ments being more sensitive to the symmetry assumption fothe tumor geometry. This is clear since the vertical measurement set is aligned with the major axis of the ellipse. Therefore the vertical measurement set will be more sensitive to thtumor optical properties than the horizontal measurement se
3.2.2 Tumor sizeThis study observed the impact of changing the size of thtumor on the optical properties. Figure 9~a! lists the resultsfrom the segmented reconstruction fit. Thexn
2 values aresmaller than the base case for the larger tumor, implying thathe optical tumor margins might in fact be larger than wasestimated from the ultrasound. The tumor absorption waabout 3.03 the background for the larger size and about3.753 for the smaller size. The tumor scattering was abou0.463 the background for the larger size and about 0.393 forthe smaller size.
Figure 9~b! shows the average over the wavelengths for thepercentage change from the base case for the tumor size sesitivity. Overall, the size sensitivity is quite reduced from thedirectional sensitivity. The background properties did not
Fig. 8 (a) Directional sensitivity segmented reconstruction results andtheir xv
2 values for amplitude and phase. Horizontal uses just the hori-zontal measurement set and vertical uses just the vertical measure-ment set, see Figure 2 for orientation and Table 4 for parameters. (b)Average percentage change of the segmented reconstruction opticalproperties over the four optical wavelengths from the base case to thehorizontal measurement set simulation (left four bars) and the verticalmeasurement set simulation (right four bars). The horizontal measure-ment set simulations show less change from the base case than thevertical set measurement simulations. This is consistent with the hori-zontal measurement set being less sensitive to the symmetry assump-tion of the tumor than the vertical measurement set.
ed From: http://biomedicaloptics.spiedigitallibrary.org/ on 09/17/2012 Terms
-
.
t
n-
change significantly from the base case. However, the tuproperties showed greater sensitivity; particularly the absotion increasing or decreasing when size decreased andcreased, respectively. The volume change~DV5V82V,whereV8 is the new volume andV is the base case volume!of the tumor is directly related to the change inDma (mat2mao) as follows: Dma85Dma /(11DV/2V). Dms8 alsochanged with volume; increasing when the volume increa;6% and decreasing when the volume decreased;3%, how-ever there was no clear functional relationship betweentwo parameters.
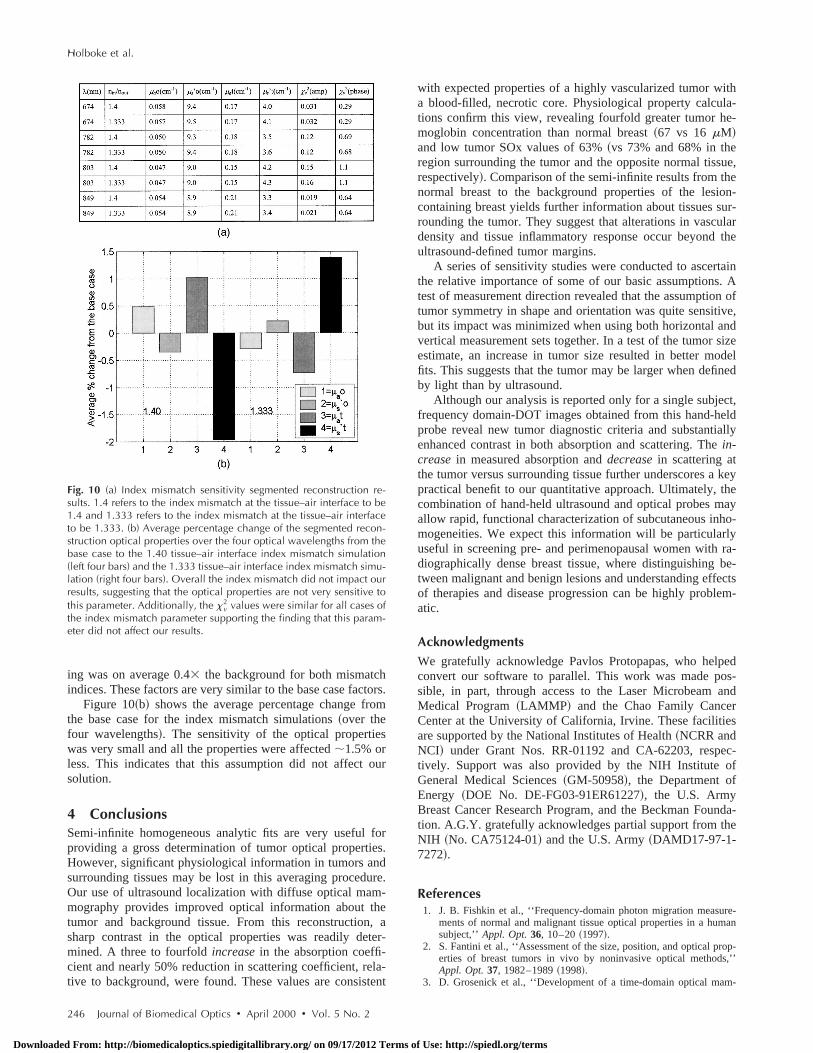
3.2.3 Index mismatchThis last study focused on changing the index mismatch attissue–air interface, essentially testing the importance ofboundary condition assumption. Figure 10~a! lists the resultsfrom the segmented reconstruction fit. Thexn
2 values are verysimilar for all cases of the index mismatch parameter, incling the base case. The tumor absorption was on average 33the background for both mismatch indices. The tumor scat
Fig. 9 (a) Tumor size sensitivity segmented reconstruction results. Big-ger refers to an increase in tumor size and smaller refers to a decreasein tumor size, see Table 4 for parameters. (b) Average percentagechange of the segmented reconstruction optical properties over thefour optical wavelengths from the base case to the bigger tumor sizesimulation (left four bars) and the smaller tumor size simulation (rightfour bars). The tumor optical properties had the most sensitivity, spe-cifically its absorption coefficient. As the tumor increased its absorp-tion decreased and its scattering increased, when the tumor decreasedthe opposite occurred. Additionally, the xv
2 values for the bigger tu-mor size were slightly less than the base case values. This implies thatthe tumor was optically larger than the ultrasound size.
Journal of Biomedical Optics d April 2000 d Vol. 5 No. 2 245
of Use: http://spiedl.org/terms
rs
r
r.
e
a-
-n
ithla-e-
ue,eon-ur-
ularthe
tain. An ofive,ndsizedel
ned
ct,eldally
keyheay
ho-lyra-be-ectslem-
pedos-andrs
ec-of
nda-e
re-an
op-,’’
m-
Holboke et al.
Download
ing was on average 0.43 the background for both mismatchindices. These factors are very similar to the base case facto
Figure 10~b! shows the average percentage change fromthe base case for the index mismatch simulations~over thefour wavelengths!. The sensitivity of the optical propertieswas very small and all the properties were affected;1.5% orless. This indicates that this assumption did not affect ousolution.
4 ConclusionsSemi-infinite homogeneous analytic fits are very useful foproviding a gross determination of tumor optical propertiesHowever, significant physiological information in tumors andsurrounding tissues may be lost in this averaging procedurOur use of ultrasound localization with diffuse optical mam-mography provides improved optical information about thetumor and background tissue. From this reconstruction,sharp contrast in the optical properties was readily determined. A three to fourfoldincreasein the absorption coeffi-cient and nearly 50% reduction in scattering coefficient, relative to background, were found. These values are consiste
Fig. 10 (a) Index mismatch sensitivity segmented reconstruction re-sults. 1.4 refers to the index mismatch at the tissue–air interface to be1.4 and 1.333 refers to the index mismatch at the tissue–air interfaceto be 1.333. (b) Average percentage change of the segmented recon-struction optical properties over the four optical wavelengths from thebase case to the 1.40 tissue–air interface index mismatch simulation(left four bars) and the 1.333 tissue–air interface index mismatch simu-lation (right four bars). Overall the index mismatch did not impact ourresults, suggesting that the optical properties are not very sensitive tothis parameter. Additionally, the xv
2 values were similar for all cases ofthe index mismatch parameter supporting the finding that this param-eter did not affect our results.
246 Journal of Biomedical Optics d April 2000 d Vol. 5 No. 2
ed From: http://biomedicaloptics.spiedigitallibrary.org/ on 09/17/2012 Terms
.
.
t
with expected properties of a highly vascularized tumor wa blood-filled, necrotic core. Physiological property calcutions confirm this view, revealing fourfold greater tumor hmoglobin concentration than normal breast~67 vs 16mM!and low tumor SOx values of 63%~vs 73% and 68% in theregion surrounding the tumor and the opposite normal tissrespectively!. Comparison of the semi-infinite results from thnormal breast to the background properties of the lesicontaining breast yields further information about tissues srounding the tumor. They suggest that alterations in vascdensity and tissue inflammatory response occur beyondultrasound-defined tumor margins.
A series of sensitivity studies were conducted to ascerthe relative importance of some of our basic assumptionstest of measurement direction revealed that the assumptiotumor symmetry in shape and orientation was quite sensitbut its impact was minimized when using both horizontal avertical measurement sets together. In a test of the tumorestimate, an increase in tumor size resulted in better mofits. This suggests that the tumor may be larger when defiby light than by ultrasound.
Although our analysis is reported only for a single subjefrequency domain-DOT images obtained from this hand-hprobe reveal new tumor diagnostic criteria and substantienhanced contrast in both absorption and scattering. Thein-creasein measured absorption anddecreasein scattering atthe tumor versus surrounding tissue further underscores apractical benefit to our quantitative approach. Ultimately, tcombination of hand-held ultrasound and optical probes mallow rapid, functional characterization of subcutaneous inmogeneities. We expect this information will be particularuseful in screening pre- and perimenopausal women withdiographically dense breast tissue, where distinguishingtween malignant and benign lesions and understanding effof therapies and disease progression can be highly probatic.
AcknowledgmentsWe gratefully acknowledge Pavlos Protopapas, who helconvert our software to parallel. This work was made psible, in part, through access to the Laser MicrobeamMedical Program~LAMMP ! and the Chao Family CanceCenter at the University of California, Irvine. These facilitieare supported by the National Institutes of Health~NCRR andNCI! under Grant Nos. RR-01192 and CA-62203, resptively. Support was also provided by the NIH InstituteGeneral Medical Sciences~GM-50958!, the Department ofEnergy ~DOE No. DE-FG03-91ER61227!, the U.S. ArmyBreast Cancer Research Program, and the Beckman Foution. A.G.Y. gratefully acknowledges partial support from thNIH ~No. CA75124-01! and the U.S. Army~DAMD17-97-1-7272!.
References1. J. B. Fishkin et al., ‘‘Frequency-domain photon migration measu
ments of normal and malignant tissue optical properties in a humsubject,’’ Appl. Opt.36, 10–20~1997!.
2. S. Fantini et al., ‘‘Assessment of the size, position, and optical prerties of breast tumors in vivo by noninvasive optical methodsAppl. Opt.37, 1982–1989~1998!.
3. D. Grosenick et al., ‘‘Development of a time-domain optical ma
of Use: http://spiedl.org/terms
’
-
-
,
t
ng
edlu-
in
ica,’’
ic
m
m-ta-
h,,’’
if-
te-
st
on
y-ra-
n
-
icala-
iny,’’
in
se
.osi-ive
er-hy
oxy-
, T.
Three-Dimensional Diffuse Optical Mammography
Downloade
mograph and first in vivo applications,’’Appl. Opt.38, 2927–2943~1999!.
4. G. Muller, J. Beuthan, and O. Minet, ‘‘Laser-generated DiffusionTomograms in the Near Infrared,’’Laser Phys.6, 589–595~1996!.
5. S. A. Walker et al., ‘‘Image reconstruction by backprojection fromfrequency-domain optical measurements in highly scattering media,’Appl. Opt.36, 170–179~1997!.
6. S. B. Colak et al., ‘‘Tomographic image reconstruction from opticalproperties in light-diffusing media,’’Appl. Opt.36, 180–213~1997!.
7. O. Dorn, ‘‘A transport-backtransport method for optical tomogra-phy,’’ Inverse Probl.14, 1107–1130~1998!.
8. J. C. Schotland, ‘‘Continuous-wave diffusion imaging,’’J. Opt. Soc.Am. A14, 275–279~1997!.
9. C. L. Matson et al., ‘‘Three-dimensional tumor localization in thicktissue with the use of diffuse photon-density waves,’’Appl. Opt.36,214–220~1997!.
10. X. D. Li et al., ‘‘Diffraction tomography for biochemical imagingwith diffuse-photon density waves,’’Opt. Lett.22, 573–575~1997!.
11. X. Cheng and D. A. Boas, ‘‘Diffuse optical reflection tomographywith continuous-wave illumination,’’Opt. Express3, 118–123~1998!.
12. D. N. Pattanayak and A. G. Yodh, ‘‘Diffuse optical 3D-slice imagingof bounded turbid media using a new integro-differential equation,’’Opt. Express4, 231–240~1999!.
13. C. L. Matson and H. Li, ‘‘Analysis of the forward problem withdiffuse photon density waves in turbid media by use of a diffractiontomography model,’’J. Opt. Soc. Am. A16, 455–466~1999!.
14. T. Durduran et al., ‘‘Algorithms for 3D localization and imaging us-ing near-field diffraction tomography with diffuse light,’’Opt. Ex-press4, 247–262~1999!.
15. J. C. Schotland et al., ‘‘Photon hitting density,’’Appl. Opt.32, 448–453 ~1993!.
16. S. R. Arridge, ‘‘Photon-measurement density functions. Part 1: Analytic forms,’’ Appl. Opt.34, 7395–7409~1995!.
17. S. R. Arridge and M. Schweiger, ‘‘Photon-measurement densityfunctions. Part 2: Finite-element-method calculations,’’Appl. Opt.34, 8026–8037~1995!.
18. M. A. O’Leary et al., ‘‘Experimental images of heterogeneous turbidmedia by frequency-domain diffusing-photon tomography,’’Opt.Lett. 20, 426–428~1995!.
19. K. D. Paulsen and H. Jiang, ‘‘Spatially varying optical property re-construction using a finite element diffusion equation approxima-tion,’’ Med. Phys.22, 691–701~1995!.
20. H. Jiang et al., ‘‘Simultaneous reconstruction of optical absorptionand scattering maps in turbid media from near-infrared frequencydomain data,’’Opt. Lett.20, 2128–2130~1995!.
21. H. Jiang, K. D. Paulsen, and U. L. O¨ sterberg, ‘‘Optical image recon-struction using DC data: simulations and experiments,’’Phys. Med.Biol. 41, 1483–1498~1996!.
22. W. Cai et al., ‘‘Time-resolved optical diffusion tomographic imagereconstruction in highly scattering media,’’Proc. Natl. Acad. Sci.USA93, 13561–13564~1996!.
23. A. H. Hielscher, ‘‘Model-Based Iterative Image Reconstruction forPhoton Migration Tomography,’’ inComputational, Experimentaland Numerical Methods for Solving Ill-posed Inverse Imaging Prob-lems: Medical and Nonmedical Applications, Proc. SPIE3171, 106–117 ~1997!.
24. J. Chang et al., ‘‘Optical imaging of anatomical maps derived frommagnetic resonance images using time-independent optical sourcesIEEE Trans. Med. Imaging16, 68–77~1997!.
25. D. Y. Paithankar et al., ‘‘Imaging of fluorescent yield and lifetimefrom multiply scattered light reemitted from random media,’’Appl.Opt. 36, 2260–2272~1997!.
26. E. M. Sevick-Muraca et al., ‘‘Role of higher-order scattering in so-lutions to the forward and inverse optical-imaging problems in ran-dom media,’’Appl. Opt.36, 9058–9067~1997!.
27. Y. Yao et al., ‘‘A Born Type Iterative Method for Imaging of Het-erogeneous Scattering Media and its Application to Simulated BreasTissue,’’ inOptical Tomography and Spectroscopy of Tissue: Theory,Instrumentation, Model and Human Studies II, Proc. SPIE 2979,232–240~1997!.
28. Y. Yao et al., ‘‘Frequency-domain optical imaging of absorption and
d From: http://biomedicaloptics.spiedigitallibrary.org/ on 09/17/2012 Terms
’’
scattering distributions by a Born iterative method,’’J. Opt. Soc. Am.A 14, 325–342~1997!.
29. R. Model et al., ‘‘Reconstruction algorithm for near-infrared imagiin turbid media by means of time-domain data,’’J. Opt. Soc. Am. A14, 313–324~1997!.
30. F. Gao et al., ‘‘The forward and inverse models in time-resolvoptical tomography imaging and their finite-element method sotions,’’ Image Vis. Comput.16, 703–712~1998!.
31. M. V. Klibanov et al., ‘‘A fast and accurate imaging algorithmoptical/diffusion tomography,’’ Inverse Probl. 13, 1341–1361~1997!.
32. M. V. Klibanov and T. R. Lucas, ‘‘Numerical solution of a parabolinverse problem in optical tomography using experimental datSIAM (Soc. Ind. Appl. Math.) J. Appl. Math.59, 1763–1789~1999!.
33. Y. A. Gryazin et al., ‘‘Imaging the diffusion coefficient in a parabolinverse problem in optical tomography,’’Inverse Probl.15, 373–397~1999!.
34. M. F. Maritz et al., ‘‘Recovery of the absorption coefficient frodiffused reflected light using a discrete diffusive model,’’SIAM (Soc.Ind. Appl. Math.) J. Appl. Math.59, 58–71~1998!.
35. T. H. Pham, O. Coquoz, J. B. Fishkin, E. Anderson, and B. J. Troberg, ‘‘Broad-bandwidth frequency-domain instrument for quantitive tissue optical spectroscopy,’’Rev. Sci. Instrum.71, 1–14~2000!.
36. Q. Zhu, T. Durduran, V. Ntziachristos, M. Holboke, and A. G. Yod‘‘Imager that combines near-infrared diffusive light and ultrasoundOpt. Lett.24, 1050–1052~1999!.
37. A. G. Yodh and B. Chance, ‘‘Spectroscopy and Imaging with Dfusing Light,’’ Phys. Today48, 34–40~1995!.
38. R. A. J. Groenhuis et al., ‘‘Scattering and absorption of turbid marials determined from reflection measurements,’’Appl. Opt.22, 2456~1983!.
39. S. R. Arridge, ‘‘Optical tomography in medical imaging,’’InverseProbl. 15, R41–R93~1999!.
40. W. Zhu et al., ‘‘Wavelet-Based Multiresolution Regularized LeaSquares Reconstruction Approach for Optical Tomography,’’IEEETrans. Med. Imaging16, 210–217~1997!.
41. S. R. Arridge and M. Schweiger, ‘‘A gradient-based optimisatischeme for optical tomography,’’Opt. Express2, 213–226~1998!.
42. M. J. Eppstein et al., ‘‘Biomedical optical tomography using dnamic parameterization and Bayesian conditioning on photon migtion measurements,’’Appl. Opt.38, 2138–2150~1999!.
43. J. C. Ye et al., ‘‘Modified distorted Born iterative method with aapproximate Frechet derivative for optical diffusion tomography,’’J.Opt. Soc. Am. A16, 1814–1826~1999!.
44. J. C. Ye et al., ‘‘Optical diffusion tomography by iterativecoordinate-descent optimization in a Bayesian framework,’’J. Opt.Soc. Am. A16, 2400–2412~1999!.
45. K. D. Paulsen and H. Jiang, ‘‘Enhanced frequency-domain optimage reconstruction in tissues through total-variation minimiztion,’’ Appl. Opt.35, 3447–3458~1996!.
46. H. Jiang et al., ‘‘Frequency-domain optical image reconstructionturbid media: an experimental study of single-target detectabilitAppl. Opt.36, 52–63~1997!.
47. H. Jiang et al., ‘‘Improved continuous light diffusion imagingsingle- and multi-target tissue-like phantoms,’’Phys. Med. Biol.43,675–693~1998!.
48. B. W. Pogue et al., ‘‘Spatially variant regularization improves diffuoptical tomography,’’Appl. Opt.38, 2950–2961~1999!.
49. S. Fantini, S. A. Walker, M. A. Franceschini, K. T. Moesta, P. MSchlag, M. Kaschke, and E. Gratton, ‘‘Assessment of the size, ption, and optical properties of breast tumors in vivo by non-invasoptical methods,’’Appl. Opt.37, 1982–1989~1998!.
50. T. O. McBride, B. Pogue, E. D. Gerety, S. B. Poplack, U. L. Ostberg, and K. D. Paulsen, ‘‘Spectroscopic diffuse optical tomograpfor the quantitative assessment of hemoglobin concentration andgen saturation in breast tissue,’’Appl. Opt. 38~25!, 5480–5491~1999!.
51. B. J. Tromberg, N. Shah, R. Lanning, A. Cerussi, J. EspinozaPham, L. Svaasand, and J. Butler, ‘‘Noninvasivein vivo characteriza-tion of breast tumors using photon migration spectroscopy,’’Neopla-sia 2~1-2!, 26–40~2000!.
Journal of Biomedical Optics d April 2000 d Vol. 5 No. 2 247
of Use: http://spiedl.org/terms


![Xiang Li [Member, IEEE] NIH Public Access …pubs.bli.uci.edu/sites/default/files/publications/nihms582768_0.pdfIntegrated IVUS-OCT Imaging for Atherosclerotic Plaque ... moderate](https://img.dokumen.tips/doc/110x75/5b2f1d2c7f8b9a91438c8190/xiang-li-member-ieee-nih-public-access-pubsbliuciedusitesdefaultfilespublicationsnihms5827680pdfintegrated.jpg)