Embed Size (px)
Citation preview

Threats and Opportunities for the Generic IndustryKATE KUHRT
JUNE 2006

AT FIRST GLANCE, MANY OPPORTUNITIES
• Increasing demand for low-cost therapies
– Aging population
– Consumers becoming more cost sensitive
– Increased generic substitution
– Government involvement• US Medicare Drug
reimbursement
• Reference pricing in Europe
Less
Dev
Wor
ldM
ore
Dev
1950 1975 2000 2025 2050
0
10
20
30
40
Perc
ent
of
Popula
tion o
ver
60
Source: United Nations, DESA, Population Division
Proportion of Population Aged 60 or Over
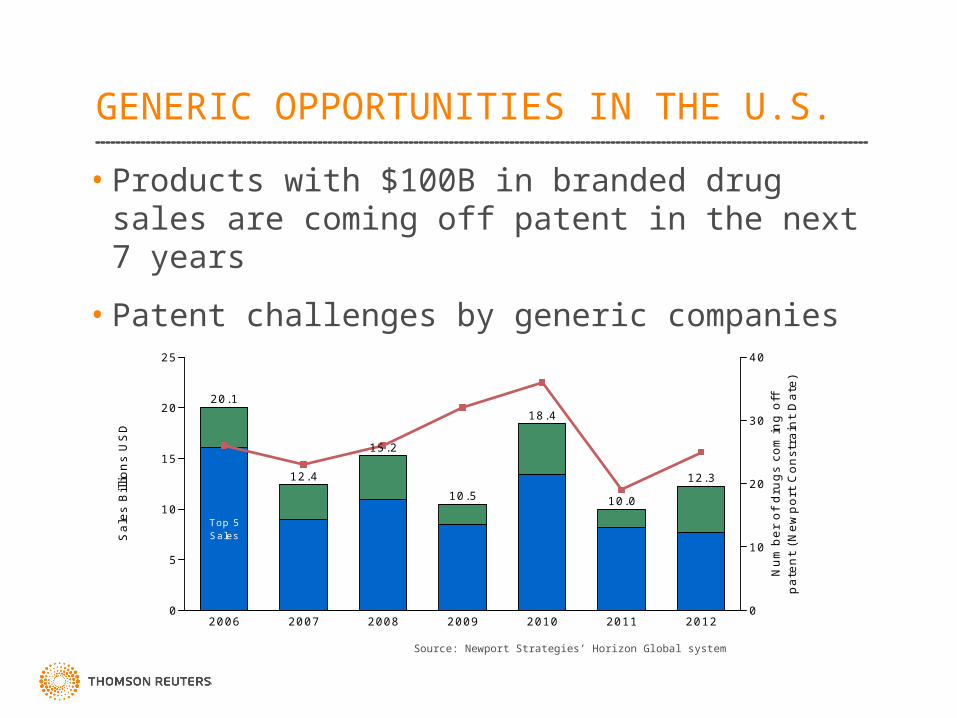
GENERIC OPPORTUNITIES IN THE U.S.
• Products with $100B in branded drug sales are coming off patent in the next 7 years
• Patent challenges by generic companies
Top 5Sales
2006 2007 2008 2009 2010 2011 2012
20.1
12.4
15.2
10.5
18.4
10.0
12.3
0
5
10
15
20
25
Sal
es B
illio
ns
US
D
0
10
20
30
40
Num
ber
of
dru
gs
com
ing o
ffpat
ent
(New
por
t C
onst
rain
t D
ate)
Source: Newport Strategies’ Horizon Global system

A CLOSER LOOK…
• Rapid price erosion in the U.S. and UK
• Diminishing margins on both dose and API sales
• New regulations in Germany (AVWG)
• Settlements between generics and brand companies are delaying generic entry in the U.S.
• ANDA approval backlog in the U.S.
• Fewer new launches by innovators over the past years will translate into fewer opportunities for generics down the road
5-10% of $100 billion over 7 years, divided among many players and products, does not necessarily translate into a lot of money for
every generic company
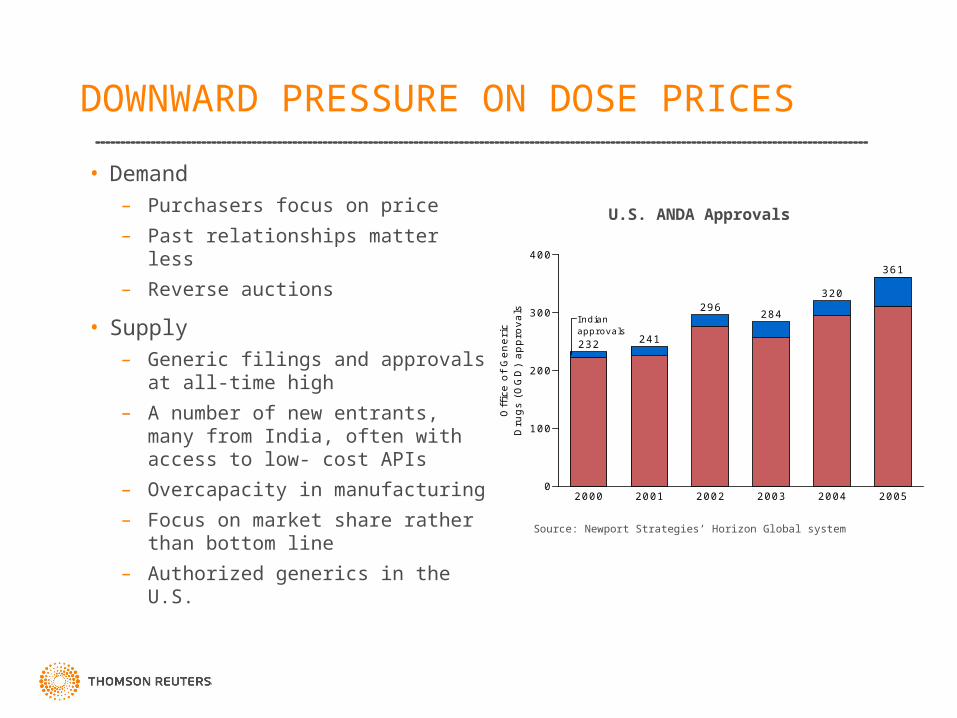
DOWNWARD PRESSURE ON DOSE PRICES
• Demand– Purchasers focus on price
– Past relationships matter less
– Reverse auctions
• Supply– Generic filings and approvals at all-
time high
– A number of new entrants, many from India, often with access to low- cost APIs
– Overcapacity in manufacturing
– Focus on market share rather than bottom line
– Authorized generics in the U.S.
Indianapprovals
2000 2001 2002 2003 2004 2005
232 241
296 284
320
361
0
100
200
300
400
Offi
ce o
f G
ener
icD
rugs
(OG
D)
appro
vals
Source: Newport Strategies’ Horizon Global system
U.S. ANDA Approvals
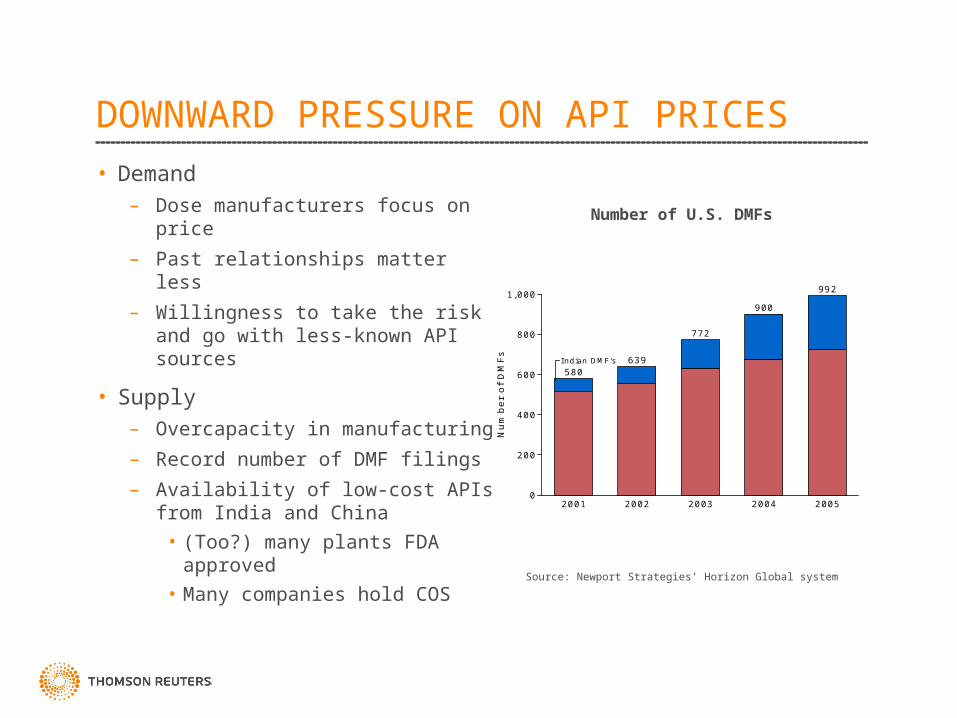
DOWNWARD PRESSURE ON API PRICES
• Demand– Dose manufacturers focus on price
– Past relationships matter less
– Willingness to take the risk and go with less-known API sources
• Supply– Overcapacity in manufacturing
– Record number of DMF filings
– Availability of low-cost APIs from India and China
• (Too?) many plants FDA approved
• Many companies hold COSSource: Newport Strategies’ Horizon Global system
Number of U.S. DMFs
Indian DMF's
2001 2002 2003 2004 2005
580639
772
900
992
0
200
400
600
800
1,000
Num
ber
of
DM
Fs

COPING STRATEGIES
• Consolidation
• Geographic diversification
• Backward integration into API
• Sourcing from India, China, and other low-cost countries
• Alliances with companies in low-cost countries
• Moving manufacturing to low-cost countries
• Focus on niche products

COPING STRATEGIES: CONSOLIDATION

• Likely to see a period of consolidation in pursuit of
– Top-line growth
– Opportunities in new markets
– Synergies
• Result: Industry will likely be dominated by a handful of global players plus many small players
• Barr’s rumored $2.1B acquisition of Pliva
– Biogenerics
• 2005 deal to develop a generic version of Amgen Inc.'s Neupogen
– New dose forms
– Presence in emerging markets
– API
COPING STRATEGIES: CONSOLIDATION

COPING STRATEGIES: GEOGRAPHIC DIVERSIFICATION• Opportunities in Europe
– Counterweight to the U.S. generics market
• DRL-Betapharm, Matrix-Docpharma, Ranbaxy-Terapia
– Competition among Indian companies driving up prices of companies
– Commoditization of German generic market?
• Japan
– Merck KgaA in Japan since 1998
– In November 2005, Ranbaxy increased equity stake in JV with Nippon from 10% to 50%
– In March 2006, Teva applied for approval to sell drugs in the Japanese market
– Dr. Reddy's considering setting up an office in Tokyo or Osaka by the end of next March

COPING STRATEGIES: BACKWARD INTEGRATION INTO API• Recent example: Watson - Sekhsaria
• Pros
– More control over cost and access to API
• Decreasing number of established API manufacturers still independent
– Different parts of the value chain may make money in different products
• Cons
– No one plant can make all APIs required by a typical generic
– Making just enough for captive use often not economical
– Other dose companies wary of buying API from a competitor

COPING STRATEGIES: MOVING MANUFACTURING AND R&D TO LOWER-COST COUNTRIES• Applies to both API and dose manufacturing
• Recent example: Watson– Acquired from DRL a small solid oral dose plant in Goa
– Increased investment in an FDA-approved Chinese/Taiwanese API manufacturer
• Sandoz – multiple units in India
• Teva – scientists in Faridabad, acquired Regent Drugs (JK)
• Apotex – manufacturing and R&D facilities in Bangalore
• Ratiopharm – R&D center in Goa
• Stada– “Complementation of existing Group-owned production sites in GER, NL,
and IRL by production sites in “Low Cost Countries” Russia, Vietnam (50:50 JV) and China (currently only local orientation)” (Stada Corporate Presentation 2006)

COPING STRATEGIES: ALLIANCES WITH INDIAN COMPANIES
• Zydus Cadila– Distribution agreement with Mallinckrodt
– 50/50 JV with Mayne for cytotoxic dose and APIs
• Glenmark– Development and supply agreement with KV for 8 ANDAs
– Agreement with Invagen for 7 products
– Deal with Konec for nitroglycerin and with Interpharm for naproxen
• Lupin– Injectable ceph generics with Baxter
– Oral ceph generics with Watson

COPING STRATEGIES: SOURCING FROM INDIA & CHINA• Many highly qualified API sources in India and China
• India– 68 FDA-inspected API manufacturing sites
– 33 FDA inspections in FY2005 (20 API, 7 Dose, 3 API/Dose, 3 Labs)
• 22 NAI (no action), 11 VAI (voluntary action), 0 OAI (official action)
• China– 69 FDA-inspected API manufacturing sites
– 15 FDA inspections in FY2005 (14 API, 1 repacker)
• 6 NAI, 9 VAI, 0 OAI
• Are FDA inspections in India and China less stringent?

• Generic companies’ willingness to use second- or third-tier API manufacturers is particularly damaging to Italian API manufacturers
COPING STRATEGIES: SOURCING FROM INDIA & CHINA
Source: Newport Strategies Horizon Global ™
ROW
Italy
China
India
Established Less Established Potential Future Local
157 182 195 1,059
0
20
40
60
80
100%
# o
f A
PI m
anufa
cture
rs

COPING STRATEGIES: FOCUS ON NICHE PRODUCTS
• Products with small sales no longer count as “niche”– Even $20M products attracting a lot of interest
• Margins in difficult formulations likely to remain higher– Inhaled products, certain injectables
• Biogenerics– Teva, Sandoz, Pliva
FUTURE
• Will focus on price backfire?
• Is the number of suppliers going to decrease enough to give the remaining players more negotiating power?
• What will be the impact of generic entries from China?

THANK YOU!
Kate Kuhrt
Director, Generics and API Intelligence
Thomson Reuters
215 Commercial Street
Portland, Maine 04101
USA
+ 1 (207) 871-9700 x26