Embed Size (px)
Citation preview

This research
http://www.ipa.co.uk/Document/Media-in-Focus-PDF#
• How is the changing media landscape altering the rules of effectiveness?
• 500 digital era cases, 120 in 2014/16

3 important truths
1. Effectiveness requires media and strategies that work over the short and long-terms: – The 60:40 effectiveness rule
2. Emotional campaigns and media drive long-term effectiveness
3. Mass marketing still rules effectiveness: scalability is essential for growth

1. Short and long-term effectiveness are different
You need to balance the two tasks

Sale
s u
plif
t o
ver
bas
e
Time Source: Binet & Field 2013
The deception of short-termism
Sales activation Short term sales uplifts
Brand building Long term sales growth
Short term effects dominate ~6 months

Short-term campaign’s sales effects
16
these factors have been isolated, meaning we can control for the price,
promotions, distribution, other media, competitor activity and seasonality to
make sure we can produce an unbiased measure of the social campaign showed
in Figure 14. By taking this volume uplift, applying an average price sold to get
revenue and then a margin, we get to a profit uplift. This can then be offset
against cost of the campaign to get to an ROI.
Figure 13: Total sales volume of Mattessons Fr idge Raiders May 2010-April 2013 showing all the
variables that had an effect on sales, Br ightBlue Consult ing, 2013
Figure 14: I solated sales volume of Mat tessons Fr idge Raiders against the MMM3000 campaign dur ing
the campaign period and after, Br ightBlue Consult ing, 2013

Specsavers: a long-term TV campaign
Source: Specsavers IPA case study 2014

Balancing brand and activation for best success
62
38
Very large share growth cases Channel share forbrand-buildingobjectives
Channel share foractivationobjectives
64
36
Most efficient cases
58 42
Strongest brand-building cases
64
36
Very large profit growth cases
Source: IPA Databank, 2016 cases

Short-termism has been rising
0%
5%
10%
15%
20%
25%
30%
2006 2008 2010 2012 2014 2016
% c
ase
s sh
ort
-te
rm
10 years ending Source: IPA Databank, 1998-2016 cases

61%
39%
Advertising spend split, 2000
Share of display
Share of directresponse
Source: Enders Analysis estimates based on AA/WARC
51% 49%
Advertising spend split, 2016
Activation levels have exceeded optimum
Advertising effectiveness-marketing and long-term business benefits [ May 2017]

Activation effects have been achieved at the expense of brand
0%
5%
10%
15%
20%
25%
30%
35%
40%
45%
2006 2008 2010 2012 2014 2016
% c
ase
s re
po
rtin
g ve
ry la
rge
e
ffe
cts
10 years ending
Activationeffects
Brandawarenessgrowth
Source: IPA Databank, 1998-2016 cases

Effectiveness has fallen
1,0
1,1
1,2
1,3
1,4
1,5
1,6
1,7
1,8
1,9
2,0
2006 2008 2010 2012 2014 2016
Nu
mb
er
of
very
larg
e b
usi
ne
ss
effe
cts
10 years ending Source: IPA Databank, 1998-2016 cases
2. Emotional campaigns and media drive long-term growth
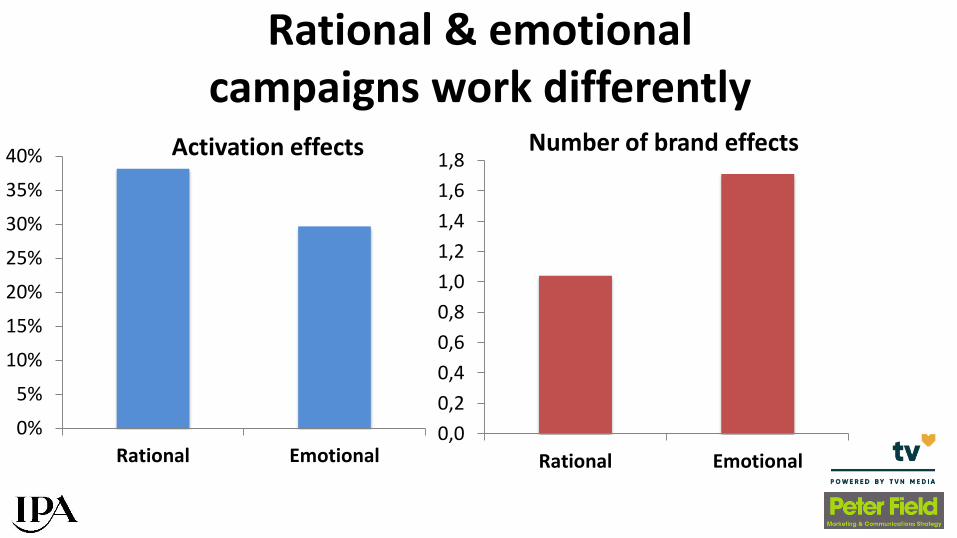
Rational & emotional campaigns work differently
0%
5%
10%
15%
20%
25%
30%
35%
40%
Rational Emotional0,0
0,2
0,4
0,6
0,8
1,0
1,2
1,4
1,6
1,8
Rational Emotional
Number of brand effects Activation effects

Emotional campaigns are most efficient
0,2
1,0
0,0
0,2
0,4
0,6
0,8
1,0
1,2
Rational Emotional
SOV
eff
icie
ncy
Source: IPA Databank, 2004-16 cases

Magazines
DRTV
Radio
Nat newspapers
Regional newspapers
TV
Inserts
OOH
Sponsorship
Cinema
PRDM
SMS
Promos
Social media
Online video
Online non-video
EmailPaid search
25%
35%
45%
55%
65%
75%
85%
1.1 1.3 1.5 1.7 1.9 2.1 2.3
% r
ep
ort
ing
very
larg
e a
ctiv
atio
n e
ffe
cts
Average number of very large brand effects reported
Emotive audio-visual media build brands
Source: IPA Databank 2008 - 2016
Rational information media
Emotive audio-visual media

Tech firms are turning to traditional media
UK adspend – 12 month rolling (Nielsen)

Emotional priming – Aldi UK

Aldi UK share growth
Figure 2 0 : Aldi Va lue M ark et Sha re Grow t h 2 0 1 1 vs. 2 0 1 0
Figures for the last quarter of the year show the campaign to still be gathering momentum with Aldi outperforming all other supermarkets.
Figure 2 1 : Aldi Va lue Sha re Grow t h vs Com pet it ors
Further we have evidence that the pattern of sales was responsive to the advertising, also explained in more detail in the econometrics section.

3. Mass marketing and media are essential to long-term growth

Targeting vs. Reach
0%
10%
20%
30%
40%
50%
60%
Ve
ry l
arg
e a
cti
va
tio
n e
ffe
cts
Targeting
Tight targeting drives short-term activation
0,0%
0,2%
0,4%
0,6%
0,8%
1,0%
1,2%
1,4%
1,6%
1,8%
2,0%
An
nu
al
mk
t. s
ha
re g
row
th
Targeting
Broad reach drives long-term growth
Source: IPA Databank, 2008-16 cases

Targeting vs. Reach
0%
10%
20%
30%
40%
50%
60%
70%
80%
Did use Did not useVe
ry l
arg
e a
cti
va
tio
n e
ffe
cts
Use of Big Data for real-time marketing
Real-time tight targeting drives short-term activation
0,0%
0,2%
0,4%
0,6%
0,8%
1,0%
1,2%
1,4%
1,6%
Did use Did not use
An
nu
al m
arke
t sh
are
gro
wth
Use of Big Data for real-time marketing
Broad early targeting drives long-term growth
Source: IPA Databank, 2014-16 cases
“We targeted too much, and we went too narrow…The bigger your brand, the more you need broad reach and less targeted media.”
Marc Pritchard, CMO P&G
Wall Street Journal, Aug. 17, 2016


Mark Ritson
“It’s called ‘social media’ for a reason: most Australians use it to connect with people not companies.”
Mark Ritson, Financial Review 10/4/13

John Lewis market share
22%
23%
24%
25%
26%
27%
28%
29%
30%
FY 2008 FY 2009 FY 2010 FY 2011 FY 2012 FY 2013 FY 2014 FY 2015 FY 2016
Shar
e o
f d
ep
artm
en
t st
ore
sal
es
'Man on the Moon' 'Monty
the Penguin'
'Bear &
Hare' 'The Journey'
'The Long Wait'
Source: John Lewis IPA case study 2016

Scalability of TV vs. Online video: John Lewis
Media effectiveness and efficiency
XmasTV
viewsOnline Views
Total views
John Lewis spend
Cost per view
2012 403m 3m 406m £3.9m 1.0 pence
2013 426m 12m 437m £4.6m 1.1 pence
2014 371m 29m 400m £3.9m 1.0 pence
2015 1,175m 35m 1,210m £4.1m 0.3 pence
Total 2,375m 79m 2,453m £16.5m 0.7 pence
All adult views for Christmas video advertising.Sources: BARB, YouTube, Facebook, Twitter, Manning Gottlieb OMD
TV views include supplier funded ads.

TV is best for market share growth
1,1%
1,8% 2,1%
2,6%
0,0%
0,5%
1,0%
1,5%
2,0%
2,5%
3,0%
No TV TV sponsorship DRTV Brand TV
Avg
. mar
ket
shar
e p
oin
ts
gain
ed
pe
r an
nu
m
Source: IPA Databank, 2014-16 cases

TV has become more effective
27%
40%
0%
5%
10%
15%
20%
25%
30%
35%
40%
45%
1998-2006 2008-2016
% in
cre
ase
in a
vg. n
o. V
L b
usi
ne
ss e
ffe
cts
fro
m a
dd
ing
Source: IPA Databank

Online video makes TV more effective
2,6%
3,1%
1,1%
0,0%
0,5%
1,0%
1,5%
2,0%
2,5%
3,0%
3,5%
TV only Both Online video only
Avg
. mar
ket
shar
e
gain
pe
r an
nu
m
Source: IPA Databank, 2014-16 cases

TV consistently outperforms online video across 2017 research studies
2.4 x 2.6 x
2.4 x
0,0
0,5
1,0
1,5
2,0
2,5
3,0
Share growth - IPA Short-term sales - KarenNelson-Field
Long-term ROI -Ebiquity/Gain Theory
TV p
erf
orm
ance
vs.
On
line
vid
eo
Sources: IPA Databank ‘Media in Focus’ , Professor Karen Nelson-Field PhD ‘Media Attributes that (really) Matter’ , Ebiquity ROI campaign database & Gain Theory ‘Profit Ability: the business case for advertising’

Conclusions • Short-termism damages effectiveness: we need to ensure balance
between long & short term objectives. Remember the 60:40 rule.
• TV reigns supreme for long-term effectiveness and can be a powerful short-term activation medium.
• The unique power of TV derives from its ability to stir emotions and build fame for brands.
• The broad reach and scalability of TV is important to long-term brand success.
• Narrow-targeting is seductive in the short term but underperforms in the long term.
• TV is getting more effective, not less. Thank you

The Truth about Effectiveness: TV still works best