Embed Size (px)
Citation preview

A Work Project, presented as part of the requirements for the Award of a Master Degree in Economics / Finance / Management from the NOVA – School of Business and Economics.
AB INBEV EQUITY RESEARCH – THE SLEEPY CHAMPION
NAME: FRANCISCO GRADÍSSIMO TEIXEIRA DE BRITO & NUMBER: 26135
A Project carried out on the Master’s in Finance Program, under the supervision of:
Professor Francisco Martins
04/01/2021

Abstract This work project is part of a consolidated report named “AB InBev Equity Research”. The aim of this work project is to do a valuation of the company AB InBev which is the biggest player in the beer market. With the increase of craft beer and premium brands in the company portfolio,
synergized with the possible economies of scale in these segments we expect the company ROIC to increase. We also debate that the company beta is higher than what it should be comparing to its main competitor. All together we estimated a price above what it is now.
Keywords AB InBev
Craft Beer Margins Beta
This work used infrastructure and resources funded by Fundação para a Ciência e a Tecnologia (UID/ECO/00124/2013, UID/ECO/00124/2019 and Social Sciences DataLab, Project 22209), POR Lisboa
(LISBOA-01-0145-FEDER-007722 and Social Sciences DataLab, Project 22209) and POR Norte (Social Sciences DataLab, Project 22209).

This report is part of the … report (annexed) and should be read has an integral part of it.

Table of Contents
EMEA......................................................................................................................... 5
▪ Market Overview.............................................................................. 5 ▪ AB InBev............................................................................................ 6
ASIA PACIFIC.............................................................................................................. 7 ▪ Market overview............................................................................... 7 ▪ AB InBev............................................................................................ 8
RISKS.......................................................................................................................... 8 ▪ COVID-19.......................................................................................... 8 ▪ Debt .................................................................................................... 9
VALUATION ......................................................................................... 10
APV & CAPITAL STRUCTURE.................................................................................10 ▪ Risk free...........................................................................................10 ▪ Market risk premium .....................................................................10 ▪ Cost of debt.....................................................................................11 ▪ Company risk..................................................................................11 ▪ Growth..............................................................................................12 ▪ ROIC.................................................................................................12 ▪ Enterprise value .............................................................................13 ▪ Equity value ....................................................................................13 ▪ Scenario analysis ..........................................................................13 ▪ Comparables ..................................................................................14
RECOMMENDATION .................................................................................................15

EMEA
▪ Market Overview
From Statista we can see that the total beer volume for EMEA, in 2019, was 63,8 billion litres of
beer. The market size in value of 2019 was around $200 billion and we expect to see a market
size of around $270 billion by the end of 2025, not only due to the increase in volume (in Africa
due to the increase in the population above 15 years old) but also due to the increase of the
premiumisation of the sector and craft beers, especially in Europe.
Regarding Europe, the overall volume of beer consumption has been decreasing and we do not
expect it to go back to 2019 levels (49,2B litres). We believe that there will be a decrease in volume
in the next years (48B litres by the end of 2025) due to a shif t in consumer preferences towards
spirits, healthier alternatives, and the increasing trend in craft beer. In accordance with our view,
EFMP1 states that “In recent years, this trend (healthy) has had the most significant impact on the
alcohol industry. Not only has the pursuit of a healthy lifestyle resulted in a decline of alcohol...”.
AB InBev is in the no-alcohol and low-alcohol beer which is expected to have a CAGR of 7,5%
until 2025. In the UK (biggest no-alcohol beer market) Heineken 0.0 is the top player and it is
expected to continue in the following years. Budweiser is the second biggest player with half the
sales which is still in a good position to capture the growth in this market.
Another trend in most mature beer markets is that consumers are decreasing their average
consumption in volume but thy have increased their average spending on beer. “Premium and
Super premium brands are driving growth as consumers are increasingly “drinking less but drinking
better” and this trend is generally occurring in Europe”2. Market Data Forecast predicts that the
global craft beer market size in 2025 will be $187B which will represent around 20% of the whole
beer market in comparison to the 16% as of today. We agree with this view since we believe that
this trend will remain in the future as customers keep wanting to try new flavoured beers that keep
growing at a higher pace than the market. Another trend is the increase in the premium and super
premium segment representing more than 50% of the overall market in Europe and the trend is
expected to continue. Overall, the 3 main players are Heineken, Carlsberg, and AB InBev.
Heineken has a market share of around 34%, Carlsberg 11% and AB InBev 10% Being Europe a
mature market, we do not expect these shares to change dramatically.
In Africa, the beer market is the fastest-growing market in the world. In terms of value, it almost
doubled from 2012 ($18B) to 2019 ($35B) and it is expected to be $71B in 2025 which means it is
expected to double again in 5 years. This huge growth comes mainly from 2 factors which are, the
increase in the target population (age above 15) due to the big natality rate African countries had
in the last years and from the increase in disposable income which is strongly correlated with beer
consumption especially in low-level income individuals3. We expect the premiumisation trend in
this market to be almost irrelevant given the smaller percentage of people available to afford it. In
Africa, the value-for-money segment is still king, and we also believe breweries will position
themselves to capture the expected growth in the market mainly driven by the volume increase.
Due to SAB Miller acquisition, AB InBev is the biggest player in the African market with a predicted
market share of 40%, with a 20% stake in Castel which is the second biggest player with 25%
1 EFMP, 2018,” What is influencing alcohol trends in Europe?”, EMFP, Accessed 5 November, https://www.efmp.com/articles/what-is-influencing-alcohol-trends-in-europe/
2 DeGeorge, Patricia, 2020, Beer industry’s evolution in the developed and emerging markets, Accessed 10 November 3 DeGeorge, Patricia, 2020, Beer industry’s evolution in the developed and emerging markets, Accessed 10 November
-15%
-10%
-5%
0%
5%
10%
50 000
52 000
54 000
56 000
58 000
60 000
62 000
64 000
66 000
2017A 2018A 2019A 2020E 2021E 2022E 2023E 2024E 2025E
Volumes Growth
Market Beer Volume
[2016A-2019A] 0,5%
[2020E-2025E] 2,7%
[2026E-2031E] 0,5%
Figure 46 –Beer volumes in EMEA
source: Statista; own estimates
Figure 47 – Beer market growth in EMEA
source: Statista, own estimates
Figure 48 – Europe market share by volumes in 2019
source: Euromonitor
Figure 49 –Africa market share by volumes in 2019
source: Euromonitor
40%
25%
18%
0% 10% 20% 30% 40% 50%
AB InBev
Castel
Heineken
34%
11%
10%
0% 5% 10% 15% 20% 25% 30% 35% 40%
Heineken
Carlsberg
AB InBev
market share and f inally Heineken comes third with 18%. There are some rumours about AB InBev
acquiring Castel, but we do not believe it will happen at least any time soon. The financial situation
the company is in would not allow for more acquisitions since they are more focused on going
back to lower levels of debt in the next years. AB InBev experienced a big investment from
Heineken to grow in the African beer market, which we consider that will keep on going, making
AB InBev lose some market share as another big brand will have the ability to compete with AB
InBev in this value-for-money market.
In the Middle East, AB InBev is only present in Israel and the United Arab Emirates. The
information about these markets is scarce but we also believe the revenue coming from these two
countries to be immaterial so we will not go deeper into the analysis. We expect AB InBev to only
invest in these markets if some cultural factors change since the culture of these countries does
not set them as strong potential growth markets. Since we do not expect it to happen, we will focus
on Africa and Europe and consider that the Middle East will not change our analysis.
▪ AB InBev
The company reported a revenue of $7,9 billion (15,1% of total revenue) and a $2,8 billion
normalized EBITDA (13,2% of total EBITDA) in 2019. From the 2019 annual report, AB InBev
volume sold 8,6 billion litres reaching a volume market share around 13,5%.
In Europe, AB InBev has a well-positioned portfolio to tackle the craf t beer and premiumisation
trend. Although data is hard to find, we believe AB InBev is the number one player in craft beer in
the world. AB InBev has been acquiring craft breweries being the most relevant, in Europe,
Bosteels Brewery (f lagship brand Triple Karmeliet but also Kwak) and Ginette Brewery which not
only goes in line with the craft trend but also the healthy trend because of the brand focus on the
use of organic products. Also, with the successful launch of Budweiser, in France and in the
Netherlands, Budweiser became the fastest growing brand in Europe. In the UK, Corona beer
continues with a double-digit growth.
Regarding the profitability, this launch of Budweiser in Europe and the increased focus on the no-
alcohol beer market, the company will need an increased investment in marketing and distribution
channels which will decrease margins in the next years. Also, the changes in the channel mix,
mainly due to COVID-19 (on-trade to off-trade), will slow down the increase in the price per L which
will also af fect the margins in the next 3 years. Af terwards, we believe in a margin increase
because of the increased demand for the high-end products of the company which has higher
margins than the value-for-money ones.
In Africa, we expect the company to lose some market share to Heineken, but the overall revenues
will increase due to the fast-growing African beer market. We estimate AB InBev to still be number
one in this market in the future given the big difference it has to the second biggest player (Castel).
Regarding profitability, AB InBev might need to invest in marketing to f ix its brand and not lose
more market share than what is expected to lose. This will harm the margin because of this
investment in marketing but also due to the probability of price decrease due to an increase in
competition.
All in all, in EMEA, we expect volumes to decrease in the next 5 years at -0,2% CAGR due to
Covid-19 impacts and Europe healthier trends. This decrease was partly offset by the increase in
volume in the African beer market. This reduction in beer volumes and loss of AB InBev market
share mainly in the African market will lead to a smaller volume sold in EMEA which we expect to
-40%
-20%
0%
20%
40%
60%
80%
0
2 000
4 000
6 000
8 000
10 000
12 000
2017A 2018A 2019A 2020E 2021E 2022E 2023E 2024E 2025E
Revenues growth
0,0
0,2
0,4
0,6
0,8
1,0
1,2
0
2 000
4 000
6 000
8 000
10 000
12 000
14 000
2016A 2017A 2018A 2019A 2020E 2021E 2022E 2023E 2024E 2025E
Volumes Price per L
AB InBev Revenues
[2016A-2019A] 9,6%
[2020E-2025E] 8,4%
[2026E-2031E] 2,0%
Figure 50 – AB InBev revenues in EMEA
Source: Company’s report, own estimates
50%
51%
52%
53%
54%
55%
56%
57%
58%
59%
60%
2016A 2017A 2018A 2019A 2020E 2021E 2022E 2023E 2024E 2025E
Figure 51 – AB InBev revenues growth in EMEA
source: own estimates
Figure 52 – AB InBev volumes and price per liter in EMEA source: Company’s Report; own estimates
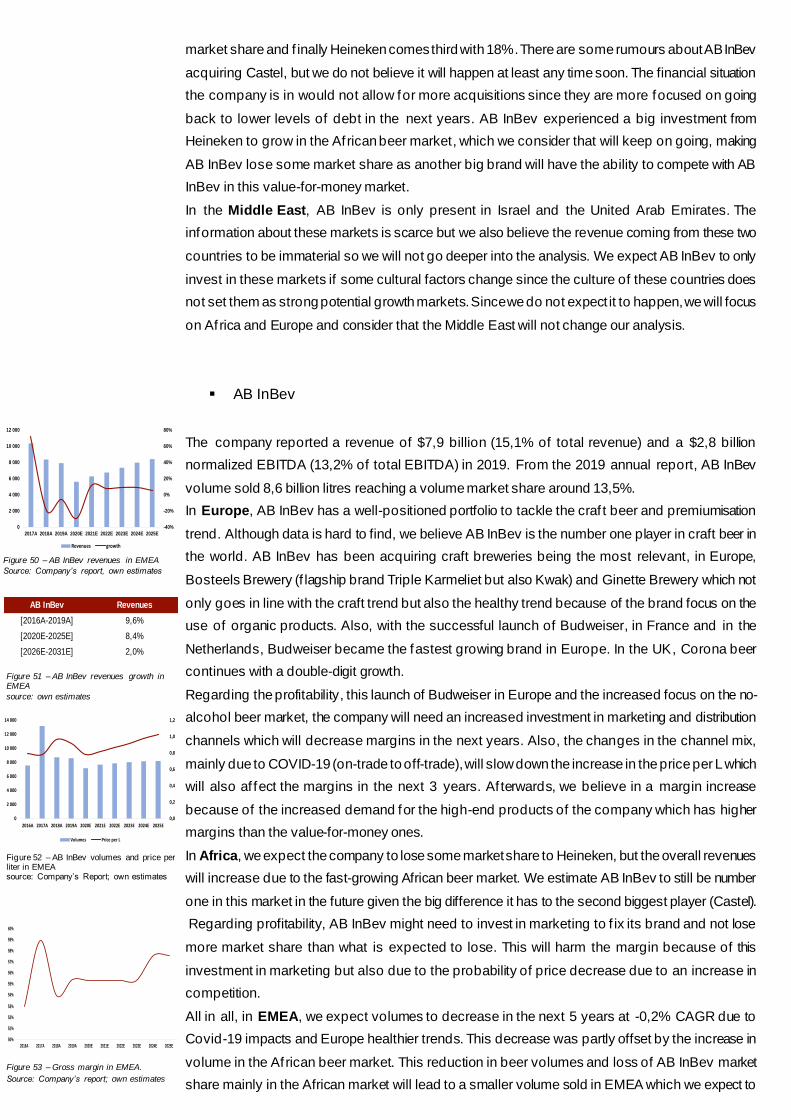
Figure 53 – Gross margin in EMEA.
Source: Company’s report; own estimates

be 8,2B litres in 2025. Regarding the price per L, we expect it to increase by 1,6% CAGR from
2019 to 2025. This increase will more than of fset the decrease in volumes making revenues
increase up to $8,4B in 2025. Regarding profitability, we expect a decrease as percentage of
revenues f rom COGS due to a shif t towards premiumisation sector and craf t beers in Europe.
There will also be a decrease in the margins until 2023 due to COVID-19 effects that will make the
company sell more to the off-trade segment which has lower margins than the on-trade. We expect
AB InBev to increase its marketing efforts catch up with the growth of the high-end sector in Europe
and to be able to keep a leading position in Africa now with Heineken investing more in this market.
This will hurt the operation margin from 2020 to 2023 and after we forecast to come back to recent
values as a percentage of sales making the operating margin higher than what it is right now
(22,8% in 2019 to 26,1% in 2026 onwards).
Asia Pacific
▪ Market overview
From Statista we can see that the total beer volume for Asia Pacific in 2019 was 66,8 billion litres.
The market size in value of 2019 was around $190 billion and we believe that this segment is a
great opportunity for the company to grow because it is still f ragmented with no big leader in the
market. China Resources Holdings has 17% of the market, AB InBev is the second with 14% and
in third place comes Tsingtao with 11%. We expect to see a market size of around $230 billion by
the end of 2025 not only by the increase in volume but mainly due to the increase of the
premiumisation in the sector, especially in China.
China is the biggest beer market in the world with 42,6 billion litres in 2019 representing 22% of
the world beer volume and 64% of the APAC region. China is undergoing a trend of premiumisation
of the sector. Based on Nielsen data4 “…we can see that with the rapid growth of disposable
personal income, the rise of the taste have emerged rapidly in China. They prefer superior quality,
premium products, and are increasingly willing to spend money on premium products.”. Another
factor to consider is the increase in urbanisation (movement of people away from the rural areas
towards urban areas) in the country. Where in 2010 was around 45% and in 2030 is expected to
be up to 60%5 leading people into the more premium markets. We believe that this premiumisation
of the market will keep on growing over the next 5 years.
Another important segment to mention is the craft beer which it is still a small percentage (around
1%) of the Chinese beer market. This could be a good opportunity for companies to explore since
we expect to have the same growth that the US and Europe had roughly seven years ago (20%
CAGR). AB InBev entered this market really early and it is now the biggest craft player in China
with the brand Goose Island. They have found a loophole in legislation that can give them
competitive advantage over local breweries since for these smaller breweries to be able to
distribute their beer all over the country they must produce over 12 000 bottles an hour, otherwise
they must sell it locally, but since AB InBev imports its craf t beer this does not apply to the
company. That way they can distribute the beer all over China with less competition. In the overall
Chinese beer market, China resources holdings is still king with a 26% market share, followed by
Tsingtao brewery at 17% and in the third place comes AB InBev with 16%.
4 Nielsen, 2019, “61% OF CHINESE CONSUMERS CHOOSE PREMIUM PRODUCTS BECAUSE OF SUPERIOR QUALITY”, Nielsen, Accessed 10 November,
https://www.nielsen.com/cn/en/insights/article/2019/61-percent-of-chinese-consumers-choose-premium-products-because-of-superior-quality/ 5 Seto, Karen, 2013, “What Should We Understand about Urbanization in China?”, Yale insights, Accessed 10 November, https://insights.som.yale.edu/insights/what-should-we-understand-about-
urbanization-in-china
-20%
-15%
-10%
-5%
0%
5%
10%
15%
0
10 000
20 000
30 000
40 000
50 000
60 000
70 000
80 000
2017A 2018A 2019A 2020E 2021E 2022E 2023E 2024E 2025E
Volumes growth
Market Beer Volume
[2016A-2019A] 0,0%
[2020E-2025E] 4,2%
[2026E-2031E] 1,1%
Figure 55 –Beer volumes in Asia Pacific
source: Statista; own estimates
Figure 56 – Beer market growth in Asia Pacific
source: Statista, own estimates
Figure 57 –China market share by
volumes in 2019
source: Euromonitor
Figure 58 –Asia market share by volumes in 2019
source: Euromonitor
26%
17%
16%
0% 5% 10% 15% 20% 25% 30%
China Resources Holdings
Tsingtao
AB InBev
17%
14%
11%
0% 5% 10% 15% 20%
China Resources Holdings
AB InBev
Tsingtao
0%
5%
10%
15%
20%
25%
30%
2016A 2017A 2018A 2019A 2020E 2021E 2022E 2023E 2024E 2025E
Figure 54 – Operating margin in EMEA.
Source: Company’s report; own estimates

Regarding the 3 other countries, there are some differences because in South Korea, the company
strategy will be in line with China, although we estimate the increase in the premium and craft beer
segments to be lower than in China because the premium sector is already big in Korea. Being
India and Vietnam considered less developed than the other 2 the strategy will be dif ferent.
Vietnam is the country in Asia that has the highest consumption per capita (48L compared to the
15L average in Asia) and it is expected to continue to grow both in terms of per capita and target
population. Like in Vietnam, India beer market is expected to almost double in value by the end of
2025 both by the increase in volume but also by the increase in prices.
▪ AB InBev
The company reported a revenue of $6,5 billion (12,5% of total revenue) and a $2,3 billion
normalized EBITDA (10,9% of total EBITDA) in 2019. From the annual report, AB InBev volume
was 9,3 billion litres making the company market share in volume around 14%.
In China, the company is well positioned to capture the growth in the premium and super premium
market, and we believe in an increase in price per L of 2,4% annually f rom 2019 to 2025. In this
market, AB InBev has Budweiser as number one in the premium sector and we estimate that
Corona is the number one brand in the super premium segment. Besides Corona, the company
has 2 other super premium brands that are also growing at mid-single digits which are Hoegaarden
and Blue Girl. Being the latter the fastest-growing super premium brand. This trend will be in the
country for more than 5 years since when compared to its neighbours Taiwan and Hong Kong,
China’s premium beer sector is still at a lower percentage compared to the total market which
makes us believe there is room for growth. This trend will be partly offset by the change in the mix
in the next 3 years because of COVID-19 (On-trade to Off-trade). All in all, we expect the company
volume market share to remain constant (the big increase in volume in Vietnam and India will offset
the slight decrease in China and South Korea).
Regarding profitability, the strategy is top line driven and the company will require some marketing
expenses to get the increasing percentage of the premium and craft sector. We believe the focus
will be during the next 3 years. Due to that, the operation margin of the sector will decrease in the
next years but in the following years, the operation margin will increase (f rom 22,2% in 2020 to
24,4% from 2024 onwards) due to the marginal cost of doing premium and super premium beer
being lower than the increase in marginal revenue.
Risks
In our valuation we make estimations for the company’s future cashflows, and as always,
estimations are uncertain and therefore risky. In this section we highlight the impact of Covid-19
and the actual company’s capital structure, which we considered that could negatively impact AB
InBev’s intrinsic value.
▪ COVID-19
In 2020 the economy is under a lot of pressure with all the constraints due to COVID-19. The beer
segment is deeply exposed to several demand-side risks and will be depressed in the short term.
Figure 59 – AB InBev revenues in Asia
Pacific.
Source: Company’s report; own estimates
Figure 60 – AB InBev revenues growth in Asia Pacific
source: own estimates
Figure 61 – AB InBev volumes and price per liter in Asia Pacific.
source: Company’s Report; own estimates
-20%
-15%
-10%
-5%
0%
5%
10%
15%
20%
25%
30%
35%
0
1 000
2 000
3 000
4 000
5 000
6 000
7 000
8 000
9 000
2017A 2018A 2019A 2020E 2021E 2022E 2023E 2024E 2025E
Revenues growth
AB InBev Revenues
[2016A-2019A] 2,5%
[2020E-2025E] 9,0%
[2026E-2031E] 2,6%
Figure 62 – Gross margin in Asia Pacific.
Source: Company’s report; own estimates
0,0
0,1
0,2
0,3
0,4
0,5
0,6
0,7
0,8
0,9
0
2 000
4 000
6 000
8 000
10 000
12 000
2016A 2017A 2018A 2019A 2020E 2021E 2022E 2023E 2024E 2025E
Volumes Price per L
0%
5%
10%
15%
20%
25%
30%
2016A 2017A 2018A 2019A 2020E 2021E 2022E 2023E 2024E 2025E
53%
54%
55%
56%
57%
58%
59%
60%
2016A 2017A 2018A 2019A 2020E 2021E 2022E 2023E 2024E 2025E
Figure 63 – Operating margin in Asia Pacific.
Source: Company’s report; own estimates
In our valuation, we had in consideration all the restrictions forecasting the revenues and the
operating margins in the af fected regions, in 2020-2023. We considered that is very complex to
understand a unique incident as a pandemic and that creates a risk that the economy can change
rapidly and unexpectedly. We also believe that the pandemic can last much longer in markets with
less access to the future vaccine, and that could define the worst scenario in those economies.
We analyzed the possibility of COVID-19 having a longer impact, and its impact on AB InBev’s
share price. For that, we analyzed the share price deviation impacted by changes in the revenues
forecast, if the consequences of the pandemic continued for more one year and in the worst
scenario for two more, until 2023. The share price in the first scenario decreases around 5,5% and
in the worst scenario is impacted by -11,1% compared to our share price estimation. With this
scenario analysis we conclude that constraints due to the pandemic can easily have a huge impact
in the company’s value and for that reason we considered it to be a critical risk for investors.
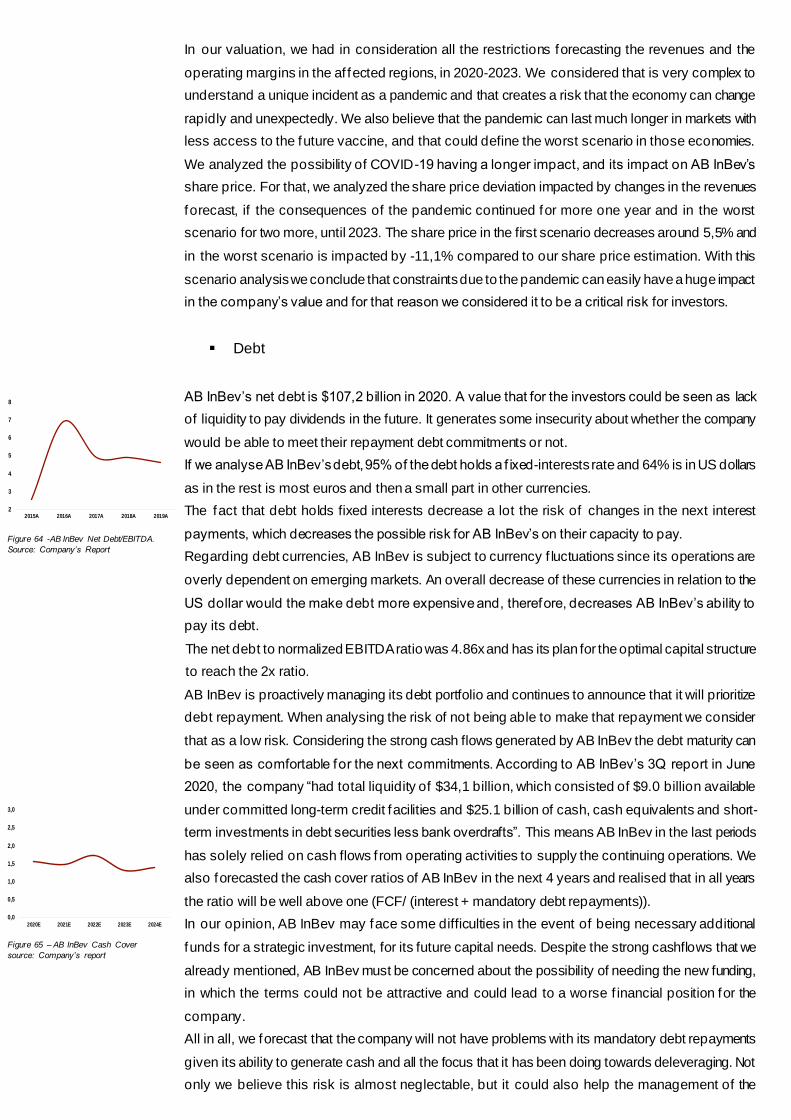
▪ Debt
AB InBev’s net debt is $107,2 billion in 2020. A value that for the investors could be seen as lack
of liquidity to pay dividends in the future. It generates some insecurity about whether the company
would be able to meet their repayment debt commitments or not.
If we analyse AB InBev’s debt, 95% of the debt holds a f ixed-interests rate and 64% is in US dollars
as in the rest is most euros and then a small part in other currencies.
The fact that debt holds fixed interests decrease a lot the risk of changes in the next interest
payments, which decreases the possible risk for AB InBev’s on their capacity to pay.
Regarding debt currencies, AB InBev is subject to currency f luctuations since its operations are
overly dependent on emerging markets. An overall decrease of these currencies in relation to the
US dollar would the make debt more expensive and, therefore, decreases AB InBev’s ability to
pay its debt.
The net debt to normalized EBITDA ratio was 4.86x and has its plan for the optimal capital structure
to reach the 2x ratio.
AB InBev is proactively managing its debt portfolio and continues to announce that it will prioritize
debt repayment. When analysing the risk of not being able to make that repayment we consider
that as a low risk. Considering the strong cash flows generated by AB InBev the debt maturity can
be seen as comfortable for the next commitments. According to AB InBev’s 3Q report in June
2020, the company “had total liquidity of $34,1 billion, which consisted of $9.0 billion available
under committed long-term credit facilities and $25.1 billion of cash, cash equivalents and short-
term investments in debt securities less bank overdrafts”. This means AB InBev in the last periods
has solely relied on cash flows f rom operating activities to supply the continuing operations. We
also forecasted the cash cover ratios of AB InBev in the next 4 years and realised that in all years
the ratio will be well above one (FCF/ (interest + mandatory debt repayments)).
In our opinion, AB InBev may face some difficulties in the event of being necessary additional
funds for a strategic investment, for its future capital needs. Despite the strong cashflows that we
already mentioned, AB InBev must be concerned about the possibility of needing the new funding,
in which the terms could not be attractive and could lead to a worse f inancial position for the
company.
All in all, we forecast that the company will not have problems with its mandatory debt repayments
given its ability to generate cash and all the focus that it has been doing towards deleveraging. Not
only we believe this risk is almost neglectable, but it could also help the management of the
2
3
4
5
6
7
8
2015A 2016A 2017A 2018A 2019A
0,0
0,5
1,0
1,5
2,0
2,5
3,0
2020E 2021E 2022E 2023E 2024E
Figure 64 -AB InBev Net Debt/EBITDA.
Source: Company’s Report
Figure 65 – AB InBev Cash Cover
source: Company’s report

company to have more discipline in the ways it uses the company resources.
Valuation
Given AB InBev’s current share price of $69,91 we believe that the stock is undervalued, and it is
a great investment opportunity. From our intrinsic valuation, we got a share price of $105,79
considering our scenario analysis. Generating total 12-months returns of 55% with our valuation
accounting for dividends.
APV & Capital Structure
We reached an intrinsic share price of $108,49 using the adjusted present value (APV) method.
We believe this is the right method given the huge changes in AB InBev’s capital structure. Since
the acquisition, the company reached really high levels of net debt to enterprise value with an
average of around 40% debt to enterprise value f rom 2016 to 2019. Given that before the
acquisition the company used to have levels of 20% debt to enterprise value in line with its main
competitor Heineken. AB InBev management mentioned in the 2019 annual report that they have
the objective to have its net debt to EBITDA ratio equal to 2 (4,6 in 2019). From this statement
and the continuous efforts towards deleveraging, we believe there will be some major capital
structure changes in the following years. The company has been reducing its debt since 2016
f rom $115,5B to $96,8B in 2019 and we believe this trend will continue until it reaches a debt to
enterprise value similar to what it used to have prior to this acquisition. For that reason, we predict
that until 2027 the company will have a debt to enterprise value of 20% more in line with its peers
and following their objective of having a net debt to EBITDA ratio of 2, they will keep deleveraging
until 2030 with a Net Debt to EBITDA at around 2,2. Regarding the calculation of the share price
using the APV, we had to estimate the following steps to have a reasonable discount rate for the
company.
▪ Risk free
We had to estimate the risk-free so that we could use CAPM. We used the 10 years US
treasury bond yield (0,93%) because we believe it to be the best proxy to the risk-free.
▪ Market risk premium
Regarding the market risk premium (MRP), we based ourselves on a KPMG paper that states
that the MRP should range between 6,5% and 7%. Therefore, we will use 7% as the value for
MRP given the higher returns investors ask due to the volatility in the markets nowadays.
0
1
2
3
4
5
6
7
8
jun/1
4
set/1
4
de
z/1
4
ma
r/1
5
jun/1
5
set/1
5
de
z/1
5
ma
r/1
6
jun/1
6
set/1
6
de
z/1
6
ma
r/1
7
jun/1
7
set/1
7
de
z/1
7
ma
r/1
8
jun/1
8
set/1
8
de
z/1
8
ma
r/1
9
jun/1
9
set/1
9
de
z/1
9
ma
r/2
0
jun/2
0
AB InBev Heineken
0%
5%
10%
15%
20%
25%
30%
35%
40%
45%
50%
jun/1
4
ou
t/14
fev/1
5
jun/1
5
ou
t/15
fev/1
6
jun/1
6
ou
t/16
fev/1
7
jun/1
7
ou
t/17
fev/1
8
jun/1
8
ou
t/18
fev/1
9
jun/1
9
ou
t/19
fev/2
0
jun/2
0
AB InBev Heineken
Figure 66 – D/EV AB InBev vs Heineken
Source: Companies reports
Figure 67 – D/EBITDA AB InBev vs Heineken Source: Companies reports

▪ Cost of debt
The cost of debt was estimated by subtracting the company probability of default times the loss
given default f rom the yield of the company bonds. We analysed the company bonds and decided
to take into consideration one with a long duration and that represents a good portion of the debt.
The bond is senior unsecured with its maturity in 2029 and its outstanding amount is $ 4,25B. We
used Bloomberg and the yield that the bond has is 1,56%. Also, its credit rating is Baa1 from
Moody’s, BBB+ f rom S&P, and BBBu f rom f itch. We used Moody’s table to get the cumulative
probability of default (1,87%) and divided it by the 9 years lef t to maturity to get the annualised
default probability. From Moody’s we also got the loss given default from senior unsecured bonds
(46,1%). After this, we reached a cost of debt of 1,47% (rd=YTM-(Default prob annualized)x(Loss
given default).
▪ Company risk
To calculate the company incremental risk and correlation with the market we estimated its
expected beta. To do so we based ourselves on the movement of the stock in relation to the
market and one of its peers.
Af ter analysing AB InBev ’s peers we realized that the only peer to have similar geography
diversity and size is Heineken. The other peers lack in both aspects so we do not think they would
be a good comparable to the company operational risk. Although it is still not a perfect
comparable, given that AB InBev is 3 times its size and its percentage of operations in emerging
markets is far greater than Heineken (60% compared with 30%), we believe that it still is a good
comparable. Therefore, to estimate our beta we run a regression using the companies’ returns
and the market returns (We used the S&P as we believe it is a fair proxy to the market). These
regressions were made with weekly returns over the last 104 weeks (2 years). From that, we got
both levered betas from each company. AB InBev with a levered beta of 1,55 and Heineken with
a levered beta of 0,78. At first glance, it is a big difference given that the companies operate in
the same industry. To better understand this difference, we unlevered both betas since Heineken
capital structure is different. From that, we reached an unlevered beta of 1 for AB InBev and an
unlevered beta of 0,65 for Heineken. The difference was smaller, but we still do not think the true
unlevered beta for AB InBev to be so different from its main competitor.
Next, to try to understand both companies’ betas we did the 104 weeks rolling betas from 2017
to 2020 where we could see that AB InBev almost always had a higher levered beta, but the
biggest difference happens af ter COVID-19 started (mid-March) when both companies beta
increased, although AB InBev increased almost exponentially. We understand that part of this big
increase was due to its huge amount of debt outstanding but af ter unlevering the betas we
realized that debt did not explain the whole increase, and this is where we believe the market is
overestimating the risk making the stock beta higher than what it should be. To confirm our view,
we calculated the median of the 104 weeks rolling betas for each company and reached a value
of 0,98 and 0,69 for AB InBev and Heineken, respectively. We can see that the difference is much
smaller, and it is even smaller after unlevering these medians, where we got values of 0,64 and
0,57, respectively. For the reasons mentioned above we believe that the fair unlevered beta of
0,00
0,20
0,40
0,60
0,80
1,00
1,20
1,40
1,60
1,80
AB InBev Heineken
YTM 1,56%
Comulative default prob 1,87%
Recovery Rate 53,9%
Loss Given Default 46,1%
Maturity 9
Default Prob Annualized 0,21%
Rd 1,47%
Rd Calculation
Figure 69 – Levered 104 weeks rolling
betas from AB InBev and Heineken
Source: Bloomberg and own estimates
Figure 68 – rd calculations
Source: Bloomberg and own estimates

the company should be the average of the unlevered betas of the last 104 weeks f rom both
companies, which gave us a value of 0,82. We consider this is the right approach because we
see no reason for the unlevered beta of AB InBev to be so much higher than Heineken (although
we understand it is not the same due to higher exposure to emerging markets). After this, to get
the unlevered discount rate we used CAPM to reach a value of 6,70% (ru=rf+bu*MRP) that is
above the average of peers as we were expecting given that the company has a higher
operational risk. This higher discount is mainly due to the fact that a big part of its operations
occurs in countries with higher uncertainty. We will use this value to discount both the cash flows
and the tax shields since we believe the tax shields will grow in line with the company.
▪ Growth
A company in the long term can generate growth f rom three different sources: portfolio
momentum, market share performance and mergers, and acquisitions6. Regarding AB InBev’s
growth, we expect to be generated by portfolio momentum, based on organic revenue growth
with the overall expansion in the market segments. AB InBev has segments in fast -growing
markets such as Brazil, Mexico in the American segment and Vietnam and India for the Asia
segment. We expect that AB InBev maintains its market share since we forecast that the in long
term, markets will be more mature and saturated being very difficult to grow more than the market
itself . Antitrust issues due to the volume of M&A activity in this market make it practically
impossible to continue a strategy of accreditive M&A. Thus, we do not foresee any significant
deal by AB InBev. We expected a final perpetual growth rate of 2,85% which we think to be a fair
value of the growth for the beer market. We consider that almost all markets will tend to mature
which will make the market growth to stabilized in line with the long-term nominal worldwide GDP
growth.
▪ ROIC
AB InBev ROIC has been around 7% over the past years but we believe it will increase given its
shif t to more premium beer and craf t beer. We did an analysis that includes AB InBev,
Constellation Brands, and Boston Beer Company. Constellation Brands sells mainly premium
beer like Corona and Boston Beer Company sells craf t beer being the second largest craft
brewery in the US. Due to the company focus on these segments we analysed these companies
ROIC in the last 3 years. The f irst one had ROICs of 10,7%, 12,5%, and 9,1%, the second had
ROICs of 22,7%, 20,9%, and 17,6% in 2017,2018 and 2019, respectively. We believe these
companies to be good benchmarks for the ROIC in these two segments given that both are mainly
focus on these products. The high-end segment (craft beer) of AB InBev already represents 10%
of the revenues and we forecast it to double in the next following years. Regarding premium beer
we also estimate the company to have a higher percentage of revenues coming from this segment
although it is already bigger than the craft beer one. For these reasons we expect the company
ROIC to increase f rom 7,3% in 2019 up to 9% in 2031 where we believe it will stabilize. This
6 Koller, Tim; Goedhart, Marc; Wessels, David, 2015,Valuation: Measuring and Managing the Value of Companies, University Edition
0,0%
1,0%
2,0%
3,0%
4,0%
5,0%
6,0%
7,0%
8,0%
9,0%
10,0%
ROIC 2019 2018 2017
AB InBev 7,3% 6,6% 7,1%
Boston Beer Company 17,6% 20,9% 22,7%
Constelation brands 9,1% 12,5% 10,7%
Figure 70 – ROIC comparison
Source: Bloomberg and own estimates
Figure 71 – Forecasted AB InBev ROIC
Source: Own estimates

increase will happen due to the higher percentage of revenues coming from these segments
where ROIC is higher than the current AB InBev portfolio (premium segment average of 10,8%
and craf t with 20,4% over the last 3 years comparing with 7% of AB InBev). It is dif ficult for
companies to maintain a ROIC above its cost of capital in the long run, but we believe that AB
InBev has a sustainable competitive advantage. Its economies of scale (which could synergize
with the craf t beer segment), brand value and higher barriers to entry as the craft beer segment
becomes more consolidated should be enough to maintain ROIC above its cost of capital.
▪ Enterprise value
After determining AB InBev’s discount rate and perpetual growth, we can calculate the enterprise
value of the company by discounting the future cash f lows and interests tax shields using our
unlevered discount rate (we use this rate to discount the company tax shields as we believe they
will grow in line with the company). This led us to a core enterprise value of $324,9B ($308,5B
f rom the free cash flows and $16,4B from the tax shields). To get the full enterprise value we add
the value of non-operating assets to the core enterprise value. Since the non-operating assets
consists in deferred taxes, investment securities, investments in associates, and joint ventures
and employee benefits we decided to value these assets as book value since we believe it is a
good proxy for their market value. After subtracting from the assets its liabilities, we got a non-
operating assets value of $1,66B. Which then gave us an enterprise value of $326,6B.
▪ Equity value
To know our target price, we subtract the company f inancial obligations and non-controlling
interests to the company enterprise value to reach an equity market value of $219,1B. Resulting
in a target share price of $108,49. This was done by dividing the company equity value by the
undiluted outstanding shares (~2B). To consider the possibility to be overly dependent in our
assumption we run a sensitivity analysis with different discount rates and perpetual growths to
have a wider range of possible share prices. This gave us more confidence that the share price
is undervalued since that only in the worst-case scenarios (higher discount rate and lower growth)
with these 2 variables the company share price is below the one in the market.
▪ Scenario analysis
To better analyse possible risks, we did a scenario analysis specific to the possibility that the
COVID-19 pandemic takes longer to finish than expect. Mckinsey7 did a study with the probability
7 Charumilind, Sarun, 2020, “When will the COVID-19 pandemic end?”, Mckinsey, Accessed 2 January, https://www.mckinsey.com/industries/healthcare-systems-and-services/our-insights/when-will-the-
covid-19-pandemic-end
10848,80% 5,41% 5,84% 6,27% 6,70% 7,13% 7,56% 8,00%
1,35% 118,12 101,55 87,90 76,45 66,72 58,33 51,04
1,85% 135,15 114,78 98,40 84,93 73,66 64,10 55,88
2,35% 157,75 131,81 111,57 95,35 82,06 70,97 61,56
2,85% 189,20 154,53 128,61 108,49 92,42 79,29 68,36
3,35% 235,94 186,38 151,47 125,54 105,52 89,59 76,62
3,85% 312,74 234,27 183,79 148,58 122,61 102,67 86,86
4,35% 462,28 314,36 232,95 181,41 145,84 119,81 99,92
ru
g
Figure 73 – Sensitivity analysis between g and ru
Source: Own estimates
308 538
16 429 1 659
-98 732-8 831
219 063
Unlevered EV
Tax shields
Non core assets
Net Debt
Non-controlling …
Equity value
100 000
150 000
200 000
250 000
300 000
350 000
Figure 72 – EV to equity value of AB InBev.
Source: Own estimates
of when will it be the pandemic ending in the US which we will assume as proxy given that is the
most affected country (Although we know that developing countries will have less access to
vaccination). They predict that the most likely scenario is that COVID will end in Q4 of 2021 with
some probability of being in the Q2 of 2022 and with a very low probability in the Q3 of 2023.
Given this we did a scenario analysis where expected revenues were postponed 1 year or 2 years
(expected value of 2022 would be 2021 and so on). This would basically replicate a scenario
where the world recovery would take 1 or 2 years longer than expected. We gave a probability of
60% to the 2021 scenario, 35% to the 2022 and 5% to the 2023. Which led us to an expected
value of $105,79 per share.
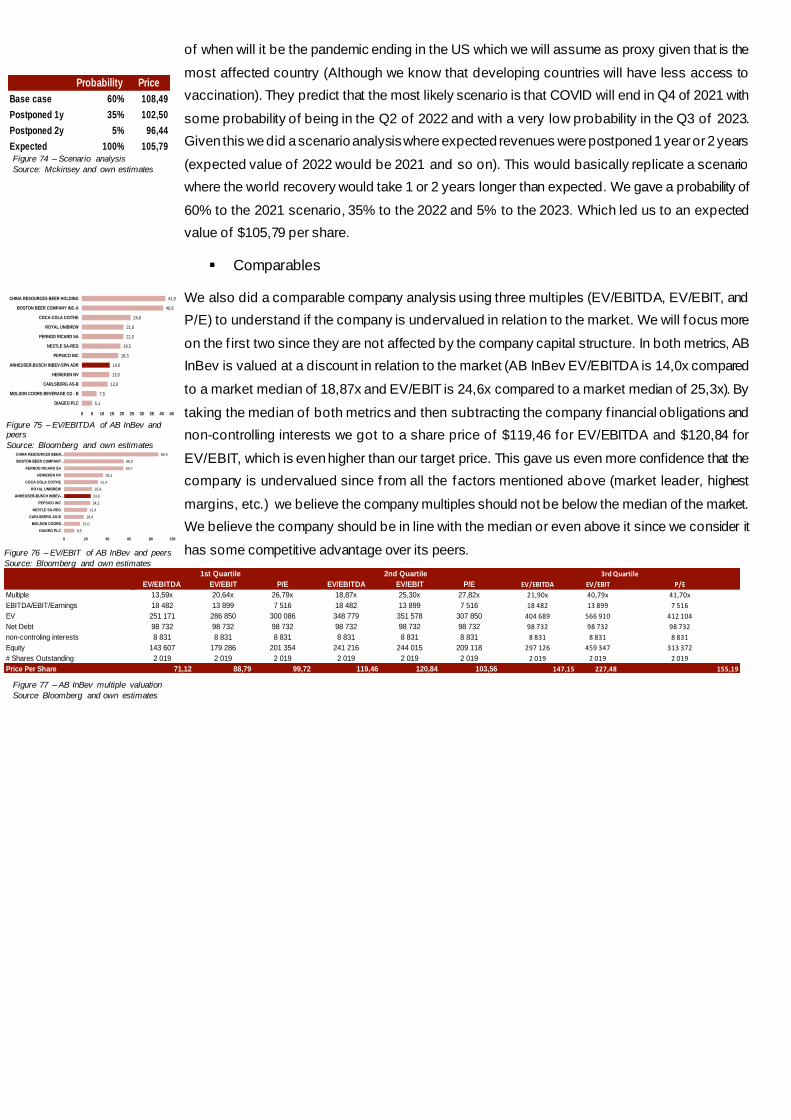
▪ Comparables
We also did a comparable company analysis using three multiples (EV/EBITDA, EV/EBIT, and
P/E) to understand if the company is undervalued in relation to the market. We will focus more
on the f irst two since they are not affected by the company capital structure. In both metrics, AB
InBev is valued at a discount in relation to the market (AB InBev EV/EBITDA is 14,0x compared
to a market median of 18,87x and EV/EBIT is 24,6x compared to a market median of 25,3x). By
taking the median of both metrics and then subtracting the company f inancial obligations and
non-controlling interests we got to a share price of $119,46 for EV/EBITDA and $120,84 for
EV/EBIT, which is even higher than our target price. This gave us even more confidence that the
company is undervalued since f rom all the factors mentioned above (market leader, highest
margins, etc.) we believe the company multiples should not be below the median of the market.
We believe the company should be in line with the median or even above it since we consider it
has some competitive advantage over its peers.
Probability Price
Base case 60% 108,49
Postponed 1y 35% 102,50
Postponed 2y 5% 96,44
Expected 100% 105,79Figure 74 – Scenario analysis
Source: Mckinsey and own estimates
Figure 76 – EV/EBIT of AB InBev and peers
Source: Bloomberg and own estimates
Figure 77 – AB InBev multiple valuation
Source Bloomberg and own estimates
5,1
7,5
13,0
13,8
14,0
18,3
19,5
21,0
21,0
24,5
40,8
41,9
0 5 10 15 20 25 30 35 40 45
DIAGEO PLC
MOLSON COORS BEVERAGE CO - B
CARLSBERG AS-B
HEINEKEN NV
ANHEUSER-BUSCH INBEV-SPN ADR
PEPSICO INC
NESTLE SA-REG
PERNOD RICARD SA
ROYAL UNIBREW
COCA-COLA CO/THE
BOSTON BEER COMPANY INC-A
CHINA RESOURCES BEER HOLDING
Figure 75 – EV/EBITDA of AB InBev and peers
Source: Bloomberg and own estimates
9,5
15,0
18,4
21,4
24,2
24,6
25,9
31,4
36,1
54,7
55,0
86,9
0 20 40 60 80 100
DIAGEO PLC
MOLSON COORS…
CARLSBERG AS-B
NESTLE SA-REG
PEPSICO INC
ANHEUSER-BUSCH INBEV-…
ROYAL UNIBREW
COCA-COLA CO/THE
HEINEKEN NV
PERNOD RICARD SA
BOSTON BEER COMPANY…
CHINA RESOURCES BEER…
Multiple
EBITDA/EBIT/Earnings
EV
Net Debt
non-controling interests
Equity
# Shares Outstanding
Price Per Share
EV/EBITDA EV/EBIT P/E EV/EBITDA EV/EBIT P/E EV/EBITDA EV/EBIT P/E
13,59x 20,64x 26,79x 18,87x 25,30x 27,82x 21,90x 40,79x 41,70x
18 482 13 899 7 516 18 482 13 899 7 516 18 482 13 899 7 516
251 171 286 850 300 086 348 779 351 578 307 850 404 689 566 910 412 104
98 732 98 732 98 732 98 732 98 732 98 732 98 732 98 732 98 732
8 831 8 831 8 831 8 831 8 831 8 831 8 831 8 831 8 831
143 607 179 286 201 354 241 216 244 015 209 118 297 126 459 347 313 372
2 019 2 019 2 019 2 019 2 019 2 019 2 019 2 019 2 019
71,12 88,79 99,72 119,46 120,84 103,56 147,15 227,48 155,19
1st Quartile 2nd Quartile 3rd Quartile

Recommendation
Our recommendation is a strong buy in this company stock since we see a huge upside until the
end of 2021 with an expected price of $105,79 resulting in a possible total return of 55% (from
capital gains and dividends paid). The company share price has been declining since 2016 driven
by a mix of debt exposure and flat volumes. The COVID-19 appeared at a very bad time for the
company due to its huge debt issue to acquire SAB Miller.
Still, we believe the company can recover to its high values. We cannot forget that we are talking
about a leading company in a market that is forecasted to grow at a ~7% CAGR from 2021-2025
and that AB InBev is present and almost always leader in the fastest -growing markets and
segments. Also, the company has been proving to be able to reduce its net debt even in difficult
times. Finally, with the check f rom our multiples valuation we can say with conf idence that the
company is undervalued in relation to its peers, which is not normal in a market leader company.
Given these factors, we consider that the company will recover back to its best years and that its
current valuation is much lower than what it should be.
$82,06$71,12
$88,79$99,72
$151,47 $147,15
$227,48
$155,19
0
50
100
150
200
250
APV EV/EBITDA EV/EBIT P/E
Figure 78 – Football field chart of AB InBev Valuation
Source: Own estimates