Embed Size (px)
Citation preview
1
THIS REPORT CONTAINS ASSESSMENTS OF COMMODITY AND TRADE ISSUES MADE BY
USDA STAFF AND NOT NECESSARILY STATEMENTS OF OFFICIAL U.S. GOVERNMENT
POLICY
Date:
GAIN Report Number:
Approved By:
Prepared By:
Report Highlights:
Egypt’s soybean imports in marketing year (MY) 2018/19 are forecast at 2.8 million metric tons
(MMT), up 400,000 MT from the MY 2017/18 estimate of 2.4 MMT. The increase in imports is due to
expanded local crushing capacity. Local industry aims to produce affordable, high-quality blended oil
in addition to high-protein soybean meal for the feed industry. In calendar year 2017, the United States
was Egypt’s largest supplier of soybeans with 1.1 MMT. Soybean meal consumption in MY 2018/19 at
3.1 MMT is up 6.9 percent from MY 2017/18 estimate of 2.9 MMT. Soybean oil consumption is
forecast at 780,000 MT in MY 2018/19, up 2.6 percent from our MY 2017/18 estimate of 760,000 MT.
Soybean, sunflower, and palm oil consumption for food and industrial use in MY 2018/19 is forecast at
2.29 MMT, up 1.7 percent compared to MY 2017/18’s volume of 2.25 MMT. Imports of palm oil in
MY 2018/19 at 980,000 MT are up 8.8 percent from the MY 2017/18 estimate. The increase is due to
the food processing sector’s nine percent growth.
Ahmed Wally, Agricultural Specialist and Mariano J. Beillard, Senior Regional Agricultural Attaché
Ali Abdi, Minister-Counselor
Huge Comeback for U.S. Soybeans, Egypt Offers Great Potential
Oilseeds and Products Annual 2018
Egypt
EG18009
2/27/2018
Required Report - public distribution

2
COMMODITIES:
OILSEEDS
PRODUCTION:
Soybeans: FAS Cairo forecasts that Egypt’s soybean area, as well as its production in marketing year
(MY) 2018/19 (October-September) will remain unchanged from the USDA official MY 2017/18
estimate of 9,000 hectares (HA) and 25,000 metric tons (MT).
The Ministry of Agriculture and Land reclamation’s (MALR) Agriculture Research Center (ARC) is the
national authority responsible for the release and marketing of certified soybean seeds. The Agricultural
Research Center plans to distribute four new certified soybean seed varieties in calendar year (CY) 2018
(January-December): Giza 21, Giza 22, Giza 25, and Giza 111. Soybeans are planted in Middle and
Upper Egypt (southern Egypt).
Sunflower Seeds: Sunflower seed planted area, as well as production will remain largely unchanged
from the USDA official MY2017/18 estimate of 8,000 HA and 19,000 metric tons. Sunflower seeds are
planted in the country’s Delta region (northern Egypt) in March. Plantings in Middle and Upper Egypt
occur in June and July. Sakha 53 and Giza 102 are the two main planted varieties.
CONSUMPTION:
Soybeans: FAS Cairo forecasts Egypt’s soybean consumption in MY 2018/19 at a record 2.8 million
metric tons (MMT), up 16.6 percent from post’s MY 2017/18 estimate of 2.4 million metric tons. The
marketing year 2017/18 estimate is revised downward to 2.4 MMT from the USDA official projection of
2.6 MMT due to a decrease in soybean imports of 8.3 percent.
The increase in MY2018/19 consumption is due to the expansion by two major private-sector crushers
(i.e., Cargill and the Alex Seed Company) which are doubling their crushing capacity. This expansion
adds 6,000 MT per day of production to the existing facilities. Crush operations in Egypt are dominated
by Cargill and the Alex Seed Company; these firms account for over 80 percent of the total crush
capacity. Fifteen other middle-size operations make up the remainder.
In marketing year 2018/19 domestic crush capacity is expected to reach 8,484 MT per day. Crushing
facilities usually operate at 65-70 percent of their actual capacity. Egypt’s domestic consumption of
soybeans for food use will remain at 17,000 MT in marketing year 2018/19. The food processing
industry uses soybeans and soy-based ingredients to enhance the nutritional quality of bread, as well as
two popular legume foods (i.e., lentil soup and falafel).
Sunflower Seed: FAS Cairo forecasts Egypt’s sunflower seed consumption for crushing in MY 2018/19
at 75,000 MT; this volume is largely unchanged from the MY 2017/18 estimate. Imported sunflower
seeds are either processed by the private sector to extract sunflower oil or used for food consumption.
Domestic sunflower seeds in contrast are mainly crushed by small local crushers (using more primitive
methods) close to their production areas in Middle and Upper Egypt.

3
FAS Cairo forecasts Egypt’s consumption of sunflower seeds for food use in MY 2018/19 at 15,000
MT, up 3,000 MT from the MY 2017/18 estimate of 12,000 metric tons. We attribute the increase
largely to natural population growth. Post is revising upwards the USDA official MY 2017/18
consumption for food use estimate from 7,000 MT to 12,000 MT; we attribute the increase to growing
awareness (among urban consumers) of the health benefits and affordability of sunflower seeds as a
snack food. Sunflower seeds are roasted, seasoned, and sold in-shell.
TRADE:
Soybeans: FAS Cairo forecasts Egypt’s soybean imports in MY 2018/19 at 2.8 MMT, up 400,000 MT
from the MY 2017/18 estimate of 2.4 million metric tons. Post attributes the increase in imports to
expanded local crushing capacity. The local industry seeks to produce affordable, high-quality blended
oil as well as high-protein soybean meal for the feed industry.
Post is revising downward the USDA official MY 2017/18 estimate of 2.6 MMT by 8.3 percent due to
high inflation averaging 30 percent during the June-October 2017 period; inflation substantially
impacted imports at the beginning of the marketing year. With Egypt’s annual urban consumer price
inflation falling to 17.1 percent in January 2018, down from 21.9 percent in December 2017 and 33.2
percent earlier in August, purchasing power recovery should lead to increased consumption of
consumer-oriented food products and the strengthening of soybean imports.
FIGURE 1: EGYPT, Imports of Soybeans from Key Origins, CY 2014-17
In 2017, Egypt’s largest soybean suppliers remained the United States (1.1 MMT), Ukraine (511,000
MT), Argentina (507,500 MT), and Brazil (110,000 MT). The current average price for imported
soybeans is about $430/MT cost-and-freight (CFR) port of Alexandria.
4
TABLE 1: EGYPT, Countries Approved to Export Soybeans to Egypt
Europe Region Australia/ Oceania Region North America Region South America Region
France
Ukraine
Hungary Australia
United States
Canada
Argentina
Brazil
Paraguay
The current exchange rate is (EGP 17.60 to $1.00). We expect economic growth to pick up in CY 2018;
anticipate Egypt growing at five percent compared to 4.3 percent in 2017. Inflation will range between
18-20 percent.
Sunflower Seeds: FAS Cairo forecasts Egypt’s sunflower seeds imports for crushing in MY 2018/19 at
75,000 MT, similar to post’s MY 2017/18 estimate. The latter has been revised upward from the USDA
official estimate of 65,000MT due to observed higher demand. China is Egypt’s leading sunflower seed
supplier, shipping 75,000 MT in calendar year 2017.
MEAL
Soybean Meal: FAS Cairo forecasts Egypt’s soybean meal production in MY 2018/19 at 2.2 MMT, up
by 16.6 percent from post’s MY 2017/18 estimate. We attribute the increase in soybean meal
production to expanded local crushing capacity. The local industry aims to produce affordable, high-
protein soybean meal for the feed industry, as well as high-quality blended oil for human consumption.
We anticipate that increased production will displace about 36.4 percent of soymeal imports in
marketing year 2018/19.
Soybean meal production in MY 2017/18 is revised downward to 1.9 MMT from the USDA official
estimate of 2.0 MMT, or down 4.1 percent as a result of decreased soybean imports due to the
November 2016 devaluation. Ninety percent of Egypt’s soybean crushers are private-sector entities.
About fifty-nine percent of Egypt’s soybean meal requirements are met by local Egyptian companies.
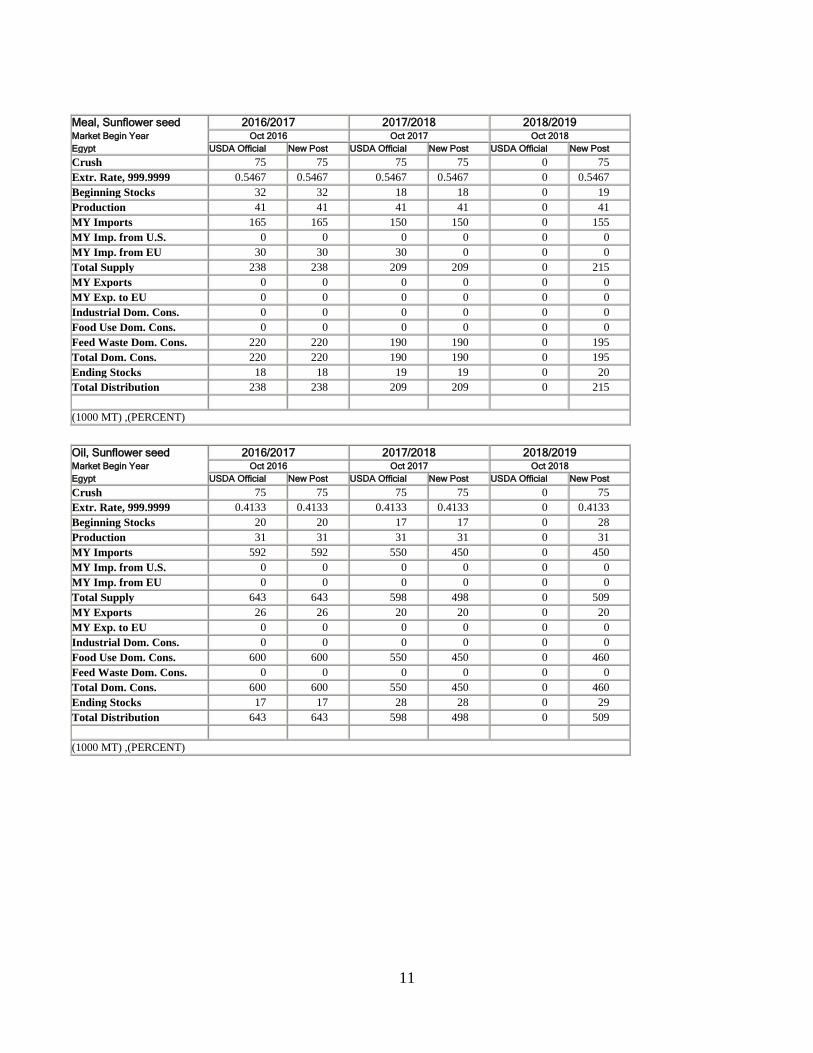
Sunflower Meal: FAS Cairo forecasts Egypt’s sunflower seed meal production in MY 2018/19 at
41,000 MT, largely unchanged from the MY 2017/18 estimate. Sunflower seed meal residue is close to
56 percent, reflecting the inclusion of the seed’s shell in the meal. This results in a higher fiber meal,
which can be blended and mixed with more easily digestible soybean meal.
CONSUMPTION:
Soybean Meal: FAS Cairo forecasts Egypt’s soybean meal consumption in MY 2018/19 at 3.1 MMT,
up 6.9 percent from MY 2017/18 estimate of 2.9 million metric tons. Post anticipates that MY 2017/18
will see greater exchange rate stability accompanied by lower inflation. This will contribute to lower
poultry and fish feed prices, increasing demand for soybean meal. We estimate that 1.3 MMT of
soybean meal will be utilized in aquaculture in MY 2017/18. Another 1.0 MMT will go into poultry
feed, while 600,000 MT will go into feeder and dairy cattle feed.

5
Soybean meal consumption in MY 2017/18 is revised downward to 2.9 MMT from the USDA official
estimate of 3.1 million metric tons. The decrease is attributable to decreased domestic meal production
and higher poultry and fish feed prices. Domestic feed and feed ingredient prices are 60-70 percent
overinflated. Poultry feed (60-70 percent corn) jumped from EGP 6,000/MT ($340.9/MT) this
marketing year to EGP 7,000/MT ($397.7/MT).
Egypt counts with 180 poultry feed mills producing various types of feed formulations for the poultry
industry; these supply over 95 percent of the domestic market’s demand. The soybean meal component
used in poultry feed formulations ranges between 25-35 percent.
Fish feed prices have also similarly increased. The price of extruded feed for tilapia has now gone from
EGP 6000/MT ($340.9/MT) to EGP 7,000/MT ($397.7/MT). Corn prices at EGP 3,660/MT
($204.5/MT) are up from EGP 3,200/MT ($177.7/MT). High-protein soybean meal prices have also
jumped from EGP 8,000/MT ($454.4/MT) to EGP 8,800/MT ($500/MT) since the beginning of this
marketing year.
The Egyptian aquaculture feed industry counts with 73 privately owned feed mills, providing 90 percent
of marine feed. Production includes conventionally pelleted feeds (80-85 percent) and extruded feeds
(15-20 percent). About eighty-five percent of marine fish feed is formulated locally to contain 25
percent crude protein. The most common fish feed formulations contain 30-40 percent soybean meal
combined with around 5-22 percent fishmeal.
Sunflower Meal: FAS Cairo forecasts Egypt’s sunflower meal consumption in MY 2018/19 at 195,000
MT, up 5,000 NT from the MY 2017/18 estimate. We attribute the rise to increased imports of China-
origin sunflower seed. Post’s estimate of 190,000 MT in MY 2017/18 remains unchanged from the
USDA official estimate.
TRADE:
Soybean Meal: FAS Cairo forecasts Egypt’s imports of soybean meal in MY 2018/19 at 880,000 MT,
down 320,000 MT from our MY 2017/18 estimate of 1.2 million metric tons. The drop is due to a 16.6
percent increase in domestic soybean meal production in marketing year 2018/19; resulting from 2.8
MMT in soybean imports. Post’s estimate in MY 2017/18 remains unchanged from the USDA official
estimate of 1.2 million metric tons. Main suppliers of soybean meal in CY 2017 were Argentina (1.1
MMT) and the United States (23,116 MT).
Sunflower Meal: FAS Cairo forecasts Egypt’s imports of sunflower meal in MY 2018/19 at 155,000
MT, up by 5,000 MT from MY 2017/18 due to the feed industry’s increased demand.
OIL
OVERVIEW
The Food Subsidy Program: The Egyptian government in fiscal year (FY) 2017/18 (July-June)
allocated EGP 85 billion ($4.72 billion) for food subsidies. Of this amount, roughly EGP 45 billion
6
($2.5 billion) alone is earmarked for the bread subsidy program. The other EGP 40 billion ($2.2 billion)
is for supply commodities. In fiscal year 2016/17, prior to the November 2016 devaluation, the budget
allocated for food subsidies was EGP 41 billion ($4.7 billion); some EGP 23 billion ($2.6 billion) was
then allocated for the bread subsidy program while EGP18 billion ($2 billion) went to supply
commodities.
Around 71 million Egyptians make use of food subsidies delivered by the government as credits on
SMART cards; these can be redeemed for household staples each month. SMART cards are accepted by
a network of 2,500 state-owned consumer complexes managed by the Ministry of Supply and Internal
Trade’s (MoSIT) Holding Company for Food Industries (HCFI), as well as at 27,000 partnered private
grocery stores. Egypt counts with a population of roughly 97 million people, adding 2 million persons
annually (Central Intelligence Agency, July 2017 estimate).
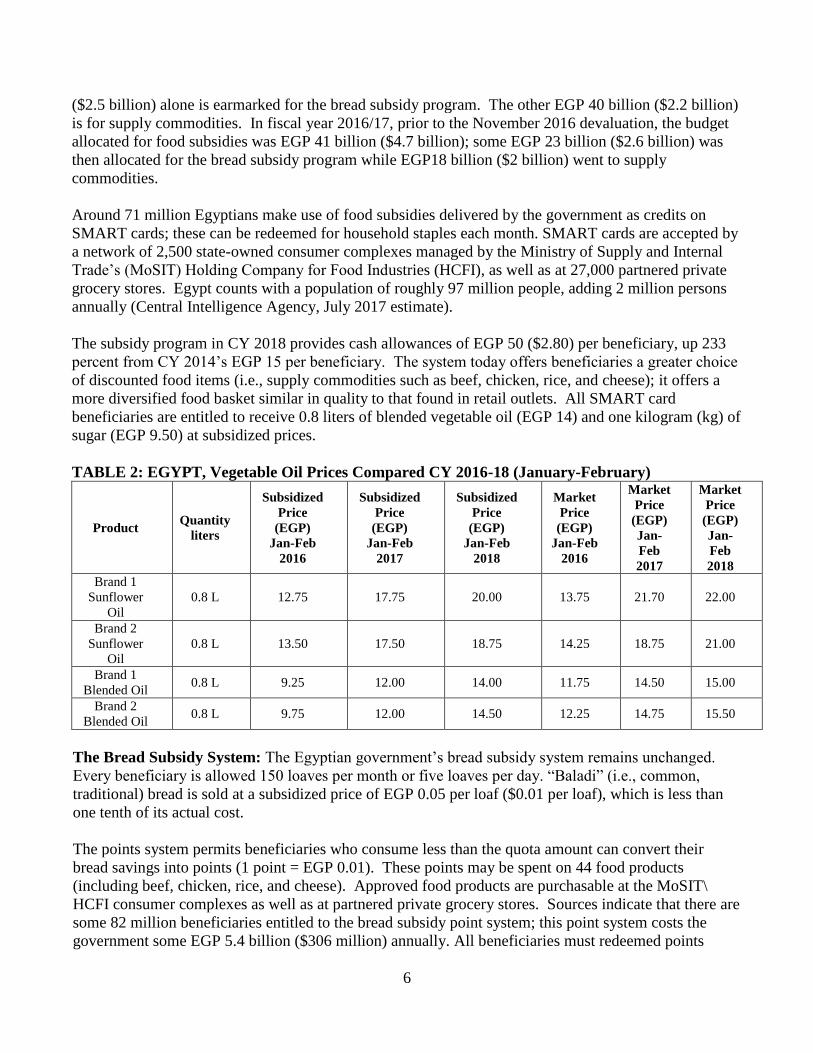
The subsidy program in CY 2018 provides cash allowances of EGP 50 ($2.80) per beneficiary, up 233
percent from CY 2014’s EGP 15 per beneficiary. The system today offers beneficiaries a greater choice
of discounted food items (i.e., supply commodities such as beef, chicken, rice, and cheese); it offers a
more diversified food basket similar in quality to that found in retail outlets. All SMART card
beneficiaries are entitled to receive 0.8 liters of blended vegetable oil (EGP 14) and one kilogram (kg) of
sugar (EGP 9.50) at subsidized prices.
TABLE 2: EGYPT, Vegetable Oil Prices Compared CY 2016-18 (January-February)
Product Quantity
liters
Subsidized
Price
(EGP)
Jan-Feb
2016
Subsidized
Price
(EGP)
Jan-Feb
2017
Subsidized
Price
(EGP)
Jan-Feb
2018
Market
Price
(EGP)
Jan-Feb
2016
Market
Price
(EGP)
Jan-
Feb
2017
Market
Price
(EGP)
Jan-
Feb
2018
Brand 1
Sunflower
Oil
0.8 L 12.75 17.75 20.00 13.75 21.70 22.00
Brand 2
Sunflower
Oil
0.8 L 13.50 17.50 18.75 14.25 18.75 21.00
Brand 1
Blended Oil 0.8 L 9.25 12.00 14.00 11.75 14.50 15.00
Brand 2
Blended Oil 0.8 L 9.75 12.00 14.50 12.25 14.75 15.50
The Bread Subsidy System: The Egyptian government’s bread subsidy system remains unchanged.
Every beneficiary is allowed 150 loaves per month or five loaves per day. “Baladi” (i.e., common,
traditional) bread is sold at a subsidized price of EGP 0.05 per loaf ($0.01 per loaf), which is less than
one tenth of its actual cost.
The points system permits beneficiaries who consume less than the quota amount can convert their
bread savings into points (1 point = EGP 0.01). These points may be spent on 44 food products
(including beef, chicken, rice, and cheese). Approved food products are purchasable at the MoSIT\
HCFI consumer complexes as well as at partnered private grocery stores. Sources indicate that there are
some 82 million beneficiaries entitled to the bread subsidy point system; this point system costs the
government some EGP 5.4 billion ($306 million) annually. All beneficiaries must redeemed points

7
during the first 20 days of the following month. During the past two years, beneficiaries purchased
primarily sugar, rice, and vegetable oil using points. Vegetable oil, sugar, and rice are now excluded
from the points system.
PRODUCTION:
Soybean Oil: FAS Cairo forecasts Egypt’s soybean oil production in MY 2018/19 at 530,000 MT, up
16.4 percent from the MY 2017/18 estimate. Soybean oil production in MY 2017/18 remains unchanged
from the USDA official estimate of 455,000 metric tons. The increase in soybean oil production in MY
2018/19 reflects higher crushing activity due to a larger volume of imported soybeans taking advantage
of expanded local crush capacity.
Sunflower Seed Oil: FAS Cairo forecasts Egypt’s sunflower seed oil production in MY 2018/19 to
31,000 metric tons. This volume is largely unchanged from marketing year 2017/18.
CONSUMPTION:
FAS Cairo forecasts Egypt’s soybean, sunflower, and palm oil consumption for food and industrial use
in MY 2018/19 at 2.29 MMT, up 1.7 percent compared to MY 2017/18’s volume of 2.25 million metric
tons. Of the total quantity consumed, palm oil accounts for 45.8 percent; while soybean oil represents
34.1 percent of the volume and sunflower oil 20.1 percent.
Soybean Oil: FAS Cairo forecasts soybean oil consumption to reach 780,000 MT in MY 2018/19, up
2.6 percent from our MY 2017/18 estimate of 760,000 metric tons. Consumption in MY 2017/18
remains unchanged from the USDA official estimate of 760,000 metric tons. The upward trend is due to
greater percentages of soybean oil blended with sunflower and palm oils. Contributing also to increased
consumption is the inclusion of private-sector suppliers of higher-quality cooking oils in the MoSIT\
HCFI supply commodities distribution system.
Sunflower Oil: FAS Cairo forecasts Egypt’s sunflower oil consumption in MY 2018/19 at 460,000 MT,
up 2.2 percent from the MY 2017/18 estimate of 450,000 metric tons. The latter is being revised
downward from the USDA official estimate of 550,000 MT due to greater amounts of soybean oil being
channeled through the country’s subsidy program in lieu of sunflower oil. Post anticipates higher levels
of sunflower oil consumption in the future due to an expected decline in inflation. Urban middle- and
higher-income consumers remain the oil’s key users.
Palm Oil: FAS Cairo forecasts Egypt’s palm oil consumption in MY 2018/19 at 1.05 MMT, up slightly
from our MY 2017/18 estimate of 1.04 million metric tons. The latter is being revised downward from
the USDA official estimate of 1.27 MMT due to an expected decrease in imports, food price inflation
(averaging 30 percent at the beginning of the marketing year), and a 20-25 percent decline the food
processing industry and retail sector sales.
Post estimates that 93.4 percent of palm oil is utilized for human food consumption; vegetable
shortenings account for 50 percent. Shortening is used for industrial frying in hotels, restaurants,
catering, and fast food chains. Production of vegetable ghee accounts for 40 percent of palm oil
utilization. Margarine accounts for 3.4 percent use, mainly by private bakeries and patisseries.
8
TRADE:
The General Authority for Supply Commodities (GASC) is the sole government entity responsible for
purchases of crude, edible oils. Vegetable oils are purchased through private sector tenders and are
refined in government-affiliated refineries or on a contract basis with other private-sector companies.
The refined product is delivered to the Egyptian Company for Wholesale, which is a company operating
under the Holding Company for Food Industries. Vegetable oils are distributed to the MoSIT consumer
complexes and private partnered grocery stores; the subsidy program consumes 1.25 MMT of refined
vegetable oil per calendar year.
Soybean Oil Imports: FAS Cairo forecasts Egypt’s soybean oil imports in MY 2018/19 at 400,000 MT,
up by 50,000 MT from the MY 2017/18 estimated volume of 350,000 metric tons that remains
unchanged from the USDA official estimate. The increase in imports is attributed to an increase in
demand by the public- and private-sectors to blend soybean oil with other oils.
Soybean Oil Exports: FAS Cairo forecasts Egypt’s soybean oil re-exports in MY 2018/19 to reach
about 60,000 MT, up 60 percent from the MY 2016/17 estimate of 40,000 metric tons. The surge in
exports is driven by the devaluation of the Egyptian pound, increased crushing activity, and the opening
of new markets in Africa.
Sunflower Oil: FAS Cairo forecasts Egypt’s sunflower oil imports in MY 2018/19 at 450,000 MT,
similar to the MY 2017/18 volume which itself remains unchanged from the USDA official estimate.
Traders and importers are price sensitive following the November 2016 devaluation. Both the public-
and private-sectors are opting for more affordable soybean oil.
Palm Oil: FAS Cairo forecasts Egypt’s imports of palm oil in MY 2018/19 at 980,000 MT, up 8.8
percent from post’s MY 2017/18 estimate. We attribute the increase to a nine percent growth in the
food processing sector (a major consumer of palm oil).
The marketing year 2017/18 estimate of 900, 000 MT is revised downward 38.8 percent from USDA’s
official estimate of 1.25 million metric tons. The decrease in palm oil imports is attributable to the
devaluation of the Egyptian pound that has slowed imports in calendar year 2017. Post anticipates that
imports through the remainder of the marketing year will remain weak; CY 2017 palm oil prices were
$715/MT. The March 2018 average palm oil price has now dropped to $680 per metric ton. Post
forecasts MY 2018/19 palm oil re-exports at 5,000MT, largely in line with the MY 2017/18 USDA
official estimate.
TARIFFS:
Egypt does not currently impose import tariffs on soybeans, sunflower seed, linseed, palm kernel, and
sesame seed. Oilseed meal and cake extracted from oilseeds are however subject to an import duties of
five percent. Import tariffs on bulk crude and refined soybean and sunflower oil are currently assessed a
two percent tariff. Crude cottonseed and palm oil duties are zero.

9
Oilseed, Soybean 2016/2017 2017/2018 2018/2019 Market Begin Year Oct 2016 Oct 2017 Oct 2018
Egypt USDA Official New Post USDA Official New Post USDA Official New Post
Area Planted 9 9 9 9 0 9
Area Harvested 9 9 9 9 0 9
Beginning Stocks 178 178 76 76 0 59
Production 25 25 25 25 0 25
MY Imports 2115 2115 2600 2400 0 2800
MY Imp. from U.S. 939 939 950 950 0 1000
MY Imp. from EU 0 0 0 0 0 0
Total Supply 2318 2318 2701 2501 0 2884
MY Exports 0 0 0 0 0 0
MY Exp. to EU 0 0 0 0 0 0
Crush 2200 2200 2500 2400 0 2800
Food Use Dom. Cons. 17 17 17 17 0 17
Feed Waste Dom. Cons. 25 25 25 25 0 25
Total Dom. Cons. 2242 2242 2542 2442 0 2842
Ending Stocks 76 76 159 59 0 42
Total Distribution 2318 2318 2701 2501 0 2884
CY Imports 1750 0 2000 0 0 0
CY Imp. from U.S. 877 0 850 0 0 0
CY Exports 0 0 0 0 0 0
CY Exp. to U.S. 0 0 0 0 0 0
Yield 2.7778 2.7778 2.7778 2.7778 0 2.7778
(1000 HA) ,(1000 MT) ,(MT/HA)
Meal, Soybean 2016/2017 2017/2018 2018/2019 Market Begin Year Oct 2016 Oct 2017 Oct 2018
Egypt USDA Official New Post USDA Official New Post USDA Official New Post
Crush 2200 2200 2500 2400 0 2800
Extr. Rate, 999.9999 0.8 0.8 0.8 0.8 0 0.8
Beginning Stocks 228 228 59 59 0 277
Production 1760 1760 2000 1920 0 2240
MY Imports 1053 1053 1200 1200 0 880
MY Imp. from U.S. 150 150 150 150 0 150
MY Imp. from EU 0 0 0 0 0 0
Total Supply 3041 3041 3259 3179 0 3397
MY Exports 2 2 2 2 0 2
MY Exp. to EU 0 0 0 0 0 0
Industrial Dom. Cons. 0 0 0 0 0 0
Food Use Dom. Cons. 0 0 0 0 0 0
Feed Waste Dom. Cons. 2980 2980 3100 2900 0 3100
Total Dom. Cons. 2980 2980 3100 2900 0 3100
Ending Stocks 59 59 157 277 0 295
Total Distribution 3041 3041 3259 3179 0 3397
(1000 MT) ,(PERCENT)

10
Oil, Soybean 2016/2017 2017/2018 2018/2019 Market Begin Year Oct 2016 Oct 2017 Oct 2018
Egypt USDA Official New Post USDA Official New Post USDA Official New Post
Crush 2200 2200 2500 2400 0 2800
Extr. Rate, 999.9999 0.1818 0.1818 0.182 0.1896 0 0.1893
Beginning Stocks 61 61 22 22 0 27
Production 400 400 455 455 0 530
MY Imports 246 246 350 350 0 400
MY Imp. from U.S. 0 0 0 0 0 0
MY Imp. from EU 5 0 5 0 0 0
Total Supply 707 707 827 827 0 957
MY Exports 55 55 40 40 0 60
MY Exp. to EU 0 0 0 0 0 0
Industrial Dom. Cons. 10 10 10 10 0 10
Food Use Dom. Cons. 620 620 750 750 0 770
Feed Waste Dom. Cons. 0 0 0 0 0 0
Total Dom. Cons. 630 630 760 760 0 780
Ending Stocks 22 22 27 27 0 117
Total Distribution 707 707 827 827 0 957
(1000 MT) ,(PERCENT)
Oilseed, Sunflower Seed 2016/2017 2017/2018 2018/2019 Market Begin Year Oct 2016 Oct 2017 Oct 2018
Egypt USDA Official New Post USDA Official New Post USDA Official New Post
Area Planted 7 7 7 8 0 8
Area Harvested 7 7 8 8 0 8
Beginning Stocks 17 17 11 12 0 16
Production 17 17 19 19 0 19
MY Imports 62 60 65 75 0 75
MY Imp. from U.S. 1 0 1 0 0 0
MY Imp. from EU 0 0 0 0 0 0
Total Supply 96 94 95 106 0 110
MY Exports 3 3 3 3 0 3
MY Exp. to EU 0 0 0 0 0 0
Crush 75 70 75 75 0 75
Food Use Dom. Cons. 7 9 7 12 0 15
Feed Waste Dom. Cons. 0 0 0 0 0 0
Total Dom. Cons. 82 79 82 87 0 90
Ending Stocks 11 12 10 16 0 17
Total Distribution 96 94 95 106 0 110
CY Imports 60 0 60 0 0 0
CY Imp. from U.S. 3 0 3 0 0 0
CY Exports 0 0 0 0 0 0
CY Exp. to U.S. 0 0 0 0 0 0
Yield 2.4286 2.4286 2.375 2.375 0 2.375
(1000 HA) ,(1000 MT) ,(MT/HA)
11
Meal, Sunflower seed 2016/2017 2017/2018 2018/2019 Market Begin Year Oct 2016 Oct 2017 Oct 2018
Egypt USDA Official New Post USDA Official New Post USDA Official New Post
Crush 75 75 75 75 0 75
Extr. Rate, 999.9999 0.5467 0.5467 0.5467 0.5467 0 0.5467
Beginning Stocks 32 32 18 18 0 19
Production 41 41 41 41 0 41
MY Imports 165 165 150 150 0 155
MY Imp. from U.S. 0 0 0 0 0 0
MY Imp. from EU 30 30 30 0 0 0
Total Supply 238 238 209 209 0 215
MY Exports 0 0 0 0 0 0
MY Exp. to EU 0 0 0 0 0 0
Industrial Dom. Cons. 0 0 0 0 0 0
Food Use Dom. Cons. 0 0 0 0 0 0
Feed Waste Dom. Cons. 220 220 190 190 0 195
Total Dom. Cons. 220 220 190 190 0 195
Ending Stocks 18 18 19 19 0 20
Total Distribution 238 238 209 209 0 215
(1000 MT) ,(PERCENT)
Oil, Sunflower seed 2016/2017 2017/2018 2018/2019 Market Begin Year Oct 2016 Oct 2017 Oct 2018
Egypt USDA Official New Post USDA Official New Post USDA Official New Post
Crush 75 75 75 75 0 75
Extr. Rate, 999.9999 0.4133 0.4133 0.4133 0.4133 0 0.4133
Beginning Stocks 20 20 17 17 0 28
Production 31 31 31 31 0 31
MY Imports 592 592 550 450 0 450
MY Imp. from U.S. 0 0 0 0 0 0
MY Imp. from EU 0 0 0 0 0 0
Total Supply 643 643 598 498 0 509
MY Exports 26 26 20 20 0 20
MY Exp. to EU 0 0 0 0 0 0
Industrial Dom. Cons. 0 0 0 0 0 0
Food Use Dom. Cons. 600 600 550 450 0 460
Feed Waste Dom. Cons. 0 0 0 0 0 0
Total Dom. Cons. 600 600 550 450 0 460
Ending Stocks 17 17 28 28 0 29
Total Distribution 643 643 598 498 0 509
(1000 MT) ,(PERCENT)

12
Oil, Palm 2016/2017 2017/2018 2018/2019 Market Begin Year Oct 2016 Oct 2017 Oct 2018
Egypt USDA Official New Post USDA Official New Post USDA Official New Post
Area Planted 0 0 0 0 0 0
Area Harvested 0 0 0 0 0 0
Trees 0 0 0 0 0 0
Beginning Stocks 206 206 254 254 0 110
Production 0 0 0 0 0 0
MY Imports 1323 1323 1250 900 0 980
MY Imp. from U.S. 0 0 0 0 0 0
MY Imp. from EU 0 0 0 0 0 0
Total Supply 1529 1529 1504 1154 0 1090
MY Exports 5 5 5 4 0 5
MY Exp. to EU 1 0 0 0 0 0
Industrial Dom. Cons. 120 120 120 100 0 100
Food Use Dom. Cons. 1150 1150 1150 940 0 950
Feed Waste Dom. Cons. 0 0 0 0 0 0
Total Dom. Cons. 1270 1270 1270 1040 0 1050
Ending Stocks 254 254 229 110 0 35
Total Distribution 1529 1529 1504 1154 0 1090
CY Imports 1200 0 1200 0 0 0
CY Imp. from U.S. 0 0 0 0 0 0
CY Exports 5 0 5 0 0 0
CY Exp. to U.S. 0 0 0 0 0 0
Yield 0 0 0 0 0 0
(1000 HA) ,(1000 TREES) ,(1000 MT) ,(MT/HA)