Embed Size (px)
Citation preview

1
This module summarizes a study that utilized structural equation
modeling, motivated by the desire to evaluate a integrated set of
hypotheses that had long been debated. The study in question is
Anderson, T.M., Hopcraft, J.G.C., Mayemba, E., Eby, S., Ritchie, M.E.,
Grace, J.B., and Olff, H. 2010. Landscape-scale analyses suggest both
nutrient and antipredator advantages to Serengeti herbivore hotspots.
Ecology, 91:1519-1529.
http://onlinelibrary.wiley.com/doi/10.1890/09-0739.1/full
Notes: IP-056512; Support provided by the USGS Climate & Land
Use R&D and Ecosystems Programs. I would like to acknowledge
formal review of this material by Jesse Miller and Phil Hahn,
University of Wisconsin, as well as collaboration with Michael
Anderson, senior author of the paper. The use of trade names is for
descriptive purposes only and does not imply endorsement by the U.S.
Government.
Last revised 17.02.27.
Source: https://www.usgs.gov/centers/wetland-and-aquatic-research-
center/science/quantitative-analysis-using-structural-equation

2 2
This presentation represents a talk given by Michael Anderson
on the work in 2009 prior to publication of the work in 2010.
Modest narration has been added to give some flow to the
presentation. For additional details, consult the primary
publication at
https://www.researchgate.net/publication/44631643_Landscape-
level_analyses_suggest_both_nutrient_and_antipredator_advant
ages_to_Serengeti_herbivore_hotspots

Here is a screen shot of the official publication.
3

4 4
The Serengeti ecosystem is one of the world’s charismatic
places. It is home to the mass migrations that are featured on so
many nature shows.

5
Because of the portails in documentaries and also in movies, we
think of the Serengeti in terms of the massive herds of millions of
animals.

6
As the animals move through the system, we can see a variety
of landscapes. It is often the wildebeest that leads the way,
willing to eat nearly any type of forage.

7
Often the grass is indeed past its prime and of lesser quality.
Other herbivores are mixed in the large multi-species herds.

8
The Serengeti ecosystem is contained within both Tanzania and
Kenya.

9 9
The migratory path of the animals spans a large gradient in
conditions.
From:
High rainfall
High standing plant biomass
Granitic soils (sandy clay loams)
Low soil nutrients and SOC
Low quality forage
Grazing: infrequent
To:
Low rainfall
Low standing plant biomass
Volcanic soils (silty clay loams)
High soil nutrients and SOC
High quality forage
Grazing: frequent and severe

10
While our attention is drawn to the animals in their migration,
there are large swaths of the system that are less visited.

11
Some of the unused areas are heavily vegetated, though the
vegetation is somewhat different from the more used locations.

12
Viewing locations within the landscape, we observe a variety of
conditions.

13

14

15

16
Our slide show has been biased towards the large open areas,
but there are also plenty of woodlands as well. These woodlands
are particularly important as well-used spots for predators, as
well as certain herbivores (especially those with substantial
predator defenses like water buffalo and elephant.

17

18
Considering all this, we see that understanding the consumer
dynamics of the system requires more than an understanding of
the great migration.
19 19
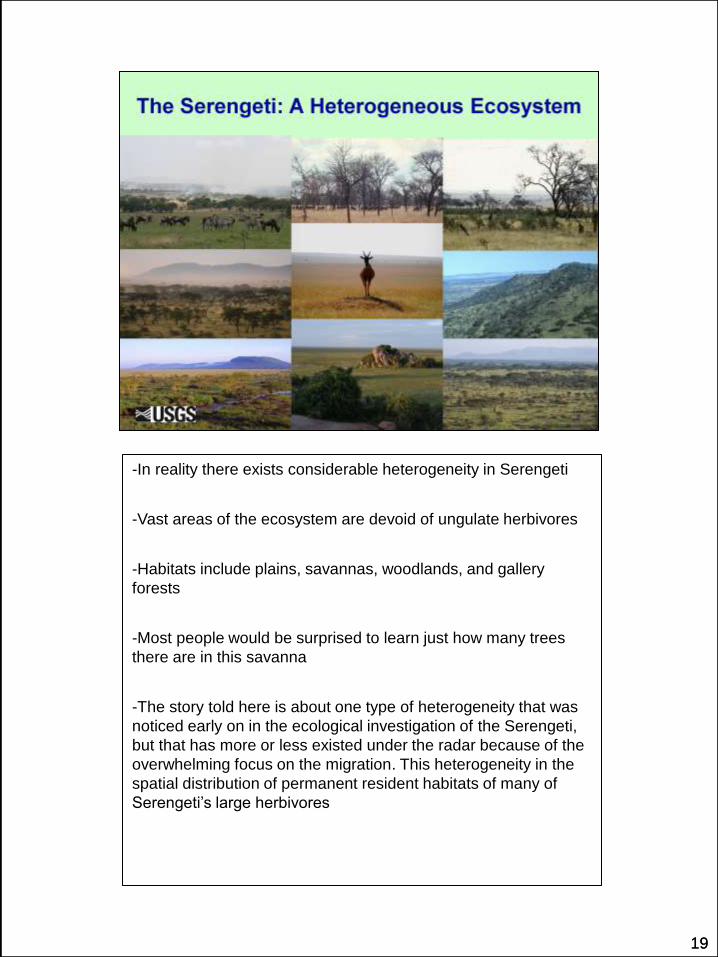
-In reality there exists considerable heterogeneity in Serengeti
-Vast areas of the ecosystem are devoid of ungulate herbivores
-Habitats include plains, savannas, woodlands, and gallery
forests
-Most people would be surprised to learn just how many trees
there are in this savanna
-The story told here is about one type of heterogeneity that was
noticed early on in the ecological investigation of the Serengeti,
but that has more or less existed under the radar because of the
overwhelming focus on the migration. This heterogeneity in the
spatial distribution of permanent resident habitats of many of
Serengeti’s large herbivores

20
While the great herds are migrating, and thus concentrated in the
larger landscape, smaller groups of animals appear to be doing
their own thing.

21
These non-migratory animals include members of all the major
herbivores.

22
While predators certainly get their fill when the migrating herds
pass by, during the bulk of the year, the non-migrating animals
provide the consistent food base for resident lions, leopards,
cheetahs, hyenas, and other predators. Herbivores engaged in
this part of the system cycle are exposed to much greater
predation risk and forage much more selectively and cautiously.

23
Most often, herbivores are clearly visible, seeming to prefer open
areas where predators can be easily observed.

24

25

26
This system within the larger system is comprised of numerous
“hotspots” of permanent resident grazers.
ZB = zebra
WB = wildebeest
TP = topi
HB = hartebeest
GG = Grant’s gazelle
TG = Thompson’s gazelle
WH = warthogs

27
There are a number of known characteristcs of the hotspot
areas.

28
Numerous theories exist, but can be classified into those related
to feeding and avoiding predation.

29 29
As stated earlier, this all happens within the context of a very
large and continuous macro-gradient of conditions.
High rainfall
High standing plant biomass
Granitic soils (sandy clay loams)
Low soil nutrients and SOC
Low quality forage
Grazing: infrequent
Low rainfall
Low standing plant biomass
Volcanic soils (silty clay loams)
High soil nutrients and SOC
High quality forage
Grazing: frequent and severe

30
In this study, mapping was used to help establish sample
locations.

31
For each site surveyed, measures were made to represent the
key elements of various competing theories.

32
Looking closely at the map shows the locations that were
identified, as well as where sample transects were selected for
data collection.

33
Data from other studies support some key assumptions about
predation risk and landscape characteristics.

34
Based on hotspot-landscape relations, it is possible to predict
their probabily of occurrence based solely on climate and scape
conditions.

35
For SEM studies, we begin with a general representation of
the hypotheses being evaluated. Care is taken to describe
the potential intepretations of the relationships that might
be found relative to the network of hypothesized links.
A: Direct influence of predation risk created by structural
variation in the environment
B & C: indirect influences of landscape features on hotspots
mediated through their effects on resource quality and quantity -
i.e. catena variation (Bell 1970)
D & E: Main paths representing forage quality and quantity, both
hypothesized to be positive
F: Note that plant biomass represents several potentially
contrasting processes
(1) herbivores benefit from biomass once the negative effect of
biomass on forage quality has been statistically controlled
(positive path)
(2) vegetation biomass is related to increased predator kill
success (negative path)
(3) Only indirect effects of biomass (path insignificant)

36
The study by Anderson et al. serves as an excellent example
regarding the documentation of their logic and procedures. Here I
point to the underlying principles that they followed, which are
expounded upon in the tutorials on this site. This slide is taken from
the tutorial entitled, “Overview of th e Modeling Process”.
Briefly, this slide is meant to convey that SEM is a process designed
to lead to scientifically interpretable models. It relies on sequential
learning and a general multi-step process to build confident
knowledge. In SEM, we first translate our ideas into models, test
those models, modify our models if need be, and then use that
knowledge to inform where we start with the next study.
37
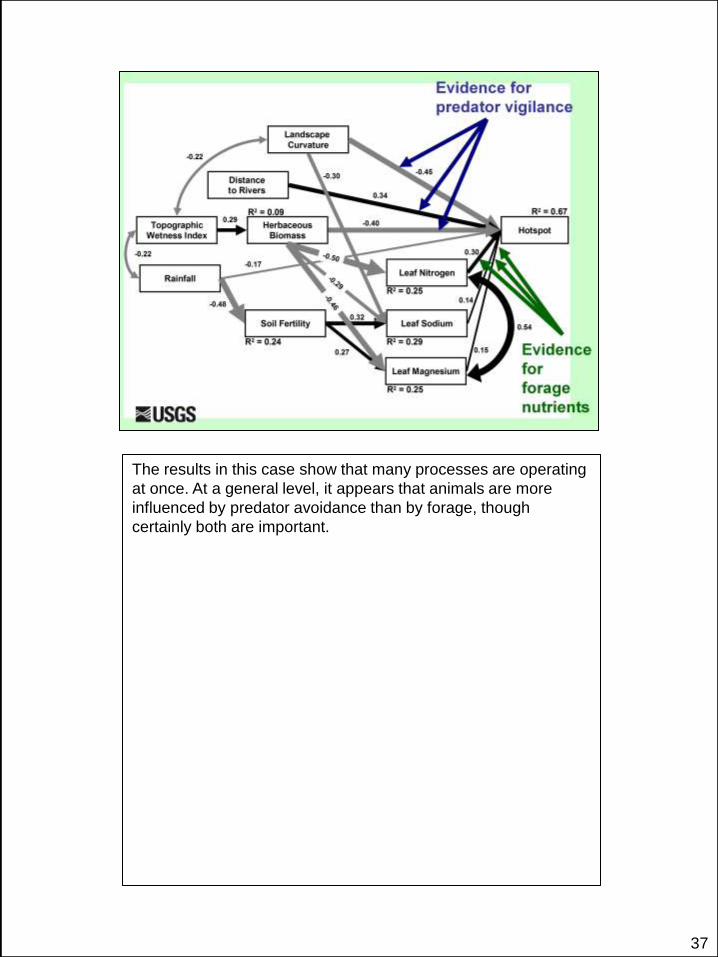
The results in this case show that many processes are operating
at once. At a general level, it appears that animals are more
influenced by predator avoidance than by forage, though
certainly both are important.

38
Conclusions emphasize that hotspots require certain landscape
features favorable for predator detection. Soils and positions
within the larger gradients of soils and rainfall also play a role.
A major point made in the paper is that SEM provides a way past
the dichotomy of previous debates which have been fueled in
part by the reductionist nature of traditional statistical models.

39 39
Support for this work included numerous groups and individuals.