Embed Size (px)
Citation preview

This presentation has been prepared by Phoenix Copper Limited (Phoenix Copper). It is not a disclosure document nor does it constitute the provision of financial product advice. Where Phoenix Copper expresses or implies an expectation or belief as to future events or results, such expectation or belief is expressed in good faith and believed to have a reasonable basis. However, forward-looking statements are subject to risks, uncertainties and other factors, which could cause actual results to differ materially from future results expressed, projected or implied by such forward-looking statements. This information is provided expressly on the basis that the recipient will carry out his or her own independent enquiries into the information and make his or her own independent decisions about the affairs, financial position and prospects of Phoenix Copper. No representation or warranty, express or implied, is made by Phoenix Copper that the information contained in this presentation will be achieved or prove to be correct. To the extent permitted by law, Phoenix Copper and its officers, employees, related bodies corporate and advisers expressly disclaim any responsibility for the accuracy or completeness of the information contained in this presentation and exclude all liability whatsoever for any loss or damage which may be suffered by any person as a consequence of any information or error in, or omission from, this presentation. Phoenix Copper does not undertake any obligation to release publicly revisions to any forward-looking statement, to reflect events or circumstances after the date of this presentation, or to reflect the occurrence of unanticipated events, except as may be required by law. Information in this presentation that relates to Exploration Results, Mineral Resources or Ore Reserves is based on previous announcements made by Phoenix Copper to ASX.

Mongolata
22-Oct-09 3

4
In the periods 1845 to 1877 and 1971 to 1981 the Monster Mine at Burra produced a total of 2.7Mt @ 3% Cu, and was at one time the largest mine in Australia and the second largest Copper mine in the world.
22-Oct-09 Burra 1847
Azurite in a face in the Monster Mine 1970s

5
Phoenix is exploring for:-
Non Sulphide Copper mineralisation in the near surface along strike and in similar hosts to the Monster Mine.
Sulphide and Non Sulphide Copper Ore at depth beneath previously worked oxide or carbonate copper mineralisation.
Phoenix is working to establish a robust genetic model for copper mineralisation throughout the Adelaide Geosyncline.
22-Oct-09

Phoenix Copper utilise field portable X-Ray Fluorescence analysers to collect geochemical data over all of our project areas. The bulk of the Burra tenement package is perfect for soil sampling.

Niton XL3T/Garmin GPS/Bluetooth connection
Omega: Heavier not as compactHas GIS, GPS package Used for infill mapping, sampling
Niton: compact and lightLarge element suite Au, Ba, BiUsed for 1st pass
Omega 6000 /Trimble Nomad/ MapInfo/ Encom Discover Mobile
ImagesSame
Relative Size

Trimble Nomad GPSMapInfo Encom Discover Mobile
Soil Stick and carry handle
Innov-X Omega 6000 hand held (Stick held) XRF Analyser
Phoenix Copper Ltd has become the first company in the world to use the innovative data assimilation combination in the form of the Innov‐X Omega Explore Package.

The Omega 6000 and Niton XL3T have given repeatable results in most conditionsThe Trimble Nomad running MapInfo Discover Mobile has the ability to show MapInfo TAB files and position the user in relation to tenements, topography, previous sampling, or other informationIt is a powerful tool for mapping and sampling
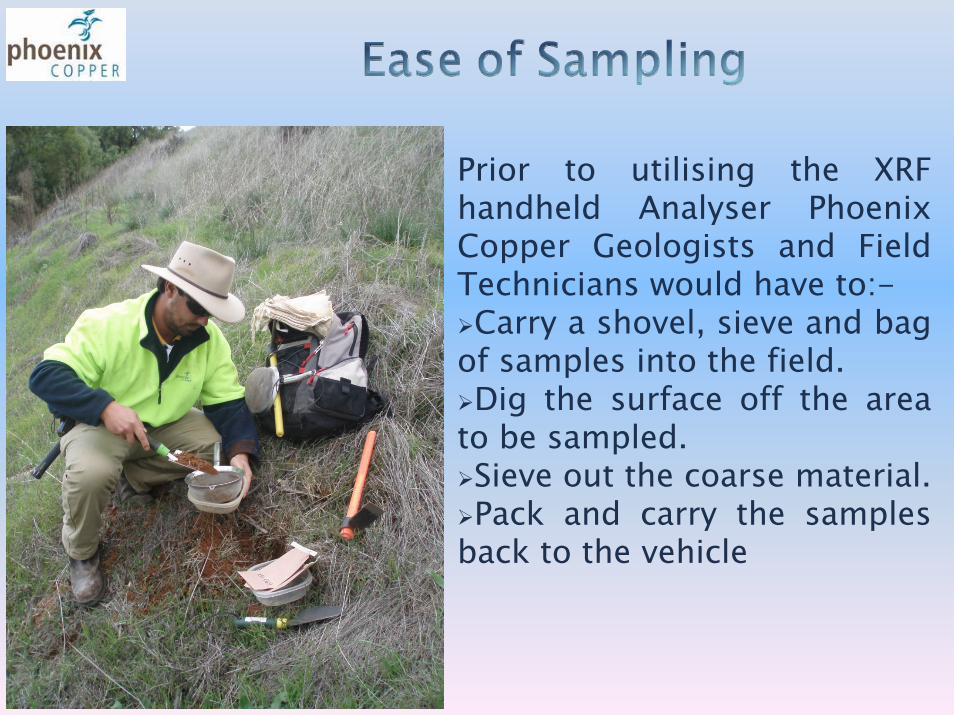
Prior to utilising the XRF handheld Analyser Phoenix Copper Geologists and Field Technicians would have to:-Carry a shovel, sieve and bag
of samples into the field.Dig the surface off the area
to be sampled.Sieve out the coarse material.Pack and carry the samples
back to the vehicle

Now they:-Scuff the ground with their
boots - taking a few centimetres off the surface, Place the analyser down
carefully Press the triggerTake the readingAccept GPS positionAdd commentObserve the data

Prior to using the XRF handheld Analyser.
Staff would dispatch the samples to a laboratory for assay.
Wait weeks for results to Wait weeks for results to returnreturn..
Then instigate an infill program over the most anomalous areas and go through the whole cycle again.
Two months later a decision could be made on the geochemical prospectivity of the ground.
ZZZZZZZZZZ

Now the assays are available on screen as soon as you press the trigger. You can react to the information immediately and adjust your
sampling program to suit.
Or call up the drill rig as soon as you want.

The FPXRFs have proven remarkably accurate against laboratory assaying on 120 and 60 second readings.(The Lab assays were taken on 10g of sieved soil samples pulverised mixed and digested using a mixture of nitric and hydrochloric acid. The resultant solution was bulked to volume with water and quantified using ICPMS with a 2ppm Cu low level of detection).
The Assays when contoured generally produced the same broad shape, and at least highlighted the same peak of the anomaly.
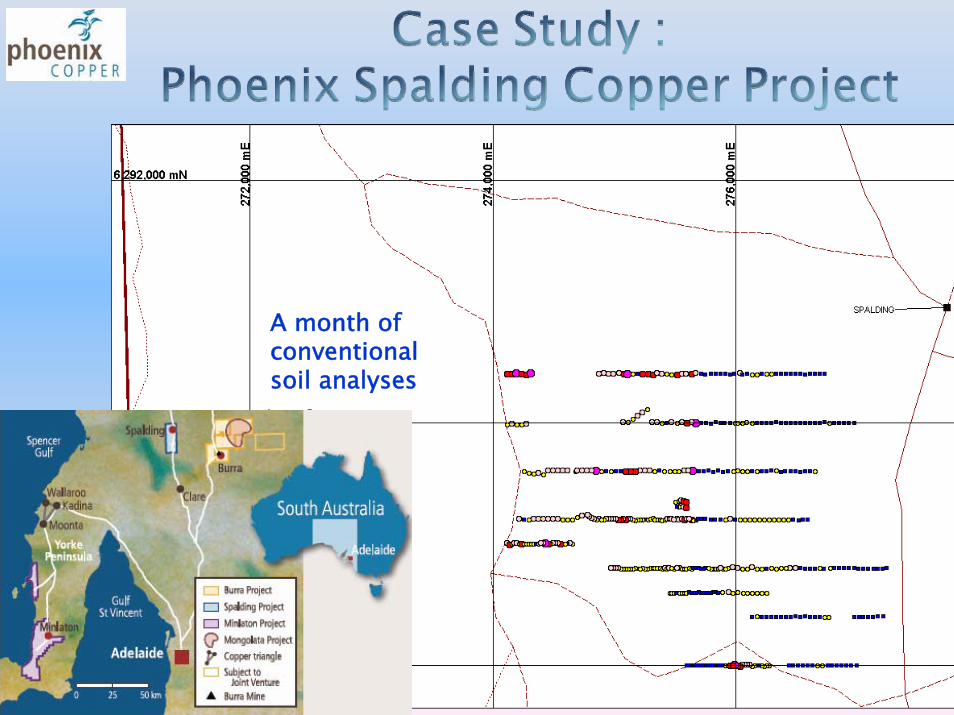
One month of soil sampling data
A month of conventional soil analyses

Add a month of XRF Analyses

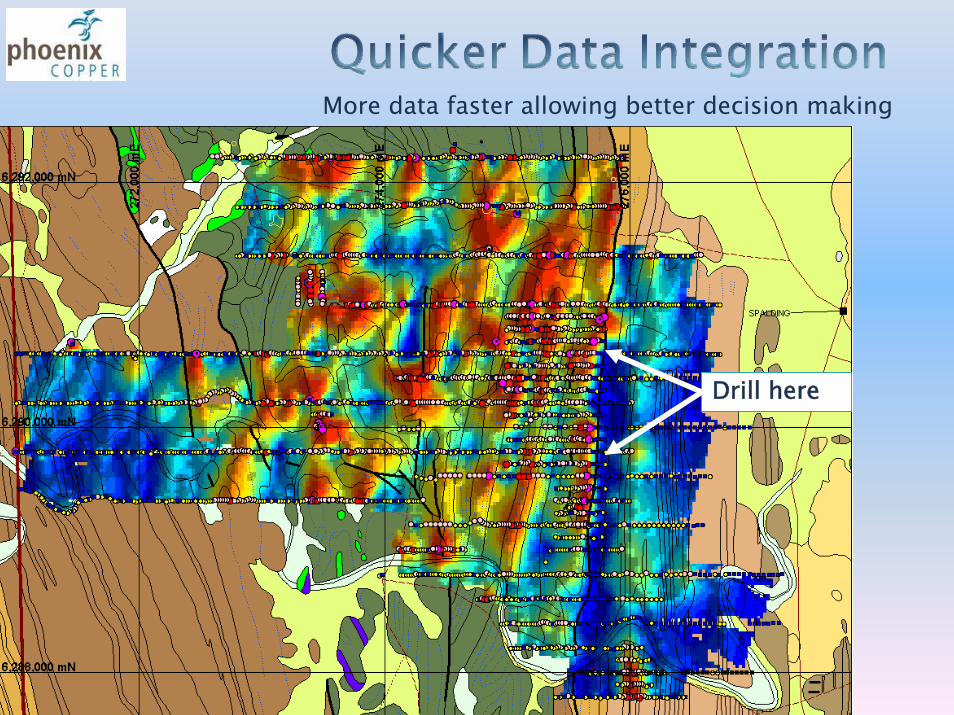
More data faster allowing better decision making
Drill here

An experiment was undertaken to determine if accurate XRF analysis can be obtained in 30 seconds.
•The accuracy of XRF analysis taken in 30 seconds versus 60 seconds measured against Laboratory analysis, was undertaken on a line of samples in the Spalding area. The soils are thin layers of calcareous silty clays overlying and surrounding subcropping Neoproterozoic siltstones, shales and dolomites.
•Five analyses were taken on the same ground at about the same point:•Sieved dry soil sample analysed in a laboratory via Aqua Regia with mass or optical spectrometer finish. •Niton XL3T XRF analysis 30 second reading and Niton XL3T analysis 60 second reading•Omega 6000 XRF analysis 30 second reading and Omega 6000 XRF analysis 60 second reading

Lab Assay
Niton 30 secsSpalding
6288000N Line
Samples 20m apart from 275820E to
276160E Niton 60 Secs
In this instance the Cu anomaly was surprisingly best represented
by 30sec readings but still defined in
60s analysis
Cu ppm

Lab Assay
Omega 30 secs
Omega 60 secs
Cu ppm
Spalding 6288000N
Line
Samples 20m apart from 275820E to
276160E
Anomaly is well represented by both
60sec and 30sec analysis

Pb ppm
Spalding 6288000N
Line
Samples 20m apart from 275820E to
276160E
Lab Assay
Niton30 secs
Niton60 secs
Anomaly best represented by 60sec readings but still well
defined in 30s analysis

Omega30 secs
Omega 60 secs
Pb ppm
Spalding 6288000N
Line
Samples 20m apart from 275820E to
276160E
Lab Assay
Anomaly best represented by 60sec
readings but still defined in 30s
analysis

Zn ppmSpalding
6288000N Line
Samples 20m apart from 275800E to
276280ENiton 60 secs
Lab Assay
Niton 30 secs
Anomaly best represented by 60sec readings
but still well defined in 30s
analysis
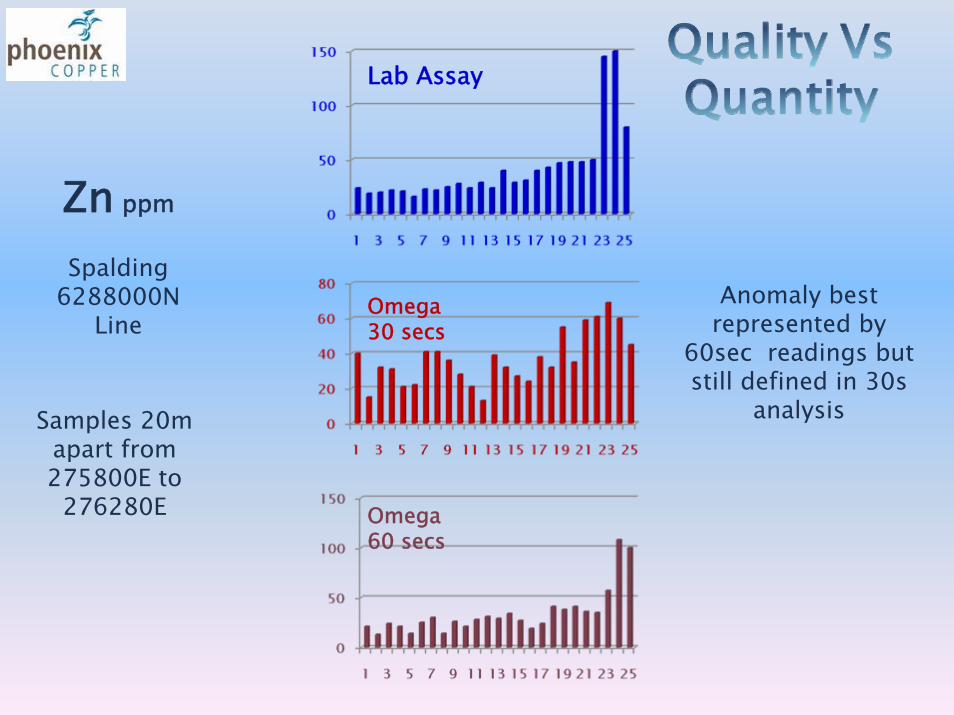
Omega 30 secs
Omega 60 secs
Lab Assay
Zn ppm
Spalding 6288000N
Line
Samples 20m apart from 275800E to
276280E
Anomaly best represented by
60sec readings but still defined in 30s
analysis

Ba ppm
Spalding 6288000N
Line
Niton 60 secs
Anomaly best represented by 60sec readings
but still well defined in 30s
analysis
Niton 30 secs
Samples 20m apart from 275800E to
276280E

An experiment was undertaken to determine if FPXRF Analysers provide Accurate Results in Damp Soil
The experiment was undertaken on the 6,288,000N (AGD94) line of samples in the Spalding area. The soils are thin layers of calcareous silty clays overlying and surrounding subcropping Neoproterozoic siltstones, shales and dolomites.
Five analyses were taken on the same ground at about the same point:Sieved dry soil sample analysed in a laboratory via Aqua Regia with mass or optical spectrometer finish. Niton XL3T XRF analysis 60 second reading in damp soil after a rainfall and 60 second reading dry soil.Omega 6000 XRF analysis 60 second reading damp soil after a rainfall and 60 second reading dry soil.

Lab Assay
Omega 60 secs
Cu ppm
Spalding 6288000N
Line Anomaly best represented by
60sec Dry readings but still
defined in wet analysis
Omega 60 secs Wet
Samples 20m apart from 275820E to
276160E

Lab Assay
Niton 60 secs
Niton 60 secs Wet
Cu ppm
Spalding 6288000N
LineSamples 20m
apart from 275820E to
276160E
Anomaly best represented by
60sec Dry readings but still
defined in wet analysis

Omega 60 secs
Omega 60 secs Wet
Pb ppm
Spalding 6288000N
Line
Samples 20m apart from 275820E to
276160E
Anomaly well represented by 60sec Dry and
60sec Wet readings
Lab Assay

Niton 60 secs WET
Pb ppm
Spalding 6288000N
LineSamples 20m
apart from 275820E to
276160EAnomaly modestly
represented by both 60sec Dry and 60sec Wet readings
Lab Assay
Niton 60 secsDry

Omega 60 secs Dry
Omega 60 secs Wet
Samples 20m apart from 275800E to
276280E
Anomaly well represented by both 60sec Dry and 60sec
Wet readings
Lab Assay
Zn ppm
Spalding 6288000N
Line

Niton 60 secs WET
Niton 60 secs Dry
Lab Assay
Zn ppm
Spalding 6288000N
Line
Anomaly well
represented by both
60sec Dry and 60sec
Wet readings
Samples 20m apart from 275800E to
276280E

Myth Busters60 sec readings have proven only slightly better than 30sec readings on data from the orientation line at Spalding.Readings taken in damp conditions were only marginally less accurate than those taken on dry soils.

Set upComplexity, and Support from the Supplier Support from the Supplier Who uses machine, Geologist or Field Technician?Is it fool proof? Some require exact sequencing
SafetyDifferent units emit different radiation levels and training required to use safely
Punctured Window
Manual handlingWeight Ease to carryNumber of components to take into field (some have short battery life and require all the charging equipment nearby)Fragility almost all the analysers are very fragile and extreme care must be taken to protect them from knocks and bumps.Detector window penetration by stones, sticks or stubble - repair cost up to $6K

PerformanceUnderstand what your XRF doesAccuracyRepeatabilityDo you need Absolute or Comparative Values?You measure a 5mm by 10mm by 6mm depth window in to the materialHomogeneity of the sample critical i.e. Soil Vs RockDrill Chip AnalysingDrill Core AnalysingVisibility of the screen in direct sunlightBattery Life
Down load and DataComplexityGPS and XRF data are they separate or together? How do you knit them?Is the data immediately available to be imported and used in your desktop GIS system? This is still problematic with some units.Support from the SupplierSupport from the Supplier
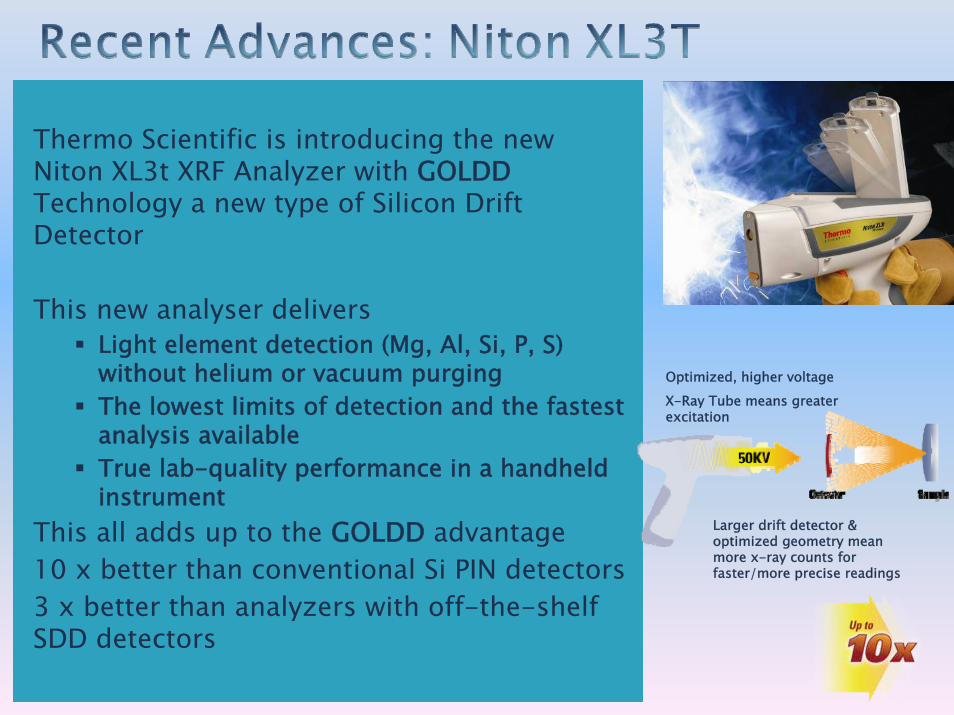
Thermo Scientific is introducing the new Niton XL3t XRF Analyzer with GOLDDTechnology a new type of Silicon Drift Detector
This new analyser deliversLight element detection (Mg, Al, Si, P, S) without helium or vacuum purging The lowest limits of detection and the fastest analysis availableTrue lab-quality performance in a handheld instrument
This all adds up to the GOLDD advantage10 x better than conventional Si PIN detectors3 x better than analyzers with off-the-shelf SDD detectors
Optimized, higher voltage
X-Ray Tube means greater excitation
Larger drift detector & optimized geometry mean more x-ray counts for faster/more precise readings

• Best ResolutionThe X-Press SDD is designed to operate at 150eV resolution compared to a traditional SiPiN’s 175eV re – the best choice for resolving difficult elements/peaks.
• Highest Count RatesThe X-Press SDD can sustain up to 100kcps without loss of resolution compared to
10-15kcps for PiN’s – the best choice for improving LOD’s and analyzing Light Elements (lower atomic # elements - LZEs) such as Mg, Al, & Si;
• Best Peak-to-Background The X-Press doesn’t have noisy backgrounds to mask elements/peaks of interest like SiPiN’s can have – the best choice for complex matrices and for applications requiring the highest levels of precision and analytical confidence.
1
2
3

PNX decided to use the XRF on 60sec readings for first pass and 30sec readings for infill analysis on Cu projects.Therefore depending upon line spacing and topography about 240 analyses can be taken in an average 8 hour day.Phoenix has collected over 25,000 analyses in the past 12 months Laboratory assays with a similar but less extensive suite of elements cost PNX ~$37.50 each and we have taken 2000 of those as check and follow up assays.Had the XRF sampling been done conventionally it would have taken an extra year or two and cost an extra $937,500 The ~$75,000 investment was well worth while.

Using Field Portable X-Ray Fluorescence analysers, with integrated GPS has been:
Cost effective Cost effective saving almost $1million in assay cost in 12 months.
AccurateAccurate having been tested against laboratory assays for copper.
FastFast allowing quick identification of anomalous areas and or increased density of geochemical coverage those zones of interest.
It provides an excellent way to explore an excellent way to explore for minerals.