Embed Size (px)
Citation preview

This is an author produced version of a paper published in Intensive Care Med. This paper has been peer-reviewed but does not include the final publisher
proof-corrections or journal pagination.
Citation for the published paper: Dubniks, Maris and Persson, Johan and Grande, Per-Olof.
"Plasma volume expansion of 5% albumin, 4% gelatine, 6% HES 130/0.4 and normal saline under increased microvascular permeability in the rat"
Intensive Care Med, 2006, Issue: Nov 21. http://dx.doi.org/ 10.1007/s00134-006-0454-5
Access to the published version may require journal subscription.
Published with permission from: SpringerLink
1
Plasma volume expansion of 5% albumin, 4% gelatine, 6% HES 130/0.4
and normal saline under increased microvascular permeability in the rat
Maris Dubniks, Johan Persson, Per-Olof Grände
Department of Anaesthesiology and Intensive Care
Lund University and Lund University Hospital, Lund, Sweden
Correspondence: Maris Dubniks, Department of Anaesthesiology and Intensive Care, Lund
University Hospital, SE-221 85 Lund, Sweden
Tel: +46 46 2227753
Fax: +46 46 2224546
Key words: colloids, crystalloids, vascular permeability, plasma volume, transcapillary fluid
exchange

2
Abstract
Objective: To compare the colloids 5% albumin, 4% gelatine, and 6% HES 130/0.4 with one
another, and with saline, regarding their plasma expanding effects at increased permeability,
and to compare the results with those from a previous study at normal permeability.
Design: Prospective controlled randomised laboratory study.
Setting: University research laboratory.
Subjects: 48 adult male Sprague-Dawly rats.
Interventions: Permeability was increased by an injection of 0.5 ml dextran 70 using the fact that
dextran causes anaphylactic reaction in the rat. Plasma volume was determined (125I albumin tracer
technique) after anaesthesia, 1 h after the dextran injection (before infusion for 10-15 min of 20
ml/kg bw of each of the colloids or 80 ml/kg of saline), and 3 h later. Blood pressure, haematocrit,
blood gases and electrolytes were measured. CVP was measured in 4 rats.
Measurements and results: Plasma volume was 41.1±1.9 ml/kg at baseline (n=9), and
29.1±4.1 ml/kg (n=35) 1 h after the dextran injection (p<0.05). Three hours after infusion of
the plasma expander, plasma volume had increased by 17.1±3.4 ml/kg in the albumin group,
by 7.9±3.6 ml/kg in the gelatine group, by 7.4±4.4 ml/kg in the HES group, and by 12.2±3.1
ml/kg in the saline group. It was unchanged in a control group given no solution (n=7 for all
groups) (Means ± SD).
Conclusion: Albumin was a more effective plasma volume expander than gelatine or HES or
saline (p<0.05), which were equally effective. All solutions showed a smaller plasma
expanding effect than observed in a previous study with normal permeability.
3
Introduction
Increased microvascular permeability is an important pathophysiological alteration in diseases
such as sepsis/SIRS and following trauma, and results in increased transcapillary leakage of
plasma fluid, hypovolaemia and interstitial oedema [1-3]. Hypovolaemia will decrease cardiac
output resulting in reduced systemic oxygen delivery, and trigger generalized vasoconstriction
by activation of the baroreceptor reflex through unloading of the high- and low-pressure
receptors, which may lead to compromised perfusion in more vulnerable regions such as the
gut [4-7]. Correction of low plasma volume therefore may be essential to maintain adequate
organ perfusion and oxygen delivery [8, 9].
Crystalloids (all molecules of molecular weight (MW) less than 30 kDa) and colloids (also
containing molecules > 30 kDa) are used as plasma volume expanders. For decades there has
been a debate regarding whether one should use crystalloids or colloids [10-13], but there is
also a debate regarding the efficacy of different colloids [14-16]. In contrast to colloids,
crystalloids have small effects on coagulation, there is no risk of inducing allergic reactions,
and they are inexpensive. Crystalloids are, however, relatively ineffective as plasma volume
expanders as they pass freely across the capillary membrane, with fast distribution to the
whole extracellular space, and only a minor proportion remaining in the bloodstream [11, 17,
18]. This means that relatively large volumes must be infused to maintain normovolaemia
with risk of adverse tissue oedema [16]. Because of the larger MW, the transcapillary passage
of colloid solutions is markedly restricted and they will therefore remain in the bloodstream
for longer. The oncotic effect of the colloid may also reinforce their plasma expanding
capacity [19, 20]. However, the plasma expanding effect of colloids is transient due to a
continuous clearance from the circulation related to the rate of degradation, renal and
gastrointestinal losses, and due to a continuous leakage of macromolecules into the interstitial
4
space [16]. According to the modern 2-pore theory of transvascular exchange [21],
transcapillary leakage of macromolecules occurs through the large pores of the
capillary/venular membrane and is compatible with the view that it is greater at increased
permeability than at normal permeability. Except size and number of the large pores,
transcapillary leakage may also be influenced by charge of the molecules and their interaction
with glycocalyx and other endothelial structures [22, 23].
There are still no studies comparing the plasma expanding effect of contemporary colloid
solutions, and of crystalloids using direct measurements of plasma volume specifically under
a condition of increased permeability. The present study was designed to evaluate the plasma
expanding effects of 5% albumin, 4% succinylated gelatine, 6% HES 130/0.4, and of saline
on rats suffering a generalized increased permeability. The increased permeability was
achieved from a bolus injection of dextran, based on the well-known phenomenon that
dextran induces anaphylactic reaction with increased permeability in the rat [24, 25].
Methods
Materials and anaesthesia
The study was approved by the local ethics committee for animal research, and the animals
were treated in accordance with the Guidelines of the National Institutes of Health for Care
and Use of Laboratory Animals. Adult male Sprague-Dewley rats (n = 48), weighing 347 ±
11 g were used. Anaesthesia was induced by placing the animal in a covered glass container
with a continuous supply of isoflurane (Forene; Abbot, Stockholm), and maintained, first by
inhalation of 1.5-1.8% isoflurane, by means of facemask, and later by a tracheal cannula after
tracheotomy. The animals were placed on a heating pad to maintain a body core temperature
(measured rectally) of 37.0−37.3ºC via a feedback circuit. After tracheotomy, the animals

5
were connected to a ventilator (Ugo Basile; Biological Research Apparatus, Comerio, Italy).
End-tidal PCO2 was monitored continuously and kept between 4.7 and 5.4 kPa (Capstar-1000,
CWE, Ardmore, PA). The left femoral artery was cannulated for continuous measurement of
arterial pressure and to measure arterial blood gases (i-STAT; Hewlett Packard, Böblingen,
Germany). The left femoral vein was cannulated and used for injections and infusions. At the
end of the experiment the animals were euthanised by decapitation.
Experimental protocol.
The study was randomised but not blinded and involved four groups with seven rats in each,
which were defined according to the volume expander given, and a control group given no
solution. Central venous pressure was measured in 4 separate rats via the right internal jugular
vein to evaluate if venous pressure effects on hydrostatic capillary pressure might have
influenced the transcapillary leakage (see Discussion). The groups were the control group, the
albumin group (5% albumin, Aventis Behring, Marburg, Germany), the gelatine group (4%
gelofusine, Braun, Melsungen, Germany), the HES group (6% HES 130/0.4, Voluven,
Fresenius, Halden, Norway), and the saline group (0.9% NaCl, Fresenius, Halden, Norway).
Following a stabilisation period of 15 min after tracheotomy and vascular cannulations, the
animals received an intravenous injection of 0.5 ml dextran 70 (Macrodex 6%; Pharmalink
AB, Upplands Väsby, Sweden) for the purpose of increasing microvascular permeability.
The colloid solutions at a dose of 20 ml/kg body weight or normal saline at a dose of 80 ml/kg
were given 1 h after the dextran injection (Fig. 1). Unpublished observation from previous
experiments had shown that the decrease in plasma volume following a dextran injection
reaches its maximum within 1 h, a result confirmed in the present study in the control group
given no plasma expander (see Results). The time for infusion was 10 min for the colloids,

6
but 15 min for saline to minimize the risk for acute fluid overload. Arterial blood gases were
measured just before the dextran injection (baseline values), 1 h after injection of dextran
before infusion of the plasma expander, immediately after the infusion, and 3 h after the
infusion (Fig. 1). Plasma baseline volume was measured after finishing the preparation, 1 h
after the dextran injection before the infusion, and 3 h after the infusion (Fig.1).
The plasma volume (V) was calculated by measurement of the increase in radioactivity per ml
of plasma (∆C2) after an intravenous injection of a known amount of activity of 125I-albumin
(C1) (31)
V = C1/∆C2
Radioactivity was measured with gamma counter (Wizard 1480, LKB-Wallace, Turku,
Finland). The increase in radioactivity of 125I-albumin (∆C2) was determined by subtracting
the activity in a blood sample taken before the injection from that taken 5 min after the
injection, thereby taking into account the cumulative effects of radioactivity. The blood was
centrifuged and the radioactivity in a fixed volume of plasma was determined. To determine
the exact dose injected, the radioactivity of the emptied vial, the syringe and the needles used
was subtracted from the total radioactivity in the prepared dose.
Statistics
Results are presented as mean values ± SD. Statistical comparisons between groups were
performed with the non-parametric Mann-Whitney rank sum test and ANOVA which, when
necessary, was adjusted for multiple comparisons (Bonferroni). P-values less than 0.05 were
considered significant. Sigma Stat 2.0 software was used.

7
Results
Physiological data
The data for haemoglobin (Hb), sodium (Na+), potassium (K+), pH, base excess (BE), PaO2,
and PaCO2 for the different groups are summarized in Table 1. Hb increased from 135 ± 6
before the dextran infusion to 157 ± 13 g/l (n = 35) 1 h after the dextran infusion (p<0.05).
Infusion of the plasma expander caused a decrease in Hb, followed by a successive increase.
At the end of the experiment, Hb levels had increased in all groups, reaching significance
compared with the baseline values in the gelatine and HES groups. Na+ and K+ did not differ
between groups. Mean arterial blood pressure values at baseline, 1 hour after the dextran
injection, after infusion of the plasma volume expander, and 3 h later at the end of the
experiment are presented in Table 2. There was a lower arterial blood pressure 1 h after the
dextran injection and 3 h after infusion of the plasma expander than at baseline. Arterial blood
pressure was lower for all solutions at end of the experiment than shortly after the infusion.
For pH, PaO2 and PaCO2, and BE there was no difference between the groups, except from a
decrease in BE in the saline group after the saline infusion and at the end of the experiment.
In the 4 experiments performed for measurement of central venous pressure, baseline central
venous pressure was 3.0 ± 0.3 mmHg. It was 2.2 ± 0.7 mmHg 1 hour after the dextran
injection, 3.3 ± 0.5 mmHg after the albumin infusion, and 3.0 ± 0.8 at end of the experiment.
Plasma volume
Baseline plasma volume determined in separate experiments (n=9) was 41.1 ± 1.9 ml/kg.
Plasma volume directly before infusion of the plasma volume expander was 29.1 ± 4.1 ml/kg
(n = 35) (p<0.05) with no difference between the five groups. The remaining increase in
plasma volume 3 h after infusion of plasma expander (20 ml/kg for the colloids and 80 ml/kg
for saline) (PV3-PV2 in Fig. 1) is shown in Fig. 2; it was 17.1 ± 3.4 ml/kg in the albumin
8
group, 7.9 ± 3.6 ml/kg in the gelatine group, 7.4±4.4 ml/kg in the HES group, and 12.2 ± 3.1
ml/kg in the saline group. The plasma expanding effect was larger in the albumin group than
in the other groups (p<0.05). There were no significant differences between the HES, the
gelatine and the saline groups. There was no change in plasma volume in the control group
from 1 h after the dextran injection to the end of the experiment.
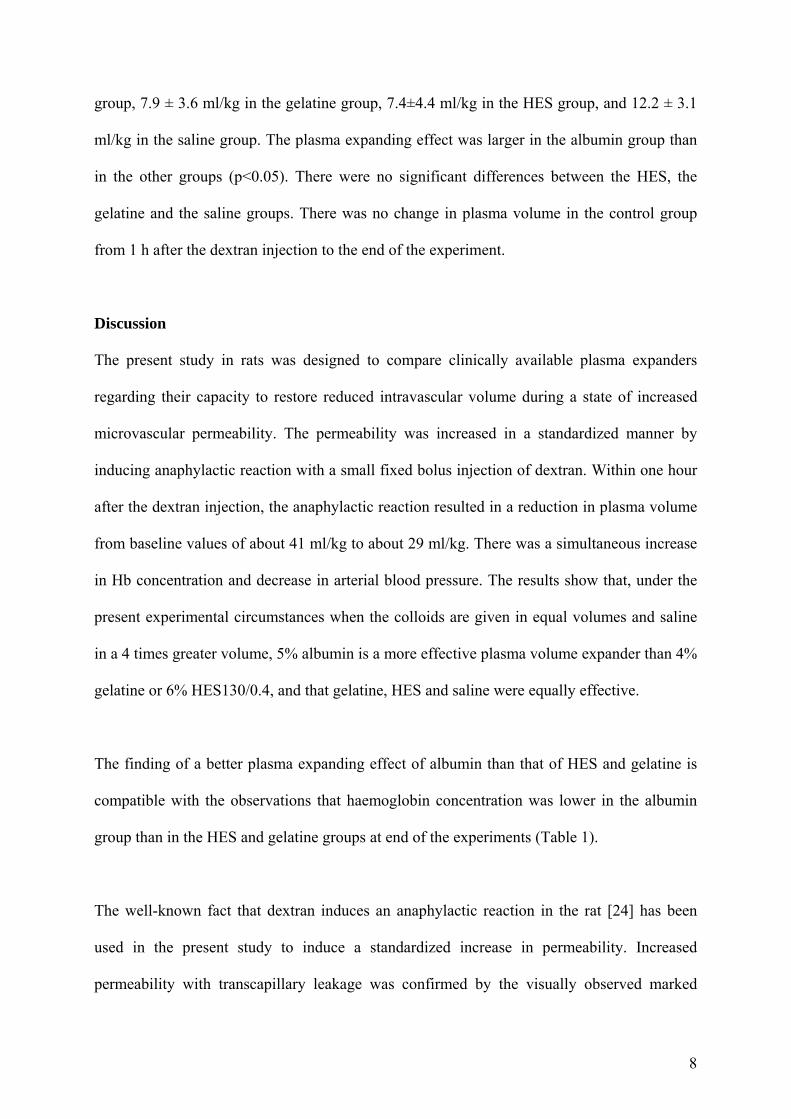
Discussion
The present study in rats was designed to compare clinically available plasma expanders
regarding their capacity to restore reduced intravascular volume during a state of increased
microvascular permeability. The permeability was increased in a standardized manner by
inducing anaphylactic reaction with a small fixed bolus injection of dextran. Within one hour
after the dextran injection, the anaphylactic reaction resulted in a reduction in plasma volume
from baseline values of about 41 ml/kg to about 29 ml/kg. There was a simultaneous increase
in Hb concentration and decrease in arterial blood pressure. The results show that, under the
present experimental circumstances when the colloids are given in equal volumes and saline
in a 4 times greater volume, 5% albumin is a more effective plasma volume expander than 4%
gelatine or 6% HES130/0.4, and that gelatine, HES and saline were equally effective.
The finding of a better plasma expanding effect of albumin than that of HES and gelatine is
compatible with the observations that haemoglobin concentration was lower in the albumin
group than in the HES and gelatine groups at end of the experiments (Table 1).
The well-known fact that dextran induces an anaphylactic reaction in the rat [24] has been
used in the present study to induce a standardized increase in permeability. Increased
permeability with transcapillary leakage was confirmed by the visually observed marked
9
peripheral oedema that developed shortly after the dextran injection, by the equally large
reduction in plasma volume for all groups, by the reduction in mean arterial pressure (Table
2), and by the increase in haemoglobin concentration (Table 1).
The tracer albumin technique is well established for measurement of plasma volume. Because
of transcapillary escape of albumin during the 5-min period between tracer injection and
blood sampling, the albumin-derived radioactivity measured in plasma may have been
somewhat decreased, resulting in overestimation of the plasma volume. The overestimation,
however, must be equally large for all groups and it must be small as the blood sample was
taken very shortly (5 min) after the tracer injection. The fact that measured baseline plasma
volume of about 41 ml/kg are in the same range as those presented in the literature for rats of
39-42 ml/kg [26] confirms the reliability of the plasma volume measuring technique used.
An increase in transcapillary leakage of macromolecules at increased permeability is
compatible with the 2-pore theory of transcapillary fluid exchange [21]. According to this
theory, fluid and smaller solutes pass the capillary membrane through all pores along the
entire microvascular bed, whereas macromolecules pass the capillary membrane only through
the 10–30 ×103 times less common larger pores present in venules and at the venous side of
the capillary network. The transcapillary/transvenular hydrostatic pressure is the only force
responsible for fluid flow through the large pores, as the oncotic pressure across these pores is
virtually zero [21]. This means that the macromolecules are lost to the interstitium mainly
through convection by following the large-pore fluid flux, while the diffusion force is of less
importance [21]. This hypothesis means that there is always a continuous leakage of
macromolecules (normal transcapillary escape rate) and even a minute increase in total pore
area via the large pores may cause a substantially greater loss of macromolecules. This means

10
that the plasma expansion of a colloid must be less effective at increased permeability than at
normal permeability. Thus, the 2-pore theory is compatible with a less effective plasma
expanding effect of colloids at raised than at normal permeability.
This hypothesis also means that the leakage of proteins through the large pores will increase
with an increase in hydrostatic capillary pressure. If so, the leakage will be higher at a high
systemic arterial pressure than at a low one. Transcapillary leakage of proteins can therefore
be expected to increase after volume expansion, if the infusion is followed by an increase in
arterial pressure. Our results that, there was no loss of plasma volume in the control group
from 1 h after the dextran infusion up to end of the experiment, while there was a significant
loss of plasma in the groups given a plasma expander, may be explained by the lower arterial
pressure in the control group (Table 2). The hypothesis also means that avoidance of
supranormal arterial pressure may help to preserve the plasma volume and to reduce the need
for plasma expanders.
The plasma volume expanders analysed in the present study have been examined in the rat
previously in our laboratory but under the condition of normal permeability [27]. In that
study, blood volume was reduced before the infusion by a standardized haemorrhage of 16
ml/kg, a reduction in plasma volume of about the same magnitude as that obtained by the
dextran infusion in the present study. While plasma volume increased by 21.1 ml/kg 3 h after
the infusion of 20 ml/kg of 5% albumin in our previous study, it increased by 17.1 ml/kg in
the present study. Corresponding values for gelatine were 13.1 versus 7.9 ml/kg, and 13.8
versus 7.4 ml/kg for HES 130/0.4. For saline, after the infusion of 80 ml/kg the values were
16.0 ml/kg in the previous study versus 12.2 ml/kg. This difference in plasma loss between
the 2 studies may, if anything, even have been somewhat underestimated due to a larger

11
leakage of tracer albumin during the 5 min timespan between injection and blood sampling
when permeability is increased.
In addition, arterial blood pressure was lower in the present study than in our previous study,
most likely an effect of the dextran-induced anaphylactic reaction. Thus, the blood pressure in
the present study was 5-10 mmHg lower after infusion of the plasma expander and 15-20
mmHg lower at end of the experiments (Table 2 and ref 27). If blood pressure is a factor
influencing transcapillary fluid loss as discussed above, the lower blood pressure have saved
plasma in the present study compared to the previous study [27]. Thus, also this factor means
that the effect of permeability on plasma volume leakage, if anything, is underrated when
making a direct comparison between the 2 studies.
If as discussed, the hydrostatic capillary pressure is of importance for transcapillary fluid loss,
also a change in venous pressure may have influenced the hydrostatic pressure. Differences in
venous pressure, however, cannot explain the difference in plasma expansion between the
groups as the better the plasma expansion of the solution the higher the venous pressure. The
fact that central venous pressures measured in 4 separate rats given the best plasma expander
albumin did not increase to values above normal (see Results) also indicate that a difference
in venous pressure cannot explain the difference between plasma expansion in the present and
the previous study [27]. Nor can the difference in Hb explain the difference in plasma
expansion between the 2 studies, as experimental studies have shown that plasma leakage is
lower at a high than at a lowered Hb [28], and the Hb values were higher in the present study
than in our previous study. Taking all these arguments together, a comparison between the 2
studies thus strongly indicates that the plasma expanding effect of all solutions analysed is
lower at increased than at normal permeability.

12
It is well accepted, and also in line with the 2-pore theory [21], that crystalloids are distributed
rather fast to the whole extracellular space, and the volumes infused must be much larger than
those for colloids for the same plasma expanding effect. This hypothesis was confirmed in the
present study where the plasma expanding effect of saline was worse than that with albumin
and showed only a tendency (not significant) of better volume effect than with gelatine and
HES when saline was given in a 4 times larger volume (Fig. 2).
The difference in plasma expanding effects of the colloids analysed may have several
explanations. Factors of importance may be average MW, MW distribution, oncotic pressure
of the solution, degradation rate, threshold for renal elimination, molecular shape and
electrical charge, and interference with glycocalyx [17, 18, 20, 22, 23, 29, 30]. Gelatine and
HES are neutral molecules whereas albumin is negatively charged, which may prevent its
penetration. Albumin is a monodisperse solution with a molecular weight of 69 kDa for all
molecules, with insignificant degradation rate. Both HES and gelatine are polydisperse
solutions with molecules ranging from very small to very large, and the larger molecules will
undergo enzymatic degradation to smaller molecules. The small molecules will disappear
relatively quickly from the intravascular space to the interstitium and will be cleared through
the kidneys. HES solutions, and especially HES 130/0.4 with its low degree of substitution,
are degraded by amylase to smaller molecules. The degradation rate of HES may be faster in
rats than in man, due to the higher amylase concentration in rats. The gelatine molecules, with
a relatively small average molecular weight of 35 kDa, undergo degradation by proteases in
the reticuloendothelial system. Thus, several factors may be responsible for the better plasma
volume expanding effect with 5% albumin than with gelatine and HES in the present study,
and why gelatine and HES were equally effective despite the difference in molecular weight.
13
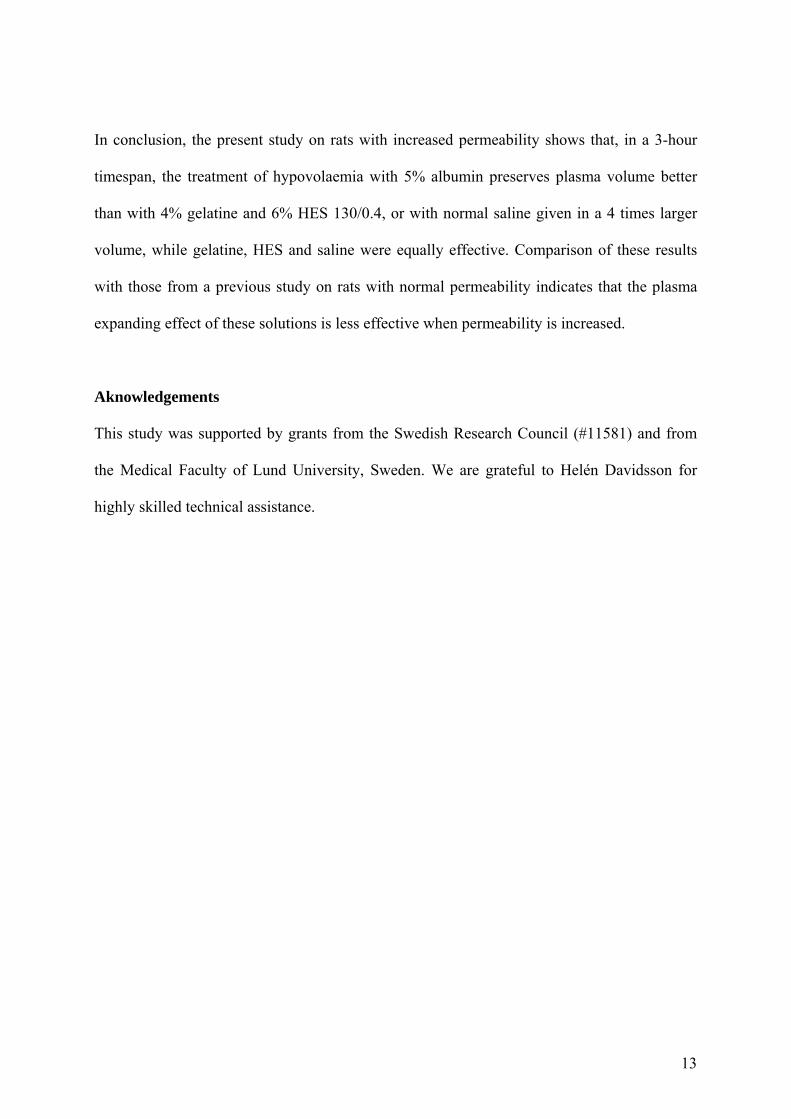
In conclusion, the present study on rats with increased permeability shows that, in a 3-hour
timespan, the treatment of hypovolaemia with 5% albumin preserves plasma volume better
than with 4% gelatine and 6% HES 130/0.4, or with normal saline given in a 4 times larger
volume, while gelatine, HES and saline were equally effective. Comparison of these results
with those from a previous study on rats with normal permeability indicates that the plasma
expanding effect of these solutions is less effective when permeability is increased.
Aknowledgements
This study was supported by grants from the Swedish Research Council (#11581) and from
the Medical Faculty of Lund University, Sweden. We are grateful to Helén Davidsson for
highly skilled technical assistance.

14
References
1. Groeneveld AB, Teule GJ, Bronsveld W, van den Bos GC, Thijs LG (1987) Increased
systemic microvascular albumin flux in septic shock. Intensive Care Med 13:140-2
2. Christ F, Gamble J, Garside IB, Kox WJ (1998) Increased microvascular water
permeability in patients with septic shock, assessed with venous congestion
pletismography (VCP). Intensive Care Med 24:18-27
3. Fleck A, Raines G, Hawker F, Trotter J, Wallace PI, Ledningham IM, Calman KC (1985)
Increased vascular permeability: a major cause of hypoalbuminaemia in disease and
injury. Lancet 1:781-4
4. Hinshaw LB (1996) Sepsis/septic shock: participation of the microcirculation: an
abbreviated review. Crit Care Med 24:1072-8
5. Hollbeck S, Grände PO (2002) Hypovolemia is a main factor behind disturbed perfusion
and metabolism in the intestine during endotoxaemia in cat. Shock 18:367-73
6. Hassoun HT, Kone BC, Mercer DW, Moody FG, Weisbrodt NW, Moore FA (2001)
Postoperative multiple organ failure: the role of the gut. Shock 15:1-10
7. Fink MP (1991) Gastrointestinal mucosal injury in experimental models of shock, trauma,
and sepsis. Crit Care Med 19:627-41
8. Imm A, Carlson RW (1993) Fluid resuscitation in circulatory shock. Crit Care Clin 9:313-
33
9. Haupt MT, Gilbert EM, Carlson RW (1985) Fluid loading increases oxygen consumption
in septic patients with lactic acidosis. Am Rev Respir Dis 131:912-916
10. Virgilio RW, Rice CL, Smith DE, James DR, Zarins CK, Hobelmann CF, Peters RM
(1979) Crystalloid vs. colloid: is one better? A randomised clinical study. Surgery 105:65-
71

15
11. Hillmann K Bishop G, Bristow P (1997) The crystalloid versus colloid controversy:
present status in Plasma volume support, H. Haljamae, Editor. Baillière Tindall. p.1-13
12. Roberts I, Alderson P, Bunn F, Chinnock, Ker K, Schiethout G (2004) Colloids versus
crystalloids for fluid resuscitation in critically ill patients. Cochrane Database Syst Rev
CD000567
13. Schierhout G, Roberts I (1998) Fluid resuscitation with colloid or crystalloid solutions in
critically ill patients: a systemic review of randomised trials. BMJ 316:961-4
14. Beards SC, Watt T, Edwards JD, Nightingale P, Farragher EB (1994) Comparison of the
hemodynamic and oxygen transport responses to modified fluid gelatine and hetastarch in
critically ill patients: a prospective, randomised trial. Crit Care Med 22:600-5
15. Marx G, Cobas Mayer M, Schuerholz T, Vangerow B,Gratz K, Hecker H, Sumpelmann
R, Rueckoldt H, Leuwer M (2002) Hydroxyethyl starch and modified fluid gelatine
maintain plasma volume in a porcine model of septic shock with capillary leakage.
Intensive Care Med 28:629-35
16. Marx G (2003) Fluid therapy in sepsis with capillary leakage. Eur J Anaesthesiol 20:429-
42
17. Haljamae H (1985) Rationale for the use of Colloids in the treatment of shock and
hypovolaemia. Acta Anaesthesiol Scand Suppl 82:48-54
18. McIlroy DR, Kharasch ED (2003) Acute intravascular volume expansion with rapidly
administered crystalloid or colloid in the setting of moderate hypovolemia. Anesth Analg
96:1572-7
19. Grocott M, Mythen M (1999) Fluid therapy, in Baillière’s Clinical Anaesthesiology.
Harcourt Publishers Ltd.p.363-381

16
20. Vercueil A, Grocott M, Mythen MG (2005) Physiology, pharmacology, and rationale for
colloid administration for the maintenanace of effective hemodynamic stability in
critically ill patients. Transfus Med Rev 19:93-109
21. Rippe B, Haraldsson B (1994) Transport of macromolecules across microvascular walls:
the two-pore theory. Physiol Rev 74:163-219
22. Grocott MP, Hamilton MA (2002) Resuscitation fluids. Vox Sang 82:1-8
23. Bold J, Suttner S (2005) Plasma substitutes. Minerva Anestesiol 71:741-58
24. Guo Y, Hedquist P, Gustafsson LE (2001) Absence of mast cell involvement in active
systemic anaphylaxis in rats. Eur J Pharmacol 430:305-310
25. Majde JA (2003) Animal models for hemorrhage and resuscitation research. J Trauma
54:S100-105
26. Lundin S, Folkow B, Rippe B (1981) Central blood volume in spontaneously hypertensive
rats and Wistar-Kyoto normotensive rats. Acta Physiol Scand 112:257-262
27. Persson J, Grände PO (2005) Volume expansion of albumin, gelatin, hydroxyethyl starch,
saline and erythrocytes after haemorrhage in the rat. Intensive Care Med 31:296-301
28. Valeri CR, Cooper AG, Pivacek LE (1973) Limitations of measuring blood volume with
iodinated I 125 serum albumin. Arch Intern Med; 132:534-538
29. Arfors K-E, Buckley PB (1997) Pharmacological characteristics of artificial colloids, in
Plasma Volume Support, H Haljamae, Editor. W. B. Saunders Company Ltd. London.
p.15-47
30. Taylor AE, Granger DN (1984) Exchange of macromolecules across the microcirculation.
In: Handbook of Physiology. Am Physiol Soc, Bethesda, MD, p. 467
17
Legends
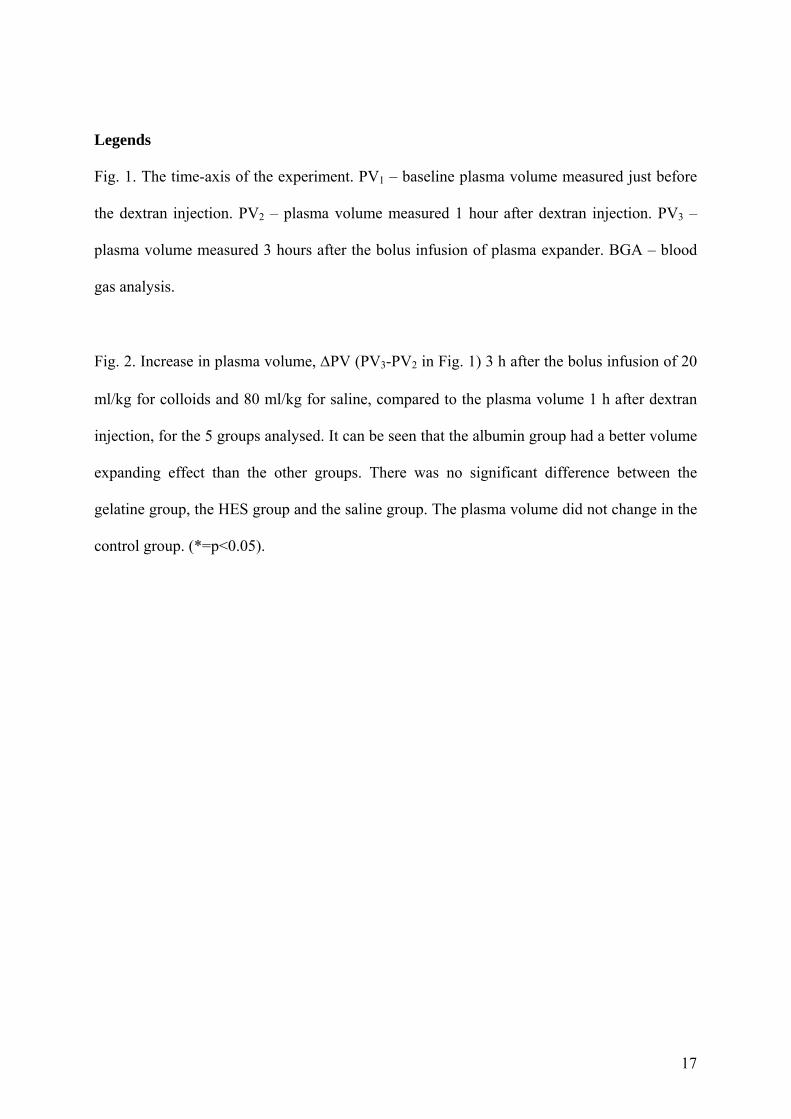
Fig. 1. The time-axis of the experiment. PV1 – baseline plasma volume measured just before
the dextran injection. PV2 – plasma volume measured 1 hour after dextran injection. PV3 –
plasma volume measured 3 hours after the bolus infusion of plasma expander. BGA – blood
gas analysis.
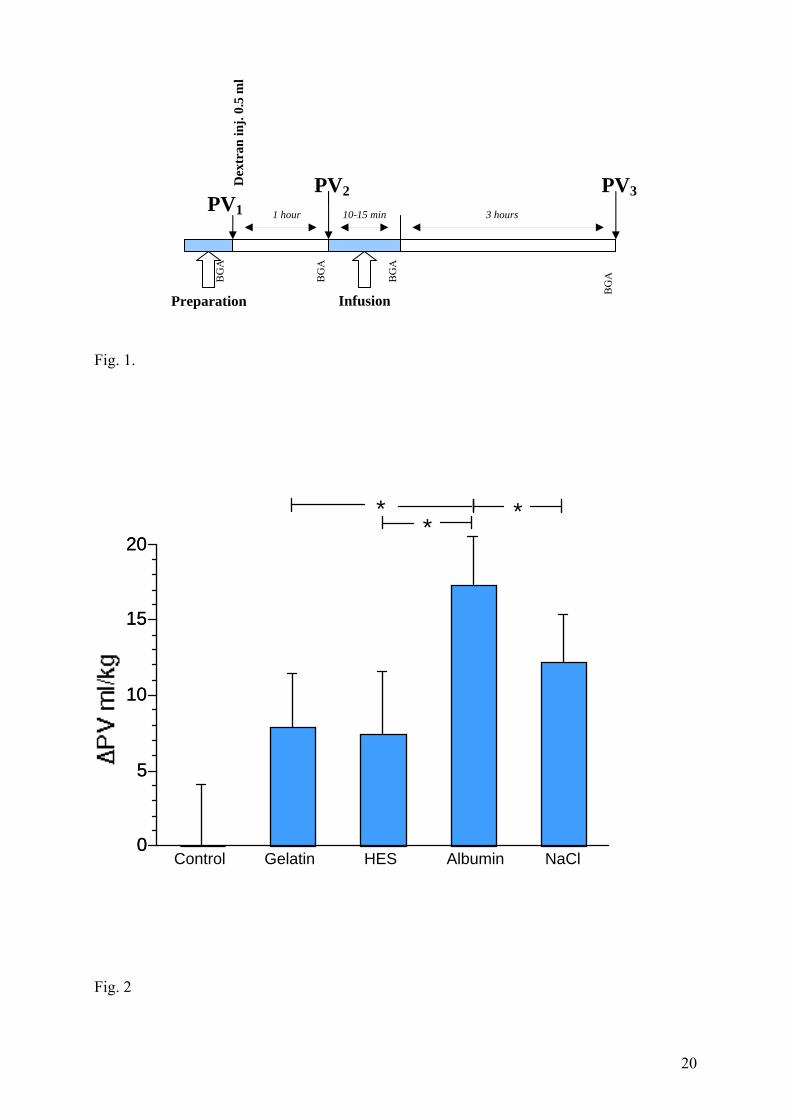
Fig. 2. Increase in plasma volume, ΔPV (PV3-PV2 in Fig. 1) 3 h after the bolus infusion of 20
ml/kg for colloids and 80 ml/kg for saline, compared to the plasma volume 1 h after dextran
injection, for the 5 groups analysed. It can be seen that the albumin group had a better volume
expanding effect than the other groups. There was no significant difference between the
gelatine group, the HES group and the saline group. The plasma volume did not change in the
control group. (*=p<0.05).

18
Table 1. Data for the physiological parameters haemoglobin concentration (Hb), sodium
concentration (Na+), potassium concentration (K+), pH, Base excess (BE), arterial oxygen
concentraion (PaO2) and carbon dioxide concentration (PaCO2) at baseline, 1 h after dextran
injection, directly after infusion of plasma expander, and 3 h later (at the end of the
experiment).
Hb Na+ K+ pH BE PaO2 PaCO2 g/l mmol/l mmol/l mmol/l kPa kPa Control Baseline 133±7 134±2 5.0±0.5 7.47±0.11 4.6±1.0 9.4±1.2 5.4±0.3 After dextran 163±13 * 137±2 5.7±0.4 7.37±0.12 1.0±2.1 9.8±0.8 5.1±0.5 End 158±15 * 132±1 6.4±0.5 7.41±0.04 0.0±3.1 10.1±1.4 5.0±0.6 Alb Baseline 136±4 # 135±2 4.7±0.4 7.46±0.03 6.0±0.9 9.7±0.9 5.4±0.5 After dextran 157±16 *# 133±2 5.1±0.4 7.43±0.05 2.6±3.3 10.5±1.1 5.2±0.5 After infusion 114±7 * 137±2 4.1±0.4 7.41±0.03 3.2±1.1 8.5±1.0 5.7±0.6
End 125±8 ⊥ 136±1 4.5±0.4 7.44±0.03 2.4±0.9 8.9±0.8 5.1±0.2 Gel Baseline 135±4 # 134±1 4.7±0.5 7.42±0.12 5.3±2.5 10.4±1.9 5.3±0.5 After dextran 160±14 *# 132±3 5.4±0.6 7.41±0.04 1.3±2.6 10.4±1.0 5.3±0.6 After infusion 110±13 * 135±1 4.5±0.4 7.42±0.03 3.6±1.7 9.0±1.1 5.7±0.6 End 144.0±8 *# 135±1 5.1±0.3 7.40±0.11 2.0±1.5 9.7±1.0 4.9±0.5 HES Baseline 136±6 # 134±1 5.2±0.3 7.43±.0.06 5.0±1.8 9.1±1.0 5.7±0.7 After dextran 153±6 *# 133±1 5.4±0.4 7.42±0.04 1.9±0.7 9.2±3.5 5.1±0.5 After infusion 99±3 * 136±1 4.7±0.2 7.39±0.03 3.0±0.9 8.0±0.6 5.6±0.4 End 142±9 *# 135±1 5.6±0.5 7.42±0.03 1.1±1.1 9.6±0.8 5.2±0.4 Saline Baseline 134±10 # 135±6 4.5±0.2 7.45±0.03 4.7±1.4 9.2±1.3 5.7±0.5 After dextran 149±13 *# 132±1 5.1±0.1 7.42±0.02 3.0±1.6 9.5±0.9 5.7±0.5 After infusion 112±9 * 140±1 4.0±0.4 7.34±0.03 -2.6±0.8 + 8.7±1.0 5.7±0.5
End 125±10 ⊥ 137±1 4.9±0.4 7.37±0.03 -1.9±0.9 + 8.7±1.1 5.2±0.5
* Difference in Hb compared with baseline; # difference in Hb compared with values after
infusion of plasma expander; ⊥ difference compared with corresponding values in control,
gelatine and HES groups; + difference in BE compared with corresponding values in control,
gelatine, albumin and HES groups, as well as compared with values at baseline and after
dextran in the saline group (p<0.05). Data expressed as mean ± SD.

19
Table 2. Mean arterial pressure (mm Hg) at baseline, 1 h after dextran injection, directly after
infusion of plasma expander, and 3 h later (at the end of the experiment). Corresponding
values are given for the control group.
Group Baseline 1h after dextran After infusion After 3 h mmHg mmHg mmHg mmHg
Control 101±10 70±14 * 60±10 * 53±7 * Albumin 102±12 64±9 * 89±6 + 65±5 #* Gelatine 104±12 68±17 * 94±9 + 63±9 #* HES 100±11 62±7 * 90±7 + 60±7 #* Saline 108±10 67±17 * 84±11 + 61±6 #*
* Difference compared with baseline values; # difference between values after the infusion
and 3 h after the infusion; + difference compared with the control group (p<0.001). Data
expressed as mean ± SD.
20
PV1
Fig. 1.
0
5
10
15
20
0
5
10
15
20
Control Gelatin HES Albumin NaCl
* **
Fig. 2
Dex
tran
inj.
0.5
ml
PV2 PV3
Preparation Infusion
BG
A
BG
A
BG
A
BG
A
1 hour 3 hours 10-15 min