Embed Size (px)
Citation preview
DISCLOSURES
This activity is jointly provided by Northwest Portland Area Indian Health Board and Cardea
Cardea Services is approved as a provider of continuing nursing education by Montana Nurses Association, an accredited approver with distinction by the American Nurses Credentialing Center’s Commission on Accreditation.
This activity has been planned and implemented in accordance with the accreditation requirements and policies of the Institute for Medical Quality/California Medical Association (IMQ/CMA) through the joint providership of Cardea and Northwest Portland Area Indian Health Board. Cardea is accredited by the IMQ/CMA to provide continuing medical education for physicians.
Cardea designates this live web-based training for a maximum of 1 AMA PRA Category 1 Credit(s)TM. Physicians should claim credit commensurate with the extent of their participation in the activity.

DISCLOSURES
COMPLETING THIS ACTIVITY
Upon successful completion of this activity 1 contact hour will be awarded
Successful completion of this continuing education activity includes the following:
• Attending the entire CE activity;
• Completing the online evaluation;
• Submitting an online CE request.
Your certificate will be sent via email If you have any questions about this CE activity, contact Michelle Daugherty at [email protected] or (206) 447-9538

Dr. Jorge Mera is director of a program partially funded by Gilead.
Lisa Townshend-Bulson is a principal co-investigator on a grant that is partially funded by Gilead.
None of the other planners or presenters of this CE activity have any relevant financial relationships with any commercial entities pertaining to this activity.
CONFLICT OF INTEREST

Acknowledgement
This presentation is funded in part by:
The Indian Health Service HIV Program
and
The Secretary’s Minority AIDS Initiative Fund

Addressing Transient Elastography
(FibroScan): Integrating with HCV
Care YOUSSEF BARBOUR M.D

Agenda:
1- Fibrosis assessment in the liver
2- Non invasive assessment of liver fibrosis
3- Transient Elastography “FibroScan” role in Fibrosis assessment
4- FibroScan applications in liver disease
5- what is CAP

Questions.
1- which of the following statements is true about liver fibrosis:
A- Liver fibrosis can be estimated using an US
B- Liver fibrosis can be estimated using Controlled Attenuation Parameter
C- Liver cirrhosis is an early stage liver fibrosis
D- Liver biopsy is the only way to assess liver fibrosis
E- FibroScan is one of many non invasive tools to assess liver fibrosis

Questions
2-Which of the following statement is true about FibroScan:
A- Patients need to be fasting overnight for an accurate reading
B- Patients don’t need to be fasting before fibroscan.
C- FibroScan can confirm the diagnosis of NASH
D- Fibroscan assess a larger area in the liver for fibrosis than the liver biopsy
does
E- Fibroscan score interpretations are standardized across the whole
spectrum of liver diseases

Questions
3- CAP can diagnose:
A- NASH
B- NAFLD
C- Fatty liver
D- Cirrhosis
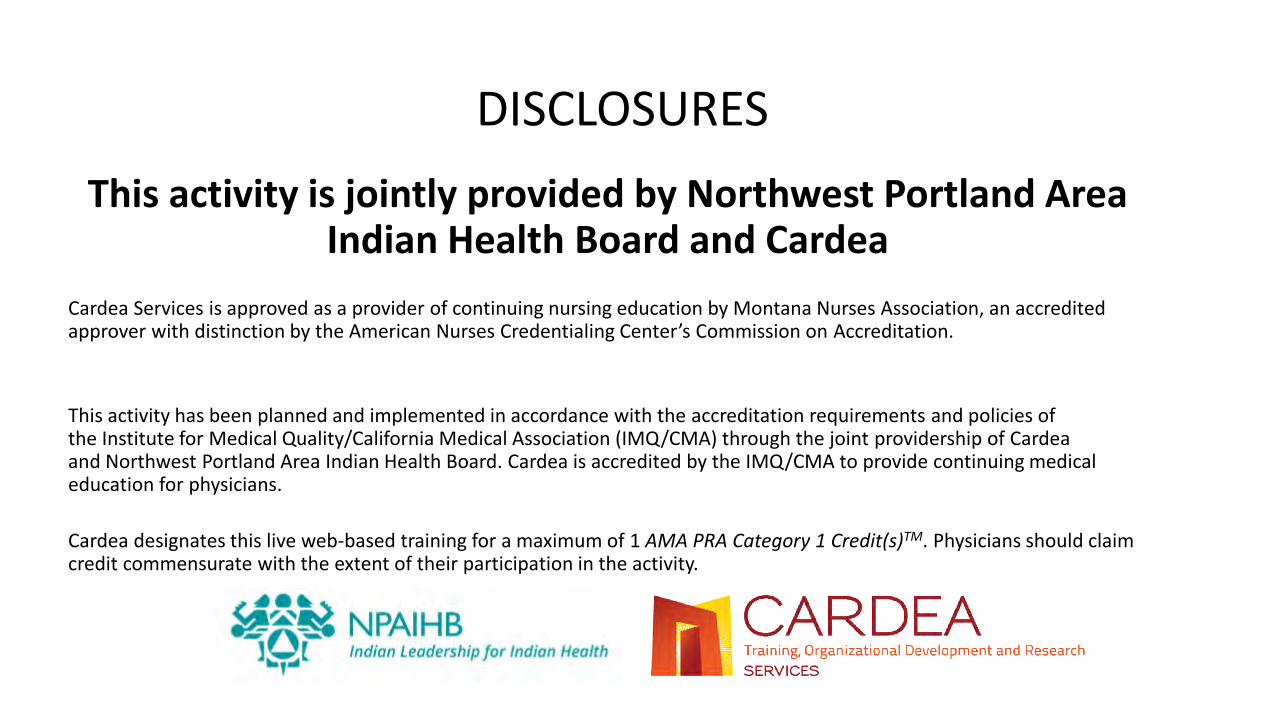
Liver Fibrosis assessment
Invasive assessment
Liver Biopsy.
Non Invasive assessment
Several tools, and continue to grow:
1- APRI
2- FIB4
3- Fibrospect/Fibrosure
4- Transient Elastography, or FibroScan
5- MRE

TE: non-invasive
US-based
method
Uses shear wave velocity to assess tissue (e.g. Liver) stiffness
Shear (secondary or S-) waves were initially discovered in seismology as slow waves that follow the primary compressional wave, hence their name.
They are the manifestation of elastic waves that travel through the body of an object, as opposed to the surface waves, which, as the name implies, travel on the surface.
Shear waves move slowly (< 50 m/s) and are rapidly attenuated by liver parenchyma, depending on the elastic properties of the tissue, with the speed of shear waves inversely proportional to the tissue elasticity
Applied in medical practice under the name FibroScan since 2001
In contrast to sound waves, which are longitudinal, shear waves are transverse, thus the motion of the affected tissue
is perpendicular to the direction of wave propagation.
The method was designed at the Langevin institute in 1995 and was initially implemented
for quality control in the food industry

Understanding Elastography
Noninvasive Liver Stiffness
Testing
Stiffness Elasticit
y

Shear Waves in our body:
Shear waves are affected by changes in the medium density, particularly
in the presence of liquid medium; thus, the operator must avoid large
vascular structures. To avoid this problem and ensure better results, the TE
device is equipped with ultrasonographic display of the tissue that
underlies the probe.
The probe (piston) initially causes a slow-spreading low-frequency (50 Hz)
shear wave, after which the fast ultrasound waves (emitted from the same
probe) in a pulse-echo fashion are used to determine the position of the
shear wave front in relation to time.
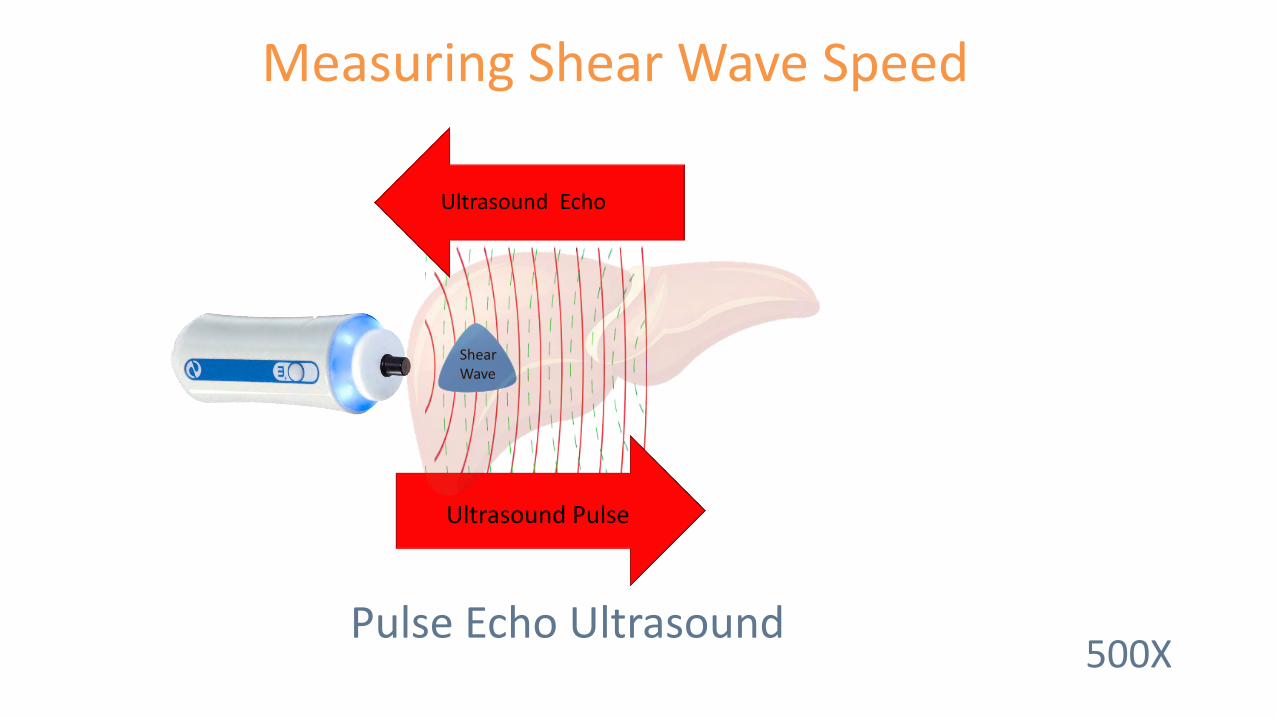
Measuring Shear Wave Speed
Pulse Echo Ultrasound
Ultrasound Pulse
Shear Wave
Ultrasound Echo
500X

Liver Stiffness Measurement LSM
Measurement of liver stiffness is based on Hook’s law, which states that the
velocity of shear waves that travel through an elastic object is proportional
to the object’s stiffness (i.e., inversely proportional to the object’s
elasticity).
Mathematical equation using shear wave velocity (m/s) and tissue density
(kg/m3) to calculate E which represent Young’s modulus which clinically
corresponds to the LSM (expressed in kPa).
Value range from 1.5 to 75 kPa

Shear Wave Speed Correlates to Stiffness Hooke’s Law
Low Speed = Low Stiffness
High Speed = High Stiffness

Shear Wave Speed Vs (m/s)
Equivalent Stiffness E (kPa)
E = 3pVS2
Elasticity (Stiffness)
Liver Tissue Density
Velocity of Shear Wave
Stiffness Calculation Formula Young’s Modulus
Calculate Measure

Vibration-controlled Transient
Elastography VCTE
The shear waves spread from the point of skin impact in a spherical manner, whereas the US waves are released in a straight line along the probe’s axis, i.e., in one dimension.
To ensure that the measurements are accurate and reproducible in the same patient and are comparable among different patients, the accompanying software modifies the shear wave characteristics by maintaining the shear wave frequency and shape while modifying the shear wave amplitude and energy output. Thus the full name of the method is vibration-controlled 1D TE
The resulting LSM is translated into an estimate of the liver fibrosis in a simple and straightforward manner. However, this estimation is possible only under the assumption that the liver is homogeneous and non-viscous, and its elasticity is predominantly affected by the level of fibrosis.

The FibroScan Probe
Mechanical Actuator
Ultrasound Crystal

Mechanical Shear Wave Induction

25 mm
Time
65 mm
Propagation Map Mathematical Reconstruction of Shear Wave Propagation
Subcutaneous Tissue
Liver Tissue
Explored Region

Shear Wave Speed Examples
Depth
Depth
Time
Slow
Fast
Normal

FibroScan (VCTE): Where Does It Stand in The US Practice: Tapper et al, Clinical Gastroenterology & Hepatology, 2015 13:27-36 Intended for training only, not for promotional use.
Elastography Influencer Reference

Elastography Influencers
Intended for training only, not for promotional use.

Elastography Influencers
Intended for training only, not for promotional use.
1. Alanine aminotransferase-based Algorithms of Liver Stiffness Measurement by Transient Elastography (FibroScan) for Liver Fibrosis in Chronic Hepatitis B; Chan et al; Journal of Viral Hepatitis, 2009, 16, 36–44
2. Effect of Alcohol on Liver Stiffness Measured by Transient Elastography; Bardou-Jacquet et al; World Journal of Gastroenterology, 2013 Jan 28, 19(4); 516-522
3. Effect of meal ingestion on liver stiffness in patients with cirrhosis and portal hypertension; Berzigotti, A., et al; PLOS One, 2013. 8(3): p. e58742
Liver Stiffness
Fibrosis Hepatic Blood Pressure 3
Alcohol 2
Hepatic Inflammation 1
FibroScan (VCTE): Where Does It Stand in The US Practice: Tapper et al, Clinical Gastroenterology & Hepatology, 2015 13:27-36

Meal Restriction Recommendation
• Fast > 3 hours prior to testing
• Drinking water is acceptable
Food intake increases liver stiffness in patients with chronic or resolved hepatitis C virus infection; Mederacke, I., et al; Liver International, 2009. 29(10): p. 1500-6. Liver Stiffness Is Influenced by a Standardized Meal in Patients With Chronic Hepatitis C Virus at Different Stages of Fibrotic Evolution; Arena et al; Hepatology, Volume 58, No 1, 2013
Intended for training only, not for promotional use.

Testing Contraindications
• Pregnancy
• Implantable electronic devices

VCTE Testing Challenges
• Ascites
• Excessive skin to capsule distance
• Narrow intercostal spaces
1. Feasibility and Diagnostic Performance of the FibroScan XL Probe for Liver Stiffness Measurement in Overweight and Obese Patient; Myers et al; Hepatology, 2012 Jan;55(1):199-208
Intended for training only, not for promotional use.
95-98 % Success Rate1

Scientific Validation

Peer Review Publications
• 1200 + peer review publications
• First line test in clinical practice guidelines

Clinical Practice Guidelines Guideline Disease Etiology Reference Citation
AASLD/IDSA HCV Recommendations for Testing, Managing and Treating Hepatitis C; When & In Whom to Initiate Antiviral Therapy, AASLD & IDSA
Practice Guidelines; www.hcvguidelines.org
EASL HCV EASL Clinical Practice Guidelines : Noninvasive Tests for Evaluation of Liver Disease Severity and Prognosis; Journal of
Hepatology 2015
EASL/EASD/EASO NASH Journal of Hepatology 2016 vol 64/1388-1402
http://www.journal-of-hepatology.eu/article/S0168-8278(15)00734-5/fulltext
WHO HCV WHO Guidelines for Screening, Care and Treatment of Persons with Hepatitis C Infection; ISBN 978 92 4 154875 5
WHO HBV Guidelines for the prevention, care, and treatment of persons with chronic hepatitis B infection. 2015 WHO
Algorithm of WHO recommendations of the Management of Persons with Chronic Hepatitis B infection (Page xxvi)
WHO HCV + HIV Management of HCV & HIV co-infection
WHO 2012 HIV/AID treatment. Clinical Protocol for the WHO European Region Chapter 6
Baveno VI Portal Hypertension Expanding consensus in portal hypertension: Report of the Baveno VI Consensus Workshop: Stratifying risk and individual care for portal
hypertension; 2015 Journal of Hepatology 63, 3 (743-752)
NICE (UK) HCV Diagnosis and Management of Chronic Hepatitis B in Children, Young People & Adults; guidance.nice.org.uk/cg165
Intended for training only, not for promotional use.

Utilization of FibroScan in Clinical Practice; Bonder et al, Current Gastroenterology Rep, 2014 16-372
Peer Review Cutoff Value Reference
Intended for training only, not for promotional use.
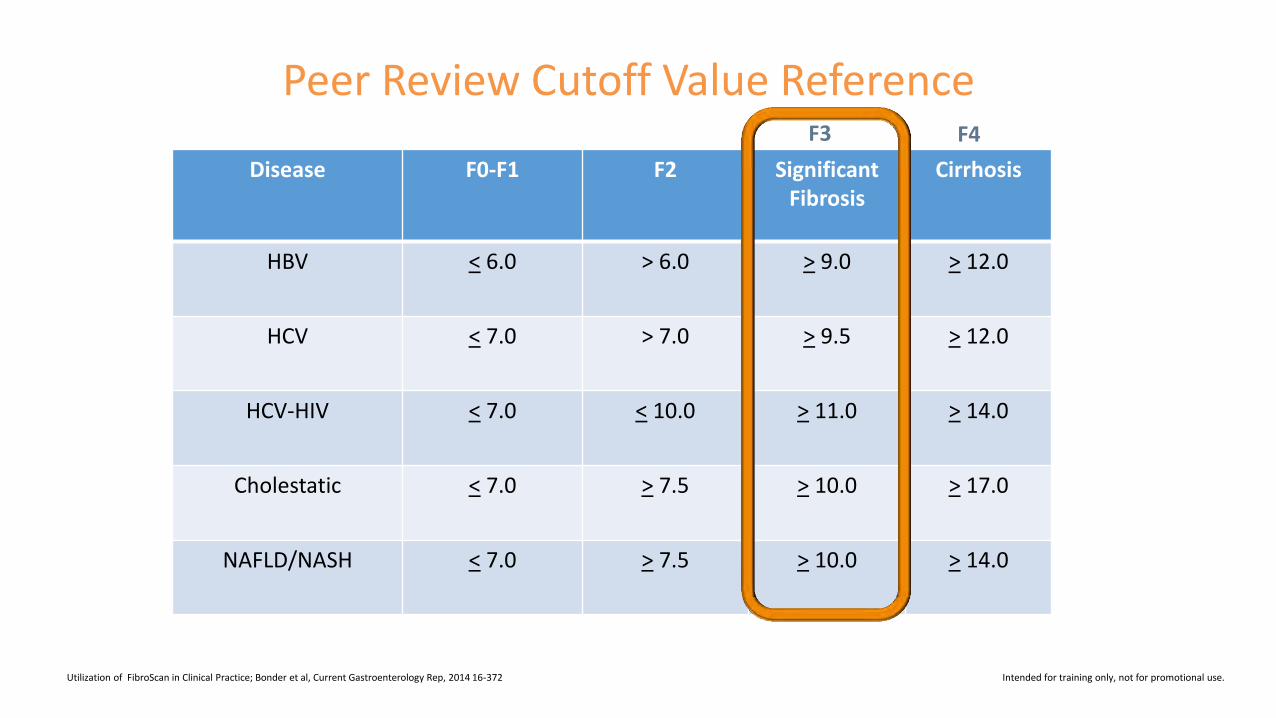
Disease F0-F1 F2 Significant Fibrosis
Cirrhosis
HBV < 6.0 > 6.0 > 9.0 > 12.0
HCV < 7.0 > 7.0 > 9.5 > 12.0
HCV-HIV < 7.0 < 10.0 > 11.0 > 14.0
Cholestatic < 7.0 > 7.5 > 10.0 > 17.0
NAFLD/NASH < 7.0 > 7.5 > 10.0 > 14.0
F3 F4
Peer Review Cutoff Value Reference
Utilization of FibroScan in Clinical Practice; Bonder et al, Current Gastroenterology Rep, 2014 16-372 Intended for training only, not for promotional use.

139 25,544 139 25,544
FibroScan Accuracy Meta Analysis of VCTE vs Biopsy
Friedrich-Rust, M. et al. (2016) Critical Comparison of Elastography Methods to Assess Chronic Liver Disease Nat. Rev. Gastroenterol. Hepatology doi:10.1038/nrgastro.2016.86 Intended for training only, not for promotional use.

Controlled Attenuation Parameter/
CAP
Conventional Ultrasonography has demonstrated that liver steatosis affects ultrasound waves by strongly attenuating their intensity. The changes in signal attenuation are followed by an increased reflection of incoming ultrasound waves (hyperechoic).
The main problem with conventional ultrasonography are its subjective operator –dependent nature and multiple uncontrolled variables included in the examinations, which decrease the sensitivity of the examination in the detection of liver steatosis.
CAP is based on a formula for intensity attenuation.
The clinical application of CAP began 2011, 10 years after the introduction of LSM

What Does CAP Measure?
Ultrasound Attenuation Rate

Ultrasound Attenuation Rate CAP

Attenuation Rate Correlates to Steatosis CAP
Low Attenuation Rate = Low Steatosis
High Attenuation Rate = High Steatosis
The controlled attenuation parameter (CAP): A novel tool for the non-invasive evaluation of steatosis using FibroScan; Sasso, Beaugrand, De Ledinghen et al;. Clin Res Hepatology Gastroenterol, 2012. 36(1): p. 13-20.
Intended for training only, not for promotional use.
Intended for training only, not for promotional use.

CAP Performance By Steatosis Grade 11 Study Meta-Analysis / 2076 Subjects
Individual Patient Data Meta-Analysis of Controlled Attenuation Parameter (CAP) Technology for Determining Steatosis; Karlas et al, 2016
Intended for training only, not for promotional use.
Grade CAP Cutoff dB/M
Sensitivity Specificity AUC
S0 vs S1-S3 248 0.69 0.82 0.82
S0-S1 vs S2-S3 268 0.77 0.81 0.86
S0-S2 vs S3 280 0.88 0.78 0.88
Steatosis Grade Affected Hepatocytes
S1 < 33 %
S2 > 33 – 66 %
S3 > 66 %

Transient Elastography (FibroScan) with Controlled Attenuation Parameter in the Assessment of Liver Steatosis and Fibrosis in Patients with NAFLD; Mikolaseviv et al; World Journal Gastroenterology 2016 August 28;22(32):7236-7251
CAP Accuracy Meta-Analysis
Intended for training only, not for promotional use.

The Patient Examination

FibroScan Probe Selection
Pediatric Adult
S M XL

Data Acquisition Steps
• Match the probe to the patient
• Center probe over liver
• Assure optimal signal quality
• Acquire 10 measurements

Measurement Parameters
Skin
4 cm
1 cm
25 mm
65 mm
3 cm3
M
Skin to Capsule Distance < 25 mm

Measurement Parameters
Skin
4 cm
1 cm
35 mm
75 mm
3 cm3
XL
Skin to Capsule Distance 25-35 mm

Holding The Probe Perpendicular
Perpendicular Not Perpendicular

Pre-Measurement Feedback Data
• Probe selection
• Probe position
• Signal quality

Probe Centered on Liver
Probe Selection Guidance TM Mode
Tissue Change Point 25 mm
65 mm

Pressing The Probe to The Skin
One Red Line
Low Pressure
Green Lines Correct Pressure
Multiple Red Lines
High Pressure

Parallel Shear Wave Margins Non-Parallel Shear Wave Margins
Propagation Map Assessment

Poorly Centered in Intercostal Space
Rib Echo Generation

Narrow Intercostal Space - Rib Echo
Narrow Intercostal Space
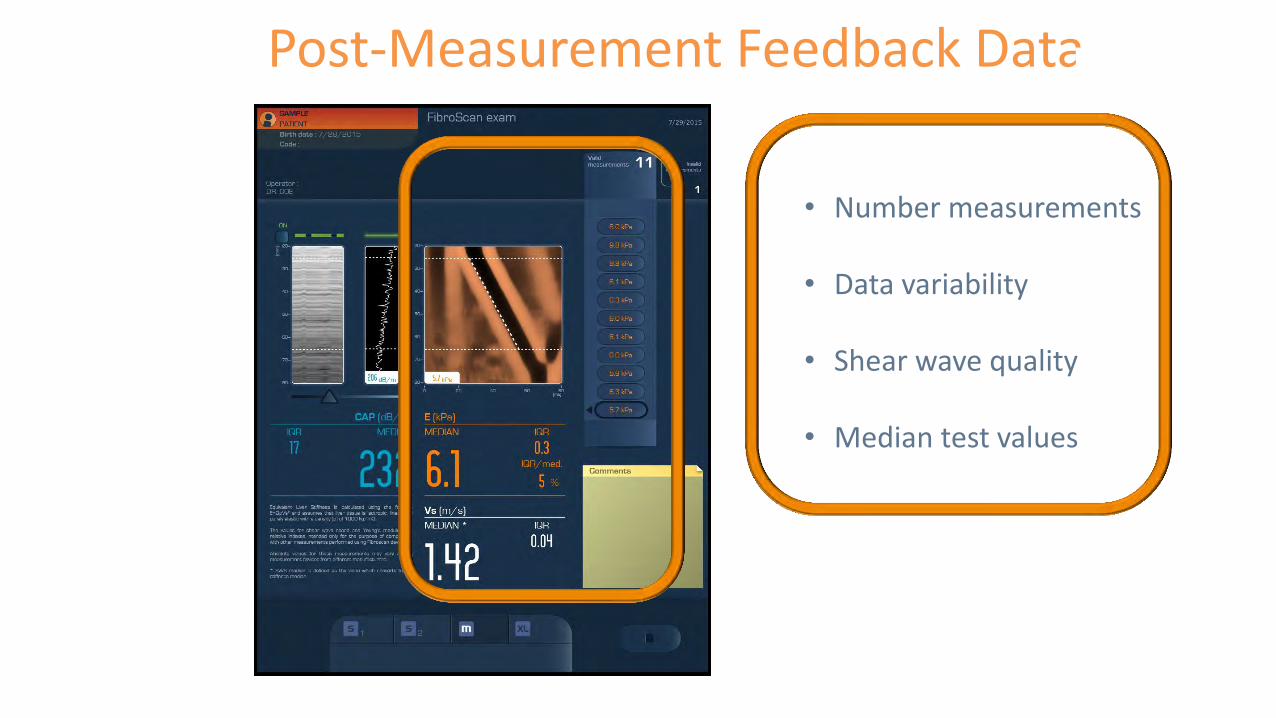
Post-Measurement Feedback Data
• Number measurements
• Data variability
• Shear wave quality
• Median test values

Speed
Shear Wave Speed

High IQR %
Measurements
Interquartile Range Data Variability Metric
kPa
Low IQR %
Determination of Reliability Criteria for Liver Stiffness Evaluation by Transient Elastography; Boursier et al; Hepatology, Volume 57, No 3, 2013
kPa
IQR/Med Percentage Must Be < 30 %


Steatosis Grade
CAP Cutoff dB/M
Affected Hepatocytes
S0 < 247
S1 248-267 < 33 %
S2 268-279 > 33 – 66 %
S3 > 280 > 66 %
CAP Performance By Steatosis Grade
11 Study Meta-Analysis / 2076 Subjects
Individual Patient Data Meta-Analysis of Controlled Attenuation Parameter (CAP) Technology for Determining Steatosis; Karlas et al, 2016
Disease F0-F1 F2 F3 F4
HBV < 6.0 > 6.0 > 9.0 > 12.0
HCV < 7.0 > 7.0 > 9.5 > 12.0
HCV-HIV < 7.0 < 10.0 > 11.0 > 14.0
Cholestatic < 7.0 > 7.5 > 10.0 > 17.0
NAFLD/NASH < 7.0 > 7.5 > 10.0 > 14.0
FibroScan Peer Review Cutoff Value Reference
Utilization of FibroScan in Clinical Practice; Bonder et al, Current Gastroenterology Rep, 2014 16-372

Acoustic Radiation Force Impulse
Imaging (ARFI)
Is based on shear wave propagation, similar to TE.
Compared with TE, inspected liver volume is smaller (1cm in length);
however, ARFI can be used on modified commercial ultrasound machines.
Thus, the point of interest can be pinpointed using ultrasound’s B-mode.
The downside of this method include a narrow range of results (0.5-4.4 m/s)
with unclear cut-offs values for different fibrosis stage levels.

Thank you.

Evaluation and Certificates
• Please use the link or QR code below to complete the learner evaluation. This link will also be emailed to you within a few days. Please check your junk and spam email folders if you don’t receive it.
http://sgiz.mobi/s3/August-NW-ECHO