Embed Size (px)
Citation preview
A French corporation with share capital of EUR 1,006,489,617. 50 Registered office: 29 boulevard Haussmann - 75009 PARIS 552 120 222 R.C.S. PARIS
THIRD UPDATE
TO THE
2014 REGISTRATION DOCUMENT
Registration document filed with the AMF (French Securities Regulator) on March 4, 2014 under No. D.14-0115.
The first update was filed with the AMF on May 07, 2014 under No D.14-0115-A01 The second update was filed with the AMF on August 04, 2014 under No D.14-0115-A02
The AMF has conducted no verification of the content of this document. Only the French version of the Registration Document (“Document de Référence”) has been controlled by the
AMF. The original update to the registration document was filed with the AMF (French Securities
Regulator) on November 6, 2014, under the number D.14-0115-A03. It may be used to support a financial transaction if accompanied by a prospectus duly approved by the AMF. This
document was produced by the issuer and is binding upon its signatory.
1/49

CONTENTS
UPDATE OF THE 2014 REGISTRATION DOCUMENT BY CHAPTER
1 - CHAPTER 1: HISTORY AND PROFILE OF SOCIETE GENERALE .................................................. 3
1.1 RECENT PRESS RELEASES AND EVENTS SUBSEQUENT TO THE SUBMISSION OF THE SECOND UPDATE TO THE
2014 REGISTRATION DOCUMENT ................................................................................................................ 3 1.1.1 Press release dated October 26, 2014 : SOCIETE GENERALE HAS SUCCESSFULLY PASSED THE COMPREHENSIVE ASSESSMENT OF EUROPEAN BANK BALANCE SHEETS : CONFIRMATION OF THE GOUP’S FINANCIAL SOLIDITY ..................................................................... 3
2 - CHAPTER 2 – GROUP MANAGEMENT REPORT ............................................................................. 5
2.1 THIRD QUARTER 2014 RESULTS (PRESS RELEASE DATED NOVEMBER 6, 2014) - UPDATE OF THE 2014
REGISTRATION DOCUMENT PAGE 24 – 45 .................................................................................................... 5 2.2 FINANCIAL POLICY ............................................................................................................................. 31
2.2.1 Group debt policy ............................................................................................................................ 31
3 - CHAPTER 3 : CORPORATE GOVERNANCE ................................................................................... 33
3.1 GENERAL MANAGEMENT .................................................................................................................... 33 3.2 EXECUTIVE COMMITEE ...................................................................................................................... 33
4 - CHAPTER 4 : RISKS AND CAPITAL ADEQUACY .......................................................................... 35
4.1 REGULATORY RATIOS ........................................................................................................................ 35 4.1.1 Prudential ratio management – Update of the 2014 registration document page 143-144 ............ 35 4.1.2 RISK- WEIGHTED ASSETS* (CRR/CRD4, in EUR bn) – Update of the 2014 registration document page 125 .................................................................................................................................. 36 4.1.3 Rapprochement des capitaux propres comptables et prudentiels et ratio CRR/CRD4 – actualisation de la page 145 du DDR 2014 .............................................................................................. 37 4.1.4 CRR LEVERAGE RATIO ................................................................................................................ 38
4.2 PROVISIONING OF DOUBTFUL LOANS - UPDATE OF THE 2014 REGISTRATION DOCUMENT PAGE 160 ....... 38 4.3 CHANGE IN TRADING VAR - UPDATE OF THE 2014 REGISTRATION DOCUMENT PAGE 177 ....................... 39 4.4 LIQUIDITY RISKS ................................................................................................................................ 40
4.4.1 Market financing schedule Update of the 2014 registration document page 192 ........................... 40 4.4.2 Liquid asset buffer - Update of the 2014 registration document page 193 ..................................... 40
4.5 LEGAL RISKS ..................................................................................................................................... 41
5 - CHAPTER 8 : PERSON RESPONSIBLE FOR UPDATING THE REGISTRATION DOCUMENT ... 42
5.1 PERSON RESPONSIBLE FOR UPDATING THE REGISTRATION DOCUMENT ................................................ 42 5.2 STATEMENT OF THE PERSON RESPONSIBLE FOR UPDATING THE REGISTRATION DOCUMENT .................. 42 5.3 PERSONS RESPONSIBLE FOR THE AUDIT OF THE FINANCIAL STATEMENTS .............................................. 43
6 - CHAPTER 9 : CROSS-REFERENCE TABLE ................................................................................... 44
6.1 UPDATE TO THE REGISTRATION DOCUMENT CROSS-REFERENCE TABLE ................................................ 44 6.2 CROSS-REFERENCE TABLE OF PILLAR 3 REPORT ................................................................................. 46 6.3 CROSS REFERENCE TABLE WITH THE RECOMMENDATIONS MADE BY THE ENHANCED DISCLOSURE TASK
FORCE .................................................................................................................................................... 48
2/49
1 - Chapter 1: History and profile of Societe Generale
1.1 Recent press releases and events subsequent to the submission of the Second update to the 2014 registration document
1.1.1 Press release dated October 26, 2014 : SOCIETE GENERALE HAS SUCCESSFULLY PASSED THE COMPREHENSIVE ASSESSMENT OF EUROPEAN BANK BALANCE SHEETS : CONFIRMATION OF THE GOUP’S FINANCIAL SOLIDITY
Asset quality review: confirmation of the quality of asset portfolios and risk management models
- Very limited normative adjustment with regard to the size of the balance sheet of -22
basis points on the Common Equity Tier 1 ratio(1)
at end-2013, with no impact on the
Group’s ratios
Stress tests: financial solidity including under an adverse scenario, capital ratios well above the requirements set for this exercise
- Central scenario: Common Equity Tier 1 ratio(1)
of 10.6%
- Adverse scenario: Common Equity Tier 1 ratio(1)
of 8.1%
The European Central Bank (ECB) and European Banking Authority (EBA) have today published the results of the Asset Quality Review and Stress Tests which the largest European banks have had to undergo. Prior to the ECB’s single supervisory mechanism in the eurozone, these two stages of the comprehensive assessment of bank balance sheets have resulted in the large-scale mobilisation of employees: for nearly a year, more than 800 Societe Generale employees were involved; a hundred or so inspectors mandated by the supervisory authorities analysed 9 million credit lines and 500 million data.
Based on very demanding methodologies, these exercises confirm the solidity of Societe Generale’s balance sheet as well as the resilience of its diversified universal banking model.
(1) The prudential ratios mentioned here are phased-in ratios, i.e. they take account of transitional provisions authorised
according to CRR/CRD4 rules, and constitute the regulatory base applicable until 2019
3/49

Results of the asset quality review: quality of asset portfolios and risk management models The ECB and French Prudential Supervision and Resolution Authority (ACPR) first carried out an in-depth review of the bank’s accounting methodologies. The regulators subsequently selected and reviewed nearly half the Group’s exposures using a methodology specific to the ECB, determined for the purposes of the exercise, covering principally the provisioning of credit risks and the valuation of market risks. The controls and simulations carried out would have resulted, at 31 December 2013, in a very limited theoretical normative adjustment of -22 basis points on the Common Equity Tier 1 ratio
(1), with -20
basis points in respect of credit risk and -2 basis points in respect of market risk. In prudential terms, these results do not modify the Group’s ratios, both in respect of 2013 and for following years. From an accounting viewpoint, this review will have no significant impact on the Group’s financial statements (less than EUR 30 million before tax on profits and less than EUR 35 million in other capital items). These results underline the quality of the Group’s asset portfolios and testify to the rigour of its methodologies and risk management. Results of the stress tests: financial solidity including under an adverse scenario, ratios well above the requirements set for this exercise The stress tests were constructed using very severe assumptions both from the macroeconomic viewpoint and the financial market environment, and a very strict methodology over a three-year horizon. The results of these scenarios applied to Societe Generale highlight the solidity of the Group’s capital ratios in the face of extreme situations. According to the assumptions adopted in the central scenario, Societe Generale’s Common Equity Tier 1 ratio
(1) would be 10.6%, compared with
the 8.0% target set by the ECB. In the adverse scenario, the Common Equity Tier 1 ratio(1)
would stand at 8.1%, well above the minimum of 5.5% defined by the ECB for the exercise. Commenting on the results, Frédéric Oudéa, the Chairman and CEO, stated: “These results provide further confirmation of the resilience of Societe Generale’s business model. They also demonstrate the financial solidity and quality of the risk management of the Group, which embarked on a far-reaching transformation of its balance sheet for several years. This is an unprecedented exercise in transparency, which lays the foundations for the new single supervisory mechanism in Europe and will help increase confidence in the sector. I would like to thank all the teams that have been involved within the bank to ensure the success of this in-depth review”. Societe Generale will provide more detailed comments on the results of the comprehensive assessment of bank balance sheets on 6
th November 2014 when it publishes its third quarter results.
4/49

2 - Chapter 2 – Group management report
2.1 Third Quarter 2014 Results (press release dated November 6, 2014) - Update of the 2014 registration document page 24 – 45
Q3 14: SOLID RESULTS AND BALANCE SHEET
Net banking income**: EUR 5.9bn, -1.8% vs. Q3 13
Good control of operating expenses: -0.4%* vs. Q3 13
Sharp decline in the commercial cost of risk: 58 bp(1) vs. 69 bp(1) in Q3 13
Businesses’ operating income up +9.4%*
Substantial increase in Group net income to EUR 836m vs. EUR 534m in Q3 13
Fully loaded Basel 3 CET1 ratio: 10.4%
Leverage ratio: 3.8%, up +20 bp vs. Q2 14
9M 14: Increase in Group net income to EUR 2,181m (9M 13: EUR 1,853m)
Net banking income up +4.2%* vs. 9M 13
Lower operating expenses*: -0.7%* vs. 9M 13
Sharp decline in the net cost of risk: -30.6%* vs. 9M 13
EPS(2): EUR 2.42
* When adjusted for changes in Group structure and at constant exchange rates.
** Excluding non-economic items (revaluation of own financial liabilities and Debit Value Adjustment for EUR -2m in Q3 14 and EUR -178m in 9M 14 in net banking income, or an impact on Group net income of respectively EUR -2m and EUR -117m; in Q3 13 (9M 13): impact in net banking income EUR -342m (EUR -1,112m); on Group net income EUR -224m (EUR -730m). See methodology notes.
Items relating to financial data for 2013 have been restated due to the implementation of IFRS 10 and 11 which apply retrospectively as from January 1st, 2014.
(1) Excluding litigation issues, in basis points for assets at the beginning of the period.
(2) After deducting interest, net of tax effect, to be paid to holders of deeply subordinated notes and undated subordinated notes for 9M 14 (respectively EUR -294 million and EUR -5 million), and correction of the effect of capital gains/losses on partial buybacks recorded over the period (i.e. EUR -6 million in Q1 14). See methodology note No. 3. Excluding the revaluation of own financial liabilities, and DVA (Debit Value Adjustment on financial instruments as a result of the implementation of IFRS 13), earnings per share amounts to EUR 2.57, after deducting interest payable to holders of deeply subordinated notes and undated subordinated notes.
5/49
The Board of Directors of Societe Generale met on November 5th, 2014 and examined the results for the third quarter and first nine months of 2014. In Q3 2014, the Group pursued its strategy of transformation and adaptation to the new banking environment. As part of the implementation of the single supervisory mechanism in Europe at the beginning of November, the European Central Bank (ECB) and European Banking Authority (EBA) carried out a bank asset quality review and a stress test exercise. At the end of this unprecedented exercise in terms of its scale and severity, Societe Generale is able to confirm the quality of its balance sheet and the resilience of its diversified universal banking model. The conclusions of the ECB’s inspection work identified only “minor normative adjustments compared with the size of the bank” (less than 0.1% of its balance sheet). Moreover, their accounting impact is negligible and they had no effect on the Group’s ratios at September 30th, 2014. In an environment of very low growth and historically low interest rates in the eurozone, the Group’s net banking income, excluding non-economic items, amounted to EUR 5,871 million, slightly lower than the previous year (-1.8% in Q3 2014, and -1.3% in the first nine months of the year, at EUR 17,616 million). Commercial activity remained buoyant in retail banking networks, with significant growth in deposits in all the networks, against the backdrop of still weak credit demand in Europe, and the rapid development of banking activities on the African continent. The Financial Services to Corporates business line provided further evidence of its growth. In a sluggish market environment during the summer, Global Banking & Investor Solutions demonstrated the resilience of its client-focused model, with a good performance by Financing & Advisory and Private Banking. There was further confirmation of the rigorous control of operating expenses. They were down -0.4%* in Q3 2014 vs. the same period the previous year (-0.7%* in the first nine months), while the net cost of risk was significantly lower from one year to the next (-40.8%* in Q3 14 and -30.6%* in the first nine months), due primarily to the decline in the commercial cost of risk (which stood at 58 basis points in Q3 14 vs. 69 basis points in Q3 13). Moreover, no collective provision for litigation risks was booked in Q3. Benefiting from the efforts made to control operating expenses and a contained net cost of risk, Group net income amounted to EUR 836 million in Q3 14 (vs. EUR 534 million in Q3 13). Excluding non-economic items, it totalled EUR 838 million in Q3 14 (vs. EUR 758 million in Q3 13, +10.5%). It was lower in the first nine months of 2014 vs. the same period in 2013 (-11.0% excluding non-economic items) primarily following the goodwill write-down of the Group’s activities in Russia amounting to EUR -525 million in Q1 2014. These results have bolstered the Common Equity Tier 1 ratio which stood at 10.4% at end- September 2014 (fully loaded), with a LCR ratio still above 100%, according to CRR/CRD4 rules, and a leverage ratio up +20 basis points at 3.8% in Q3 14. Commenting on the Group’s results at end-September 2014, Frédéric Oudéa – Chairman and CEO – stated: “The Q3 14 results provide further confirmation of the commercial momentum of the Societe Generale Group’s businesses, a source of future revenue growth, and the solidity of financial performances, thanks to good control of operating expenses and the confirmed decline in the cost of risk despite a lacklustre economic environment. The results of the asset quality review and stress tests carried out by the ECB confirm that the transformation implemented over the last three years has paid off and that Societe Generale is able to finance its growth helped by a very solid balance sheet.”
6/49
1 - GROUP CONSOLIDATED RESULTS
In EUR m Q3 13 Q3 14 Change Q3 vs. Q3
9M 13 9M 14 Change 9M vs. 9M
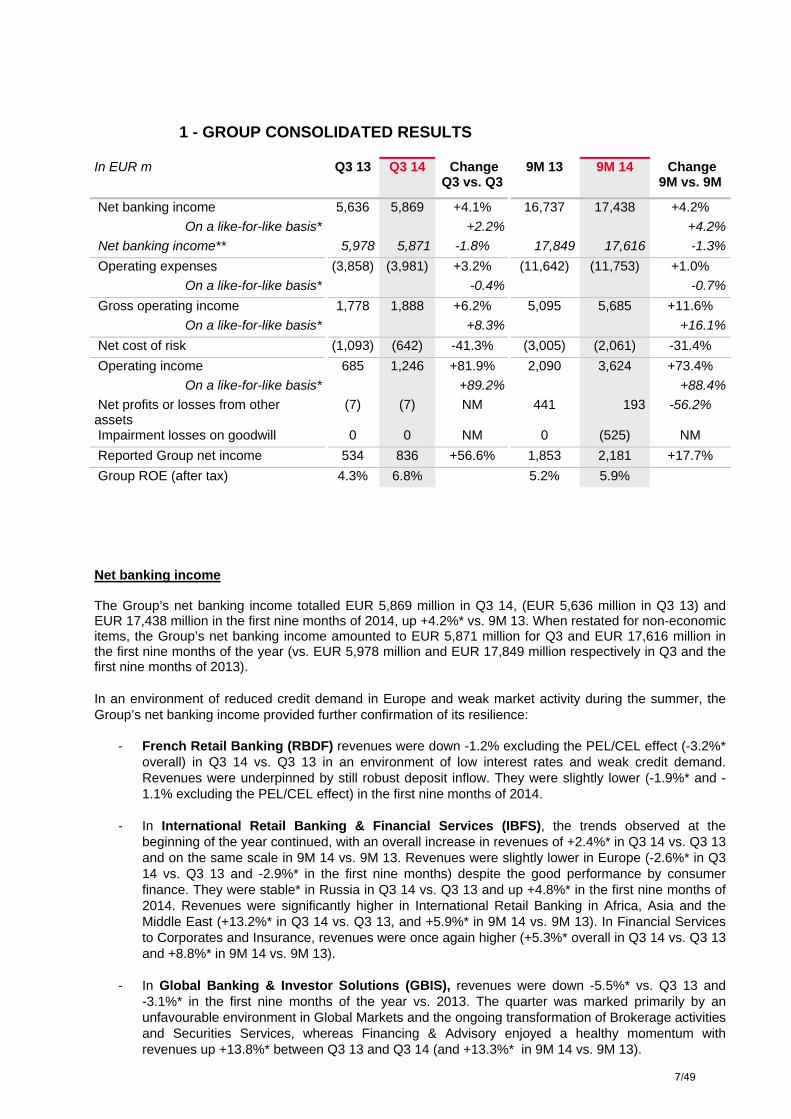
Net banking income 5,636 5,869 +4.1% 16,737 17,438 +4.2%
On a like-for-like basis* +2.2% +4.2%
Net banking income** 5,978 5,871 -1.8% 17,849 17,616 -1.3%
Operating expenses (3,858) (3,981) +3.2% (11,642) (11,753) +1.0%
On a like-for-like basis* -0.4% -0.7%
Gross operating income 1,778 1,888 +6.2% 5,095 5,685 +11.6%
On a like-for-like basis* +8.3% +16.1%
Net cost of risk (1,093) (642) -41.3% (3,005) (2,061) -31.4%
Operating income 685 1,246 +81.9% 2,090 3,624 +73.4%
On a like-for-like basis* +89.2% +88.4%
Net profits or losses from other assets
(7) (7) NM 441 193 -56.2%
Impairment losses on goodwill 0 0 NM 0 (525) NM
Reported Group net income 534 836 +56.6% 1,853 2,181 +17.7%
Group ROE (after tax) 4.3% 6.8% 5.2% 5.9%
Net banking income The Group’s net banking income totalled EUR 5,869 million in Q3 14, (EUR 5,636 million in Q3 13) and EUR 17,438 million in the first nine months of 2014, up +4.2%* vs. 9M 13. When restated for non-economic items, the Group’s net banking income amounted to EUR 5,871 million for Q3 and EUR 17,616 million in the first nine months of the year (vs. EUR 5,978 million and EUR 17,849 million respectively in Q3 and the first nine months of 2013). In an environment of reduced credit demand in Europe and weak market activity during the summer, the Group’s net banking income provided further confirmation of its resilience:
- French Retail Banking (RBDF) revenues were down -1.2% excluding the PEL/CEL effect (-3.2%* overall) in Q3 14 vs. Q3 13 in an environment of low interest rates and weak credit demand. Revenues were underpinned by still robust deposit inflow. They were slightly lower (-1.9%* and -1.1% excluding the PEL/CEL effect) in the first nine months of 2014.
- In International Retail Banking & Financial Services (IBFS), the trends observed at the
beginning of the year continued, with an overall increase in revenues of +2.4%* in Q3 14 vs. Q3 13 and on the same scale in 9M 14 vs. 9M 13. Revenues were slightly lower in Europe (-2.6%* in Q3 14 vs. Q3 13 and -2.9%* in the first nine months) despite the good performance by consumer finance. They were stable* in Russia in Q3 14 vs. Q3 13 and up +4.8%* in the first nine months of 2014. Revenues were significantly higher in International Retail Banking in Africa, Asia and the Middle East (+13.2%* in Q3 14 vs. Q3 13, and +5.9%* in 9M 14 vs. 9M 13). In Financial Services to Corporates and Insurance, revenues were once again higher (+5.3%* overall in Q3 14 vs. Q3 13 and +8.8%* in 9M 14 vs. 9M 13).
- In Global Banking & Investor Solutions (GBIS), revenues were down -5.5%* vs. Q3 13 and
-3.1%* in the first nine months of the year vs. 2013. The quarter was marked primarily by an unfavourable environment in Global Markets and the ongoing transformation of Brokerage activities and Securities Services, whereas Financing & Advisory enjoyed a healthy momentum with revenues up +13.8%* between Q3 13 and Q3 14 (and +13.3%* in 9M 14 vs. 9M 13).
7/49

The accounting impact of the revaluation of the Group’s own financial liabilities was EUR -4 million in Q3 14 (EUR -223 million in Q3 13), or EUR -183 million in 9M 14 (EUR -1,215 million in 9M 13). The DVA effect (see methodology note No. 8) amounted to EUR +2 million in Q3 14 (vs. EUR -116 million in Q3 13), and EUR +5 million in total for 9M 14 (vs. EUR +107 million for 9M 13). These two factors constitute the restated non-economic items in the analyses of the Group’s results. Operating expenses The Group’s operating expenses amounted to EUR -3,981 million in Q3 14 (EUR -11,753 million in 9M 14), down -0.4%* vs. Q3 13 (and -0.7%* vs. 9M 13). The cost-cutting programme initiated in 2013 continued, with secure recurrent annual savings totalling EUR 625 million at end-September 2014, for total non-recurring costs of EUR -330 million, including EUR -110 million in 2014. Operating income The Group’s gross operating income amounted to EUR 1,888 million in Q3 14 vs. EUR 1,778 million in Q3 13. It totalled EUR 5,685 million for 9M 14 (vs. EUR 5,095 million in 9M 13). The businesses’ gross operating income came to EUR 2,108 million in Q3 14, down -5.9%* vs. Q3 13, and EUR 6,607 million in 9M 14 (-3.1%* vs. 9M 13).
The Group’s net cost of risk amounted to EUR 642 million in Q3 14, down -40.8%* vs. Q3 13 which included a EUR 200 million collective provision for litigation issues. The Group maintained its stock of collective provisions for litigation issues at EUR 900 million in Q3 14. The Group’s commercial cost of risk (expressed as a fraction of outstanding loans) stood at 58(1) basis points in Q3 14, stable vs. Q2 14, in a still challenging economic environment.
- In French Retail Banking, the commercial cost of risk amounted to 51 basis points (vs. 57 basis points in Q2 14). The rate of new defaults continued to declinefor business customers.
- At 128 basis points (vs. 106 basis points in Q2 14), International Retail Banking & Financial Services’ cost of risk was higher, primarily due to additional provisions and write-downs recognised in Romania as in the Romanian banking sector. In other regions, the cost of risk remained well under control, particularly in Russia where it was generally stable, despite the high level for individual customers.
- Global Banking & Investor Solutions’ cost of risk remained low at 6 basis points (vs. 11 basis points in Q2 14), confirming the quality of the loan portfolio.
The gross doubtful outstandings ratio, excluding legacy assets, was 5.7% at end-September 2014 (vs. 5.9% at end-June 2014). The Group’s gross NPL coverage ratio, excluding legacy assets, was stable at 60%.
The Group’s operating income totalled EUR 1,246 million in Q3 14, vs. EUR 685 million in Q3 13. The difference can be explained essentially by the sharp decline in the net cost of risk and the very low cost recognised in Q3 14 in respect of non-economic items. It was EUR 3,624 million in 9M 14, substantially higher than in 9M 13 (EUR 2,090 million).
The businesses’ operating income was substantially higher between Q3 13 and Q3 14 (+9.4%*), due to the combined effect of solid net banking income, well-controlled operating expenses and a decline in the net cost of risk: the businesses’ operating income rose +11.6%* in 9M 14.
(1) Annualised rate, excluding litigation issues and legacy assets in 2013, in respect of assets at the beginning of the
period and including operating leases. Cost of risk in Q3 13 of 63 basis points for RBDF, 132 basis points for IBFS and 23 basis points for GBIS.
8/49
Net income
After taking into account tax (the Group’s effective tax rate was 30.2% in Q3 14 and 26.8% in 9M 14) and the contribution of non-controlling interests, Group net income totalled EUR 836 million in Q3 14 (EUR 2,181 million for the first nine months of the year). In 2013, Q3 Group net income was EUR 534 million, with an effective tax rate of 13.7% (income totalled EUR 1,853 million for the first nine months of 2013 and the effective tax rate was 20.2%). When corrected for non-economic items (revaluation of own financial liabilities and DVA), Group net income amounted to EUR 838 million in Q3 14 vs. EUR 758 million in Q3 13. Group net income, excluding non-economic items, totalled EUR 2,298 million in the first nine months of the year (including EUR -200 million in respect of the collective provision for litigation issues, EUR -525 million related to the goodwill write-down on International Retail Banking & Financial Services’ activities in Russia, and EUR +210 million following the acquisition and initial consolidation of Newedge Group). Group net income, excluding non-economic items, was EUR 2,582 million in the first nine months of 2013 and included in particular the positive result of the disposal of the NSGB subsidiary, amounting to EUR +417 million.
The Group’s ROE(1), excluding non-economic items, stood at 6.8% for Q3 14 (6.8% in absolute terms) and 6.3% for the first nine months of 2014 (5.9% in absolute terms). Earnings per share amounts to EUR 2.42 at end-September 2014, after deducting interest payable to holders of deeply subordinated notes and undated subordinated notes(1). If the revaluation of own financial liabilities and DVA are stripped out, earnings per share amounts to EUR 2.57, after deducting interest payable to holders of deeply subordinated notes and undated subordinated notes(1).
(1) Q3 13 ROE: 4.3% - ROE excluding non-economic items in Q3 13: 6.4%. 9M 13 ROE: 5.2% - ROE excluding non-
economic items: 7.5%.The interest, net of tax effect, payable to holders of deeply subordinated notes and undated subordinated notes amounts to respectively EUR 294 million and EUR 5 million for 9M 14; it is also necessary to reintegrate a buyback capital loss amounting to EUR 6 million (see methodology note No. 3).
9/49

2 - THE GROUP’S FINANCIAL STRUCTURE
Group shareholders’ equity totalled EUR 55.0 billion(1) at September 30th, 2014 and tangible net asset value per share was EUR 51.33 (corresponding to net asset value per share of EUR 57.84, including EUR 1.21 of unrealised capital gains). The consolidated balance sheet totalled EUR 1,292 billion at September 30th, 2014 (EUR 1,214 billion at December 31st, 2013, an amount adjusted in relation to the published financial statements, after the retrospective implementation of IFRS 10 and 11). The net amount of customer loans, including lease financing, was EUR 356 billion (EUR +11 billion vs. December 31st, 2013). At the same time, customer deposits amounted to EUR 319 billion (EUR +5 billion vs. December 31st, 2013). The Group’s funded balance sheet (see methodology note No. 7) totalled EUR 642 billion at end-September 2014, generally stable vs. the end of 2013, with a loan/deposit ratio of 100% (-4 points vs. December 31st, 2013). At end-September 2014, the Group had completed its medium/long-term financing programme for 2014 under satisfactory financial conditions (around 41 basis points above the 6-month mid-swap benchmark index at September 30th, 2014) with an average maturity (excluding subordinated debt) of 5.3 years. The Group’s liquid asset buffer (see methodology note No. 7) totalled EUR 144 billion at September 30th, 2014 (vs. EUR 174 billion at December 31st, 2013), covering 154% of short-term financing requirements (including long-term debt arriving at maturity in less than one year), vs. 145% at end-December 2013. The Group’s risk-weighted assets amounted to EUR 353.1 billion at end-September 2014, vs. EUR 342.6 billion at end-December 2013 and EUR 350.7 billion at end-June 2014 according to CRR/CRD4 rules. Risk-weighted assets in respect of credit risk increased slightly in Q3 14 and still represent the largest share of the Group’s risk exposure. At September 30th, 2014, the Group’s Common Equity Tier 1 ratio(2) stood at 10.4%(3). It was 10.2% at June 30th, 2014 and 9.9% at end-September 2013. The Tier 1 ratio was 13.0%, up +163 basis points vs. end-September 2013. The Total Capital ratio amounted to 14.6% at end-September 2014, up +146 basis points year-on-year. The leverage ratio stood at 3.8%(2), up +20 basis points vs. end-June 2014, due to the growth of the Group’s Tier 1 capital and a decline in its regulatory exposure. It was half a point higher than in Q3 13. The Group is rated by the rating agencies DBRS (long-term senior rating: AA(low) –negative outlook), FitchRatings (long-term senior rating: A – negative outlook), Moody’s (long-term senior rating: A2 – negative outlook) and Standard & Poor’s (long-term senior rating: A – negative outlook).
(1) This figure includes notably (i) EUR 9.2 billion of deeply subordinated notes and (ii) EUR 0.4 billion of undated
subordinated notes (2) All the solvency/leverage ratios published are calculated according to CRR/CRD4 rules, without the benefit of
transitional provisions (fully-loaded), unless indicated otherwise. They are presented pro forma for current earnings, net of dividends, for the current financial year. 2013 data pro forma for applicable CRR/CRD4 rules. Leverage ratio including the provisions of the delegated act published in October 2014. See methodology note No. 5.
(3) The phased-in ratio stood at 11.1% at September 30th, 2014.
10/49

3 - FRENCH RETAIL BANKING
In EUR m Q3 13 Q3 14 Change
Q3 vs. Q3 9M 13 9M 14 Change
9M vs. 9M
Net banking income 2,086 2,019 -3.2% 6,276 6,158 -1.9%
-1.2%(1) -1.1%(1)
Operating expenses (1,316) (1,304) -0.9% (3,973) (3,921) -1.3%
Gross operating income 770 715 -7.1% 2,303 2,237 -2.9%
-1.5%(1) -0.7%(1)
Net cost of risk (293) (237) -19.2% (912) (738) -19.1%
Operating income 477 478 +0.3% 1,391 1,499 +7.8%
Group net income 314 305 -2.7% 910 964 +5.9%
(1) Excluding PEL/CEL
Despite a still challenging macro-economic environment in Q3, French Retail Banking enjoyed robust commercial activity and demonstrated the quality of its franchise. The commercial expansion of the Group’s brands continued at a strong pace: in the first nine months of 2014, net openings of sight accounts totalled 172,000, up +23.8% compared with the first nine months of 2013. Similarly, new relationships with commercial customers were up +5.2% at 2,736. Societe Generale was also voted “Customer Service of the Year 2015” in the Banking category. This title, awarded by Viséo Conseil, and already obtained for 2012 and 2014, rewards the French Retail Banking teams’ commitment to satisfying its customers. In line with previous quarters, outstanding balance sheet deposits rose +4.6% vs. Q3 13 to EUR 164.1 billion (in terms of average outstandings). This performance was driven primarily by sight deposit inflow which was +7.0% higher than in Q3 13. The decline in the remuneration rate of the Livret A passbook savings account on August 1st, 2014 negatively impacted its attractiveness (+2.8% vs. Q3 13), which benefited the inflow on PEL home ownership savings plans (+9.0% vs. Q3 13). French Retail Banking continued to actively support the economy, assisting both businesses and individuals with the financing of their projects. However, against a backdrop of economic uncertainty, financing demand remained weak, even if the first positive signs of a return to growth started to be felt. Corporate loan production was 6.0% higher in the first nine months vs. 2013, driven by the acceleration in demand in the third quarter. Overall, outstandings were stable vs. the previous quarter at EUR 175.0 billion and down -1.7% vs. Q3 13. Outstanding loans for commercial and business customers totalled EUR 78.0 billion while outstanding loans to individuals amounted to EUR 95.9 billion. The loan/deposit ratio continued to decline to 107% in Q3 14 vs. 108% in Q2 14 and 113% in Q3 13. French Retail Banking revenues were resilient, with net banking income of EUR 2,082 million (excluding the PEL/CEL effect). This was slightly lower (-1.2%) than in Q3 13. The interest margin was higher than in Q3 13 (+0.7% excluding the PEL/CEL effect), with the impact of the decline in reinvestment rates being offset by the rise in outstanding deposits. Commissions were down -3.8% over this same period, primarily due to the capping of processing fees. Operating expenses were slightly lower (-0.9%) than in Q3 13, reflecting the effect of the cost savings plans introduced, while the net cost of risk was substantially lower (-19.2% vs. Q3 13). As a result, French Retail Banking posted a contribution to Group net income of EUR 305 million in Q3 14, up +5.3% (excluding the PEL/CEL effect) vs. Q3 13. The contribution to Group net income totalled EUR 964 million in the first nine months of the year, up +9.0% (excluding the PEL/CEL effect) vs. 9M 13.
11/49
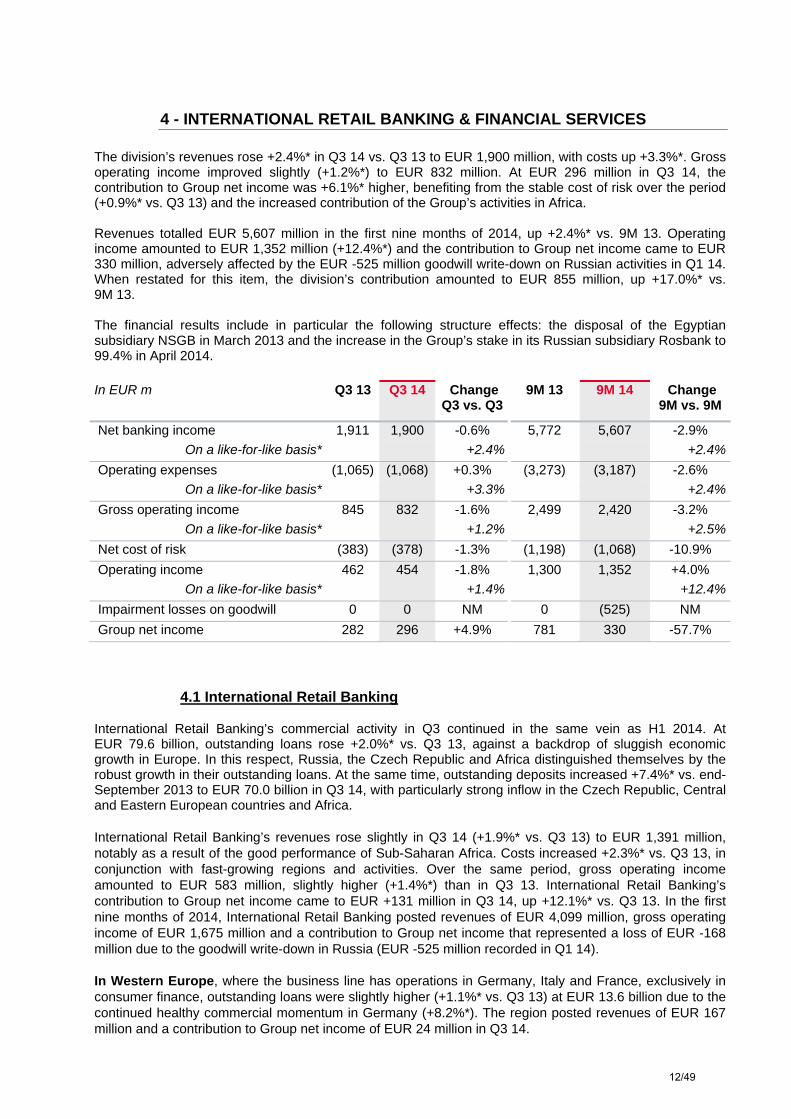
4 - INTERNATIONAL RETAIL BANKING & FINANCIAL SERVICES The division’s revenues rose +2.4%* in Q3 14 vs. Q3 13 to EUR 1,900 million, with costs up +3.3%*. Gross operating income improved slightly (+1.2%*) to EUR 832 million. At EUR 296 million in Q3 14, the contribution to Group net income was +6.1%* higher, benefiting from the stable cost of risk over the period (+0.9%* vs. Q3 13) and the increased contribution of the Group’s activities in Africa. Revenues totalled EUR 5,607 million in the first nine months of 2014, up +2.4%* vs. 9M 13. Operating income amounted to EUR 1,352 million (+12.4%*) and the contribution to Group net income came to EUR 330 million, adversely affected by the EUR -525 million goodwill write-down on Russian activities in Q1 14. When restated for this item, the division’s contribution amounted to EUR 855 million, up +17.0%* vs. 9M 13. The financial results include in particular the following structure effects: the disposal of the Egyptian subsidiary NSGB in March 2013 and the increase in the Group’s stake in its Russian subsidiary Rosbank to 99.4% in April 2014.
In EUR m Q3 13 Q3 14 Change
Q3 vs. Q3 9M 13 9M 14 Change
9M vs. 9M
Net banking income 1,911 1,900 -0.6% 5,772 5,607 -2.9%
On a like-for-like basis* +2.4% +2.4%
Operating expenses (1,065) (1,068) +0.3% (3,273) (3,187) -2.6%
On a like-for-like basis* +3.3% +2.4%
Gross operating income 845 832 -1.6% 2,499 2,420 -3.2%
On a like-for-like basis* +1.2% +2.5%
Net cost of risk (383) (378) -1.3% (1,198) (1,068) -10.9%
Operating income 462 454 -1.8% 1,300 1,352 +4.0%
On a like-for-like basis* +1.4% +12.4%
Impairment losses on goodwill 0 0 NM 0 (525) NM
Group net income 282 296 +4.9% 781 330 -57.7%
4.1 International Retail Banking International Retail Banking’s commercial activity in Q3 continued in the same vein as H1 2014. At EUR 79.6 billion, outstanding loans rose +2.0%* vs. Q3 13, against a backdrop of sluggish economic growth in Europe. In this respect, Russia, the Czech Republic and Africa distinguished themselves by the robust growth in their outstanding loans. At the same time, outstanding deposits increased +7.4%* vs. end-September 2013 to EUR 70.0 billion in Q3 14, with particularly strong inflow in the Czech Republic, Central and Eastern European countries and Africa. International Retail Banking’s revenues rose slightly in Q3 14 (+1.9%* vs. Q3 13) to EUR 1,391 million, notably as a result of the good performance of Sub-Saharan Africa. Costs increased +2.3%* vs. Q3 13, in conjunction with fast-growing regions and activities. Over the same period, gross operating income amounted to EUR 583 million, slightly higher (+1.4%*) than in Q3 13. International Retail Banking’s contribution to Group net income came to EUR +131 million in Q3 14, up +12.1%* vs. Q3 13. In the first nine months of 2014, International Retail Banking posted revenues of EUR 4,099 million, gross operating income of EUR 1,675 million and a contribution to Group net income that represented a loss of EUR -168 million due to the goodwill write-down in Russia (EUR -525 million recorded in Q1 14). In Western Europe, where the business line has operations in Germany, Italy and France, exclusively in consumer finance, outstanding loans were slightly higher (+1.1%* vs. Q3 13) at EUR 13.6 billion due to the continued healthy commercial momentum in Germany (+8.2%*). The region posted revenues of EUR 167 million and a contribution to Group net income of EUR 24 million in Q3 14.
12/49
In the Czech Republic, the Komercni Banka Group enjoyed a satisfactory commercial momentum against a backdrop of increased competition. At end-September 2014, outstanding loans had risen +3.8%* (to EUR 17.7 billion) while deposit inflow remained strong, with outstandings +11.2%* higher vs. end-September 2013 (at EUR 24.8 billion). Despite this volume effect, revenues were lower (-4.7%*) than in Q3 13 at EUR 246 million, in a low interest rate environment. Over the same period, operating expenses were kept under control at EUR 124 million (-0.3%* vs. Q3 13) and the contribution to Group net income amounted to EUR 51 million in Q3 14 (vs. EUR 59 million in Q3 13). In Romania, in a still fragile economic environment, the BRD Group’s outstanding loans were still down -7.5%* (at EUR 6.4 billion) vs. end-September 2013 while outstanding deposits remained stable* at EUR 7.7 billion. As a result of lower loan volumes and margin pressure, the business line’s Romanian revenues came to EUR 138 million in Q3 14 (down -7.9%* vs. Q3 13), operating expenses to EUR 78 million (-8.9%* vs. Q3 13) and net cost of risk to EUR -106 million (vs. EUR -77 million in Q3 13). The BRD Group posted a net loss of EUR -22 million in Q3 14 vs. a loss of EUR -7 million in Q3 13. In Russia, commercial activity was resilient: increase in outstanding loans of +5.2%* vs. Q3 13 to EUR 12.9 billion, with outstanding deposits stable* at EUR 8.2 billion. Net banking income was stable* in Q3 14 vs. Q3 13 in a challenging environment, while costs were higher (+5.7%*) against a backdrop of high inflation. The contribution to Group net income amounted to EUR 5 million. All in all, the SG Russia operation(1) made a EUR 16 million contribution to Group net income in Q3 14. In the other Central and Eastern European countries, the Group substantially increased its outstanding deposits which rose +10.9%* (to EUR 9.8 billion), in contrast with the slight decline in loan activity over the same period (-1.0%* to EUR 10.6 billion). Revenues were stable* vs. Q3 13 at EUR 170 million. Over the same period, costs were stable* vs. Q3 13 at EUR 110 million. This region’s contribution to Group net income totalled EUR +27 million. In the other regions where the Group operates, outstanding loans rose +4.1%* overall at end-September 2014 vs. end-September 2013 (to EUR 18.5 billion). They were substantially higher in Sub-Saharan Africa (+19.5%*). Over the same period, outstanding deposits grew +7.0%* overall. The region boosted its net banking income by +13.2%* in Q3 14 vs. Q3 13, driven by solid revenues in Sub-Saharan Africa (+35.9%* vs. Q3 13). Costs increased +6.3%* over the same period, given the development of activity in this region. The net cost of risk was -3.5%* lower. The region’s contribution to Group net income totalled EUR 46 million in Q3 14, substantially higher than in Q3 13 (+87.2%*).
4.2 Insurance
The Insurance business maintained a healthy commercial momentum in Q3 14, in line with Q2 14. Life insurance savings outstandings continued to grow to EUR 87.9 billion in Q3 14 (+6.3%* vs. end-September 2013) and net inflow totalled EUR 1.1 billion in Q3 14. Personal Protection insurance continued to enjoy robust growth, notably in France (+11.9%* vs. Q3 13). Property/Casualty insurance premiums were up +5.3% vs. Q3 13.
The business delivered a good financial performance in Q3 14, with net banking income up +6.2%* vs. Q3 13 at EUR 198 million. The Insurance business’ contribution to Group net income amounted to EUR 82 million in Q3 14 and EUR 245 million in the first nine months of 2014.
4.3 Financial Services to Corporates In Q3 14, Financial Services to Corporates once again demonstrated the robustness of its business model, and maintained its commercial momentum and strong earnings growth vs. Q3 13.
At end-September 2014, Operational Vehicle Leasing and Fleet Management provided further evidence of the solid growth of its fleet (+10.1% vs. end-September 2013) to 1.09 million vehicles, on the back of
(1) SG Russia’s result: contribution of Rosbank, Delta Credit Bank, Rusfinance Bank, Societe Generale Insurance,
ALD Automotive and their consolidated subsidiaries to the businesses’ results.
13/49

white label partnerships for car manufacturers. It also strengthened its leadership position both at European level and globally.
Against the backdrop of an investment slowdown, Equipment Finance’s strong positions resulted in a rise in outstanding loans (+1.2%* vs. end-September 2013), with a still high level of new business (+11.8%* vs. Q3 13). New business margins were maintained.
In Q3 14, Financial Services to Corporates’ revenues rose +4.8%* vs. Q3 13 to EUR 348 million and operating expenses were up +7.8%*. Over the same period, gross operating income improved (+1.7%*) and the contribution to Group net income was substantially higher (+11.6%*) at EUR 108 million. Revenues came to EUR 1,033 million in 9M 14 and the contribution to Group net income amounted to EUR 317 million (+22.5%* vs. 9M 13).
14/49
5 - GLOBAL BANKING & INVESTOR SOLUTIONS
In EUR m Q3 13 Q3 14 Change
Q3 vs. Q3 9M 13 9M 14 Change
9M vs. 9M
Net banking income 2,076 2,115 +1.9% 6,435 6,537 +1.6%
On a like-for-like basis* -5.5% -3.1%
Operating expenses (1,421) (1,554) +9.4% (4,242) (4,587) +8.1%
On a like-for-like basis* -2.3% -0.2%
Gross operating income 655 561 -14.3% 2,193 1,950 -11.1%
On a like-for-like basis* -13.3% -9.5%
Net cost of risk (230) (27) -88.3% (486) (53) -89.1%
Operating income 425 534 +25.8% 1,707 1,897 +11.1%
On a like-for-like basis* +28.3% +14.2%
Group net income 366 445 +21.5% 1,390 1,511 +8.7%
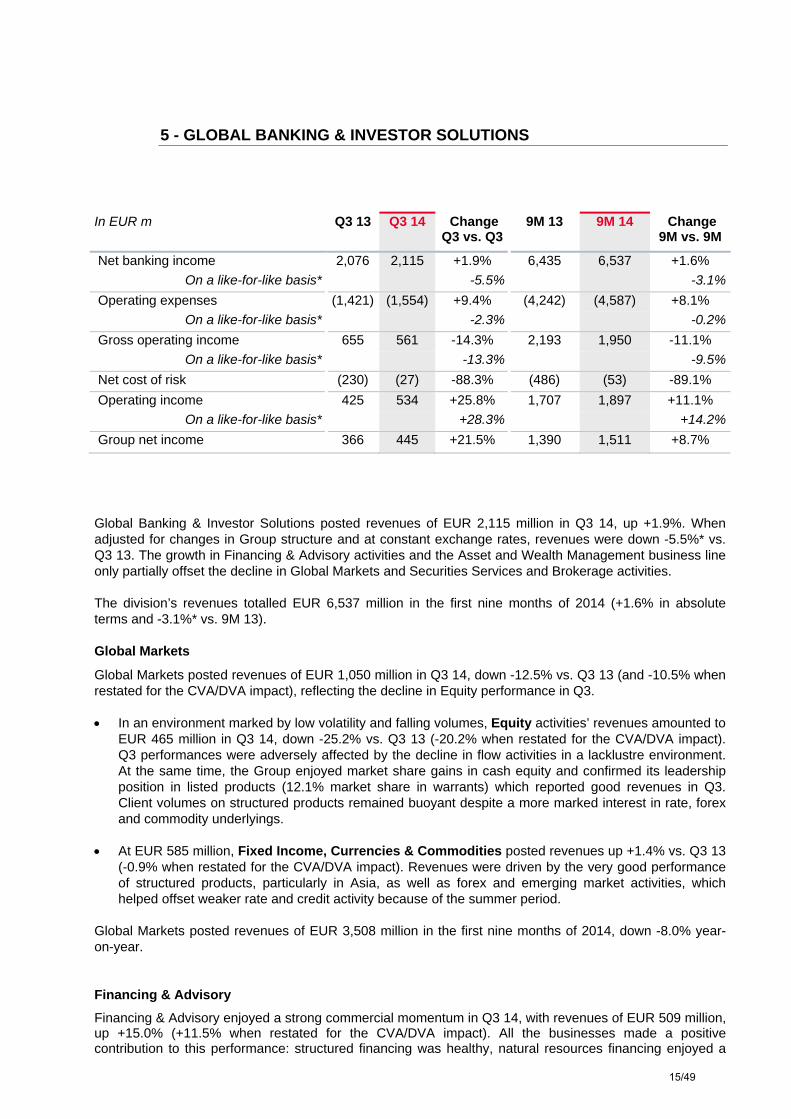
Global Banking & Investor Solutions posted revenues of EUR 2,115 million in Q3 14, up +1.9%. When adjusted for changes in Group structure and at constant exchange rates, revenues were down -5.5%* vs. Q3 13. The growth in Financing & Advisory activities and the Asset and Wealth Management business line only partially offset the decline in Global Markets and Securities Services and Brokerage activities. The division’s revenues totalled EUR 6,537 million in the first nine months of 2014 (+1.6% in absolute terms and -3.1%* vs. 9M 13).
Global Markets
Global Markets posted revenues of EUR 1,050 million in Q3 14, down -12.5% vs. Q3 13 (and -10.5% when restated for the CVA/DVA impact), reflecting the decline in Equity performance in Q3. In an environment marked by low volatility and falling volumes, Equity activities’ revenues amounted to
EUR 465 million in Q3 14, down -25.2% vs. Q3 13 (-20.2% when restated for the CVA/DVA impact). Q3 performances were adversely affected by the decline in flow activities in a lacklustre environment. At the same time, the Group enjoyed market share gains in cash equity and confirmed its leadership position in listed products (12.1% market share in warrants) which reported good revenues in Q3. Client volumes on structured products remained buoyant despite a more marked interest in rate, forex and commodity underlyings.
At EUR 585 million, Fixed Income, Currencies & Commodities posted revenues up +1.4% vs. Q3 13 (-0.9% when restated for the CVA/DVA impact). Revenues were driven by the very good performance of structured products, particularly in Asia, as well as forex and emerging market activities, which helped offset weaker rate and credit activity because of the summer period.
Global Markets posted revenues of EUR 3,508 million in the first nine months of 2014, down -8.0% year-on-year.
Financing & Advisory
Financing & Advisory enjoyed a strong commercial momentum in Q3 14, with revenues of EUR 509 million, up +15.0% (+11.5% when restated for the CVA/DVA impact). All the businesses made a positive contribution to this performance: structured financing was healthy, natural resources financing enjoyed a
15/49
good quarter and capital market activities increased substantially despite the slowdown in primary markets during the summer. Financing & Advisory posted revenues of EUR 1,496 million in the first nine months of 2014, up +13.4% vs. 9M 13. Asset and Wealth Management The revenues of the Asset and Wealth Management business line totalled EUR 273 million in Q3 14, down -2.4%* vs. Q3 13. Excluding non-recurring income, resulting from a EUR 17 million provision write-back in Q3 13, revenues were up +3.9%*.
Private Banking posted net banking income of EUR 219 million in Q3 14, down -2.9%. Revenues were up +5.0%* excluding non-recurring income booked in Q3 13.
At EUR 118 billion at end-September 2014, assets under management were up EUR +2.1 billion vs. Q2 14. Inflow was very strong in Europe (EUR 1.3 billion) with all the subsidiaries experiencing a positive inflow, particularly in the United Kingdom, France and Switzerland.
The Group finalised the sale of its private banking activities in Asia on October 6th, 2014 and accelerated its expansion in its core markets.
Lyxor’s assets under management amounted to EUR 85.4 billion, underpinned by positive inflow on ETFs, a segment in which Lyxor retains a No. 3 ranking in Europe. Lyxor’s revenues were up +4.4%* at EUR 49 million in Q3 14. In the first nine months of 2014, Asset and Wealth Management posted revenues of EUR 792 million (-0.8%* year-on-year). Securities Services and Brokerage At EUR 157 million in Q3 14, Securities Services’ revenues were up +3.2%* vs. Q3 13, with the increase in commissions offsetting the negative impact of the continued decline in interest rates. Assets under custody increased +5.6% vs. end-September 2013 (to EUR 3,810 billion) and assets under administration +11.7% over the same period (to EUR 546 billion). Newedge’s Brokerage activity posted revenues down -14.8%*. Its integration process continued, together with the ongoing implementation of synergies with Global Markets. In the first nine months of 2014, the revenues of Securities Services and Brokerage came to EUR 741 million (-10.5%* vs. 9M 13). Operating expenses Global Banking & Investor Solutions’ operating expenses fell -2.3%* vs. Q3 13 to EUR -1,554 million, reflecting good cost control in investment banking (-5.5%*, notably in Global Markets where they declined -9.9%*) and reduced expenses in Securities Services and Brokerage (-0.2%* vs. Q3 13 and -5.4%* in 9M 14). Operating expenses fell -0.2%* in 9M 14 to EUR -4,587 million. Operating income Gross operating income came to EUR 561 million, down -13.3%*. The net cost of risk remained low (EUR -27 million), reflecting the quality of the Group’s portfolio. In Q3 13, the net cost of risk amounted to EUR -230 million including EUR -154 million originating from legacy assets.
16/49
The division’s operating income totalled EUR 534 million in Q3 14, up +28.3%* vs. Q3 13. Operating income was up +14.2%* in 9M 14 vs. the same period in 2013 at EUR 1,897 million. Net income The division’s contribution to Group net income amounted to EUR 445 million in Q3 14. This was substantially higher (+22.8%*) than in Q3 13, confirming the resilience of the business model. ROE stood at 13.4% in Q3 14. Global Banking & Investor Solutions’ contribution to Group net income totalled EUR 1,511 million in 9M 14, representing a ROE of 15.6%.
17/49

6 - CORPORATE CENTRE
In EUR m Q3 13 Q3 14 Change Q3 vs. Q3
9M 13 9M 14 Change 9M vs. 9M
Net banking income (437) (165) +62.2% (1,745) (864) +50.5%
On a like-for-like basis* +62.5% +51.1%
Operating expenses (55) (55) -0.8% (154) (58) -62.4%
On a like-for-like basis* -0.0% -62.0%
Gross operating income (492) (220) +55.3% (1,900) (922) +51.5%
On a like-for-like basis* +55.6% +52.0%
Net cost of risk (186) 0 -100.0% (409) (202) -50.6%
Operating income (679) (220) +67.6% (2,308) (1,124) +51.3%
On a like-for-like basis* +67.7% +51.7%
Group net income (428) (210) +51.0% (1,228) (624) +49.2%
The Corporate Centre includes:
- the property management of the Group’s head office,
- the Group’s equity portfolio,
- the Treasury function for the Group, certain costs related to cross-functional projects and certain costs incurred by the Group and not reinvoiced.
The Corporate Centre’s revenues totalled EUR -165 million in Q3 14 (vs. EUR -437 million in Q3 13). They include in particular the revaluation of the Group’s own financial liabilities amounting to EUR -4 million (vs. a total impact in Q3 13 of EUR -223 million). The effect of the revaluation of own financial liabilities amounted to EUR -183 million in the first nine months of 2014, vs. EUR -1,215 million over the same period in 2013.
Operating expenses amounted to EUR -55 million in Q3 14, stable vs. Q3 13.
Gross operating income was EUR -220 million in Q3 14. When restated for the revaluation of own financial liabilities (see methodology note No. 8), it amounted to EUR -216 million (vs. EUR -269 million in Q3 13).
The net cost of risk was nil in Q3 14, vs. EUR -186 million in Q3 13, which included an additional collective provision for litigation issues amounting to EUR -200 million.
The Corporate Centre’s contribution to Group net income was a loss of EUR -210 million in Q3 14, vs. EUR -428 million in Q3 13. When restated for the revaluation of own financial liabilities (see methodology note No. 8), it amounted to EUR -207 million (vs. EUR -282 million in Q3 13).
The Corporate Centre’s contribution to Group net income totalled EUR -624 million in the first nine months of 2014 (EUR -1,228 million in 9M 13), or EUR -504 million net of the effect of the revaluation of own financial liabilities (EUR -431 million in 9M 13).
18/49
7 - CONCLUSION
In a still uncertain environment, the Group’s businesses once again delivered a good operating performance, with operating expenses and cost of risk under control. The in-depth analysis work carried out by the European Central Bank and European Banking Authority as part of the comprehensive assessment of bank balance sheets has highlighted the pertinence of the bank’s management procedures, the quality of its assets and underlined the solidity and resilience of its balance sheet in the event of a prolonged adverse stress. The Group is in a good position to seize growth opportunities, helped by the quality of its assets, its customer-focused universal banking model and the transformation efforts embarked on for several years.
8 - 2014/2015 FINANCIAL CALENDAR
2014/2015 financial communication calendar February 12th, 2015 Publication of fourth quarter and FY 2014 results May 6th, 2015 Publication of first quarter 2015 results May 19th, 2015 Annual General Meeting
This document contains forward-looking statements relating to the targets and strategies of the Societe Generale Group. These forward-looking statements are based on a series of assumptions, both general and specific, in particular the application of accounting principles and methods in accordance with IFRS (International Financial Reporting Standards) as adopted in the European Union, as well as the application of existing prudential regulations. These forward-looking statements have also been developed from scenarios based on a number of economic assumptions in the context of a given competitive and regulatory environment. The Group may be unable to: - anticipate all the risks, uncertainties or other factors likely to affect its business and to appraise their potential consequences; - evaluate the extent to which the occurrence of a risk or a combination of risks could cause actual results to differ materially from those provided in this document and the related presentation. Therefore, although Societe Generale believes that these statements are based on reasonable assumptions, these forward-looking statements are subject to numerous risks and uncertainties, including matters not yet known to it or its management or not currently considered material, and there can be no assurance that anticipated events will occur or that the objectives set out will actually be achieved. Important factors that could cause actual results to differ materially from the results anticipated in the forward-looking statements include, among others, overall trends in general economic activity and in Societe Generale’s markets in particular, regulatory and prudential changes, and the success of Societe Generale’s strategic, operating and financial initiatives. More detailed information on the potential risks that could affect Societe Generale’s financial results can be found in the Registration Document filed with the French Autorité des Marchés Financiers. Investors are advised to take into account factors of uncertainty and risk likely to impact the operations of the Group when considering the information contained in such forward-looking statements. Other than as required by applicable law, Societe Generale does not undertake any obligation to update or revise any forward-looking information or statements. Unless otherwise specified, the sources for the business rankings and market positions are internal.
19/49

9 - APPENDIX 1: FINANCIAL DATA: 2013 data adjusted following the retrospective implementation of IFRS 10 and 11 on January 1st, 2014
CONSOLIDATED INCOME STATEMENT (in EUR millions)
Q3 13 Q3 14 ChangeQ3 vs. Q3
9M 13 9M 14 Change9M vs. 9M
Net banking income 5,636 5,869 +4.1% +2.2%* 16,737 17,438 +4.2% +4.2%*
Operating expenses (3,858) (3,981) +3.2% -0.4%* (11,642) (11,753) +1.0% -0.7%*
Gross operating income 1,778 1,888 +6.2% +8.3%* 5,095 5,685 +11.6% +16.1%*
Net cost of risk (1,093) (642) -41.3% -40.8%* (3,005) (2,061) -31.4% -30.6%*
Operating income 685 1,246 +81.9% +89.2%* 2,090 3,624 +73.4% +88.4%*
Net profits or losses from other assets (7) (7) +0.0% 441 193 -56.2%
Net income from companies accounted for by the equity method
45 39 -13.3% 141 141 +0.0%
Impairment losses on goodwill 0 0 NM 0 (525) NM
Income tax (93) (374) x4.0 (510) (1,025) x2.0
Net income 630 904 +43.5% 2,162 2,408 +11.4%
O.w. non controlling interests 96 68 -29.2% 309 227 -26.5%
Group net income 534 836 +56.6% +59.0%* 1,853 2,181 +17.7% +24.1%*
Tier 1 ratio at end of period 13.5% 13.0% * When adjusted for changes in Group structure and at constant exchange rates
NET INCOME AFTER TAX BY CORE BUSINESS (in EUR millions)
Q3 13 Q3 14 Change Q3 vs. Q3
9M 13 9M 14
Change 9M vs. 9M
French Retail Banking 314 305 -2.7% 910 964 +5.9% International Retail Banking & Financial Services
282 296 +4.9% 781 330 -57.7%
Global Banking and Investor Solutions 366 445 +21.5% 1,390 1,511 +8.7%
CORE BUSINESSES 962 1,046 +8.7% 3,081 2,805 -9.0% Corporate Centre (428) (210) +51.0% (1,228) (624) +49.2% GROUP 534 836 +56.6% 1,853 2,181 +17.7%
20/49
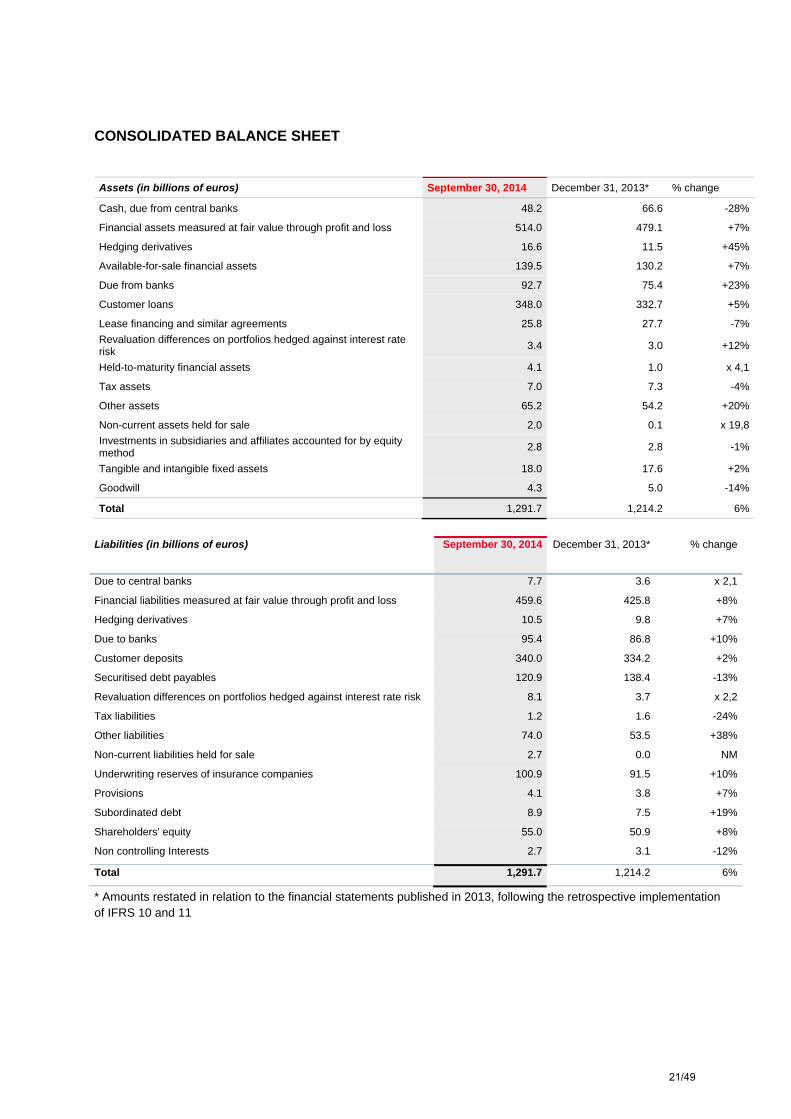
CONSOLIDATED BALANCE SHEET Assets (in billions of euros) September 30, 2014 December 31, 2013* % change
Cash, due from central banks 48.2 66.6 -28%
Financial assets measured at fair value through profit and loss 514.0 479.1 +7%
Hedging derivatives 16.6 11.5 +45%
Available-for-sale financial assets 139.5 130.2 +7%
Due from banks 92.7 75.4 +23%
Customer loans 348.0 332.7 +5%
Lease financing and similar agreements 25.8 27.7 -7%
Revaluation differences on portfolios hedged against interest rate risk
3.4 3.0 +12%
Held-to-maturity financial assets 4.1 1.0 x 4,1
Tax assets 7.0 7.3 -4%
Other assets 65.2 54.2 +20%
Non-current assets held for sale 2.0 0.1 x 19,8
Investments in subsidiaries and affiliates accounted for by equity method
2.8 2.8 -1%
Tangible and intangible fixed assets 18.0 17.6 +2%
Goodwill 4.3 5.0 -14%
Total 1,291.7 1,214.2 6%
Liabilities (in billions of euros) September 30, 2014 December 31, 2013* % change
Due to central banks 7.7 3.6 x 2,1
Financial liabilities measured at fair value through profit and loss 459.6 425.8 +8%
Hedging derivatives 10.5 9.8 +7%
Due to banks 95.4 86.8 +10%
Customer deposits 340.0 334.2 +2%
Securitised debt payables 120.9 138.4 -13%
Revaluation differences on portfolios hedged against interest rate risk 8.1 3.7 x 2,2
Tax liabilities 1.2 1.6 -24%
Other liabilities 74.0 53.5 +38%
Non-current liabilities held for sale 2.7 0.0 NM
Underwriting reserves of insurance companies 100.9 91.5 +10%
Provisions 4.1 3.8 +7%
Subordinated debt 8.9 7.5 +19%
Shareholders' equity 55.0 50.9 +8%
Non controlling Interests 2.7 3.1 -12%
Total 1,291.7 1,214.2 6%
* Amounts restated in relation to the financial statements published in 2013, following the retrospective implementation of IFRS 10 and 11
21/49

10 - APPENDIX 2: METHODOLOGY
1- The Group’s consolidated results as at September 30th, 2014 were examined by the Board of Directors on November 5th, 2014. The financial information presented in respect of the nine-month period ended September 30th, 2014 has been prepared in accordance with IFRS as adopted in the European Union and applicable at that date. This financial information does not constitute a set of financial statements for an interim period as defined by IAS 34 "Interim Financial Reporting" and has not been audited. Societe Generale’s management intends to publish full consolidated financial statements for the 2014 financial year. Note that the data for the 2013 financial year have been restated due to the implementation of IFRS 10 and 11, resulting in the publication of adjusted data for the previous financial year. For financial communication purposes, data relating to the subsidiary Lyxor were reclassified in 2013 within the Global Banking & Investor Solutions division in Asset and Wealth Management, this change only actually taking effect at the beginning of 2014. 2- Group ROE is calculated on the basis of average Group shareholders’ equity under IFRS excluding (i) unrealised or deferred capital gains or losses booked directly under shareholders' equity excluding conversion reserves, (ii) deeply subordinated notes, (iii) undated subordinated notes recognised as shareholders’ equity (“restated”), and deducting (iv) interest payable to holders of deeply subordinated notes and of the restated, undated subordinated notes. The net income used to calculate ROE is based on Group net income excluding interest, net of tax impact, to be paid to holders of deeply subordinated notes for the period and, since 2006, holders of deeply subordinated notes and restated, undated subordinated notes (see below). As from January 1st, 2014, the allocation of capital to the different businesses is based on 10% of risk-weighted assets at the beginning of the period, vs. 9% previously. The published quarterly data related to allocated capital have been adjusted accordingly. At the same time, the normative capital remuneration rate has been adjusted for a neutral combined effect on the businesses’ historical revenues. 3- For the calculation of earnings per share, “Group net income for the period” is corrected (reduced in the case of a profit and increased in the case of a loss) for capital gains/losses recorded on partial buybacks (i.e. a cumulative capital loss of EUR 6 million in 9M 14), interest, net of tax impact, to be paid to holders of:
(i) deeply subordinated notes (EUR -109 million in respect of Q3 14 and EUR -294 millon in 9M 14), (ii) undated subordinated notes recognised as shareholders’ equity (EUR -2 million in respect of
Q1 14 and EUR -5 million in 9M 14). Earnings per share is therefore calculated as the ratio of corrected Group net income for the period to the average number of ordinary shares outstanding, excluding own shares and treasury shares but including (a) trading shares held by the Group and (b) shares held under the liquidity contract. 4- Net assets are comprised of Group shareholders’ equity, excluding (i) deeply subordinated notes (EUR 9.2 billion), undated subordinated notes previously recognised as debt (EUR 0.4 billion) and (ii) interest payable to holders of deeply subordinated notes and undated subordinated notes, but reinstating the book value of trading shares held by the Group and shares held under the liquidity contract. Tangible net assets are corrected for net goodwill in the assets and goodwill under the equity method. In order to calculate Net Asset Value Per Share or Tangible Net Asset Value Per Share, the number of shares used to calculate book value per share is the number of shares issued at June 30th, 2014, excluding own shares and treasury shares but including (a) trading shares held by the Group and (b) shares held under the liquidity contract. 5- The Societe Generale Group’s Common Equity Tier 1 capital is calculated in accordance with applicable CRR/CRD4 rules. The solvency ratios are presented pro forma for current earnings, net of dividends, for the current financial year, unless specified otherwise.
22/49

6- The Group’s ROTE is calculated on the basis of tangible capital, i.e. excluding cumulative average book capital (Group share), average net goodwill in the assets and underlying average goodwill relating to shareholdings in companies accounted for by the equity method. The net income used to calculate ROTE is based on Group net income excluding interest, interest net of tax on deeply subordinated notes for the period (including issuance fees paid, for the period, to external parties and the discount charge related to the issue premium for deeply subordinated notes) and interest net of tax on undated subordinated notes recognised as shareholders’ equity for the current period (including issuance fees paid, for the period, to external parties and the discount charge related to the issue premium for undated subordinated notes). 7- Funded balance sheet, loan/deposit ratio, liquidity reserve The funded balance sheet gives a representation of the Group’s balance sheet excluding the contribution of insurance subsidiaries and after netting derivatives, repurchase agreements and accruals. At September 30th, 2014, the IFRS balance sheet excluding the assets and liabilities of insurance subsidiaries, after netting repurchase agreements and securities lending/borrowing, derivatives and accruals, has been restated to include: a) the reclassification under customer deposits of SG Euro CT outstandings (included in customer
repurchase agreements), as well as the share of issues placed by French Retail Banking networks (recorded in medium/long-term financing), and certain transactions carried out with counterparties equivalent to customer deposits (previously included in short-term financing). However, certain transactions equivalent to market resources are deducted from customer deposits and reintegrated in short-term financing. The net amount of transfers from
- medium/long-term financing to customer deposits amounted to EUR 12bn at June 30th, 2014 and EUR 13bn at September 30th, 2014 - short-term financing to customer deposits amounted to EUR 17bn at June 30th, 2014 and EUR 25bn at September 30th, 2014 - repurchase agreements to customer deposits amounted to EUR 2bn at June 30th, 2014 and EUR 1bn at September 30th, 2014
b) The balance of financing transactions has been allocated to medium/long-term resources and short-term resources based on the maturity of outstandings (more or less than one year). The initial maturity of debts has been used for debts represented by a security.
c) In assets, the item “customer loans” includes outstanding loans with customers, net of provisions and
write-downs, including net lease financing outstandings and transactions at fair value through profit and loss, and excludes financial assets reclassified under loans and receivables in 2008 in accordance with the conditions stipulated by the amendments to IAS 39. These positions have been reclassified in their original lines.
d) The accounting item “due to central banks” in liabilities has been offset against the item “net central
bank deposits” in assets.
23/49

At September 30th, 2014, the funded balance sheet was as follows:
In EUR bn ASSETS LIABILITIES
SEPT.14 SEPT.14 Net Central bank deposits 45 69 Short term resources
Interbank loans 35 13 Other Client related trading assets 94 135 Medium/Long term resources
Securities 63 25 o.w. LT debt with a remaining maturity below 1 year** Customer loans 370 369 Customer deposits
Long term assets 35 56 Equity
Total assets 642 642 Total liabilities
As a reminder, at December 31st, 2013, the funded balance sheet was as follows:
In EUR bn ASSETS LIABILITIES
DEC.13 DEC.13 Net Central bank deposits 63 96 Short term resources
Interbank loans 31 1 Other Client related trading assets 80 138 Medium/Long term resources
Securities 59 24 o.w. LT debt with a remaining maturity below 1 year** Customer loans 357 338 Customer deposits
Long term assets 35 52 Equity
Total assets 625 625 Total liabilities
The Group’s loan/deposit ratio is calculated as the ratio between customer loans and customer deposits defined accordingly. It amounted to 100% at September 30th, 2014. The liquid asset buffer or liquidity reserve includes
a) central bank cash and deposits recognised for the calculation of the liquidity buffer for the LCR ratio b) liquid assets rapidly tradable in the market (High Quality Liquid Assets or HQLA), unencumbered
net of haircuts, as included in the liquidity buffer for the LCR ratio. c) central bank eligible assets, unencumbered net of haircuts. Central bank cash balances, excluding
mandatory reserves The implementation of IFRS 10 and 11 resulted in no variation in the liquidity reserve in respect of 2013. In Q3 14, the liquidity reserve included EUR 41 billion in respect of central bank deposits, EUR 79 billion of HQLA securities and EUR 24 billion of central bank eligible assets (respectively EUR 58 billion, EUR 74 billion and EUR 32 billion in Q3 13 and EUR 60 billion, EUR 78 billion and EUR 35 billion in Q4 13).
24/49

8 – Non-economic items and restatements Non-economic items correspond to the revaluation of own financial liabilities and DVA. Details of these items, and other items that are restated, are given below for Q3 14 and Q3 13.
Q3 13 Net banking income
Operating expenses
Others Cost of risk
Group net income
Revaluation of own financial liabilities
(223) (146) Corporate Centre
Provision for disputes (200) (200) Corporate Centre
Accounting impact of DVA* (119) (78) Group
Accounting impact of CVA* 112 73 Group
Impairment & capital losses (8) (8) Corporate Centre
TOTAL (230) (359) Group
Q3 14 Net banking income
Operating expenses
Others Cost of risk
Group net income
Revaluation of own financial liabilities
(4) (3) Corporate Centre
Accounting impact of DVA* 2 1 Group
Accounting impact of CVA* (39) (26) Group
TOTAL (41) (27) Group
25/49

Similarly, details of these items, and other items that are restated, are given below for 9M 14 and 9M 13.
9M 13 Net banking income
Operating expenses
Others Cost of risk
Group net income
Revaluation of own financial liabilities
(1,215) (797) Corporate Centre
Capital gain on NSGB disposal 417 377 Corporate Centre
Adjustment on TCW disposal 24 21 Corporate Centre
Provision for disputes (400) (400) Corporate Centre
Accounting impact of CVA* (300) (197) Group
Accounting impact of DVA* 103 67 Group
Capital gain on Piraeus stake disposal
33 21 Corporate Centre
Impairment & capital losses (8) (8) Corporate Centre
TOTAL (1,379) (916) Group
9M 14 Net banking
income Operating expenses
Others Cost of risk
Group net income
Revaluation of own financial liabilities
(183) (120) Corporate Centre
Provision for disputes (200) (200) Corporate Centre
Accounting impact of CVA* 56 37 Group
Accounting impact of DVA* 5 3 Group
Badwill Newedge, PV AMUNDI 210 210 Corporate Centre
Impairment & capital losses (525) (525) International Retail Banking and Financial Services
TOTAL (122) (595) Group
* Non-economic items NB (1) The sum of values contained in the tables and analyses may differ slightly from the total reported due to rounding rules. (2) All the information on the results for the period (notably: press release, downloadable data, presentation slides and supplement) is available on Societe Generale’s website www.societegenerale.com in the “Investor” section.
26/49

11 - QUARTERLY SERIES
(in millions of euros) Q1 13 Q2 13 Q3 13 Q4 13 2013 Q1 14 Q2 14 Q3 14
French Retail Banking
Net banking income 2,070 2,119 2,086 2,161 8,437 2,073 2,066 2,019
Operating expenses -1,335 -1,322 -1,316 -1,385 -5,358 -1,329 -1,288 -1,304
Gross operating income 735 798 770 776 3,079 744 778 715
Net cost of risk -323 -295 -293 -346 -1,258 -232 -269 -237
Operating income 412 502 477 430 1,821 512 509 478
Net income from other assets -1 0 0 2 2 -5 1 -6
Net income from companies accounted for by the equity method
8 10 9 11 37 10 12 13
Income tax -148 -181 -171 -156 -656 -193 -194 -179
Net income 271 331 314 287 1,203 324 328 306
O.w. non controlling interests 4 1 0 2 7 1 -8 1
Group net income 267 329 314 286 1,196 323 336 305
Average allocated capital 9,649 9,648 9,575 9,626 9,625 10,185 10,143 9,909
(in millions of euros) Q1 13 Q2 13 Q3 13 Q4 13 2013 Q1 14 Q2 14 Q3 14
International Retail Banking & Financial Services Net banking income 1,932 1,929 1,911 1,990 7,762 1,818 1,889 1,900 Operating expenses -1,113 -1,095 -1,065 -1,094 -4,367 -1,057 -1,062 -1,068 Gross operating income 819 834 845 897 3,395 761 827 832 Net cost of risk -406 -409 -383 -636 -1,835 -378 -312 -378 Operating income 413 425 462 260 1,560 383 515 454 Net income from other assets 3 -1 0 4 6 3 0 -1 Net income from companies accounted for by the equity
method 9 6 6 10 31 8 10 13
Impairment losses on goodwill 0 0 0 0 0 -525 0 0 Income tax -113 -116 -128 -81 -438 -106 -138 -122 Net income 312 314 340 194 1,160 -237 387 344 O.w. non controlling interests 56 72 58 -9 177 47 69 48 Group net income 256 242 282 203 983 -284 318 296 Average allocated capital 10,938 10,510 10,380 10,220 10,512 10,141 10,011 10,269
27/49

(in millions of euros) Q1 13 Q2 13 Q3 13 Q4 13 2013 Q1 14 Q2 14 Q3 14
o.w. International Retail Banking Net banking income 1,478 1,450 1,418 1,490 5,836 1,332 1,376 1,391 Operating expenses -869 -846 -823 -842 -3,380 -805 -811 -808 Gross operating income 610 604 594 648 2,456 527 565 583 Net cost of risk -377 -378 -356 -629 -1,740 -367 -291 -355 Operating income 233 226 239 18 716 160 274 228 Net income from other assets 3 0 0 5 7 3 0 -1 Net income from companies accounted for by the equity
method 3 2 3 2 9 4 3 4
Impairment losses on goodwill 0 0 0 0 0 -525 0 0 Income tax -57 -54 -57 -6 -174 -38 -63 -52 Net income 182 174 184 19 558 -396 214 179 O.w. non controlling interests 57 65 62 -14 170 47 70 48 Group net income 125 108 122 33 388 -443 144 131 Average allocated capital 7,118 6,655 6,543 6,420 6,684 6,537 6,495 6,637
o.w. Financial Services to Corporates and Insurance Net banking income 479 499 520 543 2,042 526 546 546 Operating expenses -232 -237 -238 -248 -956 -245 -252 -257 Gross operating income 247 262 282 296 1,086 281 294 289 Net cost of risk -24 -25 -28 -26 -103 -21 -20 -23 Operating income 223 237 254 270 983 260 274 266 Net income from other assets 0 -1 0 0 -1 0 0 0 Net income from companies accounted for by the equity
method 6 5 3 10 25 5 6 10
Impairment losses on goodwill 0 0 0 0 0 0 0 0 Income tax -71 -75 -81 -84 -311 -82 -88 -84 Net income 158 166 176 196 696 183 192 192 O.w. non controlling interests 2 2 2 2 7 2 1 2 Group net income 157 164 175 194 689 181 191 190 Average allocated capital 3,612 3,639 3,624 3,613 3,622 3,457 3,398 3,522 o.w. Insurance Net banking income 182 185 187 195 750 192 195 198 Operating expenses -67 -69 -71 -72 -280 -73 -73 -78 Gross operating income 116 116 116 123 470 119 122 120 Net cost of risk 0 0 0 0 0 0 0 0 Operating income 116 116 116 123 470 119 122 120 Net income from other assets 0 0 0 0 0 0 0 0 Net income from companies accounted for by the equity
method 0 0 0 0 0 0 0 0
Impairment losses on goodwill 0 0 0 0 0 0 0 0 Income tax -37 -37 -37 -39 -150 -38 -39 -38 Net income 79 79 79 84 320 81 83 82 O.w. non controlling interests 0 0 0 1 2 0 1 0 Group net income 78 78 78 83 318 81 82 82 Average allocated capital 1,455 1,491 1,502 1,517 1,491 1,529 1,533 1,587 o.w. Financial Services to Corporates Net banking income 297 314 332 348 1,292 334 351 348 Operating expenses -166 -168 -167 -175 -676 -172 -179 -179 Gross operating income 131 146 166 173 616 162 172 169 Net cost of risk -24 -25 -28 -26 -103 -21 -20 -23 Operating income 107 121 138 147 513 141 152 146 Net income from other assets 0 -1 0 0 -1 0 0 0 Net income from companies accounted for by the equity
method 6 5 3 10 25 5 6 10
Impairment losses on goodwill 0 0 0 0 0 0 0 0 Income tax -34 -38 -44 -46 -161 -44 -49 -46 Net income 80 87 98 112 376 102 109 110 O.w. non controlling interests 1 1 1 1 5 2 0 2 Group net income 78 86 96 111 371 100 109 108 Average allocated capital 2,157 2,149 2,122 2,096 2,131 1,928 1,866 1,935
o.w. other Net banking income -26 -20 -27 -43 -116 -40 -33 -37 Operating expenses -11 -12 -4 -4 -31 -7 1 -3 Gross operating income -37 -32 -31 -47 -147 -47 -32 -40 Net cost of risk -5 -6 1 19 8 10 -1 0 Operating income -42 -38 -30 -28 -139 -37 -33 -40 Net income from other assets 0 0 0 0 0 0 0 0 Net income from companies accounted for by the equity
method 0 -1 0 -2 -3 -1 1 -1
Impairment losses on goodwill 0 0 0 0 0 0 0 0 Income tax 15 13 10 10 48 14 13 14 Net income -28 -26 -20 -21 -94 -24 -19 -27 O.w. non controlling interests -3 5 -5 3 0 -2 -2 -2 Group net income -25 -30 -15 -24 -94 -22 -17 -25 Average allocated capital 208 215 214 187 206 146 118 110
28/49

(in millions of euros) Q1 13 Q2 13 Q3 13 Q4 13 2013 Q1 14 Q2 14 Q3 14
Global Banking and Investor Solutions Net banking income 2,266 2,093 2,076 1,947 8,382 2,127 2,295 2,115 Operating expenses -1,469 -1,352 -1,421 -1,831 -6,073 -1,465 -1,568 -1,554 Gross operating income 797 741 655 115 2,308 662 727 561 Net cost of risk -71 -185 -230 -60 -546 -54 28 -27 Operating income 726 556 425 55 1,762 608 755 534 Net income from other assets 5 0 0 -1 4 0 -5 0 Net income from companies accounted for by the
equity method 29 29 20 -110 -32 25 19 28
Impairment losses on goodwill 0 0 0 -50 -50 0 0 0 Income tax -189 -124 -74 -76 -462 -149 -180 -112 Net income 571 461 371 -181 1,222 484 589 450 O.w. non controlling interests 4 5 4 3 16 3 4 5 Group net income 567 456 366 -184 1,206 481 585 445 Average allocated capital 15,598 15,797 14,356 13,214 14,742 12,440 12,772 13,326
o.w. Global Markets Net banking income 1,373 1,241 1,200 1,055 4,868 1,243 1,215 1,050 o.w. Equities 629 621 621 646 2,519 688 538 465 o.w. FICC 744 620 578 408 2,350 556 676 585 Operating expenses -808 -703 -783 -1,081 -3,374 -799 -743 -703 Gross operating income 565 539 417 -27 1,494 444 472 347 Net cost of risk -31 -133 -151 -65 -381 -10 6 -23 Operating income 534 405 266 -92 1,113 434 478 324 Net income from other assets 0 0 0 0 0 1 -1 0 Net income from companies accounted for by the
equity method 0 0 0 1 1 0 0 0
Impairment losses on goodwill 0 0 0 0 0 0 0 0 Income tax -153 -104 -55 -90 -401 -116 -126 -77 Net income 381 302 211 -181 713 319 351 247 O.w. non controlling interests 4 3 4 2 13 3 2 3 Group net income 378 298 206 -182 700 316 349 244 Average allocated capital 10,280 10,017 8,717 7,662 9,169 7,149 7,262 7,000
o.w. Financing and Advisory Net banking income 475 402 443 477 1,797 455 532 509 Operating expenses -308 -277 -286 -345 -1,216 -304 -307 -323 Gross operating income 167 125 156 132 581 151 225 186 Net cost of risk -43 -47 -61 13 -138 -43 24 -4 Operating income 124 78 96 145 443 108 249 182 Net income from other assets 3 0 0 0 3 0 -8 -1 Net income from companies accounted for by the
equity method 0 0 0 0 0 0 -1 1
Impairment losses on goodwill 0 0 0 0 0 0 0 0 Income tax -19 -1 -4 10 -14 -14 -48 -29 Net income 109 77 92 155 432 94 192 153 O.w. non controlling interests 0 1 0 1 2 1 -1 2 Group net income 109 76 92 154 430 93 193 151 Average allocated capital 3,460 3,531 3,435 3,272 3,425 3,480 3,727 4,061
o.w. Securities Services and Brokerage Net banking income 155 177 153 159 644 168 290 283 Operating expenses -148 -155 -151 -187 -641 -158 -314 -306 Gross operating income 7 22 2 -28 3 10 -24 -23 Net cost of risk -1 0 0 0 0 0 -1 2 Operating income 6 23 2 -28 3 10 -25 -21 Net income from other assets 1 0 0 0 1 -1 1 0 Net income from companies accounted for by the
equity method 0 -1 -3 -144 -148 -2 0 0
Impairment losses on goodwill 0 0 0 -50 -50 0 0 0 Income tax -3 -8 -1 11 0 -5 11 8 Net income 5 13 -2 -211 -194 2 -13 -13 O.w. non controlling interests 0 0 0 0 1 -2 3 0 Group net income 5 13 -2 -211 -195 4 -16 -13 Average allocated capital 836 1,244 1,199 1,275 1,139 781 733 1,268
o.w. Asset & Wealth Management Net banking income 264 272 281 255 1,072 261 258 273 o.w. Lyxor 50 38 47 52 186 48 50 49 o.w. Private banking 205 231 227 195 858 207 201 219 o.w. other 8 4 7 8 28 6 7 5 Operating expenses -206 -217 -201 -218 -842 -204 -204 -222 Gross operating income 58 55 79 38 230 57 54 51 Net cost of risk 4 -5 -19 -7 -27 -1 -1 -2 Operating income 62 50 61 30 203 56 53 49 Net income from other assets 0 0 0 0 0 0 3 1 Net income from companies accounted for by the
equity method 28 30 23 33 114 27 20 27
Impairment losses on goodwill 0 0 0 0 0 0 0 0 Income tax -14 -11 -14 -8 -47 -14 -17 -14 Net income 76 69 70 56 271 69 59 63 O.w. non controlling interests 0 0 0 0 0 1 0 0 Group net income 76 69 70 56 271 68 59 63 Average allocated capital 1,023 1,005 1,006 1,004 1,009 1,029 1,050 998
29/49
(in millions of euros) Q1 13 Q2 13 Q3 13 Q4 13 2013 Q1 14 Q2 14 Q3 14
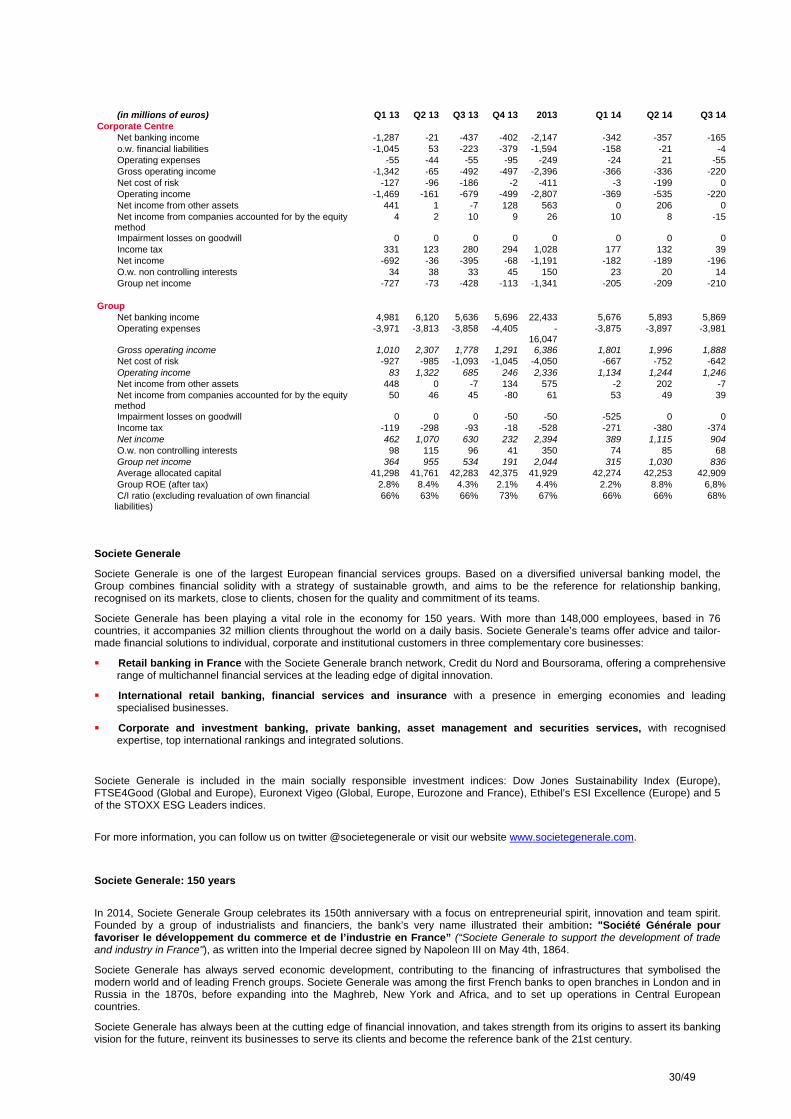
Corporate Centre Net banking income -1,287 -21 -437 -402 -2,147 -342 -357 -165 o.w. financial liabilities -1,045 53 -223 -379 -1,594 -158 -21 -4 Operating expenses -55 -44 -55 -95 -249 -24 21 -55 Gross operating income -1,342 -65 -492 -497 -2,396 -366 -336 -220 Net cost of risk -127 -96 -186 -2 -411 -3 -199 0 Operating income -1,469 -161 -679 -499 -2,807 -369 -535 -220 Net income from other assets 441 1 -7 128 563 0 206 0 Net income from companies accounted for by the equity
method 4 2 10 9 26 10 8 -15
Impairment losses on goodwill 0 0 0 0 0 0 0 0 Income tax 331 123 280 294 1,028 177 132 39 Net income -692 -36 -395 -68 -1,191 -182 -189 -196 O.w. non controlling interests 34 38 33 45 150 23 20 14 Group net income -727 -73 -428 -113 -1,341 -205 -209 -210
Group Net banking income 4,981 6,120 5,636 5,696 22,433 5,676 5,893 5,869 Operating expenses -3,971 -3,813 -3,858 -4,405 -
16,047 -3,875 -3,897 -3,981
Gross operating income 1,010 2,307 1,778 1,291 6,386 1,801 1,996 1,888 Net cost of risk -927 -985 -1,093 -1,045 -4,050 -667 -752 -642 Operating income 83 1,322 685 246 2,336 1,134 1,244 1,246 Net income from other assets 448 0 -7 134 575 -2 202 -7 Net income from companies accounted for by the equity
method 50 46 45 -80 61 53 49 39
Impairment losses on goodwill 0 0 0 -50 -50 -525 0 0 Income tax -119 -298 -93 -18 -528 -271 -380 -374 Net income 462 1,070 630 232 2,394 389 1,115 904 O.w. non controlling interests 98 115 96 41 350 74 85 68 Group net income 364 955 534 191 2,044 315 1,030 836 Average allocated capital 41,298 41,761 42,283 42,375 41,929 42,274 42,253 42,909 Group ROE (after tax) 2.8% 8.4% 4.3% 2.1% 4.4% 2.2% 8.8% 6,8% C/I ratio (excluding revaluation of own financial
liabilities) 66% 63% 66% 73% 67% 66% 66% 68%
Societe Generale
Societe Generale is one of the largest European financial services groups. Based on a diversified universal banking model, the Group combines financial solidity with a strategy of sustainable growth, and aims to be the reference for relationship banking, recognised on its markets, close to clients, chosen for the quality and commitment of its teams.
Societe Generale has been playing a vital role in the economy for 150 years. With more than 148,000 employees, based in 76 countries, it accompanies 32 million clients throughout the world on a daily basis. Societe Generale’s teams offer advice and tailor-made financial solutions to individual, corporate and institutional customers in three complementary core businesses:
Retail banking in France with the Societe Generale branch network, Credit du Nord and Boursorama, offering a comprehensive range of multichannel financial services at the leading edge of digital innovation.
International retail banking, financial services and insurance with a presence in emerging economies and leading specialised businesses.
Corporate and investment banking, private banking, asset management and securities services, with recognised expertise, top international rankings and integrated solutions.
Societe Generale is included in the main socially responsible investment indices: Dow Jones Sustainability Index (Europe), FTSE4Good (Global and Europe), Euronext Vigeo (Global, Europe, Eurozone and France), Ethibel’s ESI Excellence (Europe) and 5 of the STOXX ESG Leaders indices.
For more information, you can follow us on twitter @societegenerale or visit our website www.societegenerale.com. Societe Generale: 150 years
In 2014, Societe Generale Group celebrates its 150th anniversary with a focus on entrepreneurial spirit, innovation and team spirit. Founded by a group of industrialists and financiers, the bank’s very name illustrated their ambition: "Société Générale pour favoriser le développement du commerce et de l’industrie en France” (“Societe Generale to support the development of trade and industry in France"), as written into the Imperial decree signed by Napoleon III on May 4th, 1864.
Societe Generale has always served economic development, contributing to the financing of infrastructures that symbolised the modern world and of leading French groups. Societe Generale was among the first French banks to open branches in London and in Russia in the 1870s, before expanding into the Maghreb, New York and Africa, and to set up operations in Central European countries.
Societe Generale has always been at the cutting edge of financial innovation, and takes strength from its origins to assert its banking vision for the future, reinvent its businesses to serve its clients and become the reference bank of the 21st century.
30/49

2.2 Financial policy
2.2.1 Group debt policy
FINANCING STRUCTURE:
54 58
8 9
138 121
49 54
87 95
334 340
DUE TO CUSTOMERS
DUE TO BANKS
FINANCIAL LIABILITIES AT FAIR
VALUE THROUGH PROFIT OR LOSS
- STRUCTURED DEBT(1)
SUBORDINATED DEBT
TOTAL EQUITY (INCL. TSS and TSDI)
(1) o.w. : debt securities issued reported in the trading book and debt securities issued measuredusing fair value option through P&L. Outstanding unsecured debt securitieswithmaturity exceeding one year EUR 37bn at end-2013 and EUR 35bn at end-September 2014
(2) o.w. SGSCF: EUR 8.3bn; SGSFH: EUR 8.7bn; CRH: EUR 6.7bn, securitisation: EUR 4.2bn, conduits: EUR 8.7bn at end-September 2014
(and SGSCF: EUR 8.5bn; SGSFH: EUR 7.9bn; CRH: EUR 7.3bn, securitisation: EUR 2.4bn, conduits: EUR 6.7bn at end 2013)Outstanding amounts with maturity exceeding one year (unsecured): EUR 40bn at end-2013 and EUR 31bn at end-September 2014
(3) TSS, TSDI: deeply subordinated notes, perpetual subordinated notes
DEBT SECURITIES ISSUED(2)
(2)(2)
o.w. TSS TSDI(3): EUR 9bno.w . TSS TSDI(3): EUR 7bn
31 DECEMBER 2013* 30 SEPTEMBER 2014
o.w. Securities sold to
customers under repurchase
agreements: EUR 20bn o.w . Securities sold to
customers under repurchase
agreements: EUR 17bn
o.w. Securities sold to banks
under repurchase
agreements: EUR 23bn
o.w. Securities sold to banks
under repurchase
agreements: EUR 30bn
* Restated further to the coming into force of IFRS 10 and 11 as
from 1st Jan. 2014
(1) (1)
31/49

GROUP OUTSTANDING LONG-TERM SECURITIES
13%
33%
8%
16%
16%
14%
Subordinated debt
Structured private placements
Vanilla private placements + CD/CP > 1 an
Senior unsecured public issues
Secured issuances (i.e. CB, CRH, SFEF)
Subsidiaries (yc vanilla unsecured, structured unsecured, secured)
EUR 135bn EUR 146bn
(1) Including subordinated debts in equity
(2) Including Covered Bonds and CRH
(3) Including secured and unsecured issuance
(4) Including perpetual subordinated debt issuance, recognised in equity ...........
(5) This chart does not include the Group’s short-term issuance amounting to EUR 48bn at September 30, 2014
32/49

3 - Chapter 3 : Corporate Governance
3.1 General Management
(Composition as from September 1, 2014)
Frédéric Oudéa, Chairman and Chief Executive Officer
Séverin Cabannes, Deputy Chief Executive Officer, more specifically in charge of: Finance, Risks, Resources, Global Banking & Investor Solutions.
Bernardo Sanchez Incera, Deputy Chief Executive Officer, more specifically in charge of the entire French Retail Banking operation, the supervision of International Retail Banking & Financial Services.
Frédéric Oudéa, Bernardo Sanchez Incera and Séverin Cabannes are executive officers within the meaning of banking regulations.
3.2 Executive Commitee
(Composition as from September 1, 2014)
Frédéric OUDÉA Chairman and Chief Executive Officer
Séverin CABANNES Deputy Chief Executive Officer
Bernardo SANCHEZ INCERA Deputy Chief Executive Officer
Laurent GOUTARD Group Head of Societe Generale French retail Banking
Caroline GUILLAUMIN Head of Group Communication
Didier HAUGUEL Co-Head of International Banking and Financial Services
Philippe HEIM Group Chief Financial Officer
Edouard-Malo HENRY Group Head of Human Resources
33/49
Françoise MERCADAL-DELASALLES Group Head of Corporate Resources and Innovation
Benoît OTTENWAELTER Group Chief Risk Officer
Jean-Luc PARER Co-Head of International Banking and Financial Services
Patrick SUET Corporate Secretary and Group Chief Compliance Officer
Didier VALET Head of Corporate & Investment Banking, Private Banking, Asset Management, Securities Services
34/49

4 - Chapter 4 : Risks and capital adequacy
4.1 Regulatory ratios
4.1.1 Prudential ratio management – Update of the 2014 registration document page 143-144
During T3 2014, Societe Generale issued EUR 1.0 billion of Tier 2 capital on September 16, 2014.
35/49

4.1.2 RISK- WEIGHTED ASSETS* (CRR/CRD4, in EUR bn) – Update of the 2014 registration document page 125
284.5 281.5 285.8
24.2 25.4 23.9
39.8 43.7 43.4
348.5 350.7 353.1
89.3 90.6 88.5
102.0 98.2 99.0
79.4 80.386.0
13.8 12.5 12.3
0.2 0.3 0.2
0.00.1 0.0
23.3 24.022.7
0.7 1.0 1.0
3.34.4
4.1
5.66.4 6.4
27.728.6
28.6
3.2 4.3 4.3
92.8 95.3 92.7 107.6 104.7 105.4 130.4 132.9 137.3 17.8 17.9 17.6
OPERATIONAL
CREDIT
MARKET
TOTAL
International RetailBanking and Financial
Services
French RetailBanking
Group
* Includes the entities reported under IFRS 5 until disposal
Global Banking and Investor Solutions
Corporate centre
Q2 14 Q3 14Q3 13 Q2 14 Q3 14Q3 13 Q2 14 Q3 14Q3 13 Q2 14 Q3 14Q3 13 Q2 14 Q3 14Q3 13
36/49

4.1.3 Reconciliation of book and prudential capital and CRR / CRD4 – Update of the 2014 registration document page 145
30 June 14 30 Sept.14
In EUR bn
Shareholder equity group share 53.3 55.0
Deeply subordinated notes* (8.7) (9.2)
Undated subordinated notes* (0.4) (0.4)
Dividend to be paid & interest on subordinated notes (0.7) (1.0)
Goodwill and intangibles (6.6) (6.6)
Non controlling interests 2.5 2.6
Deductions and other prudential adjustments** (3.7) (3.7)
Common Equity Tier 1 capital 35.7 36.7
Additional Tier 1 capital 8.0 9.2
Tier 1 capital 43.7 45.9
Tier 2 capital 5.4 5.6
Total Capital (Tier 1 and Tier 2) 49.1 51.5
RWA 350.7 353.1
Common Equity Tier 1 ratio 10.2% 10.4%
Tier 1 ratio 12.5% 13.0%
Total Capital ratio 14.0% 14.6%
Financial conglomerate ratio >100%
37/49

4.1.4 CRR LEVERAGE RATIO
CRR Leverage ratio(1)
(1) Fully loaded proforma based on CRR rules as published on 26th June 2013* Securities financing transactions : repos, reverse repos, securities lending and borrowing and other similar transactions
The figures reported above do not reflect new rules published by the Basel committee in January 2014. These new rules have no significant impact on the ratio
In EUR bn
Tier 1 45,9
Total prudential Balance sheet(1) 1,194
Adjustement related to derivatives exposures (41)
Adjustement related to securities financing transactions * (21)
Off-balance sheet (loan and guarantee commitments) 81
Technical and prudential adjustments (Tier 1 capital prudential deductions) (11)
Leverage exposure 1,202
CRR leverage ratio 3.8%
30 Sept.14
4.2 Provisioning of doubtful loans - Update of the 2014 registration document page 160
In EUR bn 31/03/2014 30/06/2014 30/09/2014
Gross book outstandings* 415.4 429.4 431.8
Doubtful loans* 24.9 25.2 24.8
Gross non performing loans ratio*
(Doubtful loans / Gross book outstandings)
6.0% 5.9% 5.7%
Specific provisions* 13.5 13.8 13.7
Portfolio-based provisions* 1.3 1.2 1.2
Gross doubtful loans coverage ratio*
(Overall provisions / Doubtful loans)59% 60% 60%
Legacy Assets Gross book outstandings 5.2 5.2 5.4
Doutful loans 3.0 3.0 3.2
Non performing loan ratio 57% 58% 60%
Specific provisions 2.5 2.5 2.7
Gross doubtful loans coverage ratio 84% 84% 84%
* Excluding Legacy Assets. Customer loans, deposits at banks and loans due from banks leasing and lease assets.
38/49

4.3 Change in trading VaR - Update of the 2014 registration document page 177
Quarterly average 99% Value at Risk (VaR), a composite indicator used for the day-to-day monitoring of the market risks incurred by the bank, on the scope of its trading activities, in millions of euros:
CHANGE IN TRADING VAR*
-22-15 -16 -18 -20 -23 -25 -21 -19
2 2 2 3 3 4 2 2 26 3 3 3 3 3 2 2 2
1213 12 14 11 11
10 9 7
16 16 1517 17
2323
17 18
10 117
7 8
13 19
1611
2330
23 25 22
31 31
2420
Q3 12 Q4 12 Q1 13 Q2 13 Q3 13 Q4 13 Q1 14 Q2 14 Q3 14
CREDIT
EQUITY
FOREX
COMMODITIES
COMPENSATION EFFECT
Trading VaR*
INTEREST RATES
Quarterly average of 1-day, 99% Trading VaR* (in EUR m)
* Trading VaR: measurement over one year (i.e. 260 scenarii) of the greatest risk obtained after elimination of 1% of the most unfavourable occurrences. A reallocation of some Fixed Income and Forex products was implemented in Q3 12 in the VaR breakdown by risk factor, with restatement of the historical
data. This reallocation doest not represent a change in the VaR model, and has no impact on the Group’s overall Trading VaR level
39/49
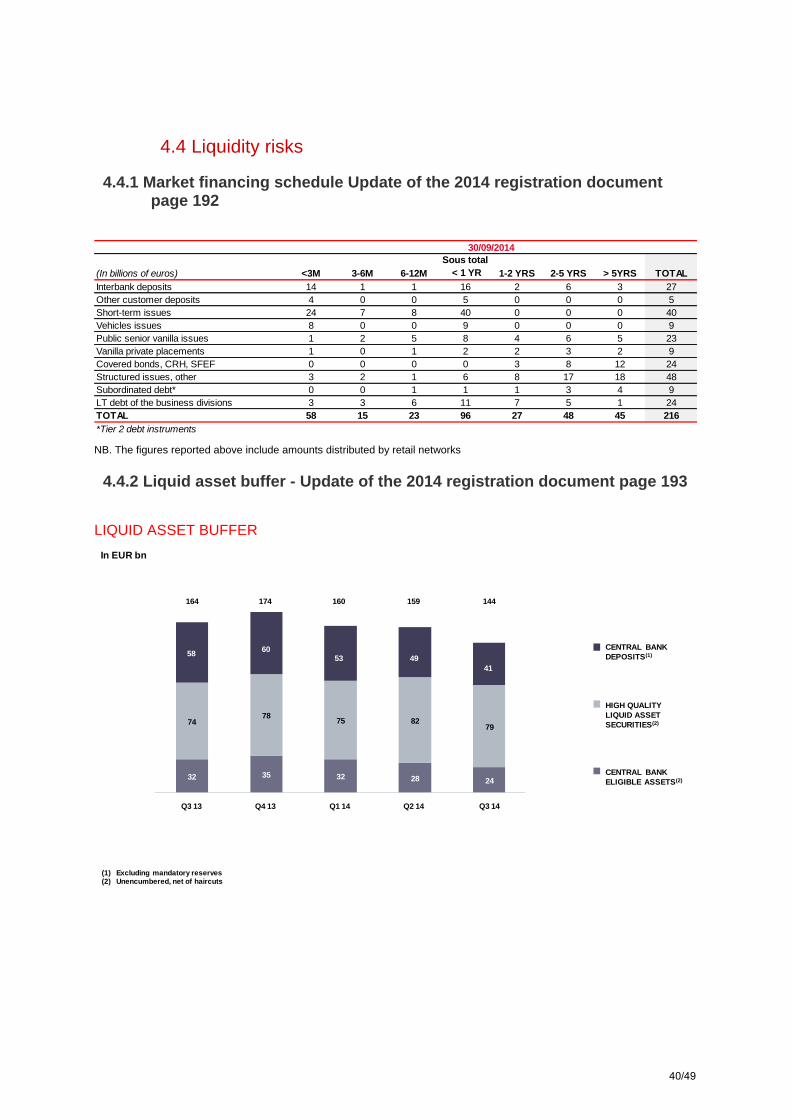
4.4 Liquidity risks
4.4.1 Market financing schedule Update of the 2014 registration document page 192
(In billions of euros) <3M 3-6M 6-12M
Sous total
< 1 YR 1-2 YRS 2-5 YRS > 5YRS TOTAL
Interbank deposits 14 1 1 16 2 6 3 27
Other customer deposits 4 0 0 5 0 0 0 5
Short-term issues 24 7 8 40 0 0 0 40
Vehicles issues 8 0 0 9 0 0 0 9
Public senior vanilla issues 1 2 5 8 4 6 5 23
Vanilla private placements 1 0 1 2 2 3 2 9
Covered bonds, CRH, SFEF 0 0 0 0 3 8 12 24
Structured issues, other 3 2 1 6 8 17 18 48
Subordinated debt* 0 0 1 1 1 3 4 9
LT debt of the business divisions 3 3 6 11 7 5 1 24
TOTAL 58 15 23 96 27 48 45 216
*Tier 2 debt instruments
30/09/2014
NB. The figures reported above include amounts distributed by retail networks
4.4.2 Liquid asset buffer - Update of the 2014 registration document page 193
LIQUID ASSET BUFFER
In EUR bn
32 35 32 28 24
7478
75 8279
5860
53 49
41
164 174 160 159 144
HIGH QUALITY
LIQUID ASSET
SECURITIES(2)
CENTRAL BANK
ELIGIBLE ASSETS(2)
CENTRAL BANK
DEPOSITS(1)
(1) Excluding mandatory reserves(2) Unencumbered, net of haircuts
Q3 14Q3 13 Q4 13 Q1 14 Q2 14
40/49

4.5 Legal risks
SG Private Bank (Suisse), S.A., along with several other financial institutions, has been named as a defendant in a putative class action that is pending in the US District Court for the Northern District of Texas. Plaintiffs seek to represent a class of individuals who were customers of Stanford International Bank Ltd. (“SIBL”), with money on deposit at SIBL and/or holding Certificates of Deposit issued by SIBL as of 16 February 2009. Plaintiffs allege that they suffered losses as a result of fraudulent activity at SIBL and the Stanford Financial Group or related entities, and that the defendants bear some responsibility for those alleged losses. Plaintiffs further seek to recoup payments made through or to the defendants on behalf of SIBL or related entities on the basis that they are alleged to have been fraudulent transfers. Societe Generale’s motion to dismiss these claims on grounds of lack of jurisdiction was denied by the court by order filed June 5, 2014. Societe Generale’s motion for reconsideration of this decision was denied on September 8, 2014. Motions to dismiss these claims on substantive grounds remain pending.
41/49

5 - Chapter 8 : Person responsible for updating the Registration Document
5.1 Person responsible for updating the Registration Document
Mr Fréderic OUDEA, Chairman and Chief Executive Officer of Societe GENERALE
5.2 Statement of the person responsible for updating the Registration Document
I hereby certify, having taken all reasonable measures to this effect and to the best of my knowledge, that the information contained in the present update of the 2014 Registration Document is in accordance with the facts and that it makes no omission likely to affect its import.
I have received a completion letter from the Statutory Auditors, stating that they have verified the information contained in the present update about the Group's financial position and accounts and that they have read the 2014 Registration Document, its updates A-01, A-02 and the present update in their entirety.
The historical financial data presented in the 2014 Registration Document has been discussed in the Statutory Auditors’ reports found on pages 376 to 377 and 434 to 435 and those enclosed for reference for the financial years 2011 and 2012, found respectively on pages 363 to 364 and 426 to 427 of the 2012 Registration Document and on pages 385 to 386 and 446 to 447 of the 2013 Registration Document. The Statutory Auditors’ reports on the 2013 consolidated financial statements and on the 2012 parent company financial statements contain observations. The Statutory Auditors’ report on the condensed interim consolidated financial statements dated June 30, 2014, and the one on the condensed interim consolidated financial statements dated June 30, 2013 contain observations.
Paris, November 6th, 2014
Mr. Frédéric OUDEA
Chairman and Chief Executive Officer of Societe Generale
42/49
5.3 Persons responsible for the audit of the financial statements
STATUTORY AUDITORS Name : Société Ernst & Young et Autres
represented by Mme Isabelle Santenac Adress : 1/2, place des Saisons
92400 Courbevoie – Paris-La Défense 1 Date of appointment: May 22, 2012 Term of mandate: 6 fiscal years End of current mandate: at the close of the Ordinary General Meeting which will approve the financial statements for the year ended December 31, 2017. Name : Société Deloitte et Associés
represented by M. Jean-Marc Mickeler Address : 185, avenue Charles de Gaulle
92524 Neuilly-sur-Seine Cedex Date of first appointment: April 18, 2003 Date of renewal: May 22, 2012 Term of mandate: 6 fiscal years End of current mandate: at the close of the Ordinary General Meeting which will approve the financial statements for the year ended December 31, 2017. SUBSTITUTE STATUTORY AUDITORS Name : Société Picarle et Associés Address : 1/2, place des Saisons
92400 Courbevoie – Paris-La Défense 1 Date of appointment: May 22, 2012 Term of mandate: 6 fiscal years Name : Société BEAS Address : 7-9 Villa Houssay
92200 Neuilly-sur-Seine Date of appointment: May 22, 2012 Term of mandate: 6 fiscal years Ernst & Young et Autres and Deloitte et Associés are registered as Statuory Aurditors with the Compagnie régionale des Commissaires aux comptes de Versailles.
43/49

6 - Chapter 9 : Cross-reference table
6.1 Update to the registration document cross-reference table
Subject
2014 Registration document
First update
Second update
Third
update
1. PERSONS RESPONSIBLE FOR THE REGISTRATION DOCUMENT
464 84
140 42
2. STATUTORY AUDITORS 436; 465 85 141 43
3. SELECTED FINANCIAL INFORMATION
3.1. Selected historical financial information on the issuer for each financial year
Chiffres clés p.5 3
3.2. Selected historical financial information on the issuer for each financial year
NA
13-37
4. RISK FACTORS 56;107-120;124-
213
67-73 ; Annexe 1
66-82 35-41
5. INFORMATION ABOUT THE ISSUER
5.1. History and development of the Company 4 ; 448
5.2. Investments 54 4 46-47
6. BUSINESS OVERVIEW
6.1. Principal activities 5; 46-48 3-5 4-61 5-32
6.2. Principal markets 5-22; 372-375
6.3. Exceptional factors NA
6.4. Dependence of the issuer on patents or licences, industrial, commercial or financial contracts or new manufacturing processes
NA
6.5. The basis for statements made by the issuer regarding its competitive position
Sommaire 31
27 19
7. ORGANISATIONAL STRUCTURE
7.1. Brief description of the Group 5 ; 22-23 12
7.2. List of significant subsidiaries 27-45; 366-
371; 424-433
12 ; 97
8. PROPERTY, PLANT AND EQUIPMENT
8.1. Material tangible fixed assets (existing or planned) 55; 326 43-44
8.2. Environmental issues that may affect the issuer’s utilisation of the tangible fixed assets
216-261
9. OPERATING AND FINANCIAL REVIEW
9.1. Financial condition 49-53 18 ; 41-45
9.2. Operating results 24-45 16-41 13-37 5-30
10. CAPITAL RESOURCES
10.1. Information on the issuer’s capital resources 266-272 89-90 ; 128
10.2. Sources and amounts of the issuer’s cash flow 273 91
10.3. Information on the issuer’s borrowing requirements and funding structure
51-53
44-45 31-32
10.4. Information regarding any restrictions for the use of capital resources that have materially affected, or could materially affect, the issuer’s operations
449
10.5. Information regarding the anticipated sources of funds needed to fulfil commitments referred to in items 5.2.3 and 8.1
52-53; 55
11. RESEARCH AND DEVELOPMENT, PATENTS AND LICENCES NA
12. TREND INFORMATION 57-58
13. PROFIT FORECASTS OR ESTIMATES NA
14. ADMINISTRATIVE, MANAGEMENT AND SUPERVISORY BODIES AND GENERAL MANAGEMENT
14.1. Board of Directors and General Management 60-81 42-43 62-65 33-34
44/49

Rubriques
2014 Registration document
First update
Second update
Third
update
14.2. Administrative bodies’ and General Management’s conflicts of interests
69
15. REMUNERATION AND BENEFITS
15.1. Amount of remuneration paid and benefits in kind 82-104 44-66
15.2. Total amounts set aside or accrued by the issuer to provide pension, retirement or similar benefits
365
16. BOARD PRACTICES
16.1. Date of expiration of the current term of office 61-66
16.2. Members of the administrative bodies’ service contracts with the issuer
NA
16.3. Information about the issuer’s Audit Committee and Remuneration Committee
77-79
16.4. Statement as to whether or not the issuer complies with the corporate governance regime
71
17. EMPLOYEES
17.1. Number of employees 234-
246
17.2. Shareholdings and stock options awarded to directors 61-66 ;
82-104 120
17.3. Arrangements for involving employees in the capital of the issuer 243
128
18. MAJOR SHAREHOLDERS
18.1. Shareholders owning more than 5% of capital or voting rights 444-
445 128
18.2. Different voting rights held by the major shareholders 444-
445 ; 449 128
18.3. Control of the issuer 444-
445
18.4. Arrangements known to the issuer, the operation of which may at a subsequent date result in a change in control of the issuer NA
19. RELATED PARTY TRANSACTIONS
105-106 ; 365 ; 424-
433
20. FINANCIAL INFORMATION CONCERNING THE ASSETS AND LIABILITIES, FINANCIAL POSITION AND PROFITS AND LOSSES OF THE ISSUER
20.1. Historical financial information
266-375 ; 380-433 ;
469
20.2. Pro forma financial information NA 6-15
20.3. Financial statements 266-375 ; 380-
433
20.4. Auditing of historical annual financial information 121-122 ; 376-377 ; 434-435
20.5. Age of latest financial information 266 ;380 83
20.6. Interim financial information NA 16-41 13-37 ; 83-125 5-30
20.7. Dividend policy 438-441 62
20.8. Legal and arbitration proceedings 202-204
20.9. Significant changes in the issuer’s financial or trading position 56
21. ADDITIONAL INFORMATION
21.1. Share capital 442-449 74 128
21.2. Memorandum and by-laws 450-454 74-83 129-137
22. MATERIAL CONTRACTS 55
23. THIRD-PARTY INFORMATION AND STATEMENTS BY EXPERTS AND DECLARATIONS OF ANY INTEREST S NA
24. DOCUMENTS ON DISPLAY 449
25. INFORMATION ON HOLDINGS
22-23 ; 366-371 ; 424-433
45/49

6.2 Cross-reference table of Pillar 3 report
CRD Disclosure Requirements Registration document First Update Second Update Third Update
Scope of consolidation
(a) Name of the consolidating entity; (b) Differences between accounting and prudential
accounting, brief description of the entities that are:
(i) fully consolidated; (ii) proportionally consolidated; (iii) deducted from capital; or (iv) neither consolidated nor deducted;
(c) Practical or legal impediments to the prompt transfer of capital or other commitments of the parent to its subsidiaries;
(d) The aggregate amount of the gap and the names of subsidiaries whose capital falls short of requirements; and
(e) Where applicable, the circumstances of making use of the provisions laid down in Articles 69 and 70.
(a) p. 448 (b) Summary descriptions of subsidiaries: note 46 to the financial statements; Scope changes: Chapter 4, table 1 to 3 (i) and (ii) Chapter 4, section 3, table 1. (iii) deducted companies: insurance companies: chapter 4, section 3, table 6, companies consolidated using the equity method: chapter 4, section 3, table 1 (iv) Other subsidiaries excluded; chapter 4, section 3, table 3 (c) (d) (e) Information not published for confidentiality reasons.
Capital
(a) Summary information regarding the composition of capital. (b) Reconciliation of accounting and prudential capital. (c) The total amount of additional capital. (d) Deductions. (e) Total eligible capital.
All information contained in chapter 4, section 3 of this Registration Document, page 140. (a) Description and tables page 142 and following (b) Table 6 (c) Tables 4 and 5 (d) Tables 6 and 8 (e) Tables 4, 5, 6 and details on Tier 2 issuance available in note 16 to the parent company’s financial statements, page 406;
Section 4.1.1 Prudential ratio management
Section 4.2 : regulatory ratios
Section 4.1 Ratios réglementaires
Securitisation
(a) Description of Group’s securitisation activity. (b) The nature of other risks including liquidity risk inherent in securitised assets. (c) Risks in terms of seniority of tranches held and the re-securitisation processes. (d) Roles of the establishment in the securitisation process. (e) Additional information related to (d). (f) Description of processes in place to monitor credit and market risk. (g) Portfolio hedging principles. (h) Approaches to calculating risk weighted exposure amounts. (i) Type of vehicles used for securitisation (j) Accounting methods (k) Use of rating agencies (l) Description of IAA models (m) Qualitative explanations (n) For both the banking book and the trading book, information by type of exposure:
All required information contained in chapter 4, section 5, p. 161 and following, barring exceptions below: (f) (g) Credit and market risks monitored in accordance with Group rules and procedures (See chapter 4, sections 4 and 6, respectively p. 151 and 174)
(i) total securitisation outstandings (standard and synthetic securitisation) and securitisation for which the Group is the sponsor; (ii) positions held on the balance sheet and off balance sheet commitments (iii) positions held on outstandings awaiting securitisation (iv)securitised facilities subject to the early amortisation treatment (v) securitisations deducted from capital or risk-weighted at 1,250%; (vi) Summary of securitisation activity over past financial year;
(n) (iv) Not applicable.
(o) For both the banking trading activity:
(i) total amount of securitisation held of acquired and related capital needs; (ii) Amount of re-securitisations and classification based on quality of counterparties.
(p) Information on outstandings in arrears
(q) For the trading portfolio, total securitised exposures subject to capital requirements for market risk, broken down by synthetic and standard securitisations by type of exposure.
46/49

CRD Disclosure Requirements Registration document First Update Second Update Third Update Remuneration
The complete remuneration report will be published with the first update of the Registration Document. Information on the Remuneration Committee and general principles governing the link between risk and remuneration are described on pages 79 and 110.
Section 3.2.2 Remuneration policies and practices report
Section 3.3: Remuneration of Group senior Management
Market risk
(a) For each portfolio covered: (i) the characteristics of the models used; (ii) for the capital charges in accordance with points 5a and 5l of Annex V to Directive 2006/49/EC, the methodologies used and the risks measured through the use of an internal model to determine liquidity horizons, the methodologies used to achieve a capital assessment that is consistent with the required soundness standard and the approach used in the valuation of the model; (iii) a description of stress testing; (iv) a description of the approaches used for back-testing and validating models. (b) the review scope of the competent authority. (c) a description of the extent and methodologies for compliance with the requirements set out in Part B of Annex VII to Directive 2006/49/EC. (d) the highest, the lowest and the mean of VaR at close of period, stressed VaR, IRC and CRM. (e) Average liquidity horizon used under an internal model for each sub-portfolio covered, in accordance with points 5a and 5l of Annex V to Directive 2006/49/EC. (f) Comparison between VAR and daily result.
All required information is contained in section 6 of Chapter 4 of this Registration Document, page 174 and following, except where mentioned to the contrary. The following information is not described in this chapter:
- The breakdown by risk factor of capital charges using internal models (the breakdown of VaR by risk factor before netting effect having nevertheless been prodide); - The descriptions
by portfolio of methodologies used for i) internal models, ii) stress tests, and iii) backtesting, insofar as the general principles of these models, which applies to all asset classes and to sub-portfolios, are already covered in a general description.
Integration of trading VaR by risk type. Update of trading VaR. Section4.5
Section 4.6 Change in Trading VaR
Section 4.3 Evolution de la VaR de trading
IRB Approach
Detailed information regarding the IRB approach will be published in March, and included in the first update of the Registration Document. The information summarising the approach related to credit risk are included in Chapter 4 of this Registration Document.
Appendix 1 : Addendum to the pillar 3 included in the registration document published on 4 March 2014 : credit risks
Equity risk
(c) for credit institutions calculating the risk-weighted exposure amounts in accordance with Articles 84 to 89, 8% of weighted exposures for each of the exposure categories pursuant to Article 86. For exposures to retail customers, this requirement applies to each exposure category to which all correlations set out in Annex VII, part 1, points 10 to 13, correspond. For equity exposures, this requirement applies: i) to each approach set out in Annex VII, part 1, points 17 to 26; ii) to exposures to listed equities, to private equity exposures belonging to a sufficiently-diversified portfolio, and to other exposures; iii) to exposures subject to a transitional prudential framework in terms of capital requirements; and iv) to exposures subject to a grandfather clause in terms of capital requirements; d) minimum capital requirements calculated in accordance with Article 75, points b) and c); and e) minimum requirements of capital calculated in accordance with Article 103 to 105, which were published separately.
Information available in Chapter 4 – Other risks – equity risks, p. 205.
47/49

6.3 Cross reference table with the recommendations made by the Enhanced Disclosure Task Force
Recommendation Details Registratio
n document Third Update
Definition of main terms used Glossary of main terms used 477
Definitions included in relevant chapter
Risks and Outlook Key figures 124-125 Types of risks 126 Risk factors 127 Recent developments and outlook 6 ; 57
Regulatory changes and new benchmark Non fully-loaded Basel 3 capital ratio 149 Section 2.1 Ratios Additional capital requirements for SIFIs 150 Leverage ratio 150 ; 6 Section 4.1 4 LCR 193-194 Section 2.1 NSFR 193-194
Risk governance Group corporate governance principles (condensed chart) 60 Chairman’s report on corporate governance 71 Chairman’s report on internal control and risk management 107 Risk management principles (condensed chart) 135 Credit risk 151 Market risk 174 Operational risk 181
Risk culture Organisation and governance of risk management structure 135 The Enterprise Risk Management programme 137
Key figures of business lines Group key figures 5 Description of business lines 9 Risk key figures 124-125 Section 4.1.2
Stress test structure General description 138 Credit stress tests 152 Market risk stress tests 178
Capital requirements Capital requirements by type of risk 147
Reconciliation of accounting and prudential Reconciliation of accounting and prudential balance sheets 141 Data Reconciliation of accounting and prudential capital 145
Change in prudential capital Capital reconciliation chart 52 Table 146 Section 4.1.3
Information on change in prudential capital Qualitative assessment, adding to detailed tables 149
Breakdown of weighted outstandings by
core business
Graphic Additional information in the analyses by type of risk (credit, market,
operational, etc.) 125 Section 4.1.2
Table of RWA by calculation method Group’s RWA 147 Section 4.3
Table of credit risks by Basel portfolio Information published in the first update of the 2014 Registration Document -
Analysis of changes in RWA and capital Credit risk table (summary) 147-148 Needs Market risk table (summary) 147-148 Market risk table (VAR by type of risk and change in capital requirements) 177 ; 180
Back testing Credit risk 156 Market risk 175
Liquidity buffer Qualitative and quantitative assessment 193 Section 4.4.2 Methodology 44
Refinancing Collateralised financing 193 (exc. repurchase agreements and securities lending/borrowing)
48/49

Recommendation Details Registration
document Third Update
Balance sheet by contractual maturities Liabilities and off balance sheet: note 32 to the consolidated financial 350 Statements Balance sheet 195-196
Funding strategy Group’s debt situation, debt policy 52-53 Section 2.2.1 Funding strategy 191-192 Section 4.4.1
Analysis of VAR 175-177 Section 4.3
Principles for modelling market risk Organisation and governance 174 Evaluation methods and risk management 175 VAR and control of VAR 175-177 Stress tests, scenarios and risks 178-179
Credit portfolio structure Key figures 157
Portfolio Structure 157-159
Additional details will be provided in March 2014 and incorporated into the first update of the Registration Document
Impairment policy Note 1 to the Consolidated financial statements 282 Provisions and credit impairment Credit policy 151-153 Quantitative data 159-160
Changes in provisions and impairment Consolidated financial statements, note 23 336
Information on collateral and measures to reduce counterparty risk
Hedging credit risk: guarantees and collateral, credit derivatives, risk-mitigating measures, credit insurance 154-155
Other risks Description: type of risks 126 Management (summary) 135 Operational risks 181 Structural interest rate and exchange rate risks 186 Non-compliance, reputation and legal risk 197 Section4.5 Equity risks 205 Strategic risks 207 Risks relating to underlying activities 207 Risks relating to insurance activities 351 Environmental and social risks 215
Analysis of losses related to operational risk Quantitative data 184 Risks and disputes 202 Section4.5
49/49


![EBA Guidelines on non-performing and forborne exposures · forborne exposures and foreclosed assets. ... ive percent Non-Performing Loan [NPL] ... Central Bank’s (ECB) guidance](https://img.dokumen.tips/doc/110x75/5b3a2b307f8b9a0e628b5327/eba-guidelines-on-non-performing-and-forborne-exposures-forborne-exposures-and.jpg)