Embed Size (px)
Citation preview

THIRD QUARTER
RESULTS 2018
Investor presentation
25/10/2018

Summary
Achievements and Key Figures
Operating and Financial Review
Outlook and Priorities 2018
Appendix
Q3 Results 2018 Panalpina 2

Achievements and
Key Figures
Q3 Results 2018 Panalpina 3

Increased profitability
Accelerated volume growth in Air Freight in Q3
Ocean Freight at break-even in Q2 and Q3
SAP TM implementation on track
Challenging macroeconomic
environment
Controlling net working capital while
implementing SAP TM
370.7
332.7
+8.9%
16.4
24.4+15.5%
Grossprofit
EBIT
16.6
12.4
+5.4%
Financial highlights Achievements Challenges
Profit
673.1
744.4
351.6
371.9
2017
2018
42.0
54.7
30.1
28.5
2017
2018
29.9
36.1
18.5
14.9
2017
2018
Note: Group figures in CHF million / % YTD 4

Operating and
Financial Review
Q3 Results 2018 Panalpina 5

Year-on-year bridge
Q3YTD 2017 FX impact (1) M&A (2) Organic (3)Q3YTD 2018
excl. IFRS 16IFRS 16 (4) Q3YTD 2018
Gross profit 1,024.8 19.9 13.1 35.1 1,092.9 23.3 1,116.2
Personnel expenses (651.1) (13.0) (8.3) (17.9) (690.4) (690.4)
Other operating expenses (269.8) (2.8) (3.2) (11.5) (287.3) 69.9 (217.4)
EBITDA 103.9 4.1 1.6 5.7 115.3 93.2 208.5
Depreciation of property, plant and equipment (15.7) (2.3) (0.1) 1.7 (16.3) (16.3)
Depreciation of right of use assets 0.0 (91.2) (91.2)
Amortization of intangible assets (16.2) 0.1 (2.5) 0.8 (17.8) (17.8)
EBIT 72.1 1.9 (1.0) 8.2 81.2 2.0 83.2
Finance income and costs (0.2) (5.1) (5.3) (5.2) (10.4)
EBT 71.9 (3.2) (1.0) 8.2 75.9 (3.1) 72.8
1) FX impact equally impacted the products on bottom line
2) M&A activity mostly impacting Air product
3) CHF 9.1m PEX cost increase related to investment into sales force
4) IFRS 16 detailed impact per product explained in the appendix
6

Air Freight: Accelerated volume growth in Q3
• YTD 4% volume growth
• YTD GP/ton of CHF 705 (excl. IFRS 16: CHF 674)
• YTD conversion ratio stable at 15%
• For IFRS 16 impact, see appendix
Air
Fre
igh
t249 274 241 249 263
648 670 739 711 668450
550
650
750
850
950
1050
1150
100
150
200
250
Q3 2017 Q4 2017 Q1 2018 Q2 2018 Q3 2018
Tonnage, GP/TON
Tons ('000) GP/Ton (in CHF)
30 41 27 27 27
18.8 22.3 15.1 15.0 15.35
15
25
35
45
0
10
20
30
40
50
Q3 2017 Q4 2017 Q1 2018 Q2 2018 Q3 2018
EBIT and EBIT/GP Margin
EBIT EBIT/GP margin (%)
YoY Growth, % Q3 Q4 Q1 Q2 Q3
Volume (market,
estimated)10% 11% 5% 4% 4%
Volume (Panalpina) 9% 8% 3% 4% 6%
GP/ton -1% 19% 19% 14% 3%
Gross Profit 8% 29% 23% 18% 9%
20182017
2017 2018
Gross Profit, EBIT YTD YTD
Gross Profit 456.0 530.1 16%
EBIT 69.4 80.2 15%
EBIT/GP (%) 15.2% 15.1%
Volumes (tons '000) 722.0 752.0 4%
7
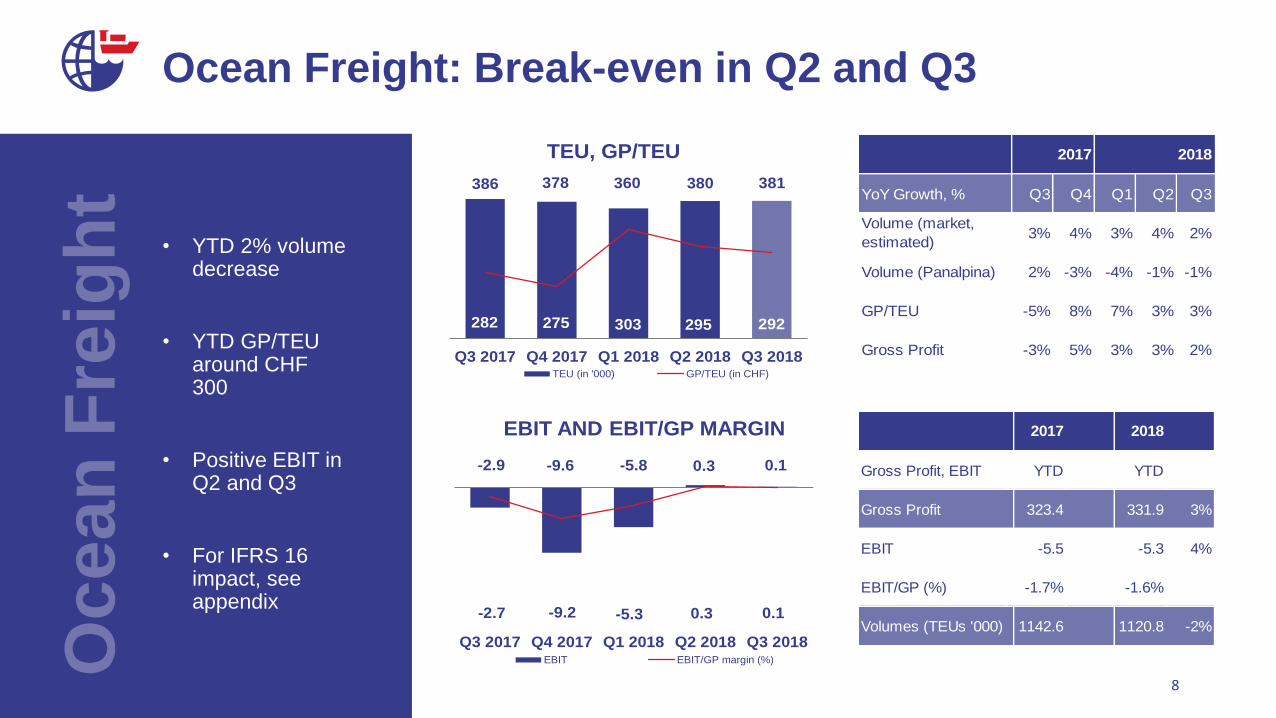
Ocean Freight: Break-even in Q2 and Q3
• YTD 2% volume decrease
• YTD GP/TEU around CHF 300
• Positive EBIT in Q2 and Q3
• For IFRS 16 impact, see appendix
Oc
ea
n F
reig
ht 386 378 360 380 381
282 275 303 295 292
Q3 2017 Q4 2017 Q1 2018 Q2 2018 Q3 2018
TEU, GP/TEU
TEU (in '000) GP/TEU (in CHF)
-2.9 -9.6 -5.8 0.3 0.1
-2.7 -9.2 -5.3 0.3 0.1
Q3 2017 Q4 2017 Q1 2018 Q2 2018 Q3 2018
EBIT AND EBIT/GP MARGIN
EBIT EBIT/GP margin (%)
YoY Growth, % Q3 Q4 Q1 Q2 Q3
Volume (market,
estimated)3% 4% 3% 4% 2%
Volume (Panalpina) 2% -3% -4% -1% -1%
GP/TEU -5% 8% 7% 3% 3%
Gross Profit -3% 5% 3% 3% 2%
20182017
2017 2018
Gross Profit, EBIT YTD YTD
Gross Profit 323.4 331.9 3%
EBIT -5.5 -5.3 4%
EBIT/GP (%) -1.7% -1.6%
Volumes (TEUs '000) 1142.6 1120.8 -2%
8

Logistics: Continued positive EBITL
og
isti
cs • Steady gross
profit and continued positive EBIT
• Ramp-up costs for new business affected EBIT in Q3
• For IFRS 16 impact, see appendix
YoY Growth, % Q3 Q4 Q1 Q2 Q3
Gross Profit -14% -7% 2% 4% 5%
20182017
2017 2018
Gross Profit, EBIT YTD YTD
Gross Profit 245.4 254.2 4%
EBIT 8.1 8.3 2%
EBIT in % of NFR 2.0% 2.1%
81 86 84 85 85
Q3 2017 Q4 2017 Q1 2018 Q2 2018 Q3 2018
Gross profit
2.7 -0.1 3.4 3.4 1.6
Q3 2017 Q4 2017 Q1 2018 Q2 2018 Q3 2018
EBIT
9
Outlook and Priorities 2018
Q3 Results 2018 Panalpina 10

Outlook and Priorities 2018
Market
• International tensions and macroeconomic uncertainties add complexity
• Solid air freight peak season expected, but not as strong as 2017
• Fairly strong ocean freight flows into USA expected, but otherwise moderate growth globally
Panalpina
• Air Freight is expected to grow at or above market, Ocean Freight below market
• Peak season execution
• Push ahead implementation of SAP TM
• Focus on topline growth and unit profitability
• Improve EBIT in ocean freight
• Accelerate growth through selected bolt-on acquisitions
Outlook Priorities
11

Ne
xt
ev
en
tsFull-year Results
February 28, 2019
12

Investing in the shares of Panalpina World Transport (Holding) Ltd involves risks. Prospective investors are strongly requested to
consult their investment advisors and tax advisors prior to investing in shares of Panalpina World Transport (Holding) Ltd.
This document contains forward-looking statements which involve risks and uncertainties. These statements may be identified
by such words as “may”, “plans”, “expects”, “believes” and similar expressions, or by their context. These statements are made
on the basis of current knowledge and assumptions. Various factors could cause actual future results, performance or events to
differ materially from those described in these statements. No obligation is assumed to update any forward-looking statements.
Potential risks and uncertainties include such factors as general economic conditions, foreign exchange fluctuations, competitive
product and pricing pressures and regulatory developments.
The information contained in this document has not been independently verified and no representation or warranty, express or
implied, is made to, and no reliance should be placed on, the fairness, accuracy, completeness or correctness of the information
or opinions contained herein. The information in this presentation is subject to change without notice, it may be incomplete or
condensed, and it may not contain all material information concerning the Panalpina Group. None of Panalpina World Transport
(Holding) Ltd or their respective affiliates shall have any liability whatsoever for any loss whatsoever arising from any use of this
document, or its content, or otherwise arising in connection with this document.
This document does not constitute, or form part of, an offer to sell or a solicitation of an offer to purchase any shares and neither
it nor any part of it shall form the basis of, or be relied upon in connection with, any contract or commitment whatsoever. This
information does neither constitute an offer to buy shares of Panalpina World Transport (Holding) Ltd nor a prospectus within the
meaning of the applicable Swiss law.Dis
cla
ime
r
13

Appendix
Q3 Results 2018 Panalpina 14

Income Statement Per Quarter – Group
Note: Group figures in CHF million
Group Q1 2017 Q2 2017 Q3 2017Q3YTD
2017Q4 2017 FY 2017 Q1 2018 Q2 2018 Q3 2018
Q3YTD
2018
IFRS 16
impact
Q3YTD
2018 like-
for-like
Net forwarding revenue 1,277.2 1,354.9 1,433.4 4,065.5 1,467.3 5,532.8 1,414.3 1,502.2 1,526.0 4,442.5 4,442.5
Forwarding expenses (944.5) (1,014.5) (1,081.8) (3,040.7) (1,094.2) (4,135.0) (1,043.6) (1,128.5) (1,154.1) (3,326.3) (23.3) (3,349.6)
Gross profit 332.7 340.4 351.6 1,024.8 373.0 1,397.8 370.7 373.7 371.9 1,116.2 (23.3) 1,092.9
Personnel expenses (216.4) (216.2) (218.6) (651.1) (238.8) (889.8) (230.0) (231.5) (228.9) (690.4) (690.4)
Other operating expenses (89.3) (88.0) (92.5) (269.8) (91.9) (361.8) (76.3) (69.3) (71.8) (217.4) (69.9) (287.3)
EBITDA 27.1 36.2 40.6 103.9 42.3 146.2 64.4 72.9 71.3 208.5 (93.2) 115.3
Depreciation of PPE (5.3) (5.4) (5.0) (15.6) (5.6) (21.3) (5.0) (5.6) (5.8) (16.3) (16.3)
Depreciation of ROU assets (29.0) (31.2) (31.1) (91.2) 91.2 (0.0)
Amortization of intangibles (5.4) (5.2) (5.5) (16.2) (5.4) (21.6) (6.0) (5.9) (5.9) (17.8) (17.8)
EBIT 16.4 25.6 30.1 72.1 31.3 103.3 24.4 30.3 28.5 83.2 (2.0) 81.2
in % of gross profit 4.9% 7.5% 8.6% 7.0% 8.4% 7.4% 6.6% 8.1% 7.7% 7.5% 7.4%
Financial result 0.2 0.1 (0.4) (0.2) (1.6) (1.8) (1.7) (3.6) (5.2) (10.4) 5.2 (5.3)
Earnings before taxes (EBT) 16.5 25.7 29.7 71.9 29.6 101.5 22.7 26.7 23.3 72.8 3.1 75.9
Income tax expenses (4.2) (8.1) (11.2) (23.5) (20.6) (44.1) (6.1) (7.2) (8.4) (21.8) (0.8) (22.6)
% of EBT 25.2% 31.6% 37.8% 32.7% 69.4% 43.4% 27.0% 27.0% 36.1% 29.9% 27.0% 29.8%
Profit 12.4 17.6 18.5 48.4 9.1 57.5 16.6 19.5 14.9 51.0 2.3 53.3
Earnings per share 0.54 0.75 0.79 2.08 0.40 2.48 0.72 0.84 0.65 2.21 2.31
15

Income Statement Per Quarter – Air Freight
Note: Air Freight figures in CHF million
Air Freight Q1 2017 Q2 2017 Q3 2017Q3YTD
2017Q4 2017 FY 2017 Q1 2018 Q2 2018 Q3 2018
Q3 YTD
2018
IFRS 16
impact
Q3 YTD
2018 like-
for-like
Net forwarding revenue 657.1 700.0 738.9 2,096.0 823.8 2,919.8 750.1 803.0 794.1 2,347.2 2,347.2
Forwarding expenses (512.5) (550.0) (577.5) (1,640.0) (640.3) (2,280.3) (572.4) (626.1) (618.7) (1,817.1) (23.3) (1,840.4)
Gross profit 144.7 150.0 161.4 456.0 183.4 639.4 177.8 176.9 175.5 530.1 (23.3) 506.8
Personnel expenses (90.5) (91.6) (92.8) (275.0) (104.4) (379.3) (101.8) (103.3) (100.1) (305.2) (305.2)
Other operating expenses (32.4) (31.7) (33.7) (97.8) (33.4) (131.2) (30.7) (27.2) (29.2) (87.1) (21.2) (108.3)
EBITDA 21.8 26.6 34.9 83.3 45.7 129.0 45.3 46.4 46.1 137.8 (44.5) 93.3
Depreciation and amortization (4.6) (4.7) (4.6) (13.9) (4.7) (18.6) (18.4) (19.8) (19.4) (57.6) 44.0 (13.7)
EBIT 17.1 22.0 30.3 69.4 40.9 110.3 26.9 26.5 26.8 80.2 (0.5) 79.6
in % of gross profit 11.8% 14.6% 18.8% 15.2% 22.3% 17.3% 15.1% 15.0% 15.3% 15.1% 15.7%
Volumes ('000 tons) 233.2 239.9 248.9 722.0 273.9 995.9 240.5 248.9 262.6 752.0 752.0
% change YoY 7.9% 6.6% 9.3% 7.9% 8.5% 8.1% 3.1% 3.7% 5.5% 4.2% 4.2%
GP/ton (CHF) 620.5 625.1 648.3 631.6 669.7 642.1 739.2 710.7 668.1 704.9 673.9
% change YoY -9.8% -9.7% -0.8% -6.8% 19.2% -0.6% 19.1% 13.7% 3.0% 11.6% 8.2%
16

Income Statement Per Quarter – Ocean Freight
Note: Ocean Freight figures in CHF million
Ocean Freight Q1 2017 Q2 2017 Q3 2017Q3YTD
2017Q4 2017 FY 2017 Q1 2018 Q2 2018 Q3 2018
Q3YTD
2018
IFRS 16
impact
Q3YTD 2018
like-for-like
Net forwarding revenue 491.5 517.2 555.1 1,563.7 510.5 2,074.3 534.7 562.4 594.9 1,692.0 1,692.0
Forwarding expenses (386.0) (408.1) (446.3) (1,240.4) (406.7) (1,647.1) (425.8) (450.4) (483.8) (1,360.1) (1,360.1)
Gross profit 105.5 109.1 108.8 323.4 103.8 427.2 108.9 112.0 111.0 331.9 331.9
Personnel expenses (77.9) (78.4) (78.8) (235.2) (83.7) (318.9) (82.3) (81.4) (78.4) (242.1) (242.1)
Other operating expenses (27.1) (26.5) (29.0) (82.7) (25.7) (108.3) (24.1) (21.6) (23.9) (69.6) (15.2) (84.7)
EBITDA 0.5 4.1 0.9 5.5 (5.5) (0.0) 2.5 9.0 8.7 20.3 (15.2) 5.1
Depreciation and amortization (3.6) (3.6) (3.8) (11.0) (4.1) (15.1) (8.3) (8.7) (8.6) (25.6) 14.8 (10.8)
EBIT (3.2) 0.6 (2.9) (5.5) (9.6) (15.1) (5.8) 0.3 0.1 (5.3) (0.3) (5.7)
in % of gross profit -3.0% 0.5% -2.7% -1.7% -9.2% -3.5% -5.3% 0.3% 0.1% -1.6% -1.7%
Volumes ('000 TEUs) 374.2 382.8 385.6 1,142.6 377.9 1,520.5 359.8 380.2 380.8 1,120.8
% change YoY 7.5% 2.7% 1.8% 3.9% -2.8% 2.2% -3.8% -0.7% -1.3% -1.9%
GP/TEU (CHF) 282 285 282 283 275 281 303 295 292 296
% change YoY -16.9% -7.5% -4.7% -9.8% 8.3% -5.8% 7.3% 3.4% 3.4% 4.7%
17

Income Statement Per Quarter – Logistics
Note: Logistics figures in CHF million
Logistics Q1 2017 Q2 2017 Q3 2017Q3YTD
2017Q4 2017 FY 2017 Q1 2018 Q2 2018 Q3 2018
Q3YTD
2018
IFRS 16
impact
Q3 YTD
2018 like-
for-like
Net forwarding revenue 128.6 137.7 139.4 405.7 133.0 538.7 129.5 136.8 137.0 403.3 403.3
Forwarding expenses (46.0) (56.4) (58.0) (160.4) (47.2) (207.6) (45.5) (52.0) (51.7) (149.1) (149.1)
Gross profit 82.5 81.3 81.5 245.4 85.8 331.1 84.0 84.8 85.4 254.2 254.2
Personnel expenses (47.9) (46.1) (46.9) (140.9) (50.7) (191.6) (45.9) (46.9) (50.3) (143.1) (143.1)
Other operating expenses (29.8) (29.8) (29.8) (89.4) (32.9) (122.3) (21.5) (20.5) (18.7) (60.7) (33.5) (94.2)
EBITDA 4.8 5.4 4.8 15.1 2.2 17.2 16.6 17.4 16.4 50.4 (33.5) 16.9
Depreciation and amortization (2.5) (2.4) (2.1) (6.9) (2.3) (9.2) (13.2) (14.1) (14.8) (42.0) 32.3 (9.7)
EBIT 2.4 3.1 2.7 8.1 (0.1) 8.1 3.4 3.4 1.6 8.3 (1.1) 7.2
18

300.4 5.258.1
9.8 39.3 8.0331.7
250
270
290
310
330
350
370
390
Net (operational)Working Capital
at 31/12/2017
Effect ofdecrease in DSO
Effect of growthin net forwarding
revenue
Effect ofdecrease in DPO
Effect of growthin forwarding
expenses
Others Net (operational)Working Capital
at 30/09/2018
Net Working Capital development
While DSO/DPO spread is relatively stable, growing business has resulted in increase of operational net working capital.
Operational Net Working Capital defined as:
Trade receivables + contract assets – Trade payables – contract liabilities – accrued cost of servicesReceivables / sales Payables / purchases
CHF 20m Investment into growth
Note: Group figures in CHF million 19

Balance SheetImpact from IFRS 16:
Right-of-use leased assets in the amount of CHF 332.4m reported under non-current assets. As part of current liabilities lease liabilities in the amount of CHF 113.1m and as part of long-term liabilities lease liabilities in the amount of CHF 222.3m are reported as of September 30, 2018.
CHF %
Cash and cash equivalents 310.9 218.1 (92.7) -30%
Trade receivables, contract assets 1,097.0 1,103.8 6.8 1%
Other current assets 132.2 119.9 (12.3) -9%
Property, plant and equipment 96.7 102.6 5.9 6%
Right-of-use of leased assets 332.4 332.4
Intangible assets 88.5 101.8 13.4 15%
Other non-current assets 113.8 121.2 7.4 7%
Total assets 1,839.0 2,099.8 260.7 14%
Short-term borrowings 2.6 1.7 (0.9) -35%
Trade payables, contract liabilities and accrued costs 796.7 772.2 (24.4) -3%
Other current liabilities 267.6 362.4 94.7 35%
Long-Term borrowings 3.2 4.2 0.9 n/a
Other long-term liabilities 154.6 393.3 238.7 154%
Total liabilities 1,224.7 1,533.7 308.9 25%
Share capital 2.4 2.4 0 0%
Reserves, treasury shares 605.6 558.9 (46.8) -8%
Non-controlling interests 6.3 4.9 (1.4) -23%
Total equity 614.3 566.1 (48.2) -8%
Total equity and liabilities 1,839.0 2,099.8 260.7 14%
31-Dec-17 30-Sep-18Change in
Note: Group figures in CHF million 20
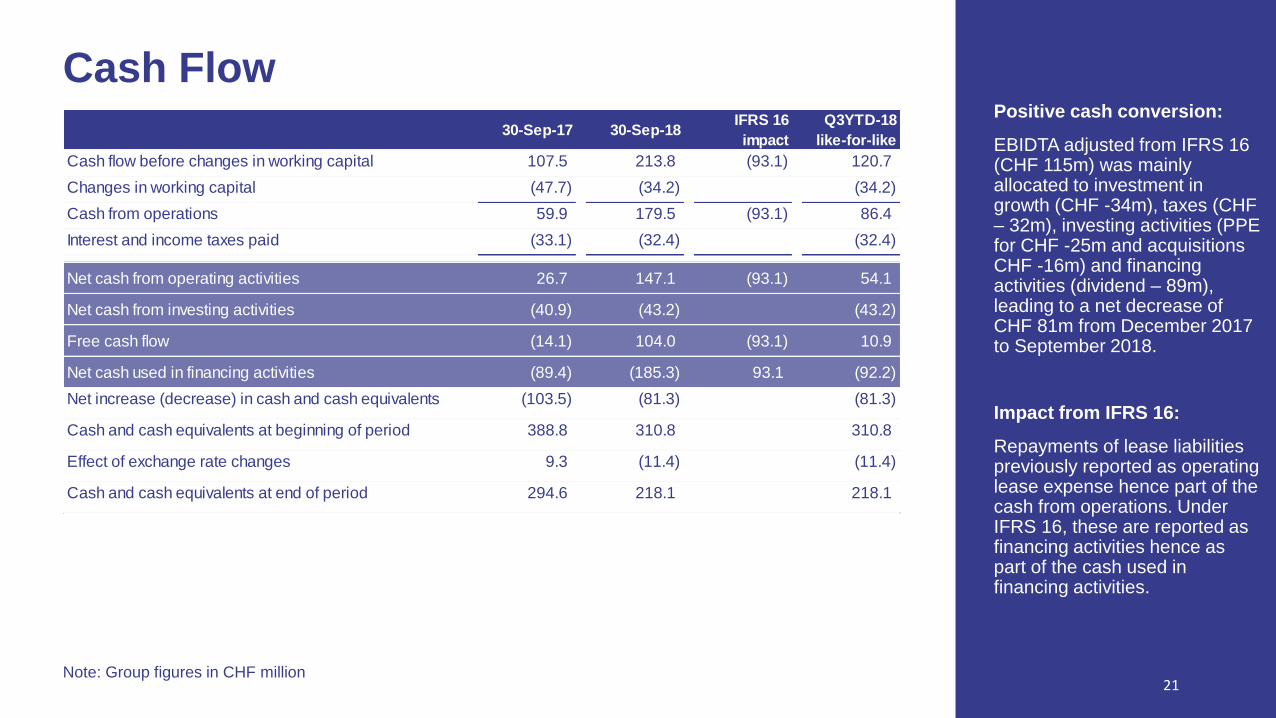
Cash Flow
30-Sep-17 30-Sep-18IFRS 16
impact
Q3YTD-18
like-for-like
Cash flow before changes in working capital 107.5 213.8 (93.1) 120.7
Changes in working capital (47.7) (34.2) (34.2)
Cash from operations 59.9 179.5 (93.1) 86.4
Interest and income taxes paid (33.1) (32.4) (32.4)
Net cash from operating activities 26.7 147.1 (93.1) 54.1
Net cash from investing activities (40.9) (43.2) (43.2)
Free cash flow (14.1) 104.0 (93.1) 10.9
Net cash used in financing activities (89.4) (185.3) 93.1 (92.2)
Net increase (decrease) in cash and cash equivalents (103.5) (81.3) (81.3)
Cash and cash equivalents at beginning of period 388.8 310.8 310.8
Effect of exchange rate changes 9.3 (11.4) (11.4)
Cash and cash equivalents at end of period 294.6 218.1 218.1
Positive cash conversion:
EBIDTA adjusted from IFRS 16 (CHF 115m) was mainly allocated to investment in growth (CHF -34m), taxes (CHF – 32m), investing activities (PPE for CHF -25m and acquisitions CHF -16m) and financing activities (dividend – 89m), leading to a net decrease of CHF 81m from December 2017 to September 2018.
Impact from IFRS 16:
Repayments of lease liabilities previously reported as operating lease expense hence part of the cash from operations. Under IFRS 16, these are reported as financing activities hence as part of the cash used in financing activities.
Note: Group figures in CHF million 21

THANK YOU