Embed Size (px)
Citation preview

Advanced Emissions Solutions, Inc.Advancing Cleaner Energy
Third Quarter 2021Earnings Results CallNovember 10, 2021
© 2021 Advanced Emissions Solutions, Inc. All rights reserved.

2
SAFE HARBOR
This presentation includes forward-looking statements within the meaning of Section 21E of the Securities Exchange Act of 1934, which provides a "safe harbor" for such statements in certain circumstances. The forward-looking statements include statements or expectations regarding net, after-tax cash flows from refined coal (“RC”); expectations of continued strong APT performance; and results from the Company’s review of strategic alternatives. These statements are based on current expectations, estimates, projections, beliefs and assumptions of our management. Such statements involve significant risks and uncertainties. Actual events or results could differ materially from those discussed in the forward-looking statements as a result of various factors, including but not limited to, the outcome of the review of strategic alternatives, our ability to meet customer supply requirements, the rate of coal-fired power generation in the United States; changes and timing in laws, regulations, IRS interpretations or guidance, and accounting rules; changes in prices, economic conditions and market demand; impact of competition; technical, start-up and operational difficulties; availability of raw materials; customer demand for our APT products; competition within the industries in which we operate; availability of opportunities to further grow our business; loss of key personnel; ongoing effects of the COVID-19 pandemic and associated economic downturn on our operations and prospects; and other factors discussed in greater detail in our filings with the SEC. You are cautioned not to place undue reliance on such statements and to consult our SEC filings for additional risks and uncertainties that may apply to our business and the ownership of our securities. Our forward-looking statements are presented as of the date made, and we disclaim any duty to update such statements unless required by law to do so.

3
THIRD QUARTER 2021 BUSINESS SUMMARY
Refined Coal (“RC”)
Advanced Purification Technologies (“APT")
OutlookConsolidated Results & Capital Allocation
Q3 distributions were $22.9M compared to $9.7M in 2020
Q3 royalties were $4.2M compared to $3.6M
Q3 segment operating income was $26.3M compared to $12.8M
Q3 segment Adjusted EBITDA(1) was $26.9M compared to $13.1M
Q3 revenue was $24.7M compared to $15.8M; Q3 gross profit was $6.7M compared to $0.8MQ3 segment operating income totaled $4.6M compared to segment operating loss of $3.3MQ3 segment Adjusted EBITDA(1) of $4.2M compared to a segment Adjusted EBITDA loss of $1.6M
Q3 net income of $24.3M compared to $5.0M
Q3 consolidated Adjusted EBITDA(2) of $28.5M compared to $8.7M
Cash, including restricted cash, of $82.1M compared to $35.9M as of December 31, 2020
Net, after-tax cash flows from RC segment projected to be approximately $8.5M in Q4
Expect additional cash flows to be disbursed during 1H 2022 as Tinuum winds down
Expect continued top-line strength in APT segment
Strategic alternatives review underway and progressing
(1) Segment EBITDA and Segment Adjusted EBITDA are a non-GAAP measure. See Appendix for definitions and reconciliations. (2) Adjusted EBITDA is a non-GAAP measure. See Appendix for definitions and reconciliations
4
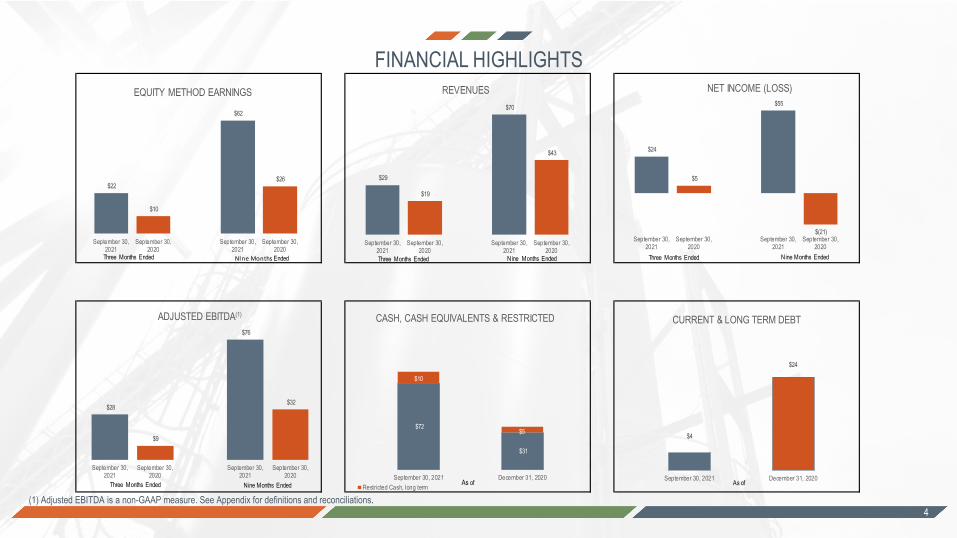
FINANCIAL HIGHLIGHTS
(1) Adjusted EBITDA is a non-GAAP measure. See Appendix for definitions and reconciliations.
$72
$31
$10
$5
September 30, 2021 December 31, 2020
CASH, CASH EQUIVALENTS & RESTRICTED
Restricted Cash, long term As of
$24
$5
$55
$(21)September 30,
2021September 30,
2020September 30,
2021September 30,
2020
NET INCOME (LOSS)
NIne Months Ended
Three Months Ended
Three Months Ended
$29
$19
$70
$43
September 30,2021
September 30,2020
September 30,2021
September 30,2020
REVENUES
$22
$10
$62
$26
September 30,2021
September 30,2020
September 30,2021
September 30,2020
EQUITY METHOD EARNINGS
$4
$24
September 30, 2021 December 31, 2020
CURRENT & LONG TERM DEBT
As of
Three Months Ended
$28
$9
$76
$32
September 30,2021
September 30,2020
September 30,2021
September 30,2020
ADJUSTED EBITDA(1)
Three Months Ended Nine Months Ended Nine Months Ended
Nine Months Ended

Based on 16 invested facilities as of September 30, 2021 and includes all net RC cash flows of ADES (1)
The remaining 16 facilities Section 45 tax credit generation period will expire by the end of the year
Expected future net RC cash flows of ~$8.5 million in the fourth quarter (2)
The Company expects additional net RC cash flows during the first half of 2022 upon the full wind down of Tinuum
5
EXPECTED FUTURE REFINED COAL (“RC”) CASH FLOWS
EXPECTED FUTURE CASH FLOWS FROM RC BUSINESS (1)
(in millions)
(1) Net projected RC cash flows include the impact of all expected Tinuum distributions and royalty payments offset by the Company’s federal and state tax payments as well as 453A interest payments (2) The expectation is based on the following four key assumptions: 1) Tinuum Group continues to not operate retained facilities; 2) Tinuum Group does not have material unexpected CapEx or unusual operating
expenses based on expectations as of the balance sheet date; 3) tax equity lease renewals are not terminated or repriced; 4) coal-fired generation remains consistent with contractual expectations; and 5) wind down operations are in line with expectations.
$0$1$2$3$4$5$6$7$8$9
Q4 2021 1H 2022
Total: ~$12 to ~$14 million
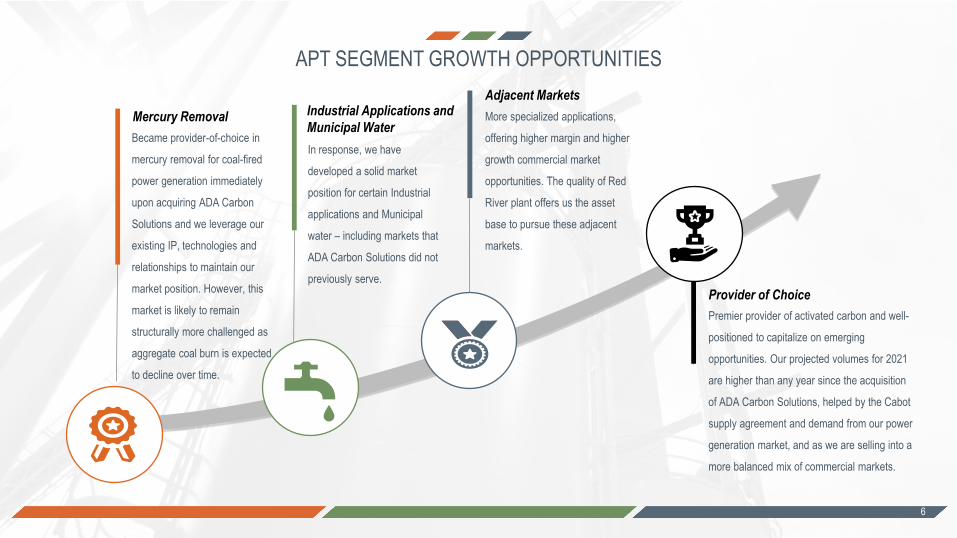
APT SEGMENT GROWTH OPPORTUNITIES
More specialized applications,
offering higher margin and higher
growth commercial market
opportunities. The quality of Red
River plant offers us the asset
base to pursue these adjacent
markets.
Adjacent Markets
In response, we have
developed a solid market
position for certain Industrial
applications and Municipal
water – including markets that
ADA Carbon Solutions did not
previously serve.
Industrial Applications and Municipal Water
Became provider-of-choice in
mercury removal for coal-fired
power generation immediately
upon acquiring ADA Carbon
Solutions and we leverage our
existing IP, technologies and
relationships to maintain our
market position. However, this
market is likely to remain
structurally more challenged as
aggregate coal burn is expected
to decline over time.
Mercury Removal
Premier provider of activated carbon and well-
positioned to capitalize on emerging
opportunities. Our projected volumes for 2021
are higher than any year since the acquisition
of ADA Carbon Solutions, helped by the Cabot
supply agreement and demand from our power
generation market, and as we are selling into a
more balanced mix of commercial markets.
Provider of Choice
6

7
2021 PRIORITIES
OPTIMIZE REFINED COAL NET CASH FLOWS:• Protect current forecasted cash flow stream to support capital allocation initiatives
• Maximize operational performance to produce RC and execute on plans for end of Tinuum businesses
FURTHER SCALE APT SEGMENT TO IMPROVE PROFITABILITY:• Optimize Red River’s capacity utilization to fully capture the low-cost benefit of the highly efficient plant
• Defend share in mercury control market while diversifying further into non-power generation markets to improve the earnings profile of the business
• Remain vigilant for additional rationalization opportunities and supply agreements
• Improved margin through customer and product mix
OPTIMIZE CASH FLOWS & ASSETS TO DRIVE SHAREHOLDER VALUE:• Invest in APT segment’s strategic initiatives to solidify position as provider-of-choice for activated carbon
• Execute strategic alternatives review to assess opportunities to maximize shareholder value

APPENDIX

9
Appendix A: Operating Tons: Royalty Vs. Non-royalty
Note: Numbers within bar graph represent the number of facilities per category as of the end of each quarter presented (1) Tonnage information is based upon RC production for the three and nine months ended September 30, 2021 (in thousands) (2) Counts are based upon the number of facilities of which a royalty has been earned during the period presented.
9
Royalty Non-RoyaltyTonnage (1) 15,209 4,463 19,672 Count (#) (2) 18 4 22
Three Month Ended September 30, 2021
Operating Tons QTD - Total Royalty Non-RoyaltyTonnage (1) 42,668 14,209 56,878 Count (#) (2) 18 5 23
Nine Months Ended September 30, 2021
Operating Tons YTD - Total

Appendix B: 10-Q Balance Sheet(1)
(1) See complete, unaudited Condensed Consolidated Financial Statements and Notes related thereto within the Quarterly Report on Form 10-Q for the period ended September 30, 2021.

Appendix C: 10-Q Income Statement(1)
(1) See complete, unaudited Condensed Consolidated Financial Statements and Notes related thereto within the Quarterly Report on Form 10-Q for the period ended September 30, 2021.

Appendix D: 10-Q Cash Flow(1)
(1) See complete, unaudited Condensed Consolidated Financial Statements and Notes related thereto within the Quarterly Report on Form 10-Q for the period ended September 30, 2021.
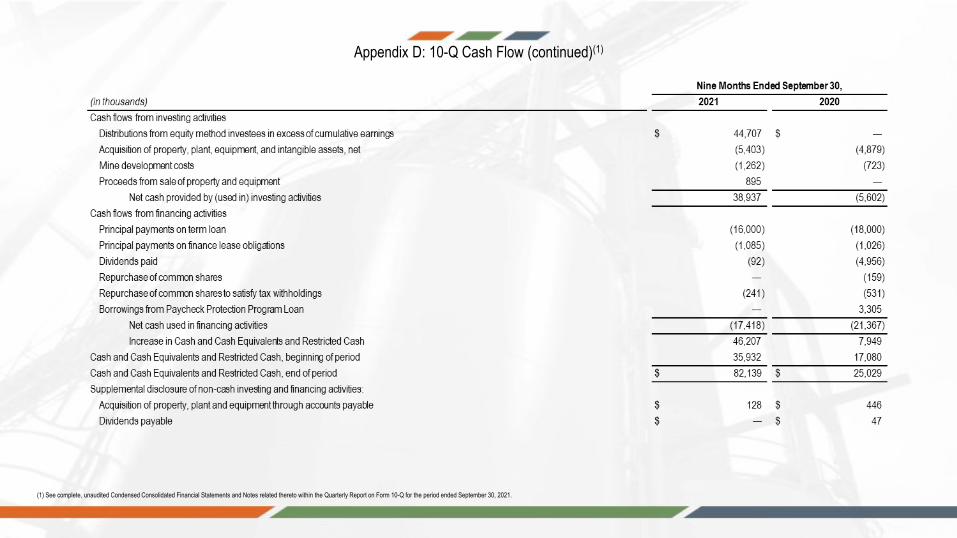
Appendix D: 10-Q Cash Flow (continued)(1)
(1) See complete, unaudited Condensed Consolidated Financial Statements and Notes related thereto within the Quarterly Report on Form 10-Q for the period ended September 30, 2021.

Appendix E: Non-GAAP Financial Measure & Consolidated Adjusted EBITDA Reconciliation to Net IncomeNote on Non-GAAP Financial Measures
To supplement the Company's financial information presented in accordance with U.S. generally accepted accounting principles, or GAAP, this investor presentation includes non-GAAP measures of certain financial performance. These non-GAAP measures include Consolidated Adjusted EBITDA, APT Segment Adjusted EBITDA and RC Segment Adjusted EBITDA. The Company included non-GAAP measures because management believes that they help to facilitate comparison of operating results between periods. The Company believes the non-GAAP measures provide useful information to both management and users of the financial statements by excluding certain expenses that may not be indicative of core operating results and business outlook. These non-GAAP measures are not in accordance with, or an alternative to, measures prepared in accordance with GAAP and may be different from non-GAAP measures used by other companies. In addition, these non-GAAP measures are not based on any comprehensive set of accounting rules or principles. These measures should only be used to evaluate the Company's results of operations in conjunction with the corresponding GAAP measures.
The Company has defined Consolidated Adjusted EBITDA as net income, adjusted for the impact of the following items that are either non-cash or that the Company does not consider representative of its ongoing operating performance: depreciation, amortization, depletion and accretion, amortization of upfront customer consideration, interest expense, net, income tax expense; then reduced by the non-cash impact of equity earnings from equity method investments, gain n extinguishment of debt and gain on change of an estimate for asset retirement obligations and increased by cash distributions from equity method investments and impairment. The Company believes that the Consolidated Adjusted EBITDA measure is less susceptible to variances that affect the Company's operating performance.
Segment EBITDA is calculated as Segment operating income (loss) adjusted for the impact of the following items that are either non-cash or that the Company does not consider representative of its ongoing operating performance: depreciation, amortization, depletion and accretion, amortization of upfront customer consideration and interest expense, net. When used in conjunction with GAAP financial measures, Segment EBITDA is a supplemental measure of operating performance that management believes is a useful measure related the Company's APT segment performance and the APT segment performance relative to the performance of their respective competitors as well as performance period over period. Additionally, the Company believes these measure are less susceptible to variances that affect their respective operating performance results.
The Company defines RC Segment Adjusted EBITDA as RC Segment EBITDA reduced by the non-cash impact of equity earnings from equity method investments and gain on extinguishment of debt and increased by cash distributions from equity method investments.
The Company defined APT Segment Adjusted EBITDA as APT Segment EBITDA decreased for the gain on change of an estimate for asset retirement obligations and the gain on extinguishment of debt and increased for impairment.
The Company presents the non-GAAP measures because the Company believes they are useful as supplemental measures in evaluating the performance of the Company's operating performance and provide greater transparency into the results of operations. The Company's management uses Consolidated Adjusted EBITDA, RC Segment Adjusted EBITDA and APT Segment Adjusted EBITDA as factors in evaluating the performance of its business.
The adjustments to Consolidated Adjusted EBITDA, RC Segment Adjusted EBITDA and APT Segment Adjusted EBITDA in future periods are generally expected to be similar. Consolidated Adjusted EBITDA, RC Segment Adjusted EBITDA and APT Segment Adjusted EBITDA have limitations as analytical tools, and you should not consider these measures in isolation or as a substitute for analyzing the Company's results as reported under GAAP.

Appendix F: Consolidated Adjusted EBITDA Reconciliation to Net Income (Loss)

Appendix G: RC Segment Adjusted EBITDA Reconciliation to Segment Operating Income
Appendix H: APT Segment Adjusted EBITDA Reconciliation to Segment Operating Income (Loss)