Embed Size (px)
Citation preview

Third Quarter 2018 Management’s Discussion and Analysis of Results of Operations and Financial Condition
October 31, 2018

Third Quarter 2018 Management’s Discussion and Analysis of Results of Operations and Financial Condition
2
TABLE OF CONTENTS
1. Highlights ..................................................................................................... 1
2. Introduction and Key Assumptions ............................................................... 3
3. Overview ...................................................................................................... 5
4. Results of Operations ................................................................................... 7
5. Fleet ........................................................................................................... 22
6. Financial and Capital Management ............................................................. 24
6.1. Financial Position .................................................................................... 24 6.2. Adjusted Net Debt ................................................................................... 25 6.3. Working Capital ....................................................................................... 26 6.4. Consolidated Cash Flow Movements ........................................................ 27 6.5. Capital Expenditures and Related Financing Arrangements ..................... 28 6.6. Pension Funding Obligations ................................................................... 30 6.7. Contractual Obligations ........................................................................... 30 6.8. Share Information ................................................................................... 32
7. Quarterly Financial Data ............................................................................. 33
8. Financial Instruments and Risk Management ............................................. 36
9. Accounting Policies ..................................................................................... 36
10. Off-Balance Sheet Arrangements ................................................................ 38
11. Related Party Transactions ......................................................................... 38
12. Risk Factors ................................................................................................ 38
13. Controls and Procedures ............................................................................. 38
14. Non-GAAP Financial Measures .................................................................... 39
15. Glossary ...................................................................................................... 46

Third Quarter 2018 Management’s Discussion and Analysis of Results of Operations and Financial Condition
1
1. HIGHLIGHTS
The financial and operating highlights for Air Canada for the periods indicated are as follows:
(Canadian dollars in millions, except where indicated)
Third Quarter First Nine Months
2018 2017 (1) $ Change 2018 2017 (1) $ Change
Financial Performance Metrics
Operating revenues 5,415 4,880 535 13,819 12,432 1,387
Operating income 840 976 (136) 1,052 1,238 (186)
Income before income taxes 876 965 (89) 621 1,266 (645)
Net income 645 1,723 (1,078) 398 2,021 (1,623)
Adjusted pre-tax income (2) 793 922 (129) 884 1,088 (204)
Adjusted net income (2) 561 922 (361) 623 1,088 (465)
Operating margin % 15.5% 20.0% (4.5) pp 7.6% 10.0% (2.4) pp
EBITDAR (excluding special items) (2) 1,265 1,360 (95) 2,308 2,407 (99)
EBITDAR margin (excluding special items) % (2) 23.4% 27.9% (4.5) pp 16.7% 19.4% (2.7) pp
Unrestricted liquidity (3) 5,309 4,509 800 5,309 4,509 800
Net cash flows from operating activities 371 493 (122) 2,335 2,349 (14)
Free cash flow (2) 470 324 146 650 1,099 (449)
Adjusted net debt (2) 5,620 5,939 (319) 5,620 5,939 (319)
Return on invested capital (“ROIC”) % (2) 12.7% 16.3% (3.6) pp 12.7% 16.3% (3.6) pp
Leverage ratio (2) 2.0 2.1 (0.1) 2.0 2.1 (0.1)
Diluted earnings per share $2.34 $6.22 ($3.88) $1.44 $7.29 ($5.85)
Adjusted earnings per share – diluted (2) $2.03 $3.33 ($1.30) $2.25 $3.93 ($1.68)
Operating Statistics (4) % Change % Change
Revenue passenger miles (“RPM”) (millions) 28,465 26,472 7.5 71,559 65,741 8.9
Available seat miles (“ASM”) (millions) 33,137 31,050 6.7 85,268 79,301 7.5
Passenger load factor % 85.9% 85.3% 0.6 pp 83.9% 82.9% 1.0 pp
Passenger revenue per RPM ("Yield") (cents) 17.6 17.1 3.4 17.4 17.0 2.1
Passenger revenue per ASM ("PRASM") (cents) 15.1 14.5 4.2 14.6 14.1 3.3
Operating revenue per ASM (cents) 16.3 15.7 4.0 16.2 15.7 3.4
Operating expense per ASM ("CASM") (cents) 13.8 12.6 9.8 15.0 14.1 6.1
Adjusted CASM (cents) (2) 9.4 9.3 1.1 10.4 10.4 0.2
Average number of full-time equivalent (“FTE”) employees (thousands) (5) 30.2 28.3 6.9 29.7 27.7 7.4
Aircraft in operating fleet at period-end 409 392 4.3 409 392 4.3
Average fleet utilization (hours per day) 11.6 11.6 0.2 10.6 10.6 (0.2)
Seats dispatched (thousands) 17,970 17,056 5.4 48,615 46,298 5.0
Aircraft frequencies (thousands) 159.5 155.7 2.4 441.2 431.2 2.3
Average stage length (miles) (6) 1,844 1,820 1.3 1,754 1,713 2.4
Fuel cost per litre (cents) 83.0 59.4 39.7 79.2 61.1 29.6
Fuel litres (thousands) 1,652,137 1,583,984 4.3 4,304,169 4,077,777 5.6
Revenue passengers carried (thousands) (7) 14,806 13,993 5.8 38,995 36,812 5.9

Third Quarter 2018 Management’s Discussion and Analysis of Results of Operations and Financial Condition
2
(1) Air Canada adopted accounting standard IFRS 15 - Revenue from Contracts with Customers effective January 1, 2018 with restatement of 2017 amounts. ROIC and leverage ratio as at September 30, 2017 have not been restated for the adoption of this new accounting standard. Refer to section 9 “Accounting Policies” of this MD&A for additional information.
(2) Adjusted pre-tax income, adjusted net income, adjusted earnings per share – diluted, EBITDAR (earnings before interest, taxes, depreciation, amortization, impairment and aircraft rent), EBITDAR margin, leverage ratio, free cash flow, ROIC and adjusted CASM are each non-GAAP financial measures and adjusted net debt is an additional GAAP measure. Refer to sections 6 and 14 of this MD&A for descriptions of Air Canada’s non-GAAP financial measures and additional GAAP measures. As referenced in the table above, special items are excluded from Air Canada's reported EBITDAR calculations. Refer to section 4 of this MD&A for information on the special items.
(3) Unrestricted liquidity refers to the sum of cash, cash equivalents, short-term investments and the amount of available credit under Air Canada’s revolving credit facilities. At September 30, 2018, unrestricted liquidity was comprised of cash and short-term investments of $4,922 million and undrawn lines of credit of $387 million. At September 30, 2017, unrestricted liquidity was comprised of cash and short-term investments of $4,135 million and undrawn lines of credit of $374 million.
(4) Except for the reference to average number of FTE employees, operating statistics in this table include third party carriers (such as Jazz Aviation LP (“Jazz”), Sky Regional Airlines Inc. (“Sky Regional”), Air Georgian Limited (“Air Georgian”) and Exploits Valley Air Services Ltd. (“EVAS”)) operating under capacity purchase agreements with Air Canada.
(5) Reflects FTE employees at Air Canada. Excludes FTE employees at third party carriers (such as Jazz, Sky Regional, Air Georgian and EVAS) operating under capacity purchase agreements with Air Canada.
(6) Average stage length is calculated by dividing the total number of available seat miles by the total number of seats dispatched.
(7) Revenue passengers are counted on a flight number basis (rather than by journey/itinerary or by leg) which is consistent with the IATA definition of revenue passengers carried.

Third Quarter 2018 Management’s Discussion and Analysis of Results of Operations and Financial Condition
3
2. INTRODUCTION AND KEY ASSUMPTIONS
In this Management’s Discussion and Analysis of Results of Operations and Financial Condition (“MD&A”), the “Corporation” refers, as the context may require, to Air Canada and/or one or more of Air Canada’s subsidiaries, including its wholly-owned operating subsidiaries, Touram Limited Partnership, doing business as Air Canada Vacations® (“Air Canada Vacations”) and Air Canada rouge LP, doing business as Air Canada Rouge® (“Air Canada Rouge”). This MD&A provides the reader with a review and analysis, from the perspective of management, of Air Canada’s financial results for the third quarter of 2018. This MD&A should be read in conjunction with Air Canada’s interim unaudited condensed consolidated financial statements and notes for the third quarter of 2018, Air Canada’s 2017 annual audited consolidated financial statements and notes and Air Canada’s 2017 MD&A dated February 16, 2018 (“Air Canada’s 2017 MD&A”). All financial information has been prepared in accordance with generally accepted accounting principles in Canada (“GAAP”), as set out in the CPA Canada Handbook – Accounting (“CPA Handbook”), which incorporates International Financial Reporting Standards (“IFRS”) as issued by the International Accounting Standards Board (“IASB”), except for any financial information specifically denoted otherwise.
Air Canada’s interim unaudited condensed consolidated financial statements for the third quarter of 2018 are based on the accounting policies consistent with those disclosed in Note 2 of Air Canada’s 2017 annual consolidated financial statements, except for the adoption of accounting standard IFRS 15 – Revenue from Contracts with Customers. Air Canada adopted this accounting standard effective January 1, 2018 with restatement of 2017 amounts. Refer to section 9 “Accounting Policies” of this MD&A for additional information.
Except as otherwise noted, monetary amounts are stated in Canadian dollars. For an explanation of certain terms used in this MD&A, refer to section 15 “Glossary” of this MD&A. Except as otherwise noted or where the context may otherwise require, this MD&A is current as of October 30, 2018.
Forward-looking statements are included in this MD&A. See “Caution Regarding Forward-Looking Information” below for a discussion of risks, uncertainties and assumptions relating to these statements. For a description of risks relating to Air Canada, refer to section 18 “Risk Factors” of Air Canada’s 2017 MD&A. Air Canada issued a news release dated October 31, 2018 reporting on its results for the third quarter of 2018. This news release is available on Air Canada’s website at www.aircanada.com and on SEDAR’s website at www.sedar.com. For further information on Air Canada’s public disclosures, including Air Canada’s Annual Information Form, consult SEDAR at www.sedar.com.
CAUTION REGARDING FORWARD-LOOKING INFORMATION
Air Canada’s public communications may include forward-looking statements within the meaning of applicable securities laws. Such forward-looking statements are included in this MD&A and may be included in other communications, including filings with regulatory authorities and securities regulators. Forward-looking statements may be based on forecasts of future results and estimates of amounts not yet determinable. These statements may involve, but are not limited to, comments relating to strategies, expectations, planned operations or future actions. Forward-looking statements are identified using terms and phrases such as “anticipate”, “believe”, “could”, “estimate”, “expect”, “intend”, “may”, “plan”, “predict”, “project”, “will”, “would”, and similar terms and phrases, including references to assumptions.
Forward-looking statements, by their nature, are based on assumptions, including those described herein and are subject to important risks and uncertainties. Forward-looking statements cannot be relied upon due to, amongst other things, changing external events and general uncertainties of the business. Actual results may differ materially from results indicated in forward-looking statements due to a number of factors, including without limitation, our ability to successfully achieve or sustain positive net profitability or to realize our initiatives and objectives, industry, market, credit, economic and geopolitical conditions, energy prices, currency exchange, competition, our dependence on technology, cybersecurity risks, our ability to pay our indebtedness and secure financing, our ability to successfully implement appropriate strategic initiatives or reduce operating costs, war, terrorist acts, epidemic diseases, airport user and related fees, high levels of fixed costs, liquidity, our dependence on key

Third Quarter 2018 Management’s Discussion and Analysis of Results of Operations and Financial Condition
4
suppliers including regional carriers and Aimia Canada Inc., the successful conclusion of the transactions among Air Canada, the other members of the Consortium and Aimia relating to the acquisition of Aimia’s Aeroplan business, our success in transitioning from the Aeroplan program and launching our new loyalty program, casualty losses, employee and labour relations and costs, our ability to preserve and grow our brand, pension issues, environmental factors (including weather systems and other natural phenomena and factors arising from man-made sources), limitations due to restrictive covenants, insurance issues and costs, our dependence on Star Alliance, interruptions of service, changes in laws, regulatory developments or proceedings, pending and future litigation and actions by third parties and our ability to attract and retain required personnel, as well as the factors identified in Air Canada's public disclosure file available at www.sedar.com and, in particular, those identified in section 18 “Risk Factors” of Air Canada’s 2017 MD&A. The forward-looking statements contained or incorporated by reference in this MD&A represent Air Canada's expectations as of the date of this MD&A (or as of the date they are otherwise stated to be made) and are subject to change after such date. However, Air Canada disclaims any intention or obligation to update or revise any forward-looking statements whether because of new information, future events or otherwise, except as required under applicable securities regulations.
KEY ASSUMPTIONS
Assumptions were made by Air Canada in preparing and making forward-looking statements. As part of its assumptions, Air Canada assumes continued relatively modest Canadian GDP growth for the fourth quarter and full year 2018. Air Canada also expects that the Canadian dollar will trade, on average, at C$1.30 per U.S. dollar in the fourth quarter and at C$1.29 per U.S. dollar for the full year 2018 and that the price of jet fuel will average 86 CAD cents per litre in the fourth quarter and 81 CAD cents per litre for the full year 2018.
INTELLECTUAL PROPERTY
Air Canada owns or has rights to trademarks, service marks or trade names used in connection with the operation of its business. In addition, Air Canada’s names, logos and website names and addresses are owned or licensed by Air Canada. Air Canada also owns or has the rights to copyrights that also protect the content of its products and/or services. Solely for convenience, the trademarks, service marks, trade names and copyrights referred to in this MD&A may be listed without the ©, ® and TM symbols, but Air Canada reserves all rights to assert, to the fullest extent under applicable law, its rights or the rights of the applicable licensors to these trademarks, service marks, trade names and copyrights.
This MD&A may also include trademarks, service marks or trade names of other parties. Air Canada’s use or display of other parties’ trademarks, service marks, trade names or products is not intended to, and does not imply a relationship with, or endorsement or sponsorship of Air Canada by, the trademark, service mark or trade name owners or licensees.
Third Quarter 2018 Management’s Discussion and Analysis of Results of Operations and Financial Condition
5
3. OVERVIEW
Air Canada’s principal objective is to become one of the world’s top global airlines. In pursuing this goal, it focuses on continuous improvement in customer experience and employee engagement and creating value for shareholders by targeting four core priorities:
Identifying and implementing cost reduction and revenue enhancing initiatives;
Pursuing profitable international growth opportunities and leveraging competitive attributes to expand margins, in large part by increasing connecting traffic through its strategic international gateways in Toronto, Vancouver and Montreal, and growing and competing effectively in both the business and leisure market to and from Canada;
Engaging customers by continuously enhancing their travel experience and providing a consistently high level of customer service, with additional emphasis on premium and business passengers and products; and
Fostering positive culture change through employee engagement programs. This includes meaningful investments in training and other tools that support delivering exceptional customer experience and that also promote improved collaboration and an appreciation of how the airline and its talented employees can better work together in a supportive and enriching environment.
Additional information on Air Canada’s strategy can be found in section 4 “Strategy” of Air Canada’s 2017 MD&A.
Financial Summary
The following is an overview of Air Canada’s results of operations and financial position for the third quarter of 2018 compared to the third quarter of 2017.
Record operating revenues of $5,415 million in the third quarter of 2018 compared to operating revenues of $4,880 million in the third quarter of 2017, an increase of $535 million or 11%. On capacity growth of 6.7%, record passenger revenues of $5,018 million increased $504 million or 11% from the third quarter of 2017.
Operating expenses of $4,575 million in the third quarter of 2018 versus operating expenses of $3,904 million in the third quarter of 2017, an increase of $671 million or 17%. CASM increased 9.8% from the third quarter of 2017. Adjusted CASM increased 1.1% from the third quarter of 2017, better than the 2.0% to 3.0% increase projected in Air Canada’s news release dated July 27, 2018. Air Canada’s better than expected adjusted CASM performance was largely driven by lower than forecasted Regional airlines expense, the impact of cost reduction initiatives related to Air Canada’s cost transformation program, and other operating expense reductions. The lower Regional airlines expense was primarily due to certain engine maintenance events being recorded as capitalized maintenance versus operating expense in the third quarter of 2018, as well as timing of maintenance activities related to the Air Canada Express fleet. Adjusted CASM is a non-GAAP financial measure. Refer to section 14 “Non-GAAP Financial Measures” of this MD&A for additional information.
Operating income of $840 million in the third quarter of 2018 compared to operating income of $976 million in the third quarter of 2017, a decrease of $136 million.
EBITDAR of $1,265 million in the third quarter of 2018 compared to EBITDAR of $1,360 million in the third quarter of 2017, a decrease of $95 million. The airline reported a third quarter 2018 EBITDAR margin (EBITDAR as a percentage of operating revenue) of 23.4% compared to an EBITDAR margin of 27.9% in the third quarter of 2017. Special items are excluded from all of Air Canada’s reported EBITDAR calculations. Refer to section 4 of this MD&A for information on special items. EBITDAR is a non-GAAP financial measure. Refer to section 14 “Non-GAAP Financial Measures” of this MD&A for additional information.

Third Quarter 2018 Management’s Discussion and Analysis of Results of Operations and Financial Condition
6
Net income of $645 million or $2.34 per diluted share in the third quarter of 2018 versus net income of $1,723 million or $6.22 per diluted share in the third quarter of 2017. The net income in the third quarter of 2017 included an income tax recovery of $758 million.
Adjusted net income of $561 million or $2.03 per diluted share in the third quarter of 2018 versus adjusted net income of $922 million or $3.33 per diluted share in the third quarter of 2017. Refer to section 14 “Non-GAAP Financial Measures” of this MD&A for additional information.
Adjusted net debt of $5,620 million at September 30, 2018 versus adjusted net debt of $6,116 million at December 31, 2017, a decrease of $496 million. In the nine months ended September 30, 2018, increases in long-term debt and finance lease balances of $559 million and capitalized operating lease balances of $63 million were more than offset by an increase in cash and short-term investment balances of $1,118 million. Adjusted net debt is an additional GAAP measure. Refer to section 6.2 “Adjusted Net Debt” of this MD&A for additional information.
Air Canada’s leverage ratio (adjusted net debt to trailing 12-month EBITDAR) was 2.0 at September 30, 2018, versus a ratio of 2.1 at December 31, 2017. Leverage ratio is a non-GAAP financial measure. Refer to section 6.2 “Adjusted Net Debt” of this MD&A for additional information.
Net cash flows from operating activities of $371 million in the third quarter of 2018 versus net cash flow operating activities of $493 million from the third quarter of 2017. Free cash flow of $470 million represented an increase of $146 million from the third quarter of 2017. Free cash is a non-GAAP financial measure. Refer to section 6.4 “Consolidated Cash Flow Movements” of this MD&A for additional information.
Return on invested capital (“ROIC”) for the 12 months ended September 30, 2018 of 12.7% compared to ROIC of 15.3% for the 12 months ended December 31, 2017. This decrease was mainly driven by lower adjusted net income and an increase in long-term debt which was the result of Air Canada’s fleet renewal strategy. ROIC is a non-GAAP financial measure. Refer to section 14 “Non-GAAP Financial Measures” of this MD&A for additional information.
Agreement in Principle for the Acquisition of Aimia’s Aeroplan Loyalty Business
On August 21, 2018, Air Canada, The Toronto-Dominion Bank, Canadian Imperial Bank of Commerce, Visa Canada Corporation (collectively, "the Consortium") and Aimia Inc. ("Aimia") announced that they had entered into an agreement in principle for the acquisition of Aimia's Aeroplan loyalty business.
The aggregate purchase price consists of $450 million in cash and is on a cash-free, debt-free basis and includes the assumption of approximately $1.9 billion of Aeroplan Miles liability.
The transaction is subject to the satisfactory conclusion of definitive transaction documents, Aimia shareholder approval, and certain other conditions, including due diligence, receipt of customary regulatory approvals and completion by the Consortium of credit card loyalty program and network agreements for future participation in Air Canada's new loyalty program. Completion of the transaction is expected by the end of 2018.

Third Quarter 2018 Management’s Discussion and Analysis of Results of Operations and Financial Condition
7
4. RESULTS OF OPERATIONS The following table and discussion provides and compares results of Air Canada for the periods indicated:
(Canadian dollars in millions, except per share figures)
Third Quarter First Nine Months
2018 2017 (1) Change
2018 2017 (1) Change
$ % $ %
Operating revenues Passenger $ 5,018 $ 4,514 $ 504 11 $ 12,428 $ 11,184 $ 1,244 11 Cargo 218 194 24 12 586 510 76 15 Other 179 172 7 4 805 738 67 9 Total operating revenues 5,415 4,880 535 11 13,819 12,432 1,387 11 Operating expenses Aircraft fuel 1,222 832 390 47 3,011 2,192 819 37 Regional airlines expense
Aircraft fuel 149 109 40 37 398 300 98 33 Other 568 553 15 3 1,736 1,642 94 6
Wages, salaries and benefits 743 690 53 8 2,154 1,997 157 8 Airport and navigation fees 281 264 17 6 739 704 35 5 Aircraft maintenance 277 241 36 15 753 695 58 8 Depreciation, amortization and impairment 268 241 27 11 813 711 102 14
Sales and distribution costs 237 232 5 2 625 601 24 4 Ground package costs 86 73 13 18 476 432 44 10 Aircraft rent 137 125 12 10 385 377 8 2 Catering and onboard services 125 112 13 12 329 294 35 12 Communications and IT 79 63 16 25 225 192 33 17 Special items - - - - - 30 (30) (100) Other 403 369 34 9 1,123 1,027 96 9 Total operating expenses 4,575 3,904 671 17 12,767 11,194 1,573 14 Operating income 840 976 (136) 1,052 1,238 (186) Non-operating income (expense) Foreign exchange gain (loss) 89 44 45 (48) 182 (230) Interest income 32 16 16 76 42 34 Interest expense (80) (73) (7) (247) (232) (15) Interest capitalized 7 9 (2) 27 27 - Net financing expense relating to employee benefits (13) (15) 2 (38) (47) 9
Gain on financial instruments recorded at fair value 10 17 (7) 2 24 (22)
Gain on sale and leaseback of assets - - - - 52 (52) Gain (loss) on debt settlements and modifications (1) (3) 2 9 (3) 12
Loss on disposal of assets (2) - (2) (188) - (188) Other (6) (6) - (24) (17) (7) Total non-operating income (expense) 36 (11) 47 (431) 28 (459)
Income before income taxes 876 965 (89) 621 1,266 (645) Income tax (expense) recovery (231) 758 (989) (223) 755 (978) Net income $ 645 $ 1,723 $ (1,078) $ 398 $ 2,021 $ (1,623) Diluted earnings per share $ 2.34 $ 6.22 $ (3.88) $ 1.44 $ 7.29 $ (5.85)
EBITDAR (2) $ 1,265 $ 1,360 $ (95) $ 2,308 $ 2,407 $ (99) Adjusted pre-tax income (2) $ 793 $ 922 $ (129) $ 884 $ 1,088 $ (204) Adjusted net income $ 561 $ 922 $ (361) $ 623 $ 1,088 $ (465) Adjusted earnings per share – diluted (2) $ 2.03 $ 3.33 $ (1.30) $ 2.25 $ 3.91 $ (1.68)
(1) Air Canada adopted accounting standard IFRS 15 - Revenue from Contracts with Customers effective January 1, 2018 with restatement of 2017 amounts which are reflected in the table above. Refer to section 9 “Accounting Policies” of this MD&A for additional information.
(2) EBITDAR, adjusted pre-tax income, adjusted net income and adjusted earnings per share – diluted are non-GAAP financial measures. Refer to section 14 "Non-GAAP Financial Measures" of this MD&A for additional information.

Third Quarter 2018 Management’s Discussion and Analysis of Results of Operations and Financial Condition
8
System Passenger Revenues
With the adoption of IFRS 15 – Revenue from Contracts with Customers effective January 1, 2018, certain passenger and cargo related fees were reclassified from Other revenue to Passenger revenue and Cargo revenue on Air Canada’s consolidated statement of operations, with restatement of 2017 amounts. This reclassification has no impact on total operating revenue. Concurrent with this change in presentation, Air Canada has revised the methodology used to calculate yield and PRASM. These measures are now based on total passenger revenues, with restatement of 2017 amounts on the same basis.
In the third quarter of 2018, system passenger revenues of $5,018 million increased $504 million or 11.2% from the third quarter of 2017 on traffic growth of 7.5% and a yield improvement of 3.4%. On a stage length adjusted basis, yield increased 4.1% when compared to the same quarter in 2017. Business cabin revenues, on a system-basis, increased $98 million or 13.0% from the third quarter of 2017 on traffic and yield growth of 8.9% and 3.7%, respectively.
The table below provides passenger revenue by geographic region for the third quarter of 2018 and the third quarter of 2017.
Passenger Revenue (Canadian dollars in millions)
Third Quarter 2018
Third Quarter 2017 (1)
$ Change
% Change
Canada $ 1,427 $ 1,368 $ 59 4.3
U.S. transborder 946 862 84 9.7
Atlantic 1,617 1,344 273 20.3
Pacific 787 717 70 9.9
Other 241 223 18 7.9
System $ 5,018 $ 4,514 $ 504 11.2 (1) Air Canada adopted accounting standard IFRS 15 - Revenue from Contracts with Customers effective January 1, 2018
with restatement of 2017 amounts which are reflected in the table above. Refer to section 9 “Accounting Policies” of this MD&A for additional information.
The table below provides year-over-year percentage changes in passenger revenues and operating statistics for the third quarter of 2018 versus the third quarter of 2017.
Third Quarter 2018 versus
Third Quarter 2017 (1)
Passenger Revenue
% Change
Capacity (ASMs)
% Change
Traffic (RPMs)
% Change
Passenger Load Factor pp Change
Yield
% Change
PRASM
% Change
Canada 4.3 4.3 3.4 (0.7) 0.9 -
U.S. transborder 9.7 5.9 5.6 (0.3) 3.8 3.5
Atlantic 20.3 10.3 13.1 2.2 6.4 9.1
Pacific 9.9 1.1 2.9 1.5 6.8 8.6
Other 7.9 16.8 11.1 (4.3) (2.8) (7.6)
System 11.2 6.7 7.5 0.6 3.4 4.2
(1) Air Canada adopted accounting standard IFRS 15 - Revenue from Contracts with Customers effective January 1, 2018 with restatement of 2017 amounts which are reflected in the table above. Refer to section 9 “Accounting Policies” of this MD&A for additional information.

Third Quarter 2018 Management’s Discussion and Analysis of Results of Operations and Financial Condition
9
The table below provides year-over-year percentage changes in system passenger revenues and operating statistics for the third quarter of 2018 and each of the previous four quarters.
System
Year-over-Year by Quarter (% Change)
Q3’17 (1) Q4’17 (1) Q1’18 Q2’18 Q3’18
Passenger revenues 9.1 11.4 11.8 10.4 11.2
Capacity (ASMs) 9.1 9.5 8.6 7.5 6.7
Traffic (RPMs) 8.8 9.9 11.4 8.2 7.5
Passenger load factor (pp change) (0.2) 0.3 2.1 0.5 0.6
Yield 0.4 1.4 0.4 2.0 3.4
PRASM 0.1 1.8 3.0 2.7 4.2
(1) To provide a more meaningful comparison, the year-over-year percentage comparisons from 2017 quarters to 2016 quarters are based on previously reported 2016 and 2017 amounts as 2016 amounts have not been restated for the adoption of IFRS 15.
Components of the year-over-year change in third quarter system passenger revenues included:
The 7.5% traffic increase which reflected traffic growth in all markets and included gains in the business and premium economy cabins. Consistent with the airline’s objective of increasing global international-to-international connecting traffic through its major Canadian hubs (sixth freedom traffic), the traffic growth in the third quarter of 2018 reflected an increase in connecting traffic via Canada to international destinations.
The 3.4% system yield increase which reflected:
o increases in fares and carrier surcharges, growth in high-yielding local traffic, and an improvement in the overall fare mix;
o greater proportional growth of high-yielding business and premium economy class passengers;
o an increase in ancillary revenues, including through advance seat selection/preferred seating fees and airport paid upgrades;
o the introduction of an expanded suite of fare offerings on domestic, U.S. transborder and Atlantic services, resulting in growth in ancillary revenue and an improved fare mix; and
o a favourable currency impact of $11 million when compared to the third quarter of 2017.
These factors were partly offset by an increase in average stage length of 1.3%, due to long-haul international expansion, which had the effect of reducing system yield by 0.7 percentage points.
Third Quarter 2018 Management’s Discussion and Analysis of Results of Operations and Financial Condition
10
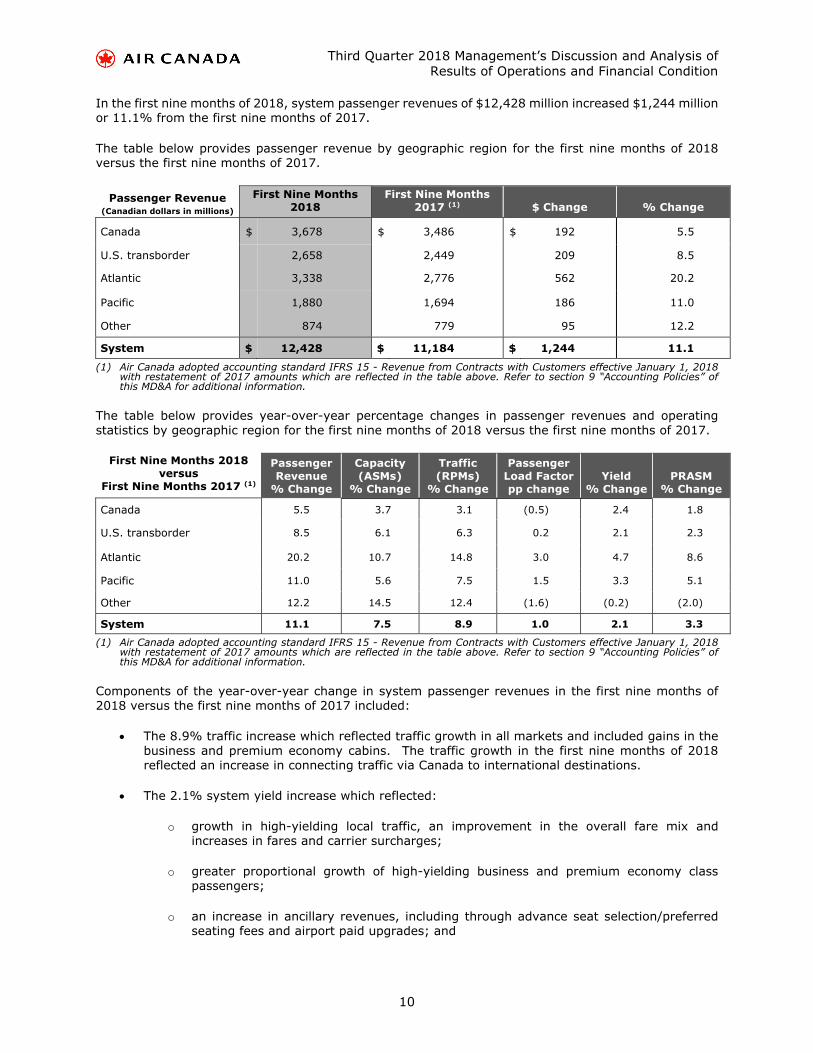
In the first nine months of 2018, system passenger revenues of $12,428 million increased $1,244 million or 11.1% from the first nine months of 2017.
The table below provides passenger revenue by geographic region for the first nine months of 2018 versus the first nine months of 2017.
Passenger Revenue (Canadian dollars in millions)
First Nine Months 2018
First Nine Months 2017 (1) $ Change % Change
Canada $ 3,678 $ 3,486 $ 192 5.5
U.S. transborder 2,658 2,449 209 8.5
Atlantic 3,338 2,776 562 20.2
Pacific 1,880 1,694 186 11.0
Other 874 779 95 12.2
System $ 12,428 $ 11,184 $ 1,244 11.1
(1) Air Canada adopted accounting standard IFRS 15 - Revenue from Contracts with Customers effective January 1, 2018 with restatement of 2017 amounts which are reflected in the table above. Refer to section 9 “Accounting Policies” of this MD&A for additional information.
The table below provides year-over-year percentage changes in passenger revenues and operating statistics by geographic region for the first nine months of 2018 versus the first nine months of 2017.
First Nine Months 2018 versus
First Nine Months 2017 (1)
Passenger Revenue
% Change
Capacity (ASMs)
% Change
Traffic (RPMs)
% Change
Passenger Load Factor pp change
Yield
% Change
PRASM
% Change
Canada 5.5 3.7 3.1 (0.5) 2.4 1.8
U.S. transborder 8.5 6.1 6.3 0.2 2.1 2.3
Atlantic 20.2 10.7 14.8 3.0 4.7 8.6
Pacific 11.0 5.6 7.5 1.5 3.3 5.1
Other 12.2 14.5 12.4 (1.6) (0.2) (2.0)
System 11.1 7.5 8.9 1.0 2.1 3.3
(1) Air Canada adopted accounting standard IFRS 15 - Revenue from Contracts with Customers effective January 1, 2018 with restatement of 2017 amounts which are reflected in the table above. Refer to section 9 “Accounting Policies” of this MD&A for additional information.
Components of the year-over-year change in system passenger revenues in the first nine months of 2018 versus the first nine months of 2017 included:
The 8.9% traffic increase which reflected traffic growth in all markets and included gains in the business and premium economy cabins. The traffic growth in the first nine months of 2018 reflected an increase in connecting traffic via Canada to international destinations.
The 2.1% system yield increase which reflected:
o growth in high-yielding local traffic, an improvement in the overall fare mix and increases in fares and carrier surcharges;
o greater proportional growth of high-yielding business and premium economy class passengers;
o an increase in ancillary revenues, including through advance seat selection/preferred seating fees and airport paid upgrades; and

Third Quarter 2018 Management’s Discussion and Analysis of Results of Operations and Financial Condition
11
o the introduction of an expanded suite of fare offerings on domestic and U.S. transborder services, resulting in growth in ancillary revenue and an improved fare mix.
These factors were partly offset by the following:
o an increase in average stage length of 2.4%, due to long-haul international expansion, which had the effect of reducing system yield by 1.4 percentage points; and
o an unfavourable currency impact of $37 million when compared to the first nine months of 2017.
Domestic Passenger Revenues
In the third quarter of 2018, domestic passenger revenues of $1,427 million increased $59 million or 4.3% from the third quarter of 2017.
The table below provides year-over-year percentage changes in domestic passenger revenues and operating statistics for the third quarter of 2018 and each of the previous four quarters.
Canada Year-over-Year by Quarter (% Change)
Q3’17 (1) Q4’17 (1) Q1’18 Q2’18 Q3’18
Passenger revenues 3.0 5.4 5.9 6.6 4.3
Capacity (ASMs) 1.5 1.4 3.4 3.2 4.3
Traffic (RPMs) 1.0 1.6 3.0 2.6 3.4
Passenger load factor (pp change) (0.4) 0.2 (0.3) (0.5) (0.7)
Yield 2.2 3.5 2.8 3.9 0.9
PRASM 1.7 3.8 2.5 3.2 - (1) To provide a more meaningful comparison, the year-over-year percentage comparisons from 2017 quarters to 2016
quarters are based on previously reported 2016 and 2017 amounts as 2016 amounts have not been restated for the adoption of IFRS 15.
Components of the year-over-year change in third quarter domestic passenger revenues included:
The 3.4% traffic increase which reflected traffic growth on all major domestic services as well as incremental connecting traffic to international destinations. The traffic growth in the third quarter of 2018 also included gains in the business cabin.
The 0.9% yield increase which reflected yield improvements on all major domestic services with the exception of transcontinental routes, linking Toronto, Montreal and Ottawa with major western Canadian cities, which were impacted by competitive pricing activities on point-to-point markets within Canada, particularly in the month of July. The overall yield improvement versus the third quarter of 2017 reflected gains in the business cabin as well as the impact of new fare categories on domestic services, resulting in growth in ancillary revenue and an improved fare mix.
In the first nine months of 2018, domestic passenger revenues of $3,678 million increased $192 million or 5.5% from the first nine months of 2017 on traffic growth of 3.1% and a yield improvement of 2.4%.

Third Quarter 2018 Management’s Discussion and Analysis of Results of Operations and Financial Condition
12
U.S. Transborder Passenger Revenues
In the third quarter of 2018, U.S. transborder passenger revenues of $946 million increased $84 million or 9.7% from the third quarter of 2017.
The table below provides year-over-year percentage changes in U.S. transborder passenger revenues and operating statistics for the third quarter of 2018 and each of the previous four quarters.
U.S. transborder Year-over-Year by Quarter (% Change)
Q3’17 (1) Q4’17 (1) Q1’18 Q2’18 Q3’18
Passenger revenues 8.0 6.3 6.9 8.9 9.7
Capacity (ASMs) 10.9 6.7 5.5 6.8 5.9
Traffic (RPMs) 9.3 7.1 6.7 6.6 5.6
Passenger load factor (pp change) (1.2) 0.3 0.9 (0.1) (0.3)
Yield (1.0) (0.7) 0.1 2.2 3.8
PRASM (2.4) (0.3) 1.3 2.0 3.5 (1) To provide a more meaningful comparison, the year-over-year percentage comparisons from 2017 quarters to 2016
quarters are based on previously reported 2016 and 2017 amounts as 2016 amounts have not been restated for the adoption of IFRS 15.
Components of the year-over-year change in third quarter U.S. transborder passenger revenues included:
The 5.6% traffic increase which reflected traffic growth on all major U.S. transborder services with the exception of Las Vegas and Hawaii where capacity was reduced year-over-year. The traffic increase in the third quarter of 2018 reflected strong passenger demand between Canada and the U.S., gains in the business cabin, and growth in international-to-international connecting passenger flows from the U.S.
The 3.8% yield increase which reflected yield growth on all major U.S. transborder services with the exception of U.S. short-haul routes where yields were slightly below the third quarter of 2017. The launch of new fare categories on U.S. transborder services, resulting in growth in ancillary revenue and an improved fare mix, contributed to the overall yield improvement year-over-year.
In the first nine months of 2018, U.S. transborder passenger revenues of $2,658 million increased $209 million or 8.5% from the first nine months of 2017 on traffic and yield growth of 6.3% and 2.1%, respectively.

Third Quarter 2018 Management’s Discussion and Analysis of Results of Operations and Financial Condition
13
Atlantic Passenger Revenues
In the third quarter of 2018, Atlantic passenger revenues of $1,617 million increased $273 million or 20.3% from the third quarter of 2017.
The table below provides year-over-year percentage changes in Atlantic passenger revenues and operating statistics for the third quarter of 2018 and each of the previous four quarters.
Atlantic Year-over-Year by Quarter (% Change)
Q3’17 (1) Q4’17 (1) Q1’18 Q2’18 Q3’18
Passenger revenues 17.7 22.2 23.9 17.8 20.3
Capacity (ASMs) 13.3 13.9 9.6 11.9 10.3
Traffic (RPMs) 13.7 14.4 17.5 15.5 13.1
Passenger load factor (pp change) 0.3 0.3 5.4 2.6 2.2
Yield 3.5 6.8 5.4 1.9 6.4
PRASM 3.9 7.3 13.0 5.3 9.1 (1) To provide a more meaningful comparison, the year-over-year percentage comparisons from 2017 quarters to 2016
quarters are based on previously reported 2016 and 2017 amounts as 2016 amounts have not been restated for the adoption of IFRS 15.
Components of the year-over-year change in third quarter Atlantic passenger revenues included:
The 13.1% traffic increase which reflected traffic growth on all major Atlantic services and included gains in all cabins. The capacity growth year-over-year was largely due to the launch of new services from Vancouver to France and Switzerland; from Toronto to Ireland, Portugal, Romania and Croatia; and from Montreal to Ireland, Romania and Portugal, as well as increased frequencies on existing routes.
The 6.4% yield increase which reflected yield improvements on all major Atlantic services and included an increase in carrier surcharges year-over-year and a favourable currency impact of $8 million. The launch of a new fare category on Atlantic services, resulting in growth in ancillary revenue and an improved fare mix, also contributed to the overall yield improvement year-over-year. An increase in average stage length of 1.3%, which had the effect of reducing Atlantic yield by 0.8 percentage points, was an offsetting factor.
In the first nine months of 2018, Atlantic passenger revenues of $3,338 million increased $562 million or 20.2% from the first nine months of 2017 on traffic and yield growth of 14.8% and 4.7%, respectively.

Third Quarter 2018 Management’s Discussion and Analysis of Results of Operations and Financial Condition
14
Pacific Passenger Revenues
In the third quarter of 2018, Pacific passenger revenues of $787 million increased $70 million or 9.9% from the third quarter of 2017.
The table below provides year-over-year percentage changes in Pacific passenger revenues and operating statistics for the third quarter of 2018 and each of the previous four quarters.
Pacific Year-over-Year by Quarter (% Change)
Q3’17 (1) Q4’17 (1) Q1’18 Q2’18 Q3’18
Passenger revenues 5.7 13.5 14.2 9.9 9.9
Capacity (ASMs) 10.1 12.2 12.0 5.2 1.1
Traffic (RPMs) 9.4 13.7 15.9 5.7 2.9
Passenger load factor (pp change) (0.6) 1.0 2.8 0.4 1.5
Yield (3.4) (0.2) (1.5) 4.0 6.8
PRASM (4.0) 1.1 1.9 4.5 8.6 (1) To provide a more meaningful comparison, the year-over-year percentage comparisons from 2017 quarters to 2016
quarters are based on previously reported 2016 and 2017 amounts as 2016 amounts have not been restated for the adoption of IFRS 15.
Components of the year-over-year change in third quarter Pacific passenger revenues included:
The 2.9% traffic increase which reflected traffic growth on all major Pacific services with the exception of services to Japan where capacity was reduced year-over-year. The traffic growth included gains in the business and premium economy cabins.
The 6.8% yield increase which reflected yield growth on all major Pacific services with the exception of Australia which was impacted by increased industry capacity. The overall Pacific yield improvement versus the third quarter of 2017 included an increase in carrier surcharges year-over-year and a favourable currency impact of $4 million.
In the first nine months of 2018, Pacific passenger revenues of $1,880 million increased $186 million or 11.0% from the first nine months of 2017 on traffic and yield growth of 7.5% and 3.3%, respectively.

Third Quarter 2018 Management’s Discussion and Analysis of Results of Operations and Financial Condition
15
Other Passenger Revenues
In the third quarter of 2018, Other passenger revenues (from routes to and from the Caribbean, Mexico and Central and South America) of $241 million increased $18 million or 7.9% from the third quarter of 2017.
The table below provides year-over-year percentage changes in Other passenger revenues and operating statistics for the third quarter of 2018 and each of the previous four quarters.
Other Year-over-Year by Quarter (% Change)
Q3’17 (1) Q4’17 (1) Q1’18 Q2’18 Q3’18
Passenger revenues 15.3 23.7 17.7 7.6 7.9
Capacity (ASMs) 8.4 18.7 15.0 11.7 16.8
Traffic (RPMs) 10.1 17.9 15.6 8.6 11.1 Passenger load factor (pp change) 1.4 (0.6) 0.4 (2.4) (4.3)
Yield 4.4 4.8 1.9 (0.9) (2.8)
PRASM 6.1 4.1 2.4 (3.7) (7.6) (1) To provide a more meaningful comparison, the year-over-year percentage comparisons from 2017 quarters to 2016
quarters are based on previously reported 2016 and 2017 amounts as 2016 amounts have not been restated for the adoption of IFRS 15.
Components of the year-over-year change in third quarter Other passenger revenues included:
The 11.1% traffic increase which reflected traffic growth on services to South America and on routes to traditional sun destinations. The traffic growth in the third quarter of 2018 included gains in all cabins.
The 2.8% yield decline which reflected yield decreases on services to South America and Mexico. These decreases were largely offset by yield growth on services to the Caribbean when compared to the third quarter of 2017. The yield decline on services to South America was mainly due a significant increase in average stage length due to the removal of the short-haul tag between Santiago and Buenos Aires as Air Canada now serves both markets on a non-stop basis. On a stage length adjusted basis, overall yield for the Other markets was unchanged from the third quarter of 2017.
In the first nine months of 2018, Other passenger revenues of $874 million increased $95 million or 12.2% from the first nine months of 2017 on traffic growth of 12.4%.
Cargo Revenues
Cargo revenues of $218 million in the third quarter of 2018 and $586 million in the first nine months of 2018 increased $24 million or 12.3% and $76 million and 15.0%, respectively, from the same periods in 2017. When compared to the 2017 periods, cargo yield and traffic increased 10.6% and 1.6%, respectively, in the third quarter of 2018, and 8.6% and 5.9%, respectively, in the first nine months of 2018. In the third quarter and the first nine months of 2018, the Atlantic and Pacific markets experienced particularly strong performances from both a yield and traffic perspective.

Third Quarter 2018 Management’s Discussion and Analysis of Results of Operations and Financial Condition
16
The table below provides cargo revenue by geographic region for the periods indicated.
Cargo revenue (Canadian dollars in millions)
Third Quarter First Nine Months
2018 2017 (1) Change 2018 2017 (1) Change $ % $ %
Canada $ 25 $ 23 $ 2 9.4 $ 68 $ 61 $ 7 11.3
U.S. transborder 12 11 1 4.8 31 29 2 7.5
Atlantic 74 68 6 10.5 206 179 27 15.6
Pacific 91 78 13 16.9 237 199 38 18.8
Other 16 14 2 6.8 44 42 2 4.8
System $ 218 $ 194 $ 24 12.3 $ 586 $ 510 $ 76 15.0
(1) Air Canada adopted accounting standard IFRS 15 - Revenue from Contracts with Customers effective January 1, 2018 with restatement of 2017 amounts which are reflected in the table above. Refer to section 9 “Accounting Policies” of this MD&A for additional information.
Other Revenues
Other revenues of $179 million in the third quarter of 2018 increased $7 million or 4% when compared to the third quarter of 2017, mainly driven by growth in ground package revenue at Air Canada Vacations. The increase in ground package revenue at Air Canada Vacations was primarily driven by a higher price of ground packages and, to a lesser extent, higher passenger volumes when compared to the third quarter of 2017.
Other revenues of $805 million in the first nine months of 2018 increased $67 million or 9% from the same period in 2017, primarily due to growth in ground package revenue at Air Canada Vacations on higher passenger volumes and, to a lesser extent, a higher price of ground packages.

Third Quarter 2018 Management’s Discussion and Analysis of Results of Operations and Financial Condition
17
CASM and Adjusted CASM
In the third quarter of 2018, CASM increased 9.8% and adjusted CASM increased 1.1% when compared to the third quarter of 2017. In the first nine months of 2018, CASM increased 6.1% and adjusted CASM increased 0.2% versus the same period in 2017. The following table compares Air Canada’s CASM and adjusted CASM for the periods indicated.
(cents per ASM)
Third Quarter First Nine Months
2018 2017 (1) Change 2018 2017 (1) Change ¢ % ¢ %
Aircraft fuel 3.69 2.68 1.01 37.6 3.53 2.76 0.77 27.8 Regional airlines expense
Aircraft fuel 0.45 0.35 0.10 28.1 0.47 0.38 0.09 23.5 Other 1.72 1.78 (0.06) (3.8) 2.04 2.07 (0.03) (1.7)
Wages and salaries 1.72 1.73 (0.01) (0.5) 1.90 1.91 (0.01) (0.6) Benefits 0.53 0.50 0.03 5.8 0.63 0.61 0.02 3.2 Airport and navigation fees 0.85 0.85 - 0.2 0.87 0.89 (0.02) (2.3) Aircraft maintenance 0.84 0.77 0.07 7.8 0.88 0.88 - 0.8
Depreciation, amortization and impairment 0.81 0.78 0.03 4.4 0.95 0.90 0.05 6.3
Sales and distribution costs 0.72 0.75 (0.03) (4.0) 0.73 0.76 (0.03) (3.2)
Ground package costs 0.26 0.23 0.03 11.5 0.56 0.54 0.02 2.6 Aircraft rent 0.41 0.40 0.01 2.2 0.45 0.48 (0.03) (5.2) Catering and onboard services 0.38 0.36 0.02 3.5 0.39 0.37 0.02 3.9
Communications and IT 0.24 0.20 0.04 17.0 0.26 0.24 0.02 9.1 Special items - - - - - 0.04 (0.04) (100.0) Other 1.19 1.19 - - 1.31 1.29 0.02 -
CASM 13.81 12.57 1.24 9.8 14.97 14.12 0.85 6.1 Remove: Aircraft fuel expense (2), ground package costs at Air Canada Vacations and special items
(4.40) (3.26) (1.14) (34.7) (4.56) (3.73) (0.83) (22.4)
Adjusted CASM (3) 9.41 9.31 0.10 1.1 10.41 10.39 0.02 0.2 (1) Air Canada adopted accounting standard IFRS 15 - Revenue from Contracts with Customers effective January 1, 2018 with
restatement of 2017 amounts which are reflected in the table above. Refer to section 9 “Accounting Policies” of this MD&A for additional information.
(2) Includes aircraft fuel expense related to regional airline operations. (3) Adjusted CASM is a non-GAAP financial measure. Refer to section 14 “Non-GAAP Financial Measures” of this MD&A for
additional information.
Operating Expenses
In the third quarter of 2018, operating expenses of $4,575 million increased $671 million or 17% from the third quarter of 2017 on capacity growth of 6.7%. In the third quarter of 2018, the unfavourable impact of a weaker Canadian dollar on foreign currency denominated operating expenses (mainly U.S. dollars), compared to the third quarter of 2017, increased operating expenses by $82 million (comprised of $55 million related to aircraft fuel expense and an aggregate of $27 million relating to non-fuel operating expenses).
In the first nine months of 2018, operating expenses of $12,767 million increased $1,573 million or 14% from the first nine months of 2017 on capacity growth of 7.5%. In the first nine months of 2018, the favourable impact of a stronger Canadian dollar on foreign currency denominated operating expenses (mainly U.S. dollars), compared to the first nine months of 2017, decreased operating expenses by $41 million.

Third Quarter 2018 Management’s Discussion and Analysis of Results of Operations and Financial Condition
18
The more notable components of the year-over-year change in operating expenses are described below.
Aircraft Fuel Expense
In the third quarter of 2018, aircraft fuel expense (including fuel expense related to regional airline operations) amounted to $1,371 million, an increase of $430 million or 45.7% from the third quarter of 2017. This increase reflected:
higher jet fuel prices (before the impact of foreign exchange), which accounted for an increase of $324 million;
an unfavourable currency impact of $55 million;
a higher volume of fuel litres consumed, which accounted for an increase of $40 million; and
other factors, which accounted for an increase of $11 million.
In the first nine months of 2018, aircraft fuel expense (including fuel expense related to regional airline operations) amounted to $3,409 million, an increase of $917 million or 36.8% from the first nine months of 2017. This increase reflected:
higher jet fuel prices (before the impact of foreign exchange), which accounted for an increase of $767 million;
a higher volume of fuel litres consumed, which accounted for an increase of $138 million; and
other factors, which accounted for an increase of $12 million.
Regional Airlines Expense
In the third quarter of 2018, regional airlines expense of $717 million increased $55 million or 8% when compared to the third quarter of 2017, reflecting, in large part, higher aircraft fuel expense year-over-year. In the first nine months of 2018, regional airlines expense of $2,134 million increased $192 million or 10% when compared to the first nine months of 2017. This increase reflected higher aircraft fuel expenses year-over-year, higher CPA rates versus the same period in 2017, and the impact of increased flying, particularly in the first quarter of 2018. The growth in capacity purchase fees in the first nine months of 2018 was also due to a higher volume of engine maintenance activity in the second quarter of 2018. A favourable currency impact was a partly offsetting factor.
The following table provides a breakdown of regional airlines expense for the periods indicated:
(Canadian dollars in millions)
Third Quarter First Nine Months
2018 2017 Change 2018 2017 Change $ % $ %
Capacity purchase fees $ 318 $ 315 $ 3 1 $ 997 $ 937 $ 60 6
Aircraft fuel 149 109 40 37 398 300 98 33 Airport and navigation fees 78 80 (2) (3) 223 222 1 - Sales and distribution costs 44 34 10 29 119 111 8 7 Depreciation, amortization and impairment 9 8 1 13 27 21 6 29
Aircraft rent 11 10 1 10 31 30 1 3 Other 108 106 2 2 339 321 18 6
Total regional airlines expense $ 717 $ 662 $ 55 8 $ 2,134 $ 1,942 $ 192 10

Third Quarter 2018 Management’s Discussion and Analysis of Results of Operations and Financial Condition
19
Wages, Salaries and Benefits Expense
Wages and salaries expense of $569 million in the third quarter of 2018 and $1,617 million in the first nine months of 2018 increased $33 million or 6% and $104 million or 7%, respectively, from the same periods in 2017. These increases were largely due to a higher number of full-time equivalent (“FTE”) employees, largely in support of the airline’s capacity growth and international expansion strategy.
Employee benefits expense of $174 million in the third quarter of 2018 and $537 million in the first nine months of 2018 increased $20 million or 13% and $53 million or 11%, respectively, from the same periods in 2017. These increases were mainly due to the higher level of FTE employees and the impact of lower discount rates which increased the current service cost of defined benefit pension plans.
Airport and Navigation Fees
Airport and navigation fees of $281 million in the third quarter of 2018 and $739 million in the first nine months of 2018 increased $17 million or 6% and $35 million or 5%, respectively, from the same periods in 2017. These increases were largely due to growth in wide-body and international flying. The favourable impact of Air Canada’s agreement with the Greater Toronto Airports Authority, which is allowing the airline to increase international connecting traffic at Toronto Pearson International Airport on a more cost-effective basis, and a 3.9% Nav Canada rate reduction effective September 1, 2017, were offsetting factors.
Aircraft Maintenance Expense
In the third quarter of 2018, aircraft maintenance expense of $277 million increased $36 million or 15% from the third quarter of 2017, mainly due to a higher level of maintenance activity, largely relating to engines, in the third quarter of 2018 versus the third quarter of 2017.
In the first nine months of 2018, aircraft maintenance expense of $753 million increased $58 million or 8% from the first nine months of 2017, mainly due to a higher level of engine maintenance activity year-over-year. This increase was partly offset by the impact of having a greater number of aircraft leases being extended in the first half of 2018 versus the same period in 2017, the impact of having negotiated more favourable end-of-lease conditions on aircraft lease extensions, and a favourable currency impact.
The following table provides a breakdown of the more significant items included in maintenance expense for the periods indicated:
(Canadian dollars in millions)
Third Quarter First Nine Months
2018 2017 Change 2018 2017 Change $ % $ %
Technical maintenance $ 244 $ 203 $ 41 20 $ 701 $ 618 $ 83 13
Maintenance provisions (1) 30 35 (5) (13) 34 69 (35) (50)
Other 3 3 - - 18 8 10 125
Total aircraft maintenance expense $ 277 $ 241 $ 36 15 $ 753 $ 695 $ 58 8
(1) Maintenance provisions relate to return conditions on aircraft leases which are recorded over the term of the lease.
Depreciation, Amortization and Impairment Expense
Depreciation, amortization and impairment expense of $268 million in the third quarter of 2018 and $813 million in the first nine months of 2018 increased $27 million or 11% and $102 million or 14%, respectively, from the same periods in 2017. These increases were largely due to the addition of Boeing 787 and 737 MAX aircraft into the mainline fleet. The sale of 25 Embraer 190 aircraft (which Air Canada leased back), in August 2018, was an offsetting factor.

Third Quarter 2018 Management’s Discussion and Analysis of Results of Operations and Financial Condition
20
Sales and Distribution Costs
Sales and distribution costs of $237 million in the third quarter of 2018 and $625 million in the first nine months of 2018 increased $5 million or 2% and $24 million or 4%, respectively, from the same periods in 2017. These increases reflected, in large part, the growth in passenger revenue. The favourable impact of new commission programs introduced in North America in April 2018 and growth in direct bookings when compared to the same periods in 2017 were offsetting factors.
Ground Package Costs
In the third quarter of 2018, the cost of ground packages at Air Canada Vacations of $86 million increased $13 million or 18% when compared to the third quarter of 2017. This increase was due to a higher cost of ground packages (before the impact of foreign exchange) reflecting, in large part, a change in product mix and, to a lesser extent, higher passenger volumes year-over-year.
In the first nine months of 2018, the cost of ground packages at Air Canada Vacations of $476 million increased $44 million or 10% from the same period in 2017. This increase reflected higher passenger volumes and, to a lesser extent, a higher cost of ground packages (before the impact of foreign exchange) when compared to the first nine months of 2017. A favourable currency impact was a partly offsetting factor.
Aircraft Rent
Aircraft rent expense of $137 million in the third quarter of 2018 and $385 million in the first nine months of 2018 increased $12 million or 10% and $8 million or 2%, respectively, from the same periods in 2017. These increases reflected, in large part, the impact of a greater number of leased aircraft, including 25 Embraer 190 aircraft which Air Canada sold and leased back in August 2018. The impact of lower rates on certain lease renewals and a favourable currency impact in the first nine months of 2018 were offsetting factors.
Special Items
In the first quarter of 2017, Air Canada recorded a provision of $30 million relating to a fine which was reinstated by a decision of the European Commission pertaining to cargo investigations. Air Canada paid the fine in the second quarter of 2017. Air Canada has appealed the decision. While Air Canada cannot predict with certainty the outcome of its appeal or any related proceedings, Air Canada believes it has reasonable grounds to challenge the European Commission’s ruling. Refer to “Current legal proceedings’ under section 18 “Risk Factors” of Air Canada’s 2017 MD&A for additional information.

Third Quarter 2018 Management’s Discussion and Analysis of Results of Operations and Financial Condition
21
Other Expenses
Other expenses of $403 million in the third quarter of 2018 and $1,123 million in the first nine months of 2018 increased $34 million or 9% and $96 million or 9%, respectively, from the same periods in 2017. These increases reflected, in large part, the capacity growth and Air Canada’s international expansion strategy, as well as an increase in customer service expense reflecting, in part, the impact of operational disruptions caused by severe weather, particularly in the first half of 2018. In addition, the first quarter of 2018 included expenses of $26 million related to new uniforms.
The following table provides a breakdown of the more significant items included in other expenses:
(Canadian dollars in millions)
Third Quarter First Nine Months
2018 2017 Change 2018 2017 Change $ % $ %
Terminal handling $ 94 $ 86 $ 8 9 $ 250 $ 227 $ 23 10
Crew cycle 62 55 6 11 160 146 13 9
Building rent and maintenance 44 41 3 7 129 126 3 2
Miscellaneous fees and services 46 45 1 2 123 119 4 3
Remaining other expenses 157 142 16 11 461 409 53 13
Total other expenses $ 403 $ 369 $ 34 9 $ 1,123 $ 1,027 $ 96 9
Non-operating Income (Expense)
In the third quarter of 2018, non-operating income amounted to $36 million versus non-operating expense of $11 million in the third quarter of 2017. In the first nine months of 2018, non-operating expense amounted to $431 million versus non-operating income of $28 million in the first nine months of 2017.
Components of the year-over-year change in non-operating income (expense) included:
In the third quarter of 2018, gains on foreign exchange amounted to $89 million compared to gains on foreign exchange of $44 million in the third quarter of 2017. The foreign exchange gains in the third quarter of 2018 were mainly related to the revaluation of U.S. denominated long-term debt and finance leases. The September 30, 2018 closing exchange rate was US$1=C$1.2908 while the June 30, 2018 closing exchange rate was US$1=C$1.3133. In the first nine months of 2018, losses on foreign exchange amounted to $48 million compared to gains on foreign exchange of $182 million in the first nine months of 2017. Foreign exchange losses on U.S. denominated long-term debt of $168 million were partly offset by foreign exchange gains on foreign currency derivatives of $169 million. The foreign exchange losses in the first nine months of 2018 were attributable to a weaker Canadian dollar at September 30, 2018 when compared to December 31, 2017. The December 31, 2017 closing exchange rate was US$1=C$1.2571.
In the first nine months of 2017, Air Canada recorded a gain of $52 million on the sale and leaseback of four Boeing 787-9 aircraft. No such gains were recorded in the first nine months of 2018.
In the first nine months of 2018, Air Canada recorded a gain of $11 million on debt modifications related to the repricing (in February 2018) of the airline’s US$1.1 billion senior secured credit facility. No such gains were recorded in the first nine months of 2017.
In the first nine months of 2018, Air Canada recorded a loss on disposal of assets of $188 million related to the sale of 25 Embraer 190 aircraft. No such loss was recorded in the first nine months of 2017. Air Canada realized net proceeds from the sale of these aircraft of $293 million in the third quarter of 2018.

Third Quarter 2018 Management’s Discussion and Analysis of Results of Operations and Financial Condition
22
5. FLEET
The table below provides the number of aircraft in Air Canada’s operating fleet as at September 30, 2018 and December 31, 2017 as well as Air Canada’s planned operating fleet, including aircraft operating and expected to be operated by Air Canada Rouge, as at December 31, 2018 and December 31, 2019.
Actual Planned
Mainline Dec
emb
er 3
1,
20
17
Firs
t N
ine
Mo
nth
s 2
01
8 F
leet
Ch
ang
es
Sep
tem
ber
30
, 2
01
8
Rem
ain
der
of
20
18
Fl
eet
Ch
ang
es
Dec
emb
er 3
1,
20
18
20
19
Fle
et C
han
ges
Dec
emb
er 3
1,
20
19
Wide-body Aircraft
Boeing 787-8 8 - 8 - 8 - 8
Boeing 787-9 22 5 27 - 27 2 29
Boeing 777-300ER 19 - 19 - 19 - 19
Boeing 777-200LR 6 - 6 - 6 - 6
Boeing 767-300ER 10 (4) 6 - 6 (6) -
Airbus A330-300 8 - 8 - 8 4 12
Narrow-body Aircraft
Boeing 737 MAX 8 2 16 18 - 18 18 36
Airbus A321 15 - 15 - 15 - 15
Airbus A320 42 - 42 - 42 (13) 29
Airbus A319 18 (2) 16 - 16 - 16
Airbus A220-300 - - - - - 1 1
Embraer 190 25 (3) 22 (3) 19 (5) 14
Total Mainline 175 12 187 (3) 184 1 185
Air Canada Rouge
Wide-body Aircraft
Boeing 767-300ER 24 1 25 - 25 - 25
Narrow-body Aircraft
Airbus A321 5 1 6 - 6 - 6
Airbus A320 - - - - - 3 3
Airbus A319 20 2 22 - 22 - 22
Total Air Canada Rouge 49 4 53 - 53 3 56
Total Wide-body Aircraft 97 2 99 - 99 - 99
Total Narrow-body Aircraft 127 14 141 (3) 138 4 142
Total Mainline and Air Canada Rouge
224 16 240 (3) 237 4 241

Third Quarter 2018 Management’s Discussion and Analysis of Results of Operations and Financial Condition
23
Sale of Embraer 190 Aircraft
In August 2018, Air Canada finalized the sale and leaseback of 25 Embraer 190 aircraft. Air Canada will continue to operate these until they gradually exit the fleet between 2018 to 2020.
Air Canada Express
The table below provides, as at September 30, 2018, the number of aircraft operated, on behalf of Air Canada, by Jazz, Sky Regional and other airlines operating flights under the Air Canada Express banner pursuant to capacity purchase agreements with Air Canada. No changes are expected to the Air Canada Express fleet between September 30, 2018 and December 31, 2018.
As at September 30, 2018
Jazz Sky Regional Other Total
Embraer 175 - 25 - 25
Bombardier CRJ-100/200 10 - 14 24
Bombardier CRJ-705/900 21 - - 21
Bombardier Dash 8-100 15 - - 15
Bombardier Dash 8-300 26 - - 26
Bombardier Dash 8-Q400 44 - - 44
Total Air Canada Express 116 25 14 155
Other Aircraft with CPA Carriers
Air Georgian and EVAS also operate a total of 14 18-passenger Beech 1900 aircraft on behalf of Air Canada pursuant to their capacity purchase agreements with Air Canada.

Third Quarter 2018 Management’s Discussion and Analysis of Results of Operations and Financial Condition
24
6. FINANCIAL AND CAPITAL MANAGEMENT
6.1. Financial Position
The following table provides a condensed consolidated statement of financial position of Air Canada as at September 30, 2018 and as at December 31, 2017:
(Canadian dollars in millions) September 30, 2018 December 31, 2017 (1) $ Change
Assets
Cash, cash equivalents and short-term investments $ 4,922 $ 3,804 $ 1,118
Other current assets 1,672 1,593 79
Current assets $ 6,594 $ 5,397 $ 1,197
Deposits and other assets 416 465 (49)
Property and equipment 9,810 9,252 558
Pension assets 2,243 1,583 660
Deferred income tax 32 456 (424)
Intangible assets 371 318 53
Goodwill 311 311 -
Total assets $ 19,777 $ 17,782 $ 1,995
Liabilities
Current liabilities $ 5,221 $ 5,101 $ 120
Long-term debt and finance leases 6,246 5,448 798
Pension and other benefit liabilities 2,447 2,592 (145)
Maintenance provisions 1,058 1,003 55
Other long-term liabilities 145 167 (22)
Deferred income tax 110 49 61
Total liabilities $ 15,227 $ 14,360 $ 867
Total shareholders’ equity $ 4,550 $ 3,422 $ 1,128
Total liabilities and shareholders’ equity $ 19,777 $ 17,782 $ 1,995
(1) Air Canada adopted accounting standard IFRS 15 - Revenue from Contracts with Customers effective January 1, 2018 with restatement of 2017 amounts which are reflected in the table above. Refer to section 9 “Accounting Policies” of this MD&A for additional information.
Movements in current assets and current liabilities are described in section 6.3 “Working Capital” of this MD&A. Long-term debt and finance leases are discussed in sections 6.2 “Adjusted Net Debt” and 6.4 “Consolidated Cash Flow Movements” of this MD&A.
At September 30, 2018, property and equipment amounted to $9,810 million, an increase of $558 million from December 31, 2017. This increase was mainly due to additions to property and equipment of $1,907 million, offset by the impact of depreciation expense of $802 million and the impact of the sale of 25 Embraer 190 aircraft in the third quarter of 2018.
In the first nine months of 2018, additions to property and equipment included five Boeing 787-9 aircraft and 16 Boeing 737 MAX 8 aircraft. Four Boeing 787 and nine Boeing 737 MAX aircraft were financed with proceeds from the sale of enhanced equipment trust certificates (EETCs) issued through a U.S. dollar private offering in 2017, one Boeing 787 and four Boeing 737 MAX aircraft were financed with proceeds from the sale of EETCs issued through a Canadian dollar private offering in 2018, and three Boeing 737 MAX aircraft were purchased with cash. Additional information on these EETC private offerings can be found in section 6.7 “Contractual Obligations” of this MD&A. In the first nine months

Third Quarter 2018 Management’s Discussion and Analysis of Results of Operations and Financial Condition
25
of 2018, additions to property and equipment also included progress payments on future aircraft deliveries and capitalized maintenance costs.
The net long-term pension and other benefit liabilities of $204 million (comprised of pension and other benefit liabilities of $2,447 million net of pension assets of $2,243 million) decreased $805 million from December 31, 2017. This decrease was mainly due to a 29-basis point increase in the discount rate used to value the liabilities and the impact of revised demographic assumptions, resulting in a net gain on remeasurements on employee liabilities of $1,009 million for the nine months ended September 30, 2018 ($738 million, net of tax) recorded on Air Canada’s consolidated statement of comprehensive income. The revised demographic assumptions relate mainly to updated actuarial assumptions regarding retirement rates, which resulted in a decrease to the actuarial liability of $277 million.
6.2. Adjusted Net Debt
The following table reflects Air Canada’s adjusted net debt balances as at September 30, 2018 and as at December 31, 2017:
(Canadian dollars in millions, except where indicated) September 30, 2018 December 31, 2017 $ Change
Total long-term debt and finance leases $ 6,246 $ 5,448 $ 798
Current portion of long-term debt and finance leases 432 671 (239)
Total long-term debt and finance leases (including current portion)
$ 6,678 $ 6,119 $ 559
Less cash, cash equivalents and short-term investments (4,922) (3,804) (1,118)
Net debt $ 1,756 $ 2,315 $ (559)
Capitalized operating leases (1) 3,864 3,801 63
Adjusted net debt (1) $ 5,620 $ 6,116 $ (496)
EBITDAR (trailing 12 months) $ 2,829 $ 2,928 $ (99)
Adjusted net debt to EBITDAR ratio (2) 2.0 2.1 (0.1)
(1) Adjusted net debt is an additional GAAP financial measure and a key component of the capital managed by Air Canada and provides management with a measure of its net indebtedness. Air Canada includes capitalized operating leases which is a measure commonly used in the industry to ascribe a value to obligations under operating leases. Common industry practice is to multiply annualized aircraft rent expense by 7. This definition of capitalized operating leases is used by Air Canada and may not be comparable to similar measures presented by other public companies. Aircraft rent (including aircraft rent expense related to regional airline operations) was $552 million for the 12 months ended September 30, 2018 and $543 million for the 12 months ended December 31, 2017.
(2) Adjusted net debt to trailing 12-month EBITDAR ratio (also referred to as “leverage ratio” in this MD&A) is a non-GAAP financial measure and is used by Air Canada as a means to measure financial leverage. Leverage ratio is calculated by dividing adjusted net debt by trailing 12-month EBITDAR. Refer to section 14 “Non-GAAP Financial Measures” of this MD&A for additional information. Air Canada adopted accounting standard IFRS 15 - Revenue from Contracts with Customers effective January 1, 2018 with restatement of 2017 amounts. Refer to section 9 “Accounting Policies” of this MD&A for additional information.
At September 30, 2018, total long-term debt and finance leases (including current portion) of $6,678 million increased $559 million from December 31, 2017. In the first nine months of 2018, new aircraft-related borrowings amounted to $1,210 million and the unfavourable impact of a weaker Canadian dollar, as at September 30, 2018 compared to December 31, 2017, increased foreign currency denominated debt (mainly U.S. dollars) by $168 million. These increases were partly offset by debt repayments of $809 million.
At September 30, 2018, adjusted net debt of $5,620 million decreased $496 million from December 31, 2017, as increases in long-term debt and finance lease balances of $559 million and capitalized operating lease balances of $63 million were more than offset by an increase in cash and short-term investment balances of $1,118 million. At September 30, 2018, Air Canada’s leverage ratio (adjusted net debt to trailing 12-month EBITDAR ratio) was 2.0 versus 2.1 as at December 31, 2017.

Third Quarter 2018 Management’s Discussion and Analysis of Results of Operations and Financial Condition
26
At September 30, 2018, Air Canada’s weighted average cost of capital (“WACC”), on a pre-tax basis, was approximately 7.4% (compared to approximately 7.6% at December 31, 2017). WACC is based on an estimate by management and consists of an estimated cost of equity of 20.0% and an average cost of debt and finance leases of 4.3% (compared to an estimated cost of equity of 20.0% and an average cost of debt and finance leases of 4.5% at December 31, 2017).
6.3. Working Capital
The following table provides information on Air Canada’s working capital balances as at September 30, 2018 and as at December 31, 2017:
(Canadian dollars in millions) September 30, 2018 December 31, 2017 (1) $ Change
Cash, cash equivalents and short-term investments $ 4,922 $ 3,804 $ 1,118
Accounts receivable 960 814 146
Other current assets 712 779 (67)
Total current assets $ 6,594 $ 5,397 $ 1,197
Accounts payable and accrued liabilities 2,030 1,961 69
Advance ticket sales 2,759 2,469 290
Current portion of long-term debt and finance leases 432 671 (239)
Total current liabilities $ 5,221 $ 5,101 $ 120
Net working capital $ 1,373 $ 296 $ 1,077
(1) Air Canada adopted accounting standard IFRS 15 - Revenue from Contracts with Customers effective January 1, 2018 with restatement of 2017 amounts. Refer to section 9 “Accounting Policies” of this MD&A for additional information.
The net working capital of $1,373 million at September 30, 2018 represented an improvement of $1,077 million from December 31, 2017.
The net cash flow benefit of positive operating results in the first nine months of 2018 more than offset the impact of net capital expenditures. Net cash outflow relating to capital expenditures was $619 million (after deducting proceeds drawn on the delivery of five Boeing 787 and 13 Boeing 737 MAX aircraft of $1,210 million, and proceeds on the sale of 25 Embraer 190 aircraft of $293 million less the repayment of the associated debt of $144 million). In the first nine months of 2018, Air Canada purchased three Boeing 737 MAX aircraft using cash.

Third Quarter 2018 Management’s Discussion and Analysis of Results of Operations and Financial Condition
27
6.4. Consolidated Cash Flow Movements
The following table provides the cash flow movements for Air Canada for the periods indicated:
Third Quarter First Nine Months
(Canadian dollars in millions) 2018 2017 $ Change 2018 2017 $ Change
Net cash flows from operating activities $ 371 $ 493 $ (122) $ 2,335 $ 2,349 $ (14)
Proceeds from borrowings - - - 1,210 733 477
Reduction of long-term debt and finance lease obligations (225) (203) (22) (809) (574) (235)
Shares purchased for cancellation - - - (23) (36) 13
Issue of shares 3 4 (1) 5 7 (2)
Financing fees - (3) 3 (8) (15) 7
Net cash flows from (used in) financing activities $ (222) $ (202) $ (20) $ 375 $ 115 $ 260
Short-term investments (259) (256) (3) (884) (831) (53)
Additions to property, equipment and intangible assets (194) (169) (25) (1,978) (1,990) 12
Proceeds from sale of assets 4 1 3 10 3 7
Proceeds from sale-leaseback of assets 293 - 293 293 740 (447)
Other 3 9 (6) 48 8 40
Net cash flows used in investing activities $ (153) $ (415) $ 262 $ (2,511) $ (2,070) $ (441)
Effect of exchange rate changes on cash and cash equivalents
$ - $ (29) $ 29 $ 11 $ (35) $ 46
Increase (decrease) in cash and cash equivalents $ (4) $ (153) $ 149 $ 210 $ 359 $ (149)
The following table provides the calculation of free cash flow for Air Canada for the periods indicated:
Third Quarter First Nine Months
(Canadian dollars in millions) 2018 2017 $ Change 2018 2017 $ Change
Net cash flows from operating activities $ 371 $ 493 $ (122) $ 2,335 $ 2,349 $ (14)
Additions to property, equipment and intangible assets, net of proceeds from sale and leaseback transactions
99 (169) 268 (1,685) (1,250) (435)
Free cash flow (1) $ 470 $ 324 $ 146 $ 650 $ 1,099 $ (449) (1) Free cash flow is a non-GAAP financial measure used by Air Canada as an indicator of the financial strength and performance
of its business, indicating how much cash it is able to generate from operations and after capital expenditures. Free cash flow is calculated as net cash flows from operating activities minus additions to property, equipment and intangible assets, and is net of proceeds from sale and leaseback transactions. Refer to section 14 “Non-GAAP Financial Measures” of this MD&A for additional information.

Third Quarter 2018 Management’s Discussion and Analysis of Results of Operations and Financial Condition
28
Free Cash Flow
In the third quarter of 2018, net cash flows from operating activities of $371 million decreased $122 million when compared to the same quarter in 2017. Free cash flow of $470 million increased $146 million from the third quarter of 2017. In the third quarter of 2018, Air Canada received proceeds of $293 million from the sale and leaseback of 25 Embraer aircraft.
In the first nine months of 2018, net cash flows from operating activities of $2,335 million decreased $14 million when compared to the same period in 2017. In the first nine months of 2018, free cash flow of $650 million decreased $449 million from the first nine months of 2017. In the first nine months of 2018, Air Canada received proceeds of $293 million from the sale and leaseback of 25 Embraer aircraft. In the first nine months of 2017, Air Canada received proceeds of $740 million from the sale and leaseback of four Boeing 787 aircraft.
Net Cash Flows from (used in) Financing Activities
Reduction of long-term debt and finance lease obligations amounted to $225 million in the third quarter of 2018 and $809 million in the first nine months of 2018 while proceeds from borrowings were nil in the third quarter of 2018 and totaled $1,210 million in the first nine months of 2018.
Refer to sections 6.3 “Working Capital”, 6.1 “Financial Position” and 6.2 “Adjusted Net Debt” of this MD&A for additional information.
6.5. Capital Expenditures and Related Financing Arrangements
Boeing 787 Aircraft
Air Canada has outstanding purchase commitments with The Boeing Company (“Boeing”) for two Boeing 787 aircraft scheduled for delivery in early 2019. Air Canada also has purchase options for 13 Boeing 787 aircraft (entitling Air Canada to purchase aircraft based on previously determined pricing and delivery positions), and purchase rights for 10 Boeing 787 aircraft (entitling Air Canada to purchase aircraft based on Boeing’s then current pricing and available delivery positions).
Subject to certain conditions, Air Canada has financing commitments covering the two Boeing 787 aircraft scheduled for delivery in early 2019. The financing terms are for 80% of the aircraft delivery price and the term to maturity is 12 years with straight-line principal repayments.
Boeing 737 MAX Aircraft
Air Canada has an agreement with Boeing for the purchase of Boeing 737 MAX aircraft which provides for:
Firm orders for 61 737 MAX aircraft, consisting of 50 737 MAX 8 and 11 737 MAX 9 aircraft with substitution rights between them as well as for the 737 MAX 7 aircraft.
Purchase options for 18 Boeing 737 MAX aircraft.
Certain rights to purchase an additional 30 Boeing 737 MAX aircraft.
As of the date of this MD&A, 18 Boeing 737 MAX 8 aircraft have been delivered, with the remaining 43 Boeing 737 MAX aircraft scheduled for delivery from 2019 to 2024.
In April 2018, Air Canada concluded an amendment to its Boeing 737 purchase agreement, pursuant to which certain aircraft delivery positions were accelerated and others deferred. The amendment accelerates the delivery of five 737 MAX aircraft by one year, to 2020, and defers the delivery of 11 737 MAX aircraft by up to 36 months.

Third Quarter 2018 Management’s Discussion and Analysis of Results of Operations and Financial Condition
29
Subject to certain conditions, Air Canada also has financing commitments covering 25 firm Boeing 737 MAX aircraft scheduled for delivery in 2020, 2023 and 2024. The financing terms are for 80% of the aircraft delivery price and the term to maturity is 10 years with mortgage-style repayments.
Airbus A220-300 Aircraft
In June 2016, Air Canada and Bombardier Inc. (“Bombardier”) finalized a purchase agreement which includes a firm order for 45 Airbus A220-300 aircraft (formerly called Bombardier C-Series CS300 aircraft) and options for an additional 30 Airbus A220-300 aircraft. Deliveries are scheduled to begin in late 2019 and extend to 2022. The first 25 aircraft on delivery are expected to replace Air Canada's existing mainline fleet of Embraer 190 aircraft, with incremental aircraft supporting Air Canada's hub and network growth.
Reconfiguration of Airbus A330 Aircraft
In order to provide customers with a product that is consistent across its wide-body fleet, Air Canada plans on reconfiguring 12 Airbus A330 aircraft (eight of which are currently in service and four scheduled to be added in 2019) to the new Boeing 787 state-of-the-art standard. The reconfiguration of the Airbus A330 aircraft is expected to begin in late 2019 for completion in the first half of 2020. The capital expenditure related to this refurbishment program (which is included in the projected committed expenditures in the table below) is approximately $275 million.
Capital Commitments As outlined in the table below, the estimated aggregate cost of the future firm Boeing 787, Boeing 737 MAX and Airbus A220-300 aircraft deliveries and other capital purchase commitments as at September 30, 2018 approximates $5,251 million. The table below also includes the impact of the amendment to the Boeing 737 purchase agreement discussed above.
(Canadian dollars in millions)
Remainder of 2018
2019
2020
2021
2022 Thereafter Total
Projected committed expenditures
$ 176 $ 1,623 $ 1,422 $ 775 $ 716 $ 539 $ 5,251
Projected planned but uncommitted expenditures
100 718 340 305 226 Not available
Not available
Projected planned but uncommitted capitalized maintenance (1)
39 173 175 56 95 Not available
Not available
Total projected expenditures (2) $ 315 $ 2,514 $ 1,937 $ 1,136 $ 1,037 Not
available Not
available
(1) Future capitalized maintenance amounts for 2021 and 2022 and beyond are not yet determinable, however estimates of $56 million and $95 million, respectively, have been made for 2021 and 2022.
(2) U.S. dollar amounts are converted using the September 30, 2018 closing exchange rate of US$1=C$1.2908. The estimated aggregate cost of aircraft is based on delivery prices that include estimated escalation and, where applicable, deferred price delivery payment interest calculated based on the 90-day U.S. LIBOR rate at September 30, 2018.

Third Quarter 2018 Management’s Discussion and Analysis of Results of Operations and Financial Condition
30
6.6. Pension Funding Obligations
Based on actuarial valuations, as at January 1, 2018, the aggregate solvency surplus in Air Canada’s domestic registered pension plans is $2.6 billion. As a result, Air Canada will not make any past service payments in 2018.
As permitted by applicable legislation and subject to applicable plan rules, amounts in excess of 105% on a solvency basis may be used to reduce current service contributions under the defined benefit component or to fund the employer contribution to a defined contribution component within the same pension plan. Pension funding obligations for 2018 are expected to be $90 million.
As at September 30, 2018, taking into account the effect of financial instrument risk management tools, approximately 79% of Air Canada’s pension liabilities were matched with fixed income products to mitigate a significant portion of the interest rate (discount rate) risk. Air Canada may continue to increase the percentage of fixed income products matched to pension liabilities, subject to favourable market conditions.
For additional information on Air Canada’s pension funding obligations, refer to section 9.7 “Pension Funding Obligations” of Air Canada’s 2017 MD&A.
6.7. Contractual Obligations
Private offering of enhanced equipment trust certificates
In December 2017, in connection with the financing of four new Boeing 787-9 and nine new Boeing 737 MAX 8 aircraft, Air Canada completed the closing of a private offering of three tranches of EETCs with a combined aggregate face amount of approximately US$719 million. The three tranches of certificates have a combined weighted average interest rate of 3.422% per annum. All 13 aircraft under this transaction were delivered and financed in the first half of 2018.
In March 2018, in connection with the financing of one new Boeing 787-9 and four new Boeing 737 MAX 8 aircraft, Air Canada completed the closing of a Canadian dollar private offering of two tranches of EETCs with a combined aggregate face amount of approximately $301 million. All aircraft under this transaction were delivered and financed in the second quarter of 2018. The private offering was comprised of Class A and Class B certificates.
The Class A certificates, with a $238 million face amount, have an interest rate of 3.670% per annum and a final expected distribution date of April 15, 2030.
The Class B certificates, with a $63 million face amount, have an interest rate of 4.190% per annum and a final expected distribution date of January 15, 2026.
The two tranches of certificates have a combined weighted average interest rate of 3.760% per annum.

Third Quarter 2018 Management’s Discussion and Analysis of Results of Operations and Financial Condition
31
The table below provides Air Canada’s contractual obligations as at September 30, 2018, including those relating to interest and principal repayment obligations on Air Canada’s long-term debt and finance lease obligations, operating lease obligations and committed capital expenditures.
(Canadian dollars in millions) Remainder
2018 2019 2020 2021 2022 Thereafter Total
Principal
Long-term debt obligations $ 92 $ 383 $ 608 $ 952 $ 327 $ 4,233 $ 6,595
Finance lease obligations 11 45 48 17 14 56 191
Total principal obligations $ 103 $ 428 $ 656 $ 969 $ 341 $ 4,289 $ 6,786
Interest
Long-term debt obligations 76 273 253 211 176 471 1,460
Finance lease obligations 3 14 9 6 5 14 51
Total interest obligations $ 79 $ 287 $ 262 $ 217 $ 181 $ 485 $ 1,511
Total long-term debt and finance lease obligations $ 182 $ 715 $ 918 $ 1,186 $ 522 $ 4,774 $ 8,297
Operating lease obligations $ 172 $ 607 $ 475 $ 341 $ 257 $ 1,026 $ 2,878
Committed capital expenditures $ 176 $ 1,623 $ 1,422 $ 775 $ 716 $ 539 $ 5,251
Total contractual obligations (1) $ 530 $ 2,945 $ 2,815 $ 2,302 $ 1,495 $ 6,339 $ 16,426
(1) Total contractual obligations exclude commitments for goods and services required in the ordinary course of business. Also excluded are long-term liabilities other than long-term debt and finance lease obligations due to reasons of uncertainty of timing of cash flows and items that are non-cash in nature.

Third Quarter 2018 Management’s Discussion and Analysis of Results of Operations and Financial Condition
32
6.8. Share Information
The issued and outstanding shares of Air Canada, along with shares potentially issuable, as of the dates indicated below, are as follows:
September 30, 2018 December 31, 2017
Issued and outstanding shares
Variable voting shares 155,014,869 115,986,084
Voting shares 117,765,095 157,090,562
Total issued and outstanding shares 272,779,964 273,076,646
Class A variable voting and Class B voting shares potentially issuable
Stock options 6,030,403 6,121,252
Total shares potentially issuable 6,030,403 6,121,252
Total outstanding and potentially issuable shares 278,810,367 279,197,898
Issuer Bid
In May 2018, Air Canada received approval from the Toronto Stock Exchange for the renewal of its normal course issuer bid for its Class A variable voting shares and Class B voting shares (collectively the “shares”), authorizing, between May 31, 2018 and May 30, 2019, the purchase of up to 24,040,243 shares, representing 10% of Air Canada’s public float as at May 17, 2018. The renewal followed the conclusion of the 2017 normal course issuer bid which expired on May 30, 2018.
In the nine months ended September 30, 2018, Air Canada purchased, for cancellation 914,218 shares at an average cost of $24.78 per share for aggregate consideration of $23 million. No shares were purchased during the three months ended September 30, 2018. At September 30, 2018, a total of 24,040,243 shares remained available for repurchase under the existing issuer bid.

Third Quarter 2018 Management’s Discussion and Analysis of Results of Operations and Financial Condition
33
7. QUARTERLY FINANCIAL DATA
The following table summarizes quarterly financial results for Air Canada for the last eight quarters:
(Canadian dollars in millions, except where indicated)
2016 (1) 2017 (1) 2018
Q4 Q1 Q2 Q3 Q4 Q1 Q2 Q3
Passenger $ 3,035 $ 3,120 $ 3,550 $ 4,514 $ 3,409 $ 3,489 $ 3,921 $ 5,018 Cargo 155 148 168 194 198 168 200 218 Other 235 374 192 172 213 414 212 179
Operating revenues 3,425 3,642 3,910 4,880 3,820 4,071 4,333 5,415
Aircraft fuel 598 659 701 832 735 825 964 1,222 Regional airlines expense
Aircraft fuel 90 95 96 109 112 114 135 149 Other 532 537 552 553 563 561 607 568
Wages, salaries & benefits 633 644 663 690 674 700 711 743
Airport and navigation fees 203 210 230 264 201 221 237 281
Aircraft maintenance 200 228 226 241 243 256 220 277
Depreciation, amortization and impairment 212 228 242 241 245 267 278 268
Sales and distribution costs 172 181 188 232 169 189 199 237 Ground package costs 101 256 103 73 106 276 114 86 Aircraft rent 120 122 130 125 126 125 123 137 Catering and onboard services 82 85 97 112 89 96 108 125 Communications and information technology 60 71 58 63 62 79 67 79
Special items 91 30 - - - - - -
Other 313 326 332 369 362 376 344 403
Operating expenses 3,407 3,672 3,618 3,904 3,687 4,085 4,107 4,575
Operating income (loss) 18 (30) 292 976 133 (14) 226 840
Foreign exchange gain (loss) (29) 70 68 44 (62) (112) (25) 89 Interest income 13 12 14 16 18 20 24 32 Interest expense (83) (79) (80) (73) (79) (83) (84) (80)
Interest capitalized 8 9 9 9 9 13 7 7
Net financing expense relating to employee benefits (24) (16) (16) (15) (18) (12) (13) (13)
Gain (loss) on financial instruments recorded at fair value 9 - 7 17 (1) 1 (9) 10
Gain on sale and leaseback of assets - 26 26 - - - - - Gain (loss) on debt settlements and modifications (82) - - (3) 24 11 (1) (1)
Loss on disposal of assets - - - - - - (186) (2) Other (8) (5) (6) (6) (4) (8) (10) (6)
Total non-operating income (expense) (196) 17 22 (11) (113) (170) (297) 36
Income (loss) before income taxes (178) (13) 314 965 20 (184) (71) 876 Income tax (expense) recovery (1) - (3) 758 (12) 14 (6) (231)
Net income (loss) $ (179) $ (13) $ 311 $ 1,723 $ 8 $ (170) $ (77) $ 645
Diluted earnings (loss) per share $ (0.66) $ (0.05) $ 1.13 $ 6.22 $ 0.02 $ (0.62) $ (0.28) $ 2.34
EBITDAR (2) $ 455 $ 366 $ 681 $ 1,360 $ 521 $ 397 $ 646 $ 1,265
Adjusted pre-tax income (loss) (2) $ 39 $ (63) $ 229 $ 922 $ 77 $ (72) $ 163 $ 793
Adjusted net income (loss) (2) $ 38 $ (63) $ 226 $ 922 $ 61 $ (52) $ 114 $ 561
Adjusted earnings (loss) per share – diluted (2) $ 0.14 $ (0.23) $ 0.82 $ 3.33 $ 0.22 $ (0.19) $ 0.41 $ 2.03
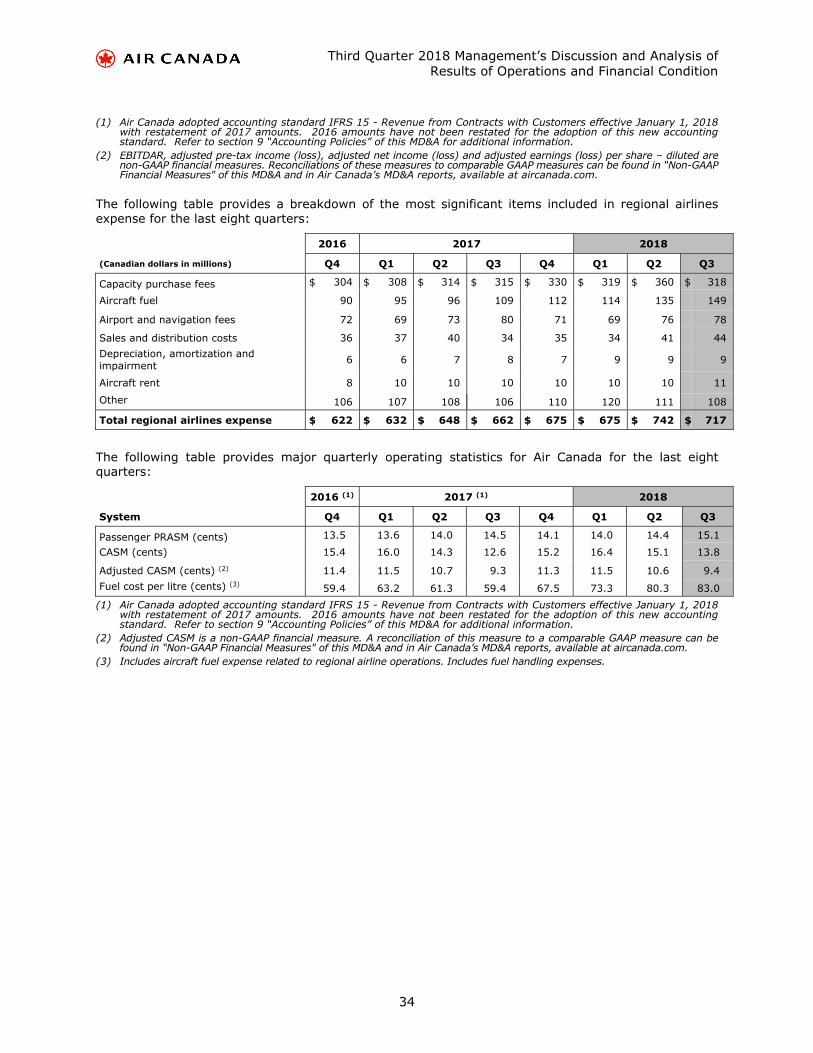
Third Quarter 2018 Management’s Discussion and Analysis of Results of Operations and Financial Condition
34
(1) Air Canada adopted accounting standard IFRS 15 - Revenue from Contracts with Customers effective January 1, 2018
with restatement of 2017 amounts. 2016 amounts have not been restated for the adoption of this new accounting standard. Refer to section 9 “Accounting Policies” of this MD&A for additional information.
(2) EBITDAR, adjusted pre-tax income (loss), adjusted net income (loss) and adjusted earnings (loss) per share – diluted are non-GAAP financial measures. Reconciliations of these measures to comparable GAAP measures can be found in “Non-GAAP Financial Measures" of this MD&A and in Air Canada’s MD&A reports, available at aircanada.com.
The following table provides a breakdown of the most significant items included in regional airlines expense for the last eight quarters:
2016 2017 2018
(Canadian dollars in millions) Q4 Q1 Q2 Q3 Q4 Q1 Q2 Q3
Capacity purchase fees $ 304 $ 308 $ 314 $ 315 $ 330 $ 319 $ 360 $ 318
Aircraft fuel 90 95 96 109 112 114 135 149
Airport and navigation fees 72 69 73 80 71 69 76 78
Sales and distribution costs 36 37 40 34 35 34 41 44 Depreciation, amortization and impairment 6 6 7 8 7 9 9 9
Aircraft rent 8 10 10 10 10 10 10 11
Other 106 107 108 106 110 120 111 108
Total regional airlines expense $ 622 $ 632 $ 648 $ 662 $ 675 $ 675 $ 742 $ 717
The following table provides major quarterly operating statistics for Air Canada for the last eight quarters:
2016 (1) 2017 (1) 2018
System Q4 Q1 Q2 Q3 Q4 Q1 Q2 Q3
Passenger PRASM (cents) 13.5 13.6 14.0 14.5 14.1 14.0 14.4 15.1
CASM (cents) 15.4 16.0 14.3 12.6 15.2 16.4 15.1 13.8
Adjusted CASM (cents) (2) 11.4 11.5 10.7 9.3 11.3 11.5 10.6 9.4 Fuel cost per litre (cents) (3) 59.4 63.2 61.3 59.4 67.5 73.3 80.3 83.0
(1) Air Canada adopted accounting standard IFRS 15 - Revenue from Contracts with Customers effective January 1, 2018 with restatement of 2017 amounts. 2016 amounts have not been restated for the adoption of this new accounting standard. Refer to section 9 “Accounting Policies” of this MD&A for additional information.
(2) Adjusted CASM is a non-GAAP financial measure. A reconciliation of this measure to a comparable GAAP measure can be found in “Non-GAAP Financial Measures" of this MD&A and in Air Canada’s MD&A reports, available at aircanada.com.
(3) Includes aircraft fuel expense related to regional airline operations. Includes fuel handling expenses.

Third Quarter 2018 Management’s Discussion and Analysis of Results of Operations and Financial Condition
35
The following table provides Air Canada’s revenue passenger miles (RPMs), available seat miles (ASMs) and passenger load factors, on a system-basis and by market, for the last eight quarters:
2016 2017 2018
System Q4 Q1 Q2 Q3 Q4 Q1 Q2 Q3
RPMs (millions) 17,643 18,341 20,928 26,472 19,396 20,440 22,654 28,465
ASMs (millions) 22,091 22,894 25,357 31,050 24,191 24,862 27,269 33,137
Passenger load factor (%) 79.9 80.1 82.5 85.3 80.2 82.2 83.1 85.9
Domestic
RPMs (millions) 4,534 4,101 4,875 6,130 4,607 4,226 5,003 6,339
ASMs (millions) 5,510 5,108 5,837 7,173 5,584 5,280 6,026 7,482
Passenger load factor (%) 82.3 80.3 83.5 85.4 82.5 80.0 83.0 84.7
U.S. transborder
RPMs (millions) 3,182 3,782 3,609 3,951 3,408 4,037 3,848 4,172
ASMs (millions) 3,985 4,687 4,376 4,683 4,252 4,945 4,673 4,962
Passenger load factor (%) 79.9 80.7 82.5 84.4 80.1 81.6 82.3 84.1
Atlantic
RPMs (millions) 4,437 3,891 6,131 9,406 5,076 4,573 7,084 10,642
ASMs (millions) 5,778 5,248 7,661 11,087 6,582 5,753 8,571 12,231
Passenger load factor (%) 76.8 74.1 80.0 84.8 77.1 79.5 82.7 87.0
Pacific
RPMs (millions) 3,959 3,943 4,671 5,471 4,501 4,572 4,936 5,630
ASMs (millions) 4,977 4,862 5,540 6,412 5,586 5,447 5,829 6,484
Passenger load factor (%) 79.6 81.1 84.3 85.3 80.6 83.9 84.7 86.8
Other
RPMs (millions) 1,531 2,624 1,642 1,514 1,804 3,032 1,783 1,682
ASMs (millions) 1,841 2,989 1,943 1,695 2,187 3,437 2,170 1,978
Passenger load factor (%) 83.1 87.8 84.5 89.3 82.5 88.2 82.1 85.0

Third Quarter 2018 Management’s Discussion and Analysis of Results of Operations and Financial Condition
36
8. FINANCIAL INSTRUMENTS AND RISK MANAGEMENT
Air Canada’s financial instruments and risk management practices are summarized in section 12 of Air Canada’s 2017 MD&A. There have been no material changes to Air Canada’s financial instruments and risk management practices from that which was disclosed at that time. Additional information on Air Canada’s risk management practices and financial instruments is discussed in Note 10 of Air Canada’s third quarter 2018 interim unaudited condensed consolidated financial statements.
9. ACCOUNTING POLICIES
Air Canada’s accounting policies are as disclosed in Note 2 of Air Canada’s 2017 annual audited consolidated financial statements. There have been no material changes to Air Canada’s accounting policies from what was disclosed at that time, with the exception of the adoption of IFRS 15 – Revenue from Contract with Customers as described below.
IFRS 15 – Revenue from Contracts with Customers
IFRS 15 replaces IAS 18 Revenue and related interpretations. The core principle of the new standard is to recognize revenue to depict the transfer of goods or services to customers in amounts that reflect the consideration to which the entity expects to be entitled in exchange for those goods or services. The new standard is intended to enhance disclosures about revenue, provide more comprehensive guidance for transactions that were not previously addressed and improve guidance for multiple-element arrangements, with additional information provided in Note 2 of Air Canada’s third quarter 2018 interim unaudited condensed consolidated financial statements. Air Canada adopted the standard effective January 1, 2018 using the full retrospective method.
IFRS 16 – Leases
IFRS 16 – Leases replaces IAS 17 Leases and related interpretations. The core principle is that a lessee recognizes assets and liabilities for all leases with a lease term of more than 12 months. A lessee is required to recognize a right-of-use asset representing its right to use the underlying leased asset and a lease liability representing its obligation to make lease payments. Assets and liabilities arising from a lease are initially measured on a present value basis. The measurement of the lease liability includes non-cancellable lease payments (including inflation-linked payments) and includes payments to be made in optional periods if the lessee is reasonably certain to exercise an option to extend the lease, or not to exercise an option to terminate the lease. Purchase options which are reasonably certain of being exercised are also included in the measurement of the lease liability. Lease payments will not include variable lease payments other than those that depend on an index or rate. The right-of-use asset will be derived from the calculation of the lease liability and will also include any provisions the lessee will owe for return conditions on leased assets.
The new standard is intended to provide an improved representation of leasing transactions, in particular those that do not currently require the lessee to recognize an asset and liability arising from an operating lease. IFRS 16 is effective for annual periods beginning on January 1, 2019. Entities have the option of adopting a full retrospective approach or a modified retrospective approach on transition to IFRS 16.
Air Canada will apply the standard effective January 1, 2019 and plans to transition with a full retrospective approach with restatement to each prior reporting period presented. Air Canada expects to elect the package of practical expedients to not reassess prior conclusions related to contracts containing leases and apply the recognition exemption for short term leases. Other practical expedients available under the guidance are still being evaluated.
Air Canada continues to assess the impacts the adoption of this standard will have on its consolidated financial statements but expects this standard will have a significant impact on its consolidated balance sheet, along with a change to the recognition, measurement and presentation of lease expenses in the consolidated statement of operations. Based on a review of current contracts and the requirements of the standard, Air Canada has largely concluded the accounting policy determination and scoping exercise for IFRS 16, with additional information provided below. Measurement of the related right-of-use assets and lease liabilities is in progress.

Third Quarter 2018 Management’s Discussion and Analysis of Results of Operations and Financial Condition
37
Aircraft Leases
As of December 31, 2017, Air Canada had 111 aircraft under operating leases, and Air Canada expects to record such aircraft as right-of-use assets and lease liabilities of Air Canada in accordance with the requirements of the new standard. Additionally, Air Canada has identified that, under IFRS 16, Air Canada has leases as lessee in respect of aircraft used by regional carriers providing services under the respective capacity purchase agreements (“CPA”) and expects to record such aircraft as right-of-use assets and lease liabilities of Air Canada. As at December 31, 2017, there were 151 aircraft operating under these arrangements on behalf of Air Canada. Property Leases
Air Canada has leases related to airport terminal operations space and other real estate leases. For leases related to terminal operations space, there are generally effective substitution rights in the hands of the lessor and therefore these are not considered lease contracts under the standard. Leases with reciprocal termination rights with a notice period of less than 12 months would be considered short-term leases and therefore would be excluded from balance sheet recognition under the practical expedient. Finally, those airport terminal contracts with variable lease payments will also be excluded since variable lease payments, other than those based on an index or rate, are excluded from the measurement of the lease liability. This results in a portfolio of property leases that are expected to be recorded as right-of-use assets and lease liabilities under the standard which relate to dedicated space in Air Canada’s hub locations of Toronto, Montreal and Vancouver, lease contracts on building space dedicated to Air Canada for offices, airport and maintenance operations, Maple Leaf Lounges and land leases.
Accounting for Right-of-Use Assets
Right-of-use assets will be accounted for under IAS 16 Property, Plant and Equipment. Aircraft recorded as right-of-use assets will have the same accounting policies as directly owned aircraft, meaning the right-of-use assets will be componentized and depreciated over the lease term. Consistent with owned aircraft, any qualifying maintenance events will be capitalized and depreciated over the lesser of the lease term and expected maintenance life. Maintenance provisions will be recorded, as applicable, on aircraft leases as a maintenance expense over the term of the lease. Any changes to the provision for end-of-lease conditions will be recognized as an adjustment to the right-of-use asset and subsequently amortized to the income statement over the remaining term of the lease.
Income Statement Impacts
The impacts on the income statement will be an elimination of aircraft rent and building rent, which is recorded in other operating expenses, for those contracts which are recognized as leases, and instead will be replaced by an amortization of the right-of-use asset and interest costs on the lease liability. Maintenance expense is expected to decrease under the standard as qualifying maintenance events for the former operating leases will be capitalized and amortized over their expected maintenance life. This will be partially offset by higher maintenance provision expense recorded on all aircraft right-of-use assets which contain end of lease maintenance return conditions. Since all the aircraft lease contracts are denominated in U.S. dollars, there will be additional volatility in the foreign exchange recognized in the income statement due to the revaluation of the lease liabilities and maintenance provisions to the rate of exchange in effect at the date of the balance sheet.

Third Quarter 2018 Management’s Discussion and Analysis of Results of Operations and Financial Condition
38
10. OFF-BALANCE SHEET ARRANGEMENTS
Information on Air Canada’s off-balance sheet arrangements is disclosed in section 15 “Off-Balance Sheet Arrangements” of Air Canada’s 2017 MD&A. There have been no material changes to Air Canada’s off-balance sheet arrangements from what was disclosed at that time.
11. RELATED PARTY TRANSACTIONS
At September 30, 2018, Air Canada had no transactions with related parties as defined in the CPA Handbook, except those pertaining to transactions with key management personnel in the ordinary course of their employment or directorship agreements.
12. RISK FACTORS
For a description of risk factors associated with Air Canada and its business, refer to section 18 “Risk Factors” of Air Canada’s 2017 MD&A. There have been no material changes to Air Canada’s risk factors from what was disclosed at that time.
13. CONTROLS AND PROCEDURES
Disclosure Controls and Procedures and Internal Controls over Financial Reporting
Disclosure controls and procedures within the Corporation have been designed to provide reasonable assurance that all relevant information is identified to its President and Chief Executive Officer (“CEO”), its Executive Vice President and Chief Financial Officer (“CFO”) and its Disclosure Committee to ensure appropriate and timely decisions are made regarding public disclosure.
Internal controls over financial reporting have been designed by management, under the supervision of, and with the participation of the Corporation's CEO and CFO, to provide reasonable assurance regarding the reliability of the Corporation’s financial reporting and its preparation of financial statements for external purposes in accordance with GAAP.
In the Corporation’s 2017 filings, the Corporation’s CEO and CFO certified, as required by National Instrument 52-109, the appropriateness of the financial disclosure, the design and effectiveness of the Corporation’s disclosure controls and procedures and the design and effectiveness of internal controls over financial reporting.
In the Corporation’s third quarter 2018 filings, the Corporation’s CEO and CFO certified, as required by National Instrument 52-109, the appropriateness of the financial disclosure, the design of the Corporation’s disclosure controls and procedures and the design of internal controls over financial reporting.
The Corporation’s Audit, Finance and Risk Committee reviewed this MD&A and the interim unaudited condensed consolidated financial statements and notes, and the Corporation’s Board of Directors approved these documents prior to their release.
Changes in Internal Controls over Financial Reporting
There have been no changes to the Corporation’s internal controls over financial reporting during the quarter ended September 30, 2018 that have materially affected, or are reasonably likely to materially affect, its internal controls over financial reporting.

Third Quarter 2018 Management’s Discussion and Analysis of Results of Operations and Financial Condition
39
14. NON-GAAP FINANCIAL MEASURES
Below is a description of certain non-GAAP financial measures used by Air Canada to provide readers with additional information on its financial and operating performance. Such measures are not recognized measures for financial statement presentation under GAAP, do not have standardized meanings, may not be comparable to similar measures presented by other entities and should not be considered a substitute for or superior to GAAP results.
EBITDAR
EBITDAR (earnings before interest, taxes, depreciation, amortization, impairment and aircraft rent) is commonly used in the airline industry and is used by Air Canada as a means to view operating results before interest, taxes, depreciation, amortization, impairment and aircraft rent as these costs can vary significantly among airlines due to differences in the way airlines finance their aircraft and other assets. Air Canada excludes special items from EBITDAR as these items may distort the analysis of certain business trends and render comparative analysis to other airlines less meaningful.
EBITDAR is reconciled to operating income as follows:
Third Quarter First Nine Months
(Canadian dollars in millions) 2018 2017 (1) $ Change 2018 2017 (1) $ Change
Operating income – GAAP $ 840 $ 976 $ (136) $ 1,052 $ 1,238 $ (186) Add back (as reflected on Air Canada’s consolidated statement of operations):
Depreciation, amortization and impairment 268 241 27 813 711 102
Aircraft rent 137 125 12 385 377 8
Add back (included in Regional airlines expense):
Depreciation, amortization and impairment 9 8 1 27 21 6
Aircraft rent 11 10 1 31 30 1
EBITDAR (including special items) $ 1,265 $ 1,360 $ (95) $ 2,308 $ 2,377 $ (69)
Remove effect of special items (2) - - - - 30 (30)
EBITDAR (excluding special items) $ 1,265 $ 1,360 $ (95) $ 2,308 $ 2,407 $ (99)
(1) Air Canada adopted accounting standard IFRS 15 - Revenue from Contracts with Customers effective January 1, 2018 with restatement of 2017 amounts. Refer to section 9 “Accounting Policies” of this MD&A for additional information.
(2) In the first quarter of 2017, Air Canada recorded a provision of $30 million relating to a fine which was reinstated by a decision of the European Commission pertaining to cargo investigations.
Adjusted CASM
Air Canada uses adjusted CASM as a means to assess the operating and cost performance of its ongoing airline business without the effects of aircraft fuel expense, the cost of ground packages at Air Canada Vacations and special items as these items may distort the analysis of certain business trends and render comparative analysis to other airlines less meaningful.
In calculating adjusted CASM, aircraft fuel expense is excluded from operating expense results as it fluctuates widely depending on many factors, including international market conditions, geopolitical events, jet fuel refining costs and Canada/U.S. currency exchange rates. Air Canada also incurs expenses related to ground packages at Air Canada Vacations which some airlines, without comparable tour operator businesses, may not incur. In addition, these costs do not generate ASMs and therefore

Third Quarter 2018 Management’s Discussion and Analysis of Results of Operations and Financial Condition
40
excluding these costs from operating expense results provides for a more meaningful comparison across periods when such costs may vary.
Excluding aircraft fuel expense, the cost of ground packages at Air Canada Vacations and special items from operating expenses generally allows for more meaningful analysis of Air Canada’s operating expense performance and a more meaningful comparison to those of other airlines.
Adjusted CASM is reconciled to GAAP operating expense as follows:
Third Quarter First Nine Months (Canadian dollars in millions, except where indicated) 2018 2017 (1) $ Change 2018 2017 (1) $ Change
Operating expense – GAAP $ 4,575 $ 3,904 $ 671 $ 12,767 $ 11,194 $ 1,573
Adjusted for: Aircraft fuel expense (as reflected on Air Canada’s consolidated statement of operations)
(1,222) (832) (390) (3,011) (2,192) (819)
Aircraft fuel expense (included in Regional airlines expense) (149) (109) (40) (398) (300) (98)
Ground package costs (86) (73) (13) (476) (432) (44)
Special items (2) - - - - (30) 30
Operating expense, adjusted for the above-noted items $ 3,118 $ 2,890 $ 228 $ 8,882 $ 8,240 $ 642
ASMs (millions) 33,137 31,050 6.7% 85,268 79,301 7.5%
Adjusted CASM (cents) ¢ 9.41 ¢ 9.31 1.1% ¢ 10.41 ¢ 10.39 0.2% (1) Air Canada adopted accounting standard IFRS 15 - Revenue from Contracts with Customers effective January 1, 2018
with restatement of 2017 amounts. Refer to section 9 “Accounting Policies” of this MD&A for additional information. (2) In the first quarter of 2017, Air Canada recorded a provision of $30 million relating to a fine which was reinstated by a
decision of the European Commission pertaining to cargo investigations.

Third Quarter 2018 Management’s Discussion and Analysis of Results of Operations and Financial Condition
41
Adjusted Pre-tax Income
Adjusted pre-tax income is used by Air Canada to assess the overall pre-tax financial performance of its business without the effects of foreign exchange gains or losses, net financing income (expense) relating to employee benefits, mark-to-market adjustments on derivatives and other financial instruments recorded at fair value, gain on sale and leaseback of assets, gains or losses on debt settlements and modifications, gains or losses on disposal of assets, and special items as these items may distort the analysis of certain business trends and render comparative analysis to other airlines less meaningful. Air Canada uses adjusted pre-tax income before interest to determine return on invested capital.
Adjusted pre-tax income is reconciled to GAAP income before income taxes as follows:
Third Quarter First Nine Months
(Canadian dollars in millions) 2018 2017 (1) $ Change 2018 2017 (1) $ Change
Income before income taxes $ 876 $ 965 $ (89) $ 621 $ 1,266 $ (645)
Adjusted for:
Special items (2) - - - - 30 (30)
Foreign exchange (gain) loss (89) (44) (45) 48 (182) 230
Net financing expense relating to employee benefits 13 15 (2) 38 47 (9)
Gain on financial instruments recorded at fair value (10) (17) 7 (2) (24) 22
Gain on sale and leaseback of assets - - - - (52) 52
(Gain) loss on debt settlements and modifications 1 3 (2) (9) 3 (12)
Loss on disposal of assets (3) 2 - 2 188 - 188
Adjusted pre-tax income $ 793 $ 922 $ (129) $ 884 $ 1,088 $ (204) (1) Air Canada adopted accounting standard IFRS 15 - Revenue from Contracts with Customers effective January 1, 2018
with restatement of 2017 amounts. (2) In the first quarter of 2017, Air Canada recorded a provision of $30 million relating to a fine which was reinstated by a
decision of the European Commission pertaining to cargo investigations. (3) In the first nine months of 2018, Air Canada recorded a loss on disposal of assets of $188 million related to the sale of 25
Embraer 190 aircraft.
Adjusted Net Income and Adjusted Earnings per Share – Diluted
Air Canada uses adjusted net income and adjusted earnings per share – diluted as a means to assess the overall financial performance of its business without the after-tax effects of foreign exchange gains or losses, net financing income (expense) relating to employee benefits, mark-to-market adjustments on derivatives and other financial instruments recorded at fair value, gain on sale and leaseback of assets, gains or losses on debt settlements and modifications, gains or losses on disposal of assets, and special items as these items may distort the analysis of certain business trends and render comparative analysis to other airlines less meaningful. Starting as of and including the fourth quarter of 2017, adjusted net income is determined net of tax. Accordingly, the 2018 and 2017 information in the table below is not directly comparable.

Third Quarter 2018 Management’s Discussion and Analysis of Results of Operations and Financial Condition
42
Adjusted net income is reconciled to GAAP net income as follows:
Third Quarter First Nine Months (Canadian dollars in millions, except where indicated) 2018 2017 (1) $ Change 2018 2017 (1) $ Change
Net income $ 645 $ 1,723 $ (1,078) $ 398 $ 2,021 $ (1,623)
Adjusted for:
Special items (2) - - - - 30 (30)
Recovery of deferred income taxes (one-time) (3) - (758) 758 - (755) 755
Foreign exchange (gain) loss (90) (44) (46) 66 (182) 248
Net financing expense relating to employee benefits 9 15 (6) 27 47 (20)
Gain on financial instruments recorded at fair value (7) (17) 10 (2) (24) 22
Gain on sale and leaseback of assets - - - - (52) 52
Loss on debt settlements and modifications 1 3 (2) 1 3 (2)
Loss on disposal of assets (4) 3 - 3 133 - 133
Adjusted net income $ 561 $ 922 $ (361) $ 623 $ 1,088 $ (465)
Weighted average number of outstanding shares used in computing diluted income per share (in millions)
276 277 (1) 277 277 -
Adjusted earnings per share – diluted $ 2.03 $ 3.33 $ (1.30) $ 2.25 $ 3.93 $ (1.68)
(1) Air Canada adopted accounting standard IFRS 15 - Revenue from Contracts with Customers effective January 1, 2018 with restatement of 2017 amounts. Refer to section 9 “Accounting Policies” of this MD&A for additional information.
(2) In the first quarter of 2017, Air Canada recorded a provision of $30 million relating to a fine which was reinstated by a decision of the European Commission pertaining to cargo investigations
(3) In the first nine months of 2017, Air Canada recorded a tax recovery of $755 million (representing a deferred income tax recovery of $771 million and a current income tax expense of $16 million). This tax recovery was excluded from adjusted net income as it reflected a one-time recognition of previously unrecognized income tax assets.
(4) In the first nine months of 2018, Air Canada recorded a loss on disposal of assets of $188 million related to the sale of 25 Embraer 190 aircraft.

Third Quarter 2018 Management’s Discussion and Analysis of Results of Operations and Financial Condition
43
The following reflects the share amounts used in the computation of basic and diluted earnings per share on an adjusted earnings per share basis:
Third Quarter First Nine Months
(in millions) 2018 2017 2018 2017
Weighted average number of shares outstanding – basic 273 272 273 272
Effect of dilution 3 5 4 5
Weighted average number of shares outstanding – diluted 276 277 277 277
Return on Invested Capital
Air Canada uses return on invested capital (“ROIC”) as a means to assess the efficiency with which it allocates its capital to generate returns. Return is based on adjusted pre-tax income (or loss, as applicable), excluding interest expense and implicit interest on operating leases. Invested capital includes (i) average year-over-year long-term debt, average year-over-year finance lease obligations, average year-over-year shareholders’ equity and (ii) the value of capitalized operating leases (calculated by multiplying annualized aircraft rent by 7). Air Canada calculates invested capital based on a book value-based method of calculating ROIC, as described above. Following an increase in Air Canada’s total cash, cash equivalents and short-term investments, Air Canada revised its methodology to reduce the average year-over-year book value of shareholders’ equity by excess cash not required to run its core business operations. Air Canada uses average year-over-year advance ticket sales as a proxy for the minimum cash required for ongoing core business operations. This change results in invested capital more closely reflecting operating capital. Refer to the definition of adjusted pre-tax income (loss) for a discussion as to why Air Canada uses this measure to assess the overall pre-tax financial performance of its business.

Third Quarter 2018 Management’s Discussion and Analysis of Results of Operations and Financial Condition
44
Return on invested capital is reconciled to GAAP income before income taxes as follows:
(Canadian dollars in millions, except where indicated)
12 Months Ended
September 30, 2018 December 31, 2017 (1) September 30, 2017 (1)
Income before income taxes $ 641 $ 1,286 $ 1,081
Remove:
Special items (2) - 30 121
Foreign exchange (gain) loss 110 (120) (153)
Net financing expense relating to employee benefits 56 65 71
Gain on financial instruments recorded at fair value (1) (23) (33)
Gain on sale and leaseback of assets - (52) (52)
(Gain) loss on debt settlements and modifications (3) (33) (21) 85
Loss on disposal of assets (4) 188 - -
Adjusted pre-tax income $ 961 $ 1,165 $ 1,120
Adjusted for:
Interest expense 326 311 315
Implicit interest on operating leases (5) 270 266 262
Adjusted pre-tax income before interest $ 1,557 $ 1,742 $ 1,697
Invested capital:
Average long-term debt and finance lease obligations 6,504 6,369 6,653
Average shareholders’ equity, net of excess cash 1,877 1,249 (4)
Capitalized operating leases (6) 3,864 3,801 3,745
Invested capital $ 12,245 $ 11,419 $ 10,394
Return on invested capital (%) 12.7 15.3 16.3 (1) Air Canada adopted accounting standard IFRS 15 - Revenue from Contracts with Customers effective January 1, 2018
with restatement of 2017 amounts. To provide a more meaningful comparison, ROIC as at September 30, 2017 is based on previously reported amounts as 2016 amounts have not been restated for the adoption of IFRS 15. Refer to section 9 “Accounting Policies” of this MD&A for additional information.
(2) Special items for the 12 months ended December 31, 2017 included a provision of $30 million related to cargo investigations. Special items for the 12 months ended September 30, 2017 included a provision of $30 million related to cargo investigations and a past service cost expense of $91 million in 2016 related to the cost of pension increases applicable to ACPA-represented pilots who participate in a defined benefit plan.
(3) Gain on debt settlements and modifications for the 12 months ended September 30, 2018 of $33 million included a gain of $38 million related to the repricing of its US$1.1 billion senior secured credit facility and a loss of $5 million related to the prepayment of fixed rate debt. Gain on debt settlements and modifications for the 12 months ended December 31, 2017 of $21 million included a gain of $27 million related to the repricing of its US$1.1 billion senior secured credit facility, a loss of $3 million related to the early exercise of a purchase option for an Airbus 330 aircraft and a loss of $2 million related to the prepayment of fixed rate debt on four Embraer 190 aircraft. Loss on debt settlements and modifications for the 12 months ended September 30, 2017 of $85 million included $82 million related to a $1.25 billion refinancing transaction and $3 million related to the early exercise of a purchase option for an Airbus A330 aircraft.
(4) The first nine months of 2018 included a loss on disposal amounting to $188 million related to the sale of 25 Embraer aircraft.
(5) Interest implicit on operating leases is equal to 7.0% of 7 times the trailing 12 months of aircraft rent. 7.0% is a proxy and does not necessarily represent the actual implicit interest on operating leases for any given period.
(6) Capitalized operating leases are calculated by multiplying the trailing 12 months of aircraft rent by 7. Aircraft rent totaled $552 million for the 12 months ended September 30, 2018, $543 million for the 12 months ended December 31, 2017 and $535 million for the 12 months ended September 30, 2017 (includes aircraft rent related to regional operations).

Third Quarter 2018 Management’s Discussion and Analysis of Results of Operations and Financial Condition
45
Adjusted Net Debt to Trailing 12-Month EBITDAR (Leverage Ratio)
Adjusted net debt to trailing 12-month EBITDAR ratio (also referred to as “leverage ratio” in this MD&A) is commonly used in the airline industry and is used by Air Canada as a means to measure financial leverage. Leverage ratio is calculated by dividing adjusted net debt by trailing 12-month EBITDAR. As mentioned above, Air Canada excludes special items from EBITDAR results (which are used to determine leverage ratio) as such items would distort the analysis of certain business trends and render comparative analysis to other airlines less meaningful. Refer to section 6.2 “Adjusted Net Debt” of this MD&A for a reconciliation of this non-GAAP financial measure to the nearest measure under GAAP.
Free Cash Flow
Free cash flow is commonly used in the airline industry and is used by Air Canada as an indicator of the financial strength and performance of its business, indicating the amount of cash Air Canada is able to generate from operations and after capital expenditures. Free cash flow is calculated as net cash flows from operating activities minus additions to property, equipment and intangible assets, and is net of proceeds from sale and leaseback transactions. Refer to section 6.4 “Consolidated Cash Flow Movements” of this MD&A for a reconciliation of this non-GAAP financial measure to the nearest measure under GAAP.
Third Quarter 2018 Management’s Discussion and Analysis of Results of Operations and Financial Condition
46
15. GLOSSARY
Adjusted CASM – Refers to operating expense per ASM adjusted to remove the effects of aircraft fuel expense, ground packages costs at Air Canada Vacations, and special items. Refer to section 14 “Non-GAAP Financial Measures” of this MD&A for additional information.
Adjusted net income (loss) – Refers to the consolidated net income (loss) of Air Canada adjusted to remove the after-tax effects of foreign exchange gains or losses, net financing income (expense) relating to employee benefits, mark-to-market adjustments on derivatives and other financial instruments recorded at fair value, gain on sale and leaseback of assets, gains or losses on debt settlements and modifications, gains or losses on disposal of assets, and special items. Refer to section 14 “Non-GAAP Financial Measures” of this MD&A for additional information.
Adjusted pre-tax income (loss) – Refers to the consolidated income (loss) of Air Canada before income taxes and adjusted to remove the effects of foreign exchange gains or losses, net financing income (expense) relating to employee benefits, mark-to-market adjustments on derivatives and other financial instruments recorded at fair value, gain on sale and leaseback of assets, gains or losses on debt settlements and modifications, gains or losses on disposal of assets, and special items. Refer to section 14 “Non-GAAP Financial Measures” of this MD&A for additional information.
Air Georgian – Refers to Air Georgian Limited.
Atlantic passenger and cargo revenues – Refer to revenues from flights that cross the Atlantic Ocean with origins and destinations principally in Europe, India, the Middle East and North Africa.
Available seat miles or ASMs – Refers to a measure of passenger capacity calculated by multiplying the total number of seats available for passengers by the miles flown.
Average stage length – Refers to the average mile per departure seat and is calculated by dividing total ASMs by total seats dispatched.
Boeing – Refers to The Boeing Company.
Bombardier – Refers to Bombardier Inc.
CASM – Refers to operating expense per ASM.
Domestic passenger and cargo revenues – Refer to revenues from flights within Canada.
EBITDAR – Refers to earnings before interest, taxes, depreciation, amortization, impairment and aircraft rent. EBITDAR is a non-GAAP financial measure. Refer to section 14 “Non-GAAP Financial Measures” of this MD&A for additional information. Air Canada excludes special items from EBITDAR.
EVAS – Refers to Exploits Valley Air Services Limited.
Free cash flow – Refers to net cash flows from operating activities minus additions to property, equipment and intangible assets, and is net of proceeds from sale and leaseback transactions. Free cash flow is a non-GAAP financial measure. Refer to sections 6.4 and 14 of this MD&A for additional information.
Jazz – Refers to Jazz Aviation LP.
Leverage ratio – Refers to adjusted net debt to trailing 12-month EBITDAR ratio (calculated by dividing adjusted net debt by trailing 12-month EBITDAR). Leverage ratio is a non-GAAP financial measure. Refer to sections 6.2 and 14 of this MD&A for additional information.
Third Quarter 2018 Management’s Discussion and Analysis of Results of Operations and Financial Condition
47
Loss (gain) on debt settlements and modifications – Refer to gains or losses related to debt settlements and modifications that, in management’s view, are to be separately disclosed by virtue of their size or incidence to enable a fuller understanding of Air Canada’s financial performance.
Other passenger and cargo revenues – Refer to revenues from flights with origins and destinations principally in Central and South America, the Caribbean and Mexico.
Pacific passenger and cargo revenues – Refer to revenues from flights that cross the Pacific Ocean with origins and destinations principally in Asia and Australia.
Passenger load factor – Refers to a measure of passenger capacity utilization derived by expressing Revenue Passenger Miles as a percentage of Available Seat Miles.
Passenger revenue per available seat mile or PRASM – Refers to average passenger revenue per ASM.
Percentage point (pp) – Refers to a measure for the arithmetic difference of two percentages.
Return on invested capital or ROIC – Refers to return on invested capital and is a measure used to assess the efficiency with which a company allocates its capital to generate returns. Refer to section 14 “Non-GAAP Financial Measures” of this MD&A for additional information.
Revenue passenger carried – Refers to the International Air Transport Association’s (IATA) definition of passenger carried whereby passengers are counted on a flight number basis rather than by journey/itinerary or by leg.
Revenue passenger miles or RPMs – Refers to a measure of passenger traffic calculated by multiplying the total number of revenue passengers carried by the miles they are carried.
Seats dispatched – Refers to the number of seats on non-stop flights. A non-stop flight refers to a single takeoff and landing.
Sky Regional – Refers to Sky Regional Airlines Inc.
Special items – Refer to those items that, in management’s view, are to be separately disclosed by virtue of their significance to the financial statements, to enable a fuller understanding of Air Canada’s financial performance.
Weighted average cost of capital or WACC – Refers to management’s estimate of its cost of capital, in which each category of capital is proportionately weighted.
Yield – Refers to average passenger revenue per RPM.