Embed Size (px)
Citation preview

Third quarter 2003Third quarter 2003Third quarter 2003
Norsk Hydro ASA20 October, 2003
Norsk Hydro ASANorsk Hydro ASA20 October, 200320 October, 2003
45554E - 10.2003 - *2 - Hydro Media
Norsk Hydro – Third quarter 2003 2
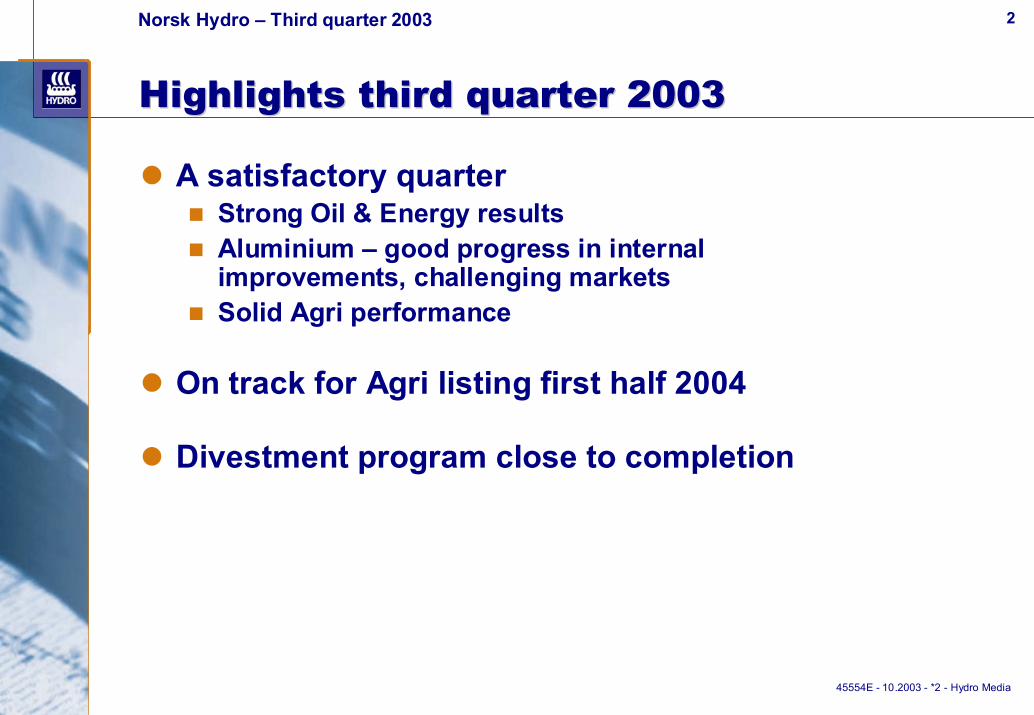
Highlights third quarter 2003Highlights third quarter 2003
� A satisfactory quarter� Strong Oil & Energy results� Aluminium – good progress in internal
improvements, challenging markets � Solid Agri performance
� On track for Agri listing first half 2004
� Divestment program close to completion
45554E - 10.2003 - *3 - Hydro Media
Norsk Hydro – Third quarter 2003
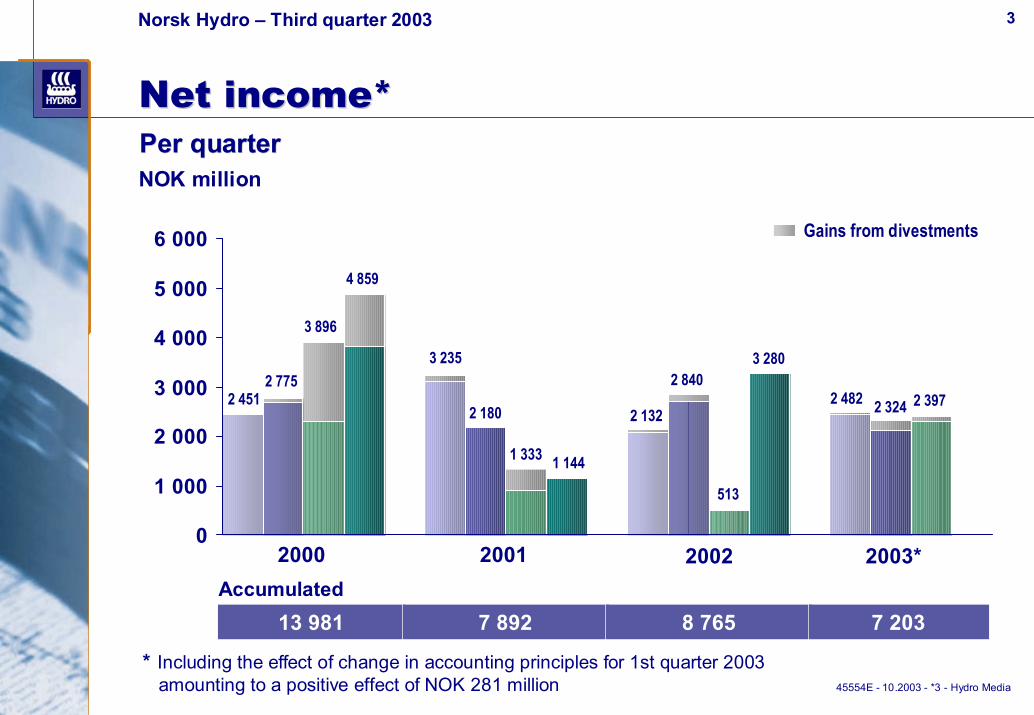
Net income*Net income*
3
0
1 000
2 000
3 000
4 000
5 000
6 000
2000 2001 2002 2003*Accumulated
13 981 7 892 8 765 7 203
Per quarterPer quarter
2 4512 775
3 896
4 859
3 235
2 180
1 333 1 144
Gains from divestments
2 132
NOK million
2 840
513
3 280
2 482
* Including the effect of change in accounting principles for 1st quarter 2003 amounting to a positive effect of NOK 281 million
2 324 2 397
45554E - 10.2003 - *4 - Hydro Media
Norsk Hydro – Third quarter 2003
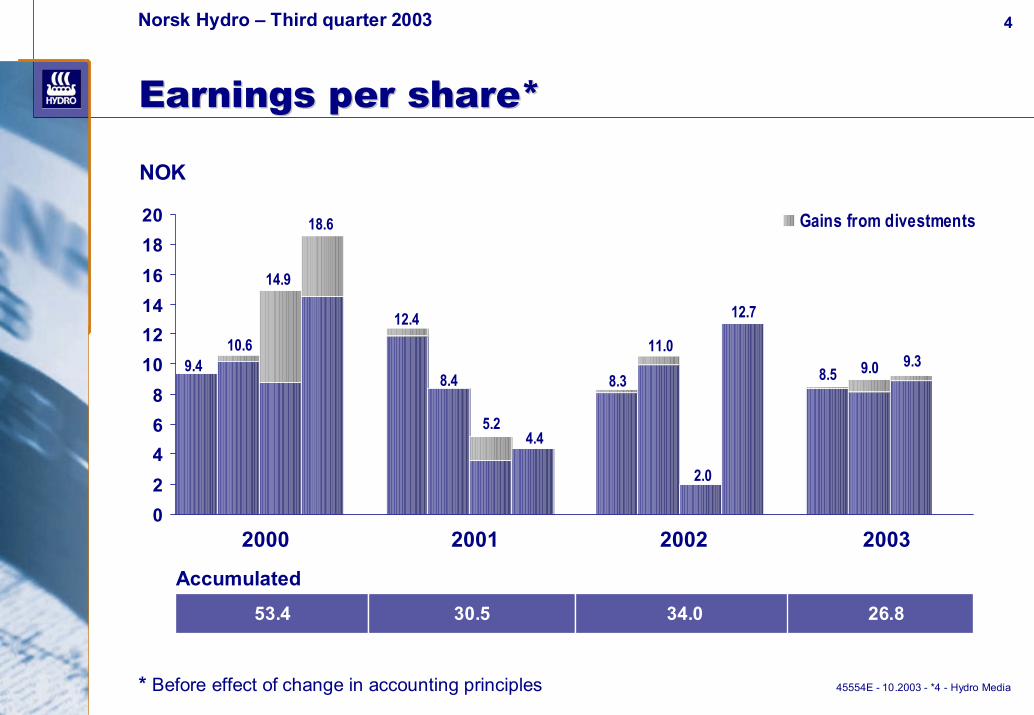
Earnings per share*Earnings per share*
4
0 2 4 6 8
10 12 14 16 18 20 Gains from divestments
NOK
2000 2001 2002 2003
53.4 30.5 34.0 26.8
9.410.6
14.9
18.6
12.4
8.4
5.24.4
8.3
11.0
2.0
12.7
* Before effect of change in accounting principles
Accumulated
8.5 9.0 9.3
45554E - 10.2003 - *5 - Hydro Media
Norsk Hydro – Third quarter 2003
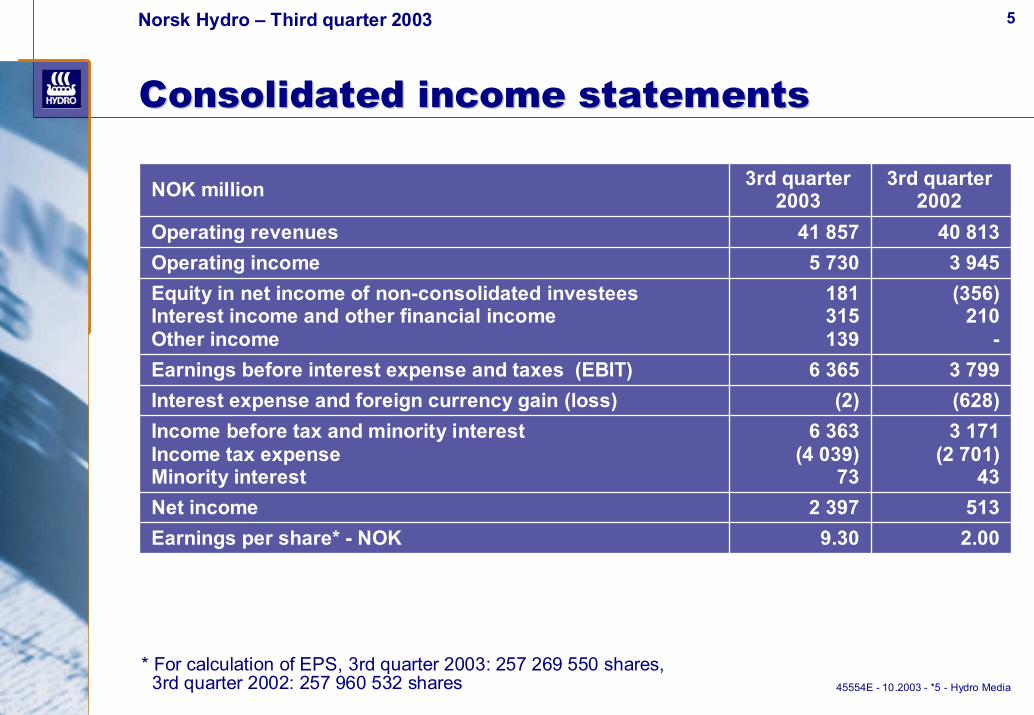
Consolidated income statements Consolidated income statements
5
2.00513
3 171(2 701)
43
(628)3 799
(356)210
-
3 94540 813
3rd quarter2002
9.30Earnings per share* - NOK2 397Net income
6 363(4 039)
73
Income before tax and minority interestIncome tax expense Minority interest
(2)Interest expense and foreign currency gain (loss)6 365Earnings before interest expense and taxes (EBIT)
181315139
Equity in net income of non-consolidated investeesInterest income and other financial incomeOther income
5 730Operating income41 857Operating revenues
3rd quarter2003NOK million
* For calculation of EPS, 3rd quarter 2003: 257 269 550 shares,3rd quarter 2002: 257 960 532 shares

45554E - 10.2003 - *6 - Hydro Media
Norsk Hydro – Third quarter 2003
Net financial income (expense)Net financial income (expense)
6
(418)313Net financial income (expense)
(628)(2)Interest expense and foreign exchange gain (loss)
(761)162
30(59)
(652)207475(32)
Interest expenseCapitalized interestNet foreign exchange gain (loss)Other
210315Interest income and other financial income
305(95)
27837
Interest income Dividends and net gain (loss) on securities
3rd quarter 2002
3rd quarter 2003NOK million

45554E - 10.2003 - *7 - Hydro Media
Norsk Hydro – Third quarter 2003
Operating incomeOperating income
7
Individual operating segmentIndividual operating segment
3 9455 730Total
19(92)
(318)(268)
Other ActivitiesCorporate and eliminations
412530Hydro Aluminium436464Hydro Agri
441(18)
12(23)
57118(4)
(55)
MetalsRolled ProductsExtrusion and AutomotiveOther and eliminations
3 1705 322Hydro Oil and Energy
2 583587
-
4 579739
4
Exploration and ProductionEnergy and Oil MarketingEliminations
3rd quarter2002
3rd quarter2003NOK million
45554E - 10.2003 - *8 - Hydro Media
Norsk Hydro – Third quarter 2003
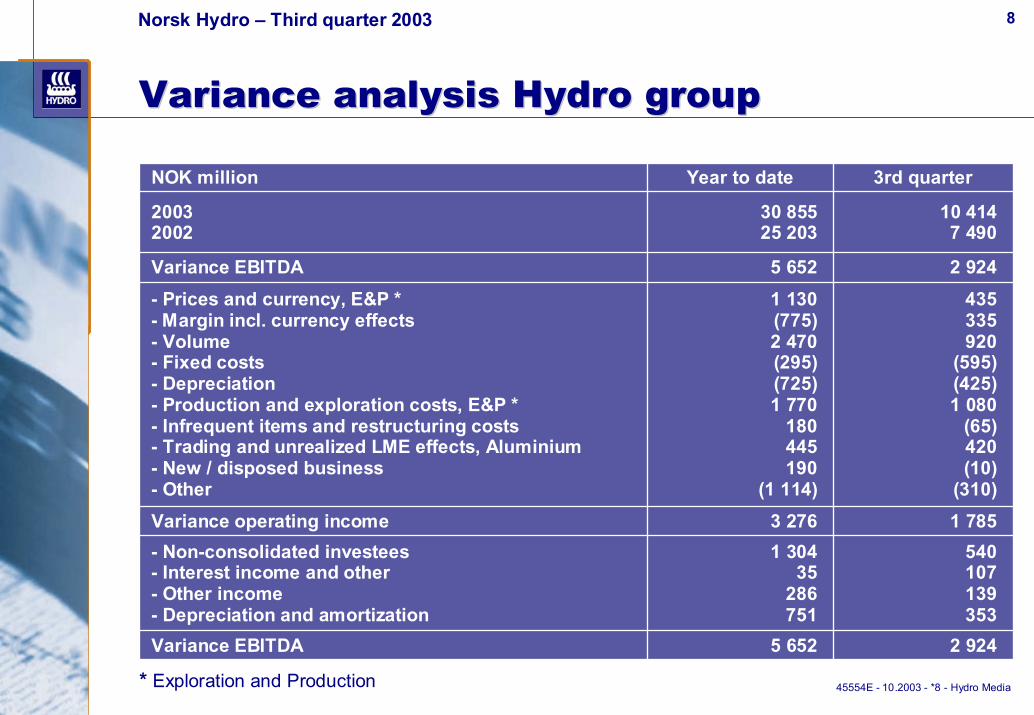
Variance analysis Hydro groupVariance analysis Hydro group
8
5 652
1 30435
286751
3 276
1 130(775)2 470(295)(725)1 770
180445190
(1 114)
5 652
30 85525 203
Year to date
1 785Variance operating income
2 924Variance EBITDA
540107139353
- Non-consolidated investees- Interest income and other- Other income- Depreciation and amortization
435335920
(595)(425)1 080
(65)420(10)
(310)
- Prices and currency, E&P *- Margin incl. currency effects- Volume- Fixed costs- Depreciation- Production and exploration costs, E&P *- Infrequent items and restructuring costs - Trading and unrealized LME effects, Aluminium - New / disposed business- Other
2 924Variance EBITDA
10 4147 490
20032002
3rd quarterNOK million
* Exploration and Production

45554E - 10.2003 - *9 - Hydro Media
Norsk Hydro – Third quarter 2003
Earnings before interest, tax, Earnings before interest, tax, depreciation and amortization (EBITDA)depreciation and amortization (EBITDA)
11 359 11 16410 996
12 387
7 297
10 455
8 588
10 349
9 125 9 2779 970
7 490
10 414
9 131
12 877
0
2 000
4 000
6 000
8 000
10 000
12 000
14 000
2000 2001 2002 2003
9
Accumulated46 609 37 757 35 658 30 855
Per quarterPer quarterNOK million

45554E - 10.2003 - *10 - Hydro Media
Norsk Hydro – Third quarter 2003
Net interestNet interest--bearing debt/ bearing debt/ shareholders’ equity*shareholders’ equity*
0.41
0.28
0.44
0.24
0
0.1
0.2
0.3
0.4
0.5
0.6
2000 2001 2002 30.09.2003
10
Ratio
* Net interest-bearing debt divided by shareholders' equity plus minority interest

45554E - 10.2003 - *11 - Hydro Media
Norsk Hydro – Third quarter 2003
DivestmentsDivestments –– status status
11
9.0 Total0.4 CompletedOther0.2 SignedGjøa 0.2 CompletedCarmeda
0.6 CompletedVarious E&P assets1.8 SignedScanraff2.6 CompletedTreka assets3.2 CompletedFlexible Packaging
Enterprise valueNOK billion
StatusBusiness unit

Oil and Energy Oil and Energy –– highlights third quarterhighlights third quarter
12
45554E - 10.2003 - *12 - Hydro Media
� Strong results for oil and gas activities� Good production performance – high regularity, cost discipline� High oil and gas prices
� Projects� Ormen Lange – principles for Norway-UK treaty in place� Grane and Fram Vest in production
� Exploration� Discoveries on NCS (Ringhorne Øst and Klegg)� Anaran farm-out in Iran approved
� Energy� Agreement to sell Hydro’s interest in Scanraff signed
Norsk Hydro – Third quarter 2003
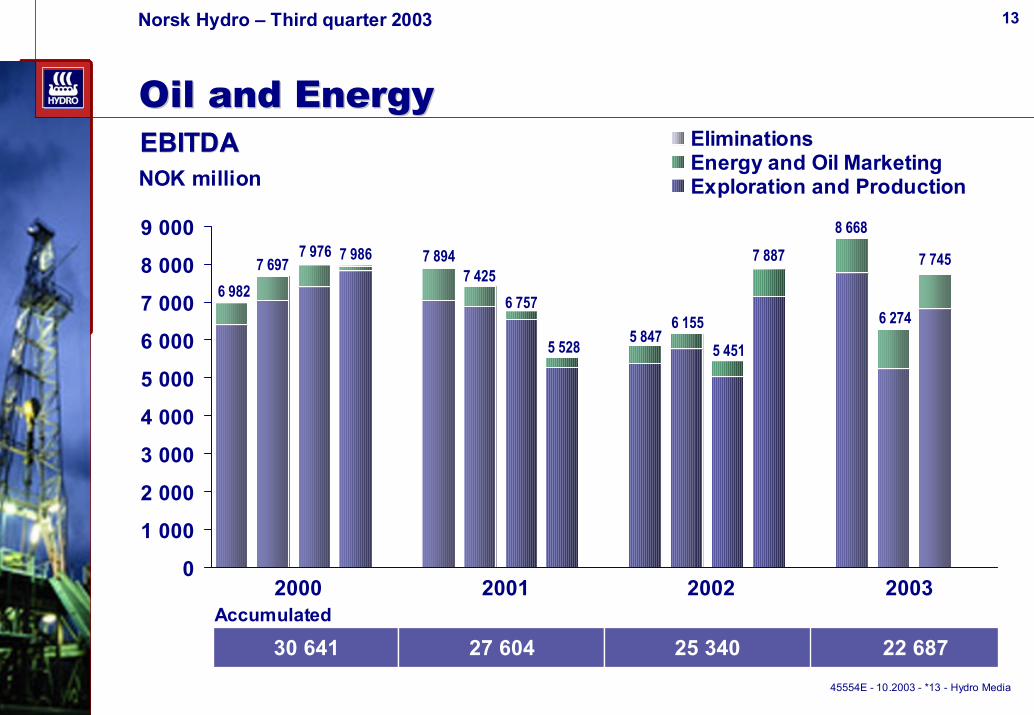
30 641 22 687
Oil and EnergyOil and EnergyEBITDAEBITDA
13
45554E - 10.2003 - *13 - Hydro Media
0
1 000
2 000
3 000
4 000
5 000
6 000
7 000
8 000
9 000
EliminationsEnergy and Oil MarketingExploration and Production
EBITDAEBITDA
27 604 25 340
6 982
7 6977 976 7 986 7 894
7 425
6 757
5 528
NOK million
2000 2001 2002 2003
5 8476 155
5 451
7 887
Accumulated
8 668
6 274
7 745
Norsk Hydro – Third quarter 2003

421
Petroleum productionPetroleum production
14 14
Per quarterPer quarter1 000 boe/day
45554E - 10.2003 - *14 - Hydro Media
Average per year:480 416 508
2000 2001 2002 2003
337 325 313333 334
311 328 336 338378 364
397 396372 373
10486
57
110 9374
115 110104
88
143 156
112 116
91
442411
371
443 427385
419451 448
482452
540 552
484 489
0
100
200
300
400
500
600 Oil Gas
Norsk Hydro – Third quarter 2003

15
Operating costs per barrelOperating costs per barrel
45554E - 10.2003 - *15 - Hydro Media
NOK/boe
Mill boe produced 139175154151
* Hydro’s net cost as an owner and user of transportation and processing
99.7
86.691.5 90.1
0
20
40
60
80
100
Exploration 11.2 9.1 20.3 7.8Net transportation * 7.3 8.5 9.0 7.1Other cost/income 1.7 2.3 2.0 2.5Deprec.& aband. 49.0 46.4 46.4 47.1Field/Prod. cost 22.3 23.8 22.0 22.1Total 91.5 90.1 99.7 86.6
2000 2001 2002 Jan-Sep 2003
Norsk Hydro – Third quarter 2003

16
Exploration activities third quarterExploration activities third quarter
45554E - 10.2003 - *16 - Hydro Media
Dry10%Norway – Isac (PL 189)
Discovery28.5%Norway – Klegg (PL036)
Dry13.5%Norway – Gråspett (PL128)
Ongoing - Q475%Iran – Anaran (Azar well) Dry15%Canada – Terra Nova Far EastDiscovery13.5%Norway – Ringhorne Øst (PL169)
StatusHydro shareLocation
Norsk Hydro – Third quarter 2003
Oil and Energy Oil and Energy –– prospectsprospects
17
45554E - 10.2003 - *17 - Hydro Media
� Production target 2003 increased to 520 000 boe/day� Fourth quarter target is 560 000 boe/day
� Ormen Lange PDO expected fourth quarter
� Exploration activities in Iran, Libya and Angola
� Asset sales pending approval� Scanraff – gain of NOK 600 million (net of tax)� Gjøa – gain of NOK 250 million (net of tax)
Norsk Hydro – Third quarter 2003
Aluminium Aluminium –– highlights third quarterhighlights third quarter
18
45554E - 10.2003 - *18 - Hydro Media
� Earnings influenced by weak markets� Higher aluminium prices offset by weaker USD� Continued pressure on downstream margins� Contributions from hedging and trading
� Improvement programs ahead of plan
� Important strategic decisions� Alunorte alumina expansion approved� Söderberg capacity in Årdal and Høyanger
not to be replaced
Norsk Hydro – Third quarter 2003
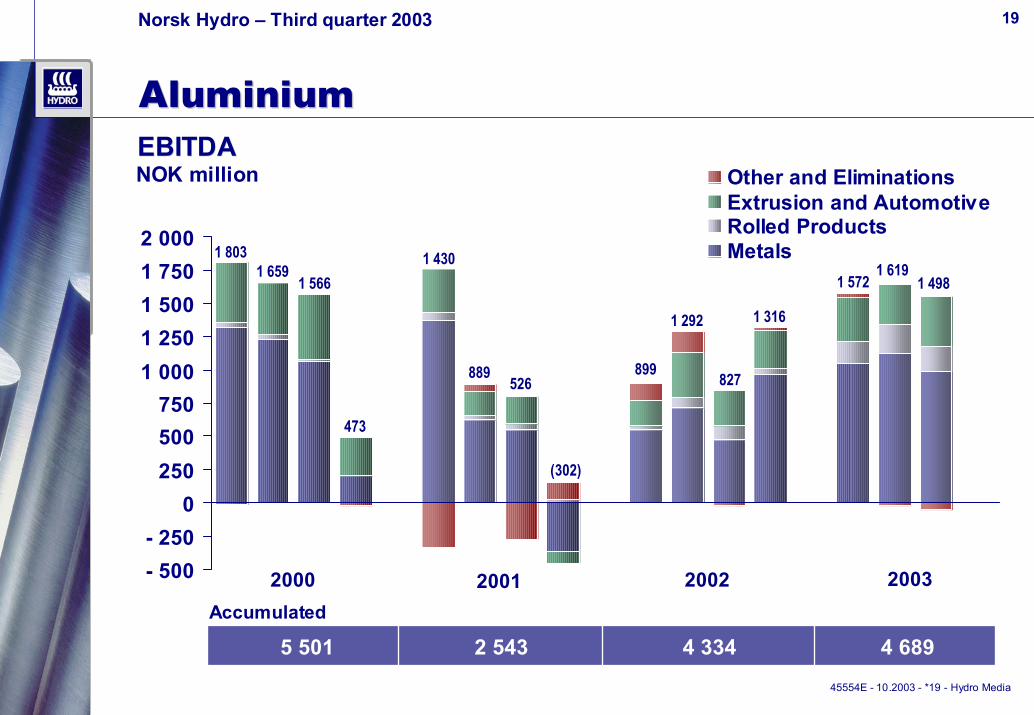
4 689
AluminiumAluminium
19
45554E - 10.2003 - *19 - Hydro Media
- 500- 250
0 250 500 750
1 0001 2501 5001 7502 000
Other and EliminationsExtrusion and AutomotiveRolled ProductsMetals
NOK million
20012000 2002 2003
5 501
1 8031 659
1 566
473
1 430
889526
(302)
899
1 292
EBITDAEBITDA
827
1 316
Accumulated
1 5721 619
1 498
2 543 4 334
Norsk Hydro – Third quarter 2003

Aluminium Aluminium –– Business commentsBusiness comments
20
45554E - 10.2003 - *20 - Hydro Media
� Metals – satisfactory operational performance� Volume increases as capacity comes on stream� Strong performance by casthouse operations
� Rolled Products – improved results, still not satisfactory
� Extrusion & Automotive – challenging markets� Extrusion – satisfactory performance� Automotive – new products add volumes � North America – operational improvements
Norsk Hydro – Third quarter 2003
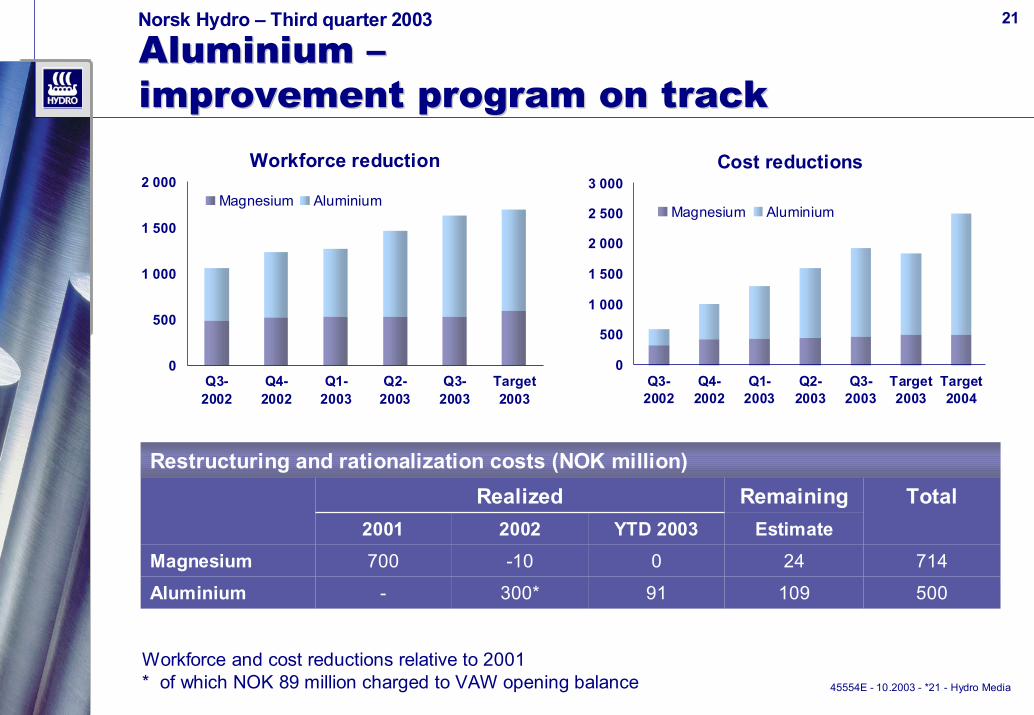
Aluminium Aluminium ––improvement program on trackimprovement program on track
21
45554E - 10.2003 - *21 - Hydro Media
50010991300*-Aluminium714240-10700Magnesium
TotalEstimateYTD 2003 20022001
RemainingRealizedRestructuring and rationalization costs (NOK million)
Workforce and cost reductions relative to 2001* of which NOK 89 million charged to VAW opening balance
Workforce reduction
0
500
1 000
1 500
2 000
Q3-2002
Q4-2002
Q1-2003
Q2-2003
Q3-2003
Target2003
Magnesium Aluminium
Cost reductions
0
500
1 000
1 500
2 000
2 500
3 000
Q3-2002
Q4-2002
Q1-2003
Q2-2003
Q3-2003
Target2003
Target2004
Magnesium Aluminium
Norsk Hydro – Third quarter 2003
Aluminium Aluminium –– prospectsprospects
22
45554E - 10.2003 - *22 - Hydro Media
� Fourth quarter outlook� Uncertainty on aluminium price development� No imminent downstream market recovery,
demand seasonally lower� Downstream margins remain under pressure� Lower contributions expected from hedging and trading
� Strengthen performance through internal measures� Complete current improvement program � Turnaround under-performing units
� Investments to improve cost position� Sunndal, Alouette, Alunorte
Norsk Hydro – Third quarter 2003
AgriAgri –– highlights highlights third quarterthird quarter
23
45554E - 10.2003 - *23 - Hydro Media
� Solid results � Fertilizer prices further improved� Negative impact from currency and energy costs
� Positive start of European fertilizer season� Satisfactory demand for early deliveries� Low imports to Europe
� Good results outside Europe and for industrial products
Norsk Hydro – Third quarter 2003

AgriAgri
9511 078
705 819
1 570
1 008
725
1 099
1 383
1 198
719 645
1 2021 073
989
0 200 400 600 800
1 0001 2001 4001 6001 800
EBITDAEBITDA
24
3 553 4 402 3 945 3 264
NOK million
Accumulated
45554E - 10.2003 - *24 - Hydro Media
20012000 2002 2003
Norsk Hydro – Third quarter 2003

AgriAgri –– prospectsprospects
25
45554E - 10.2003 - *25 - Hydro Media
� Favorable global market balance
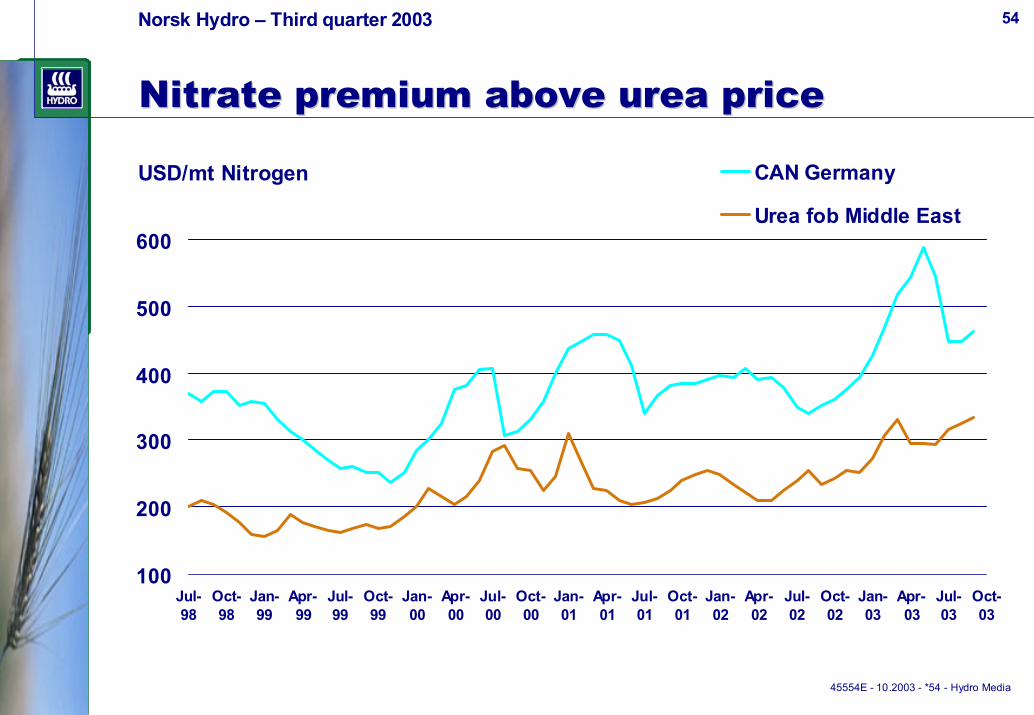
� Positive market situation for nitrogen fertilizers in Europe
� High energy costs
� Negative currency effects also next quarter
Norsk Hydro – Third quarter 2003
45554E - 10.2003 - *26 - Hydro Media
Norsk Hydro – Third quarter 2003
Norsk Hydro Norsk Hydro –– priorities aheadpriorities ahead
26
� Successful Agri separation and listing
� Internal improvement measures� Complete Aluminium improvement program� Streamline support functions
� First class project execution
� Capital discipline

Additional informationAdditional informationAdditional information
45554E - 10.2003 - *28 - Hydro Media
Norsk Hydro – Third quarter 2003
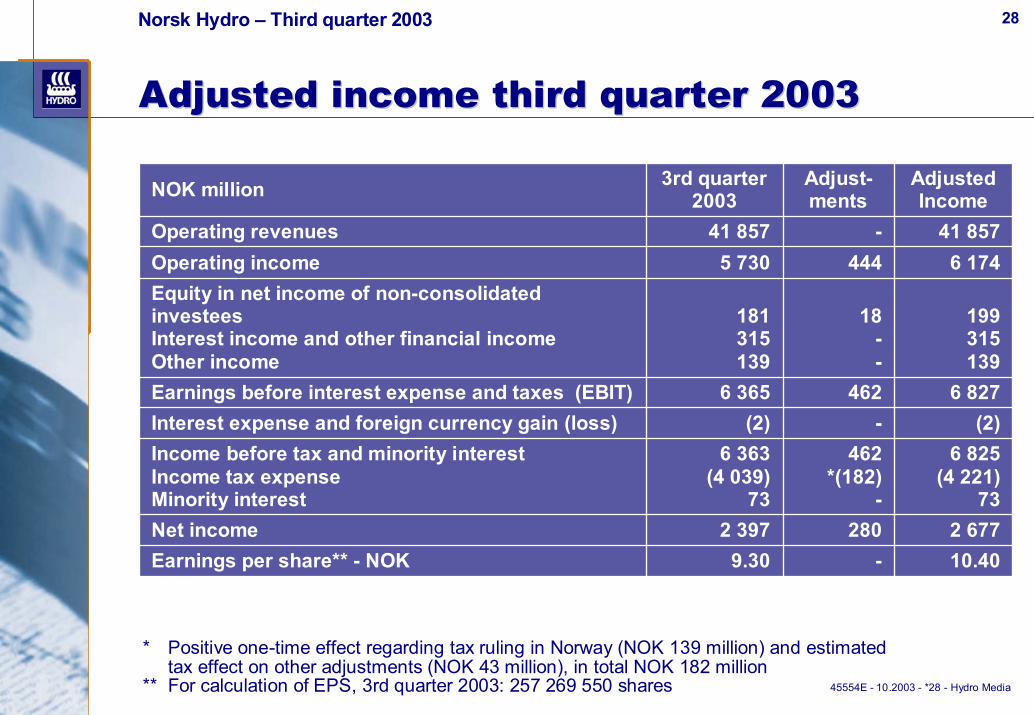
Adjusted income third quarter 2003Adjusted income third quarter 2003
28
-280
462*(182)
-
-462
18--
444-
Adjust-ments
10.402 677
6 825(4 221)
73
(2)6 827
199315139
6 17441 857
AdjustedIncome
9.30Earnings per share** - NOK2 397Net income
6 363(4 039)
73
Income before tax and minority interestIncome tax expense Minority interest
(2)Interest expense and foreign currency gain (loss)6 365Earnings before interest expense and taxes (EBIT)
181315139
Equity in net income of non-consolidated investeesInterest income and other financial incomeOther income
5 730Operating income41 857Operating revenues
3rd quarter2003NOK million
* Positive one-time effect regarding tax ruling in Norway (NOK 139 million) and estimated tax effect on other adjustments (NOK 43 million), in total NOK 182 million
** For calculation of EPS, 3rd quarter 2003: 257 269 550 shares
45554E - 10.2003 - *29 - Hydro Media
Norsk Hydro – Third quarter 2003
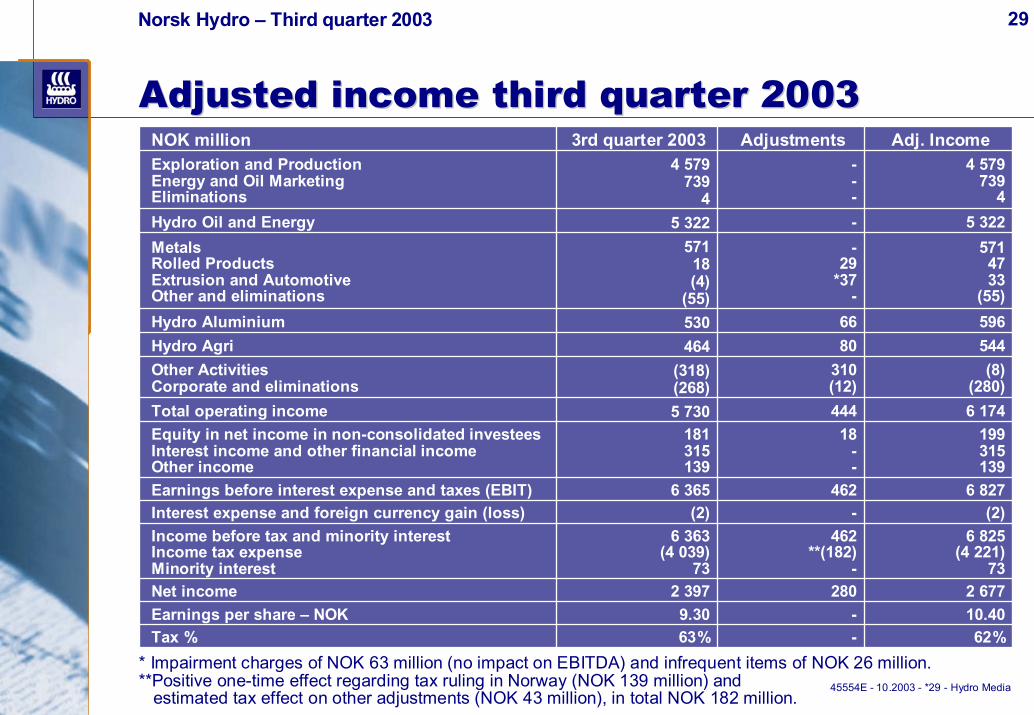
Adjusted income third quarter 2003Adjusted income third quarter 2003
29
6 8274626 365Earnings before interest expense and taxes (EBIT)(2)-(2)Interest expense and foreign currency gain (loss)
--
280
462**(182)
-
18--
444
310(12)
8066
-29
*37-
-
---
Adjustments
5 3225 322Hydro Oil and Energy5714733
(55)
57118(4)
(55)
MetalsRolled ProductsExtrusion and AutomotiveOther and eliminations
596530Hydro Aluminium544464Hydro Agri(8)
(280)(318)(268)
Other ActivitiesCorporate and eliminations
6 1745 730Total operating income
10.409.30Earnings per share – NOK2 6772 397Net income
62%63%Tax %
6 825(4 221)
73
6 363(4 039)
73
Income before tax and minority interestIncome tax expenseMinority interest
199315139
181315139
Equity in net income in non-consolidated investeesInterest income and other financial income Other income
4 579739
4
4 579739
4
Exploration and ProductionEnergy and Oil MarketingEliminations
Adj. Income3rd quarter 2003NOK million
* Impairment charges of NOK 63 million (no impact on EBITDA) and infrequent items of NOK 26 million.**Positive one-time effect regarding tax ruling in Norway (NOK 139 million) and
estimated tax effect on other adjustments (NOK 43 million), in total NOK 182 million.
45554E - 10.2003 - *30 - Hydro Media
Norsk Hydro – Third quarter 2003 30
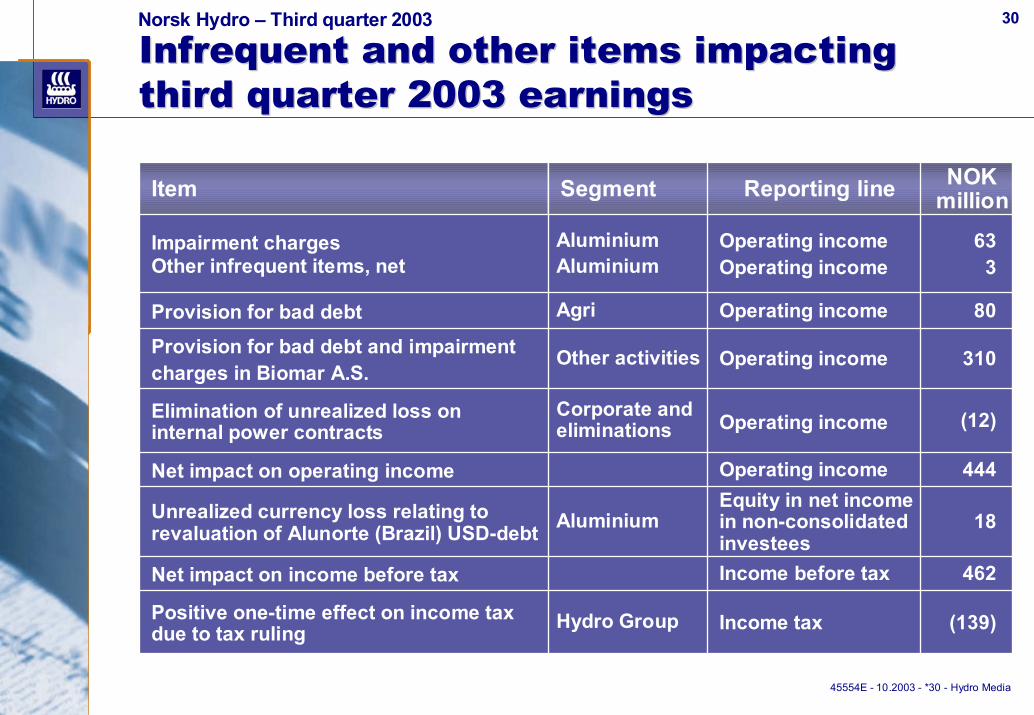
Infrequent and other items impacting Infrequent and other items impacting third quarter 2003 earningsthird quarter 2003 earnings
80Operating incomeAgriProvision for bad debt
Income tax
Income before tax
Equity in net income in non-consolidatedinvestees
Operating income
Operating income
Operating income
Operating incomeOperating income
Reporting line
462Net impact on income before tax
(139)Hydro GroupPositive one-time effect on income tax due to tax ruling
18AluminiumUnrealized currency loss relating to revaluation of Alunorte (Brazil) USD-debt
444Net impact on operating income
(12)Corporate and eliminations
Elimination of unrealized loss on internal power contracts
310Other activitiesProvision for bad debt and impairmentcharges in Biomar A.S.
633
AluminiumAluminium
Impairment chargesOther infrequent items, net
NOK millionSegmentItem
45554E - 10.2003 - *31 - Hydro Media
Norsk Hydro – Third quarter 2003
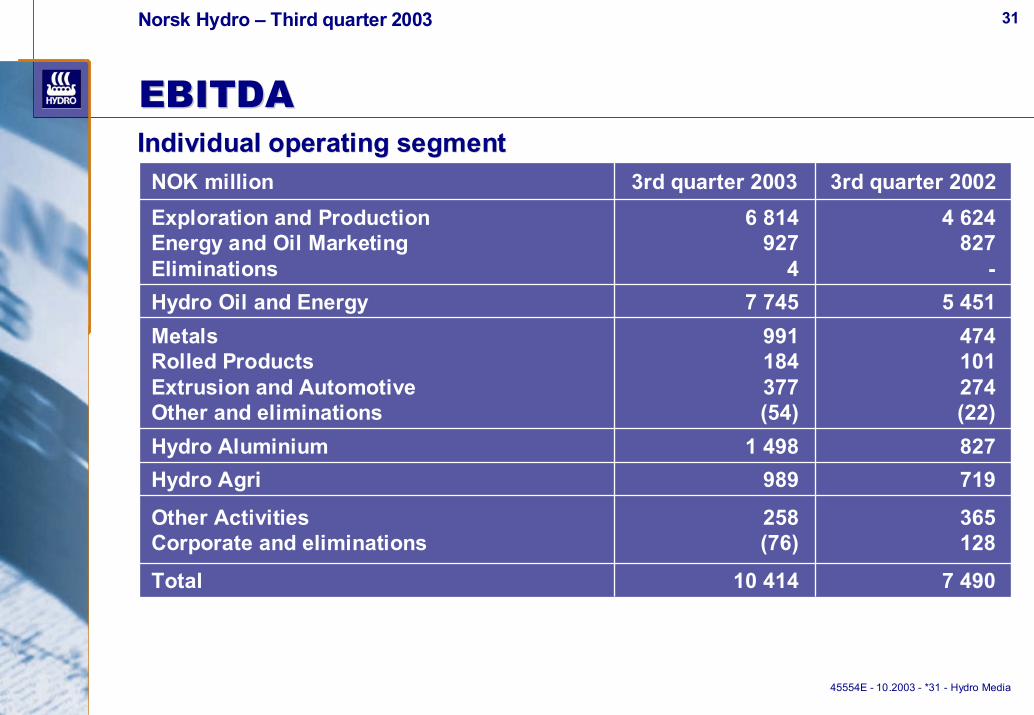
EBITDAEBITDA
31
Individual operating segmentIndividual operating segment
365128
258(76)
Other ActivitiesCorporate and eliminations
719989Hydro Agri8271 498Hydro Aluminium
7 49010 414Total
474101274(22)
991184377(54)
MetalsRolled ProductsExtrusion and AutomotiveOther and eliminations
5 4517 745Hydro Oil and Energy
4 624 827
-
6 814927
4
Exploration and ProductionEnergy and Oil MarketingEliminations
3rd quarter 20023rd quarter 2003NOK million

45554E - 10.2003 - *32 - Hydro Media
Norsk Hydro – Third quarter 2003
Operating income Operating income –– EBIT EBIT –– EBITDAEBITDAThird quarter 2003Third quarter 2003
37
39
7
(3)
5
61
(2)-
(11)
2(12)(1)
Selected fin. items
139
139
-
-
-
--
--
-
---
Other income
6 365
(102)
(78)
651
569
59116
17(55)
5 325
4 596726
3
EBIT
4 049
360
2
338
929
400168
3601
2 420
2 218201
1
Depr.and
Amort.
5 730
(318)
(268)
464
530
57118
(4)(55)
5 322
4 579739
4
Operating income
181
25
-
126
32
15(1)
18-
(2)
7(9)
-
Non-cons investees
258
(76)
13
183
Other ActivitiesCorporate and eliminations
98964Hydro Agri
1 4982Hydro Aluminium
10 414278Total
991184
377(54)
(1)(2)
5-
MetalsRolled ProductsExtrusion and AutomotiveOther and eliminations
7 74516Hydro Oil and Energy
6 814927
4
88-
Exploration and ProductionEnergy and Oil MarketingEliminations
EBITDAInterest incomeNOK million
32
45554E - 10.2003 - *33 - Hydro Media
Norsk Hydro – Third quarter 2003
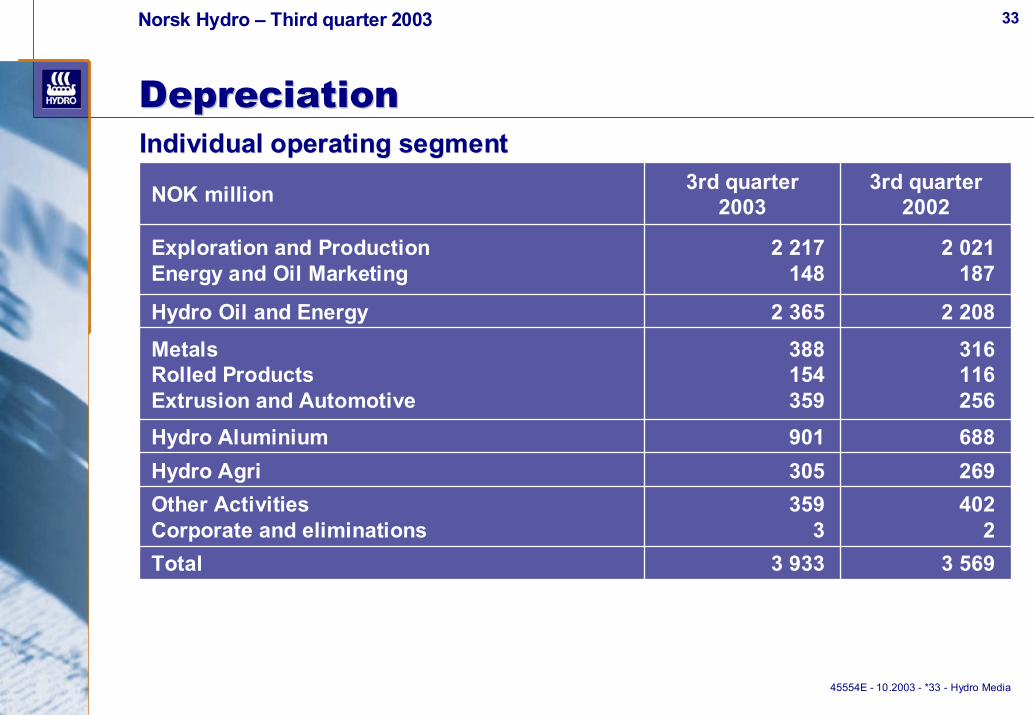
DepreciationDepreciation
Individual operating segmentIndividual operating segment
33
3 5693 933Total
4022
3593
Other ActivitiesCorporate and eliminations
688901Hydro Aluminium269305Hydro Agri
316116256
388154359
MetalsRolled ProductsExtrusion and Automotive
2 2082 365Hydro Oil and Energy
2 021187
2 217148
Exploration and ProductionEnergy and Oil Marketing
3rd quarter2002
3rd quarter2003NOK million
45554E - 10.2003 - *34 - Hydro Media
Norsk Hydro – Third quarter 2003
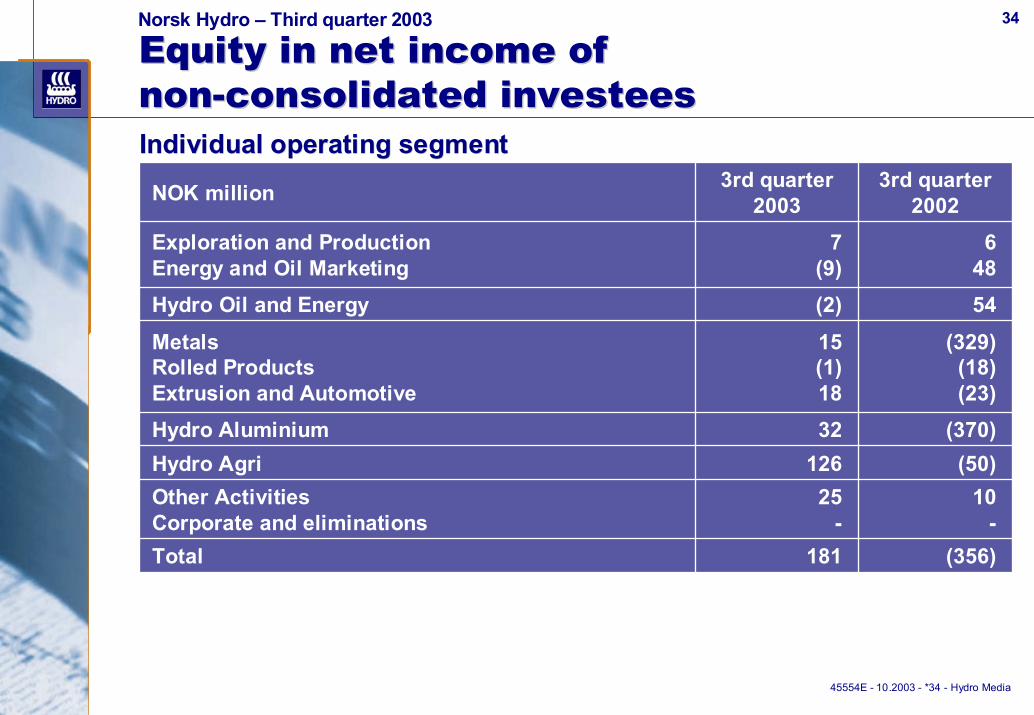
Equity in net income of Equity in net income of nonnon--consolidated consolidated investeesinvestees
Individual operating segmentIndividual operating segment
34
(356)181Total
10-
25-
Other ActivitiesCorporate and eliminations
(370)32Hydro Aluminium(50)126Hydro Agri
(329)(18)(23)
15(1)18
MetalsRolled ProductsExtrusion and Automotive
54(2)Hydro Oil and Energy
648
7(9)
Exploration and ProductionEnergy and Oil Marketing
3rd quarter2002
3rd quarter2003NOK million

45554E - 10.2003 - *35 - Hydro Media
Norsk Hydro – Third quarter 2003
Consolidated balance sheetConsolidated balance sheet
35 35
294.10207 211
7 3061 958
38 59330 90214 63336 809
1 14375 867
207 211
5 9652 647
40 55317 232
140 814
31.12.2002
288.10209 046
8 0482 062
40 60433 24714 32535 254
1 17574 331
209 046
10 5711 956
39 64317 238
139 638
30.09.2002
220 223Total liabilities and shareholders' equity329.70Shareholders' equity per share, NOK
5 9941 192
46 66329 42317 33334 299
66984 650
Short-term interest-bearing debtCurrent portion of long-term debtOther short-term liabilitiesLong-term interest-bearing debtOther long-term liabilitiesDeferred tax liabilitiesMinority interestShareholders' equity
220 223Total assets
16 4611 742
41 29916 876
143 845
Cash and cash equivalentsOther liquid assetsReceivablesInventoriesNon-current assets
30.09.2003NOK million
45554E - 10.2003 - *36 - Hydro Media
Norsk Hydro – Third quarter 2003
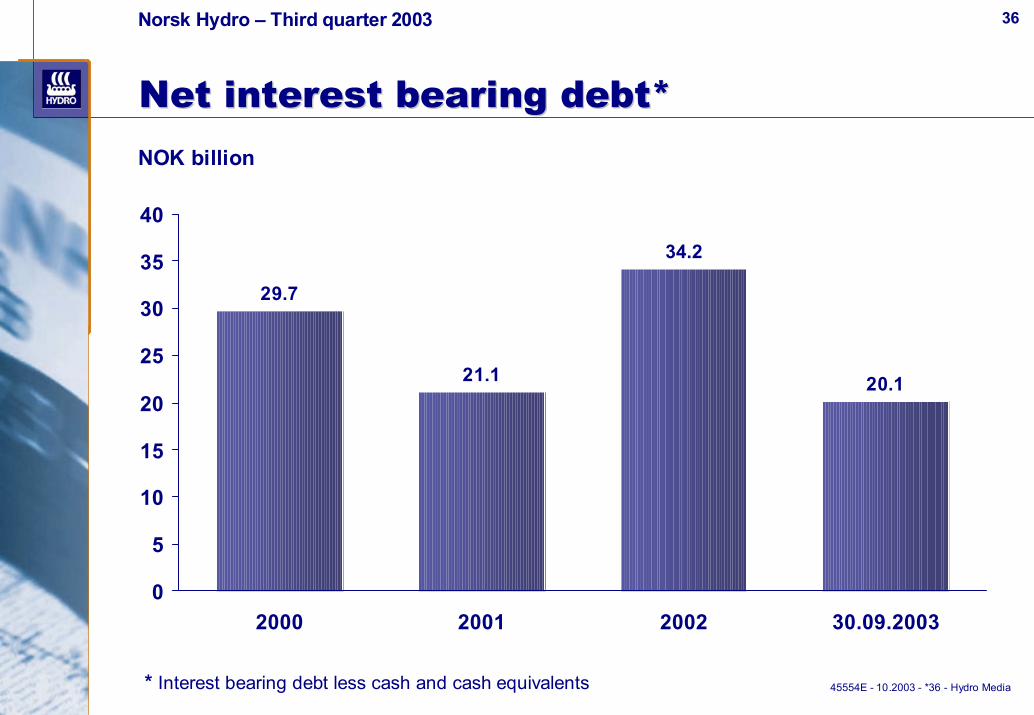
Net interest bearing debt*Net interest bearing debt*
36
29.7
21.1
34.2
20.1
0
5
10
15
20
25
30
35
40
2000 2001 2002 30.09.2003
NOK billion
* Interest bearing debt less cash and cash equivalents
45554E - 10.2003 - *37 - Hydro Media
Norsk Hydro – Third quarter 2003
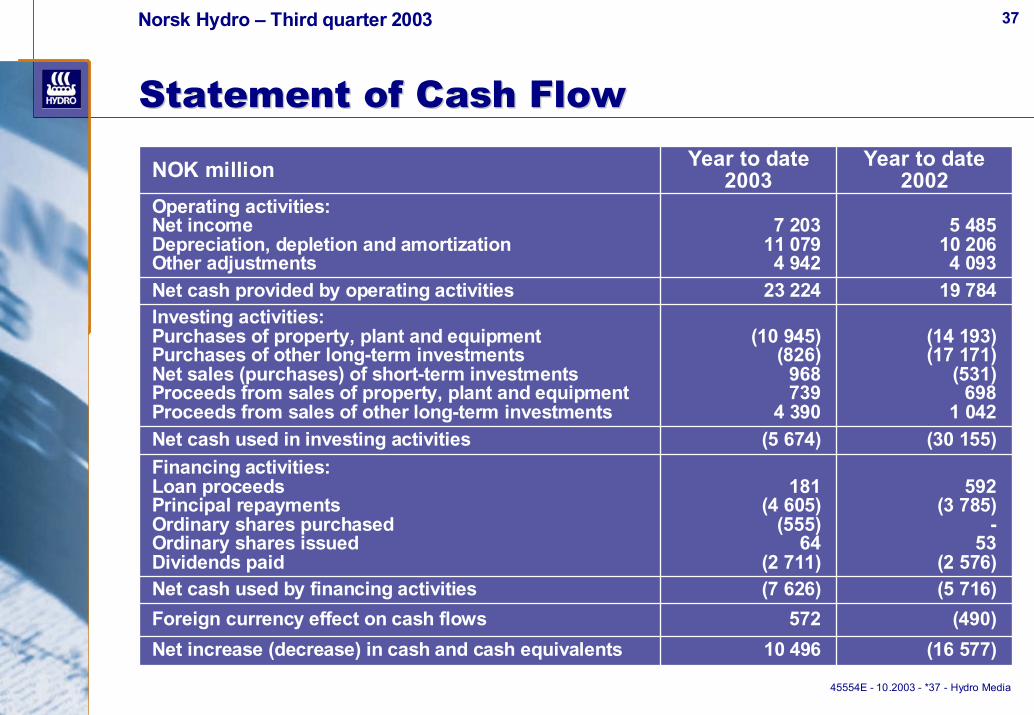
Statement of Cash FlowStatement of Cash Flow
37
(490)572Foreign currency effect on cash flows(16 577)10 496Net increase (decrease) in cash and cash equivalents
(5 716)(7 626)Net cash used by financing activities
(30 155)(5 674)Net cash used in investing activities
592(3 785)
-53
(2 576)
181(4 605)
(555)64
(2 711)
Financing activities:Loan proceedsPrincipal repaymentsOrdinary shares purchasedOrdinary shares issuedDividends paid
(14 193)(17 171)
(531)698
1 042
(10 945)(826)
968739
4 390
Investing activities:Purchases of property, plant and equipmentPurchases of other long-term investmentsNet sales (purchases) of short-term investmentsProceeds from sales of property, plant and equipmentProceeds from sales of other long-term investments
19 78423 224Net cash provided by operating activities
5 48510 2064 093
7 20311 0794 942
Operating activities: Net incomeDepreciation, depletion and amortizationOther adjustments
Year to date 2002
Year to date 2003NOK million
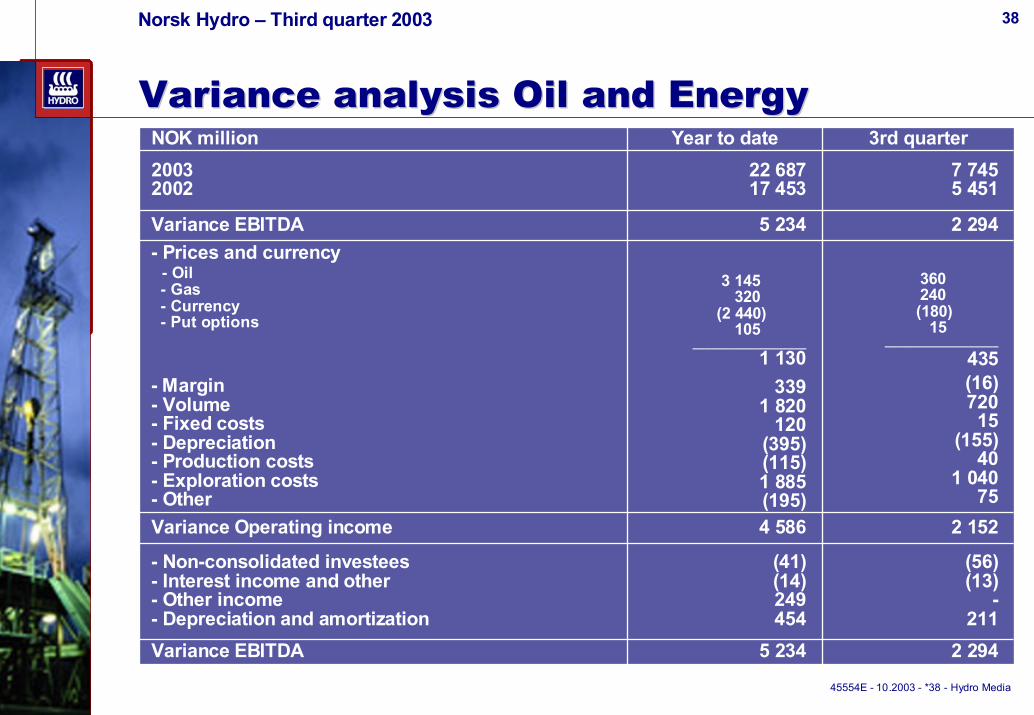
Variance analysis Oil and EnergyVariance analysis Oil and Energy
38
45554E - 10.2003 - *38 - Hydro Media
5 234
(41)(14)249454
4 586
3 145320
(2 440)105
___________________1 130
3391 820
120(395)(115)1 885(195)
5 234
22 68717 453
Year to date
2 152Variance Operating income
2 294Variance EBITDA
(56)(13)
-211
- Non-consolidated investees- Interest income and other- Other income- Depreciation and amortization
360240(180)
15___________________
435(16)72015
(155)40
1 04075
- Prices and currency- Oil- Gas- Currency- Put options
- Margin - Volume- Fixed costs- Depreciation- Production costs- Exploration costs- Other
2 294Variance EBITDA
7 7455 451
20032002
3rd quarterNOK million
Norsk Hydro – Third quarter 2003
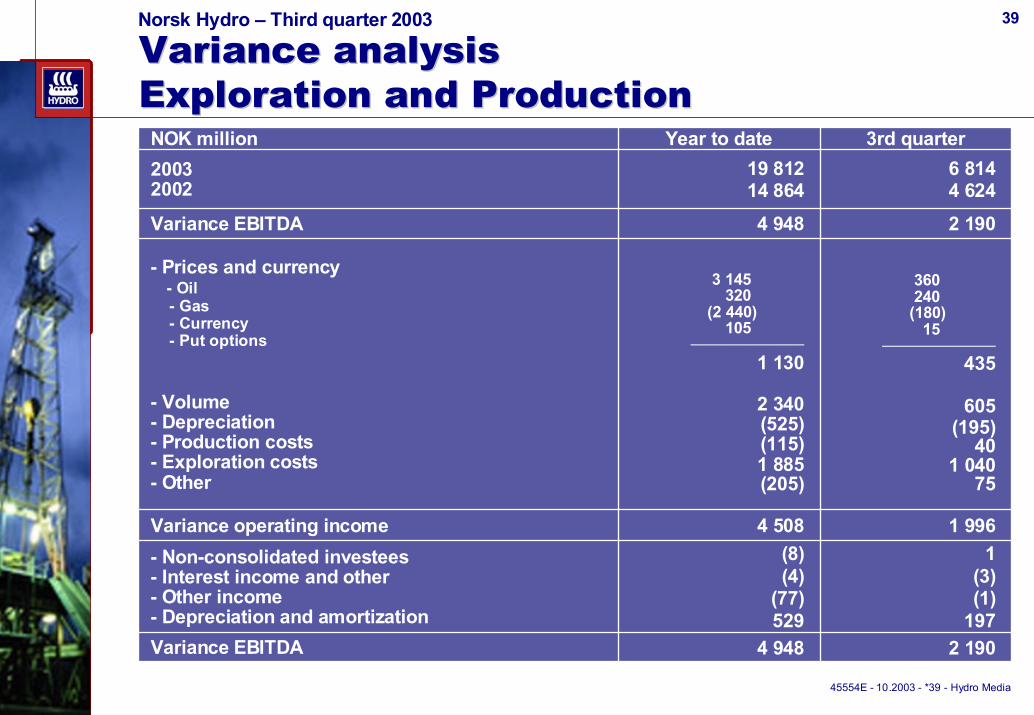
Variance analysis Variance analysis Exploration and ProductionExploration and Production
39
45554E - 10.2003 - *39 - Hydro Media
4 948
(8)(4)
(77)529
4 508
3 145320
(2 440)105
___________________
1 130
2 340(525)(115)1 885(205)
4 948
19 81214 864
Year to date
1 996Variance operating income
2 190Variance EBITDA
1(3)(1)
197
- Non-consolidated investees- Interest income and other- Other income- Depreciation and amortization
360240
(180)15
___________________
435
605(195)
401 040
75
- Prices and currency- Oil- Gas- Currency- Put options
- Volume- Depreciation- Production costs- Exploration costs- Other
2 190Variance EBITDA
6 8144 624
20032002
3rd quarterNOK million
Norsk Hydro – Third quarter 2003
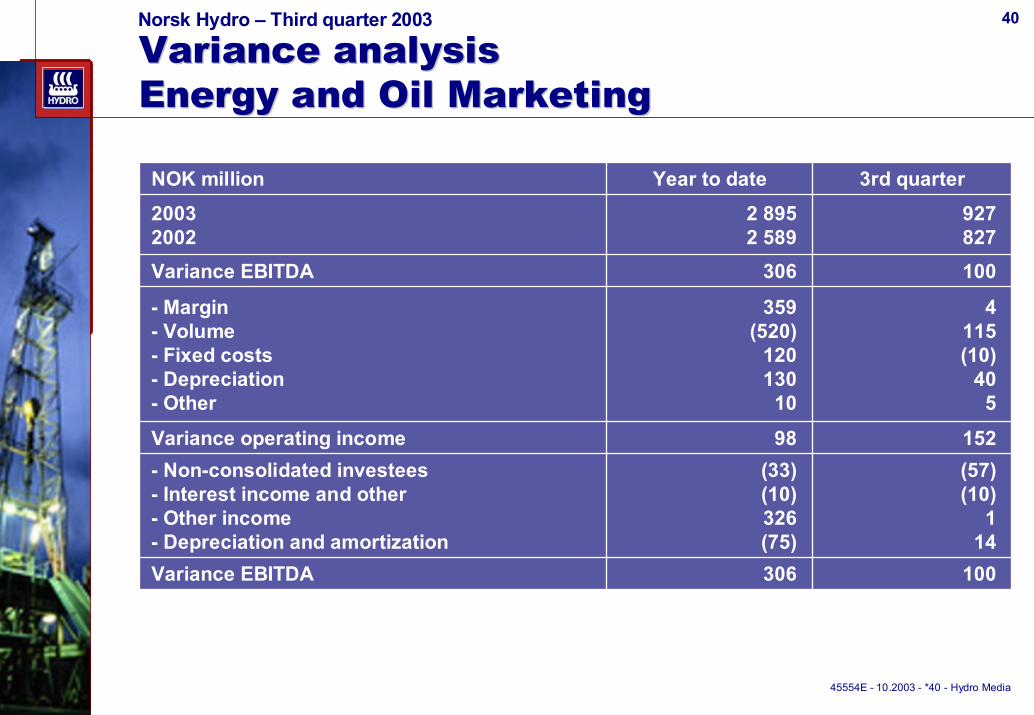
Variance analysis Variance analysis Energy and Oil Marketing Energy and Oil Marketing
40
45554E - 10.2003 - *40 - Hydro Media
306
(33)(10)326(75)
98
359(520)
120130
10
306
2 8952 589
Year to date
152Variance operating income
100Variance EBITDA
(57)(10)
114
- Non-consolidated investees- Interest income and other- Other income- Depreciation and amortization
4115(10)
405
- Margin- Volume- Fixed costs- Depreciation- Other
100Variance EBITDA
927827
20032002
3rd quarterNOK million
Norsk Hydro – Third quarter 2003
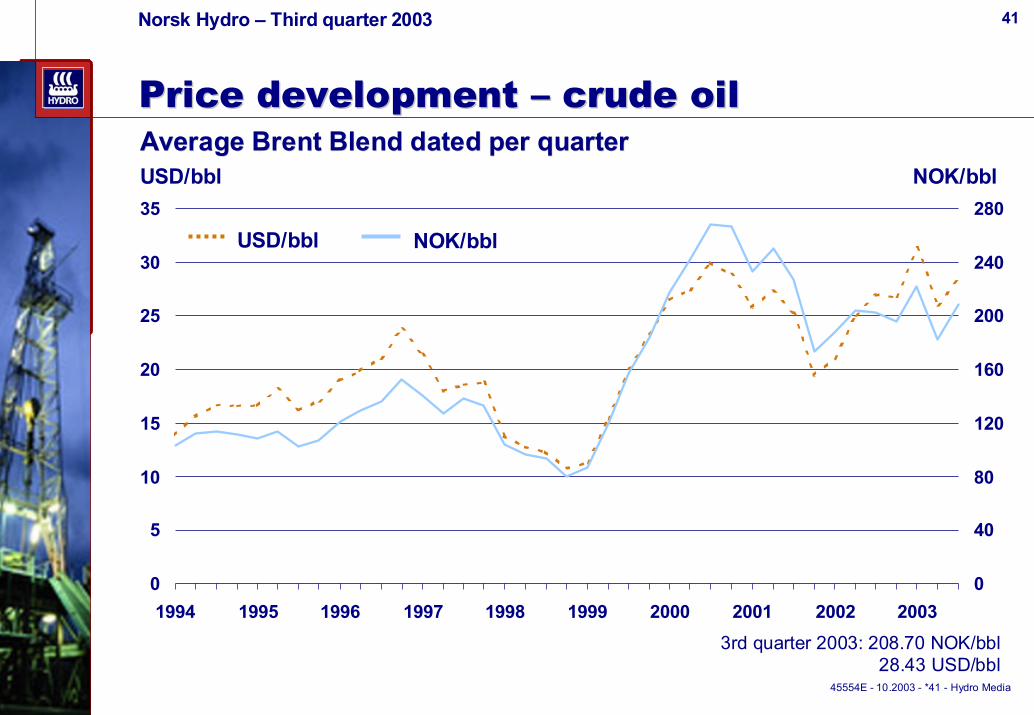
Price development Price development –– crude oilcrude oil
41
Average Brent Blend dated per quarterAverage Brent Blend dated per quarter
45554E - 10.2003 - *41 - Hydro Media
USD/bbl NOK/bbl
USD/bbl NOK/bbl
0
5
10
15
20
25
30
35
1994 1995 1996 1997 1998 1999 2000 2001 2002 20030
40
80
120
160
200
240
280
3rd quarter 2003: 208.70 NOK/bbl28.43 USD/bbl
Norsk Hydro – Third quarter 2003
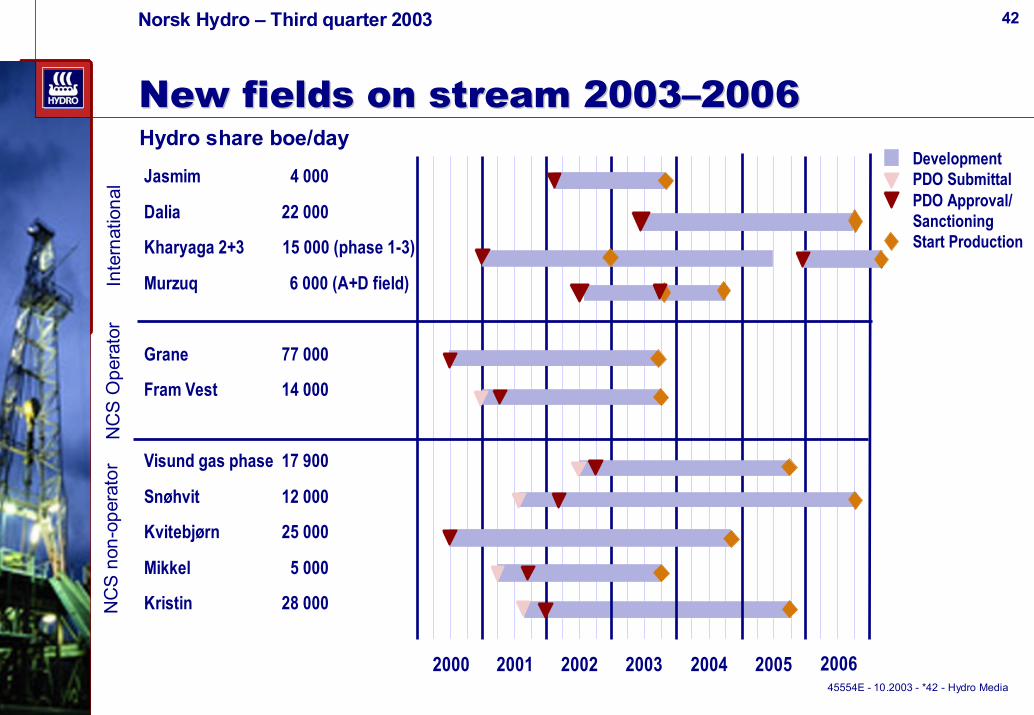
New fields on stream 2003New fields on stream 2003––20062006
42
Hydro share boe/dayDevelopmentPDO SubmittalPDO Approval/SanctioningStart Production
NC
S no
n-op
erat
orIn
tern
atio
nal
NC
S O
pera
tor
Jasmim 4 000
Dalia 22 000
Kharyaga 2+3 15 000 (phase 1-3)
Murzuq 6 000 (A+D field)
Grane 77 000
Fram Vest 14 000
Visund gas phase 17 900
Snøhvit 12 000
Kvitebjørn 25 000
Mikkel 5 000
Kristin 28 000
2000 2001 2002 2003 2004 2005 200645554E - 10.2003 - *42 - Hydro Media
Norsk Hydro – Third quarter 2003
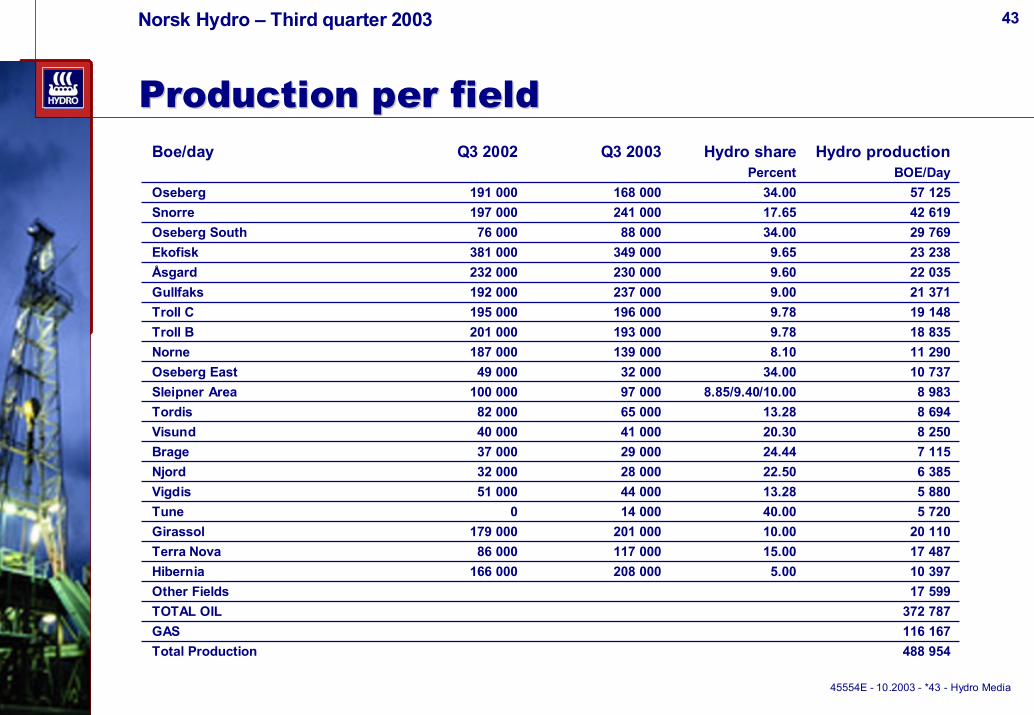
Hydro productionHydro shareQ3 2003Q3 2002Boe/day
20 11010.00201 000179 000Girassol
5 88013.2844 00051 000Vigdis6 38522.5028 00032 000Njord7 11524.4429 00037 000Brage8 25020.3041 00040 000Visund
8 9838.85/9.40/10.0097 000100 000Sleipner Area
11 2908.10139 000187 000Norne
23 2389.65349 000381 000Ekofisk
17 48715.00117 00086 000Terra Nova
5 72040.0014 0000Tune
8 69413.2865 00082 000Tordis
22 0359.60230 000232 000Åsgard
17 599Other Fields372 787TOTAL OIL116 167GAS488 954Total Production
10 73734.0032 00049 000Oseberg East
18 8359.78193 000201 000Troll B19 1489.78196 000195 000Troll C21 3719.00237 000192 000Gullfaks
29 76934.0088 00076 000Oseberg South
57 12534.00168 000191 000Oseberg 42 61917.65241 000197 000Snorre
10 3975.00208 000166 000Hibernia
BOE/DayPercent
Production per fieldProduction per field
43
45554E - 10.2003 - *43 - Hydro Media
Norsk Hydro – Third quarter 2003
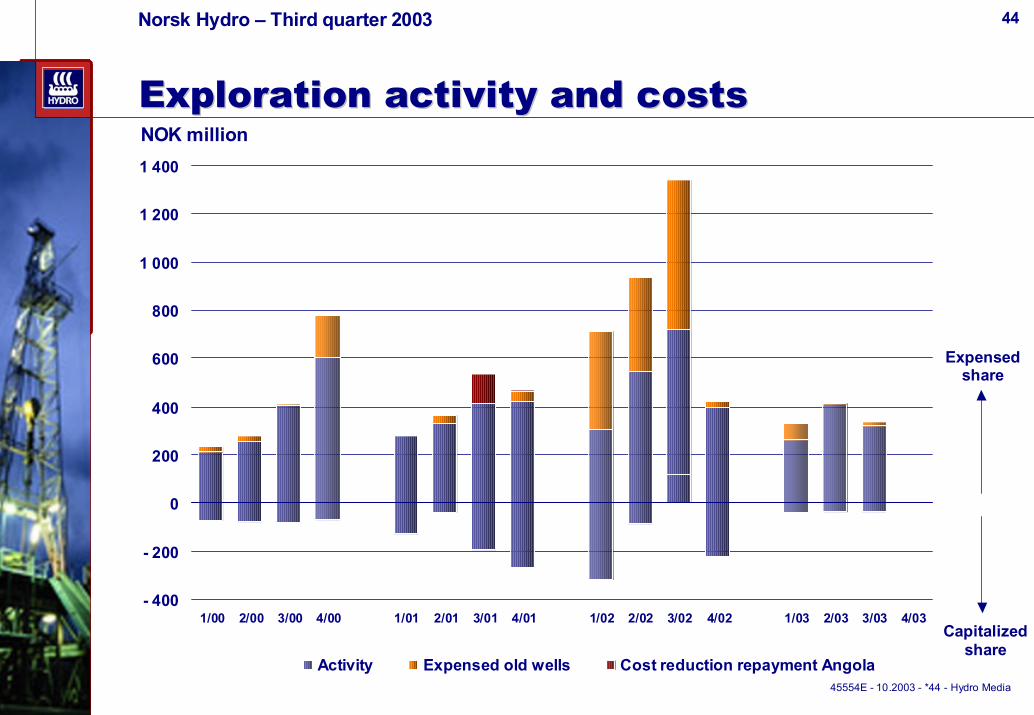
Exploration activity and costsExploration activity and costs
44
45554E - 10.2003 - *44 - Hydro Media
NOK million
Expensedshare
Capitalizedshare
- 400
- 200
0
200
400
600
800
1 000
1 200
1 400
1/00 2/00 3/00 4/00 1/01 2/01 3/01 4/01 1/02 2/02 3/02 4/02 1/03 2/03 3/03 4/03
Activity Expensed old wells Cost reduction repayment Angola
Norsk Hydro – Third quarter 2003
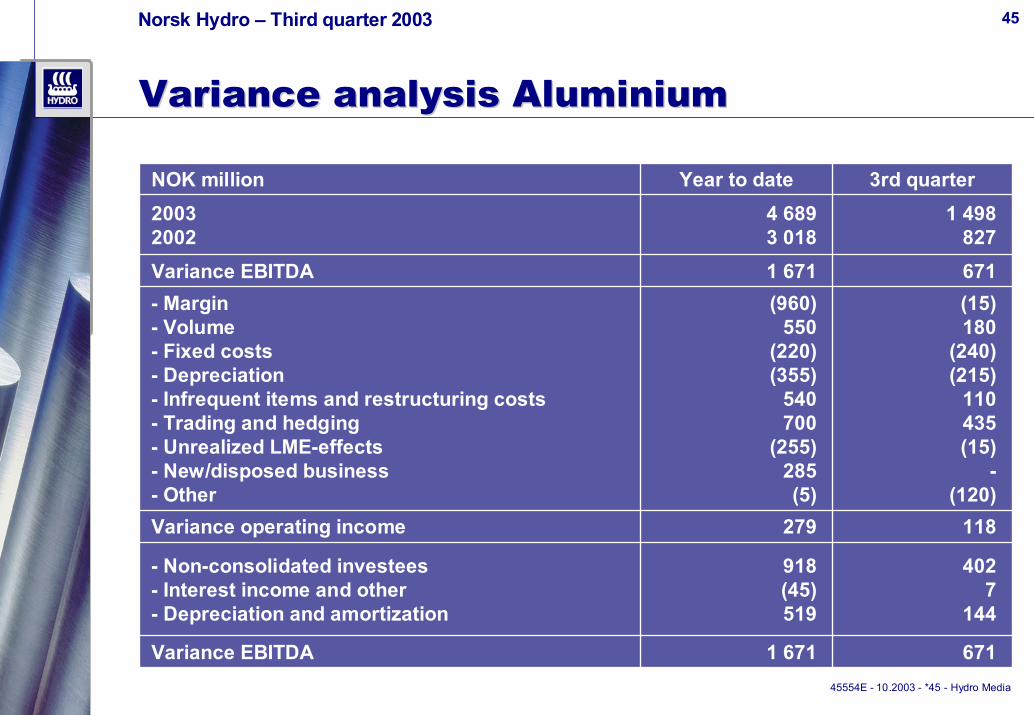
Variance analysis AluminiumVariance analysis Aluminium
45
45554E - 10.2003 - *45 - Hydro Media
1 671
918(45)519
279
(960)550
(220)(355)
540700
(255)285(5)
1 671
4 6893 018
Year to date
118Variance operating income
671Variance EBITDA
4027
144
- Non-consolidated investees- Interest income and other- Depreciation and amortization
(15)180
(240)(215)
110435(15)
-(120)
- Margin- Volume- Fixed costs- Depreciation- Infrequent items and restructuring costs- Trading and hedging- Unrealized LME-effects- New/disposed business- Other
671Variance EBITDA
1 498827
20032002
3rd quarterNOK million
Norsk Hydro – Third quarter 2003
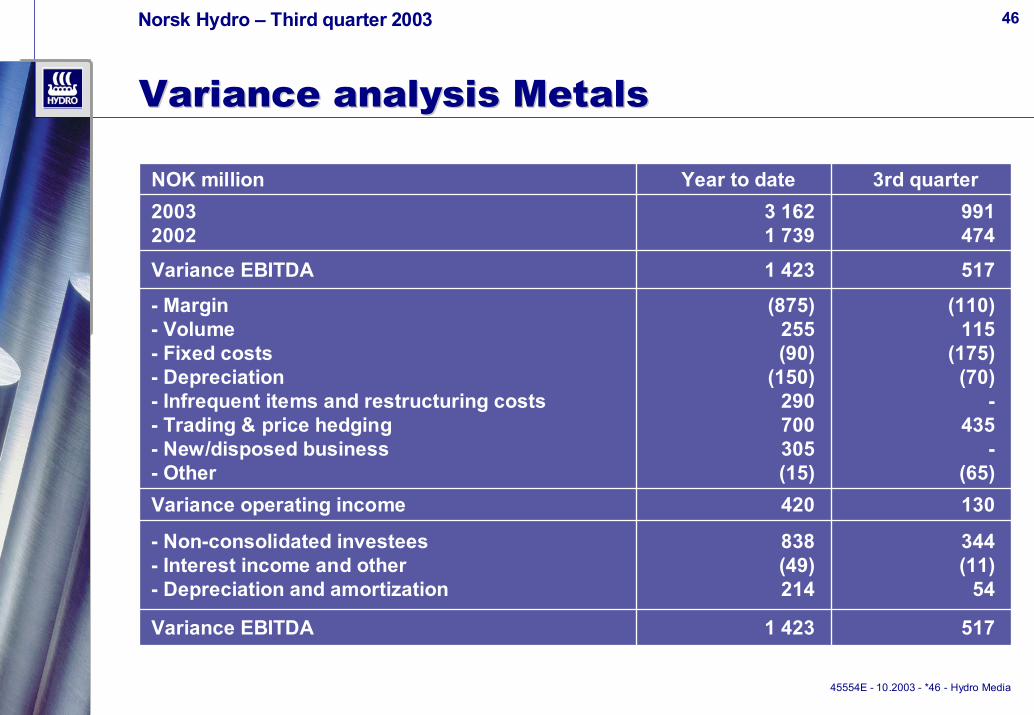
Variance analysis MetalsVariance analysis Metals
46
45554E - 10.2003 - *46 - Hydro Media
1 423
838(49)214
420
(875)255(90)
(150)290700305(15)
1 423
3 1621 739
Year to date
130Variance operating income
517Variance EBITDA
344(11)
54
- Non-consolidated investees- Interest income and other- Depreciation and amortization
(110)115
(175)(70)
-435
-(65)
- Margin- Volume- Fixed costs- Depreciation- Infrequent items and restructuring costs- Trading & price hedging- New/disposed business- Other
517Variance EBITDA
991474
20032002
3rd quarterNOK million
Norsk Hydro – Third quarter 2003

Variance analysis Rolled ProductsVariance analysis Rolled Products
47
45554E - 10.2003 - *47 - Hydro Media
356
40-
137
179
(40)165(50)(75)(10)200(10)
356
567211
Year to date
36Variance operating income
83Variance EBITDA
181415
- Non-consolidated investees- Interest income and other- Depreciation and amortization
654515
(40)(5)
-(45)
- Margin- Volume- Fixed costs- Depreciation- Infrequent items- New/disposed business- Other
83Variance EBITDA
184101
20032002
3rd quarterNOK million
Norsk Hydro – Third quarter 2003

Variance analysis Variance analysis Extrusion and AutomotiveExtrusion and Automotive
48
45554E - 10.2003 - *48 - Hydro Media
207
404
168
(5)
15130(80)
(130)50
(10)20
207
1 006799
Year to date
(16)Variance operating income
103Variance EBITDA
404
75
- Non-consolidated investees- Interest income and other- Depreciation and amortization
5020
(80)(105)
115-
(15)
- Margin- Volume- Fixed costs- Depreciation- Infrequent items- New/disposed business- Other
103Variance EBITDA
377274
20032002
3rd quarterNOK million
Norsk Hydro – Third quarter 2003
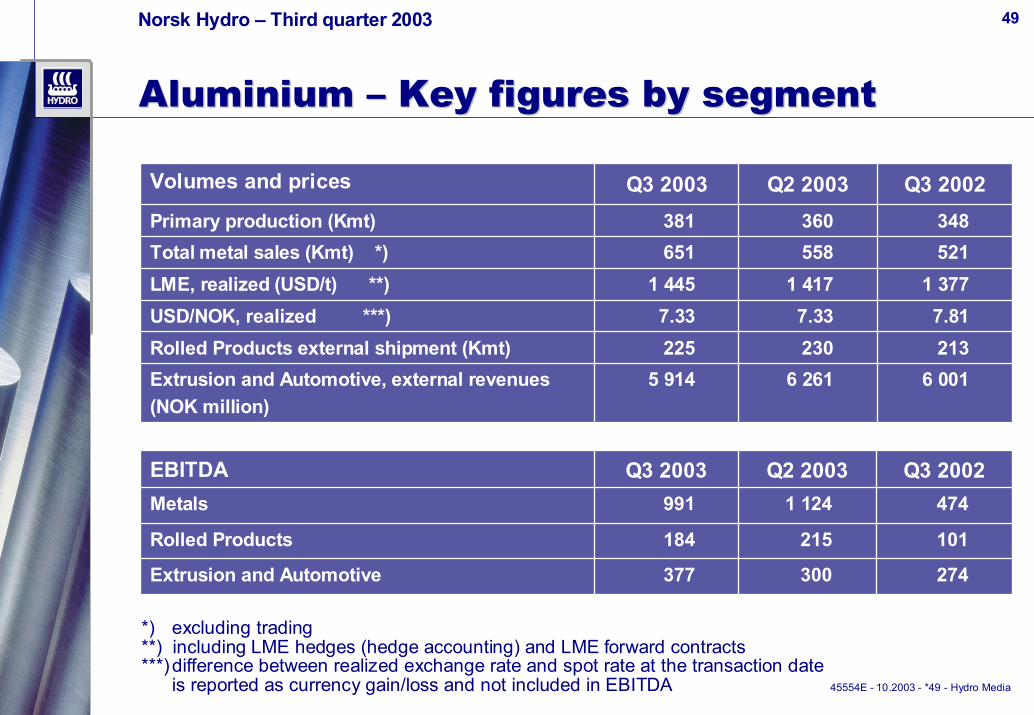
Aluminium Aluminium –– Key figures by segmentKey figures by segment
49
45554E - 10.2003 - *49 - Hydro Media
*) excluding trading**) including LME hedges (hedge accounting) and LME forward contracts***)difference between realized exchange rate and spot rate at the transaction date
is reported as currency gain/loss and not included in EBITDA
6 0016 2615 914Extrusion and Automotive, external revenues (NOK million)
213230225Rolled Products external shipment (Kmt)7.817.337.33USD/NOK, realized ***)
1 3771 4171 445LME, realized (USD/t) **)521558651Total metal sales (Kmt) *) 348360381Primary production (Kmt)
Q3 2002Q2 2003Q3 2003Volumes and prices
274300377Extrusion and Automotive
101215184Rolled Products
4741 124991MetalsQ3 2002Q2 2003Q3 2003EBITDA
Norsk Hydro – Third quarter 2003
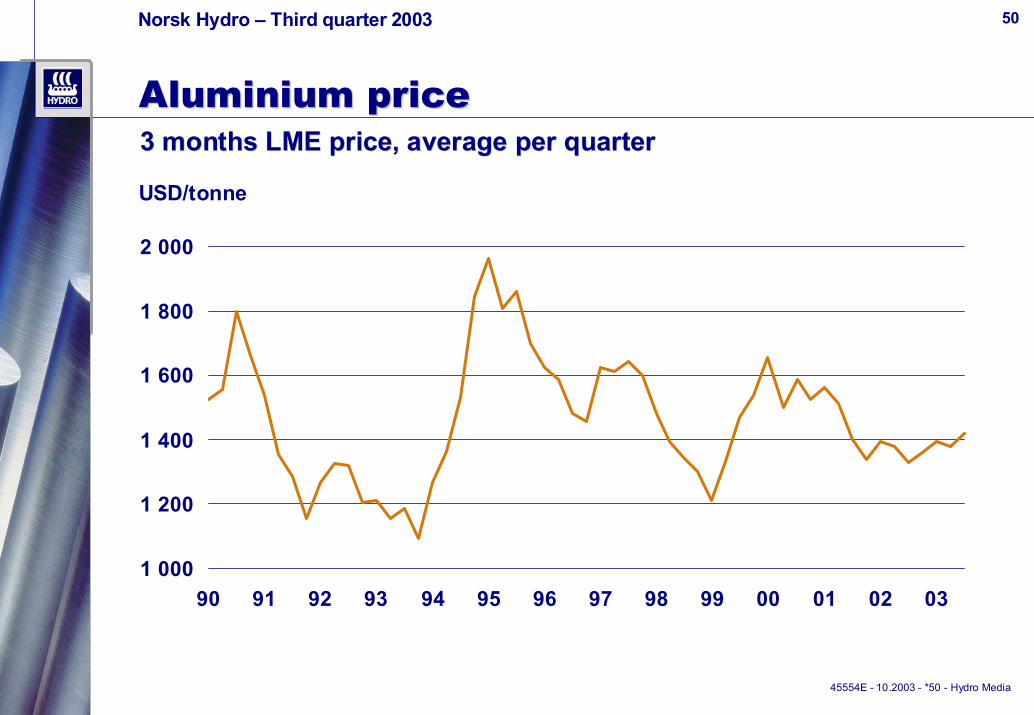
Aluminium priceAluminium price
50
USD/tonne
3 months LME price, average per quarter3 months LME price, average per quarter
45554E - 10.2003 - *50 - Hydro Media
1 000
1 200
1 400
1 600
1 800
2 000
90 91 92 93 94 95 96 97 98 99 00 01 02 03
Norsk Hydro – Third quarter 2003
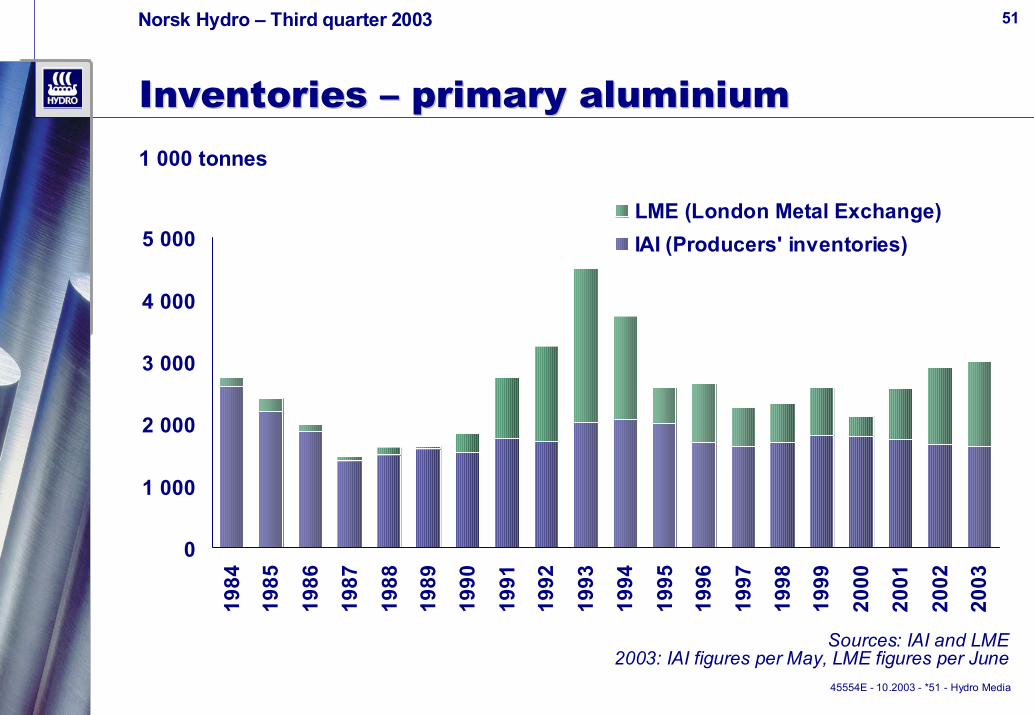
Inventories Inventories –– primary aluminiumprimary aluminium
51
1 000 tonnes
45554E - 10.2003 - *51 - Hydro Media
Sources: IAI and LME2003: IAI figures per May, LME figures per June
0
1 000
2 000
3 000
4 000
5 00019
84
1985
1986
1987
1988
1989
1990
1991
1992
1993
1994
1995
1996
1997
1998
1999
2000
2001
2002
2003
LME (London Metal Exchange)IAI (Producers' inventories)
Norsk Hydro – Third quarter 2003

Variance analysis Variance analysis AgriAgri
52
45554E - 10.2003 - *52 - Hydro Media
(36)
380(43)
(166)(102)
(105)
5015
(195)40
-(15)
(36)
3 2643 300
Year to date
28Variance operating income
270Variance EBITDA
17619
-47
- Non-consolidated investees- Interest income and other- Other income- Depreciation and amortization
455(10)
(375)(35)
-(5)
- Margin- Volume- Fixed costs- Depreciation- Infrequent items - Other
270Variance EBITDA
989719
20032002
3rd quarterNOK million
Norsk Hydro – Third quarter 2003
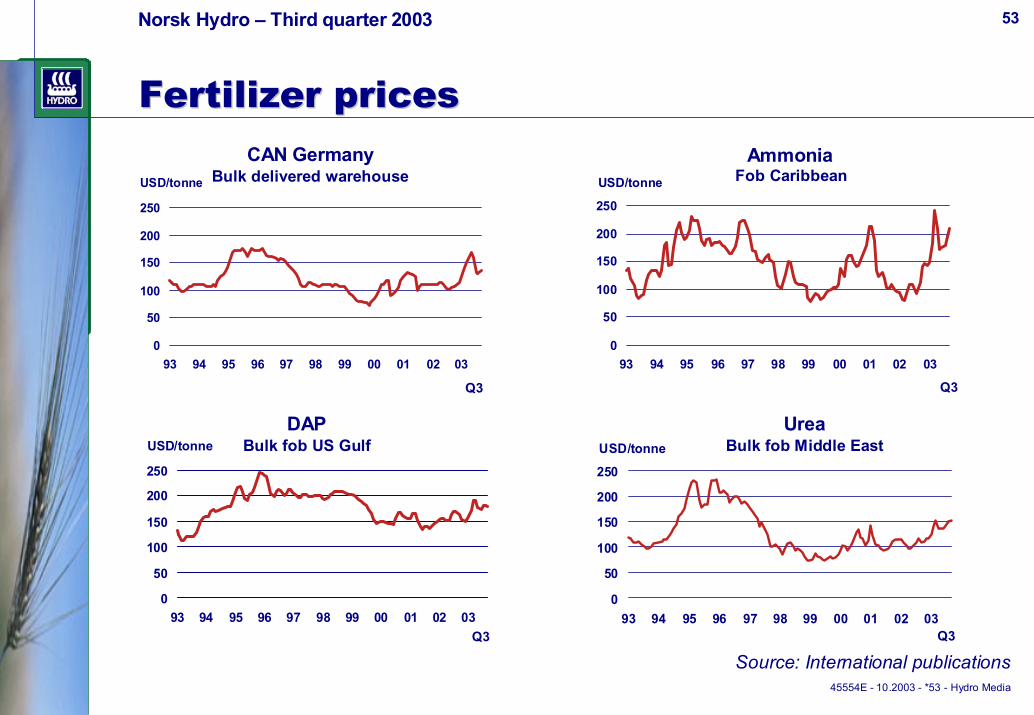
Fertilizer pricesFertilizer prices
53
45554E - 10.2003 - *53 - Hydro Media
0
50
100
150
200
250
93 94 95 96 97 98 99 00 01 02 03
USD/tonne
0
50
100
150
200
250
93 94 95 96 97 98 99 00 01 02 03
USD/tonne
0
50
100
150
200
250
93 94 95 96 97 98 99 00 01 02 03
USD/tonne
0
50
100
150
200
250
93 94 95 96 97 98 99 00 01 02 03
USD/tonne
CAN GermanyBulk delivered warehouse
Ammonia Fob Caribbean
DAPBulk fob US Gulf
UreaBulk fob Middle East
Source: International publications
Q3
Q3
Q3
Q3
Norsk Hydro – Third quarter 2003
100
200
300
400
500
600
Jul-98
Oct-98
Jan-99
Apr-99
Jul-99
Oct-99
Jan-00
Apr-00
Jul-00
Oct-00
Jan-01
Apr-01
Jul-01
Oct-01
Jan-02
Apr-02
Jul-02
Oct-02
Jan-03
Apr-03
Jul-03
Oct-03
CAN Germany
Urea fob Middle East
Nitrate premium above urea priceNitrate premium above urea price
54
USD/mt Nitrogen
45554E - 10.2003 - *54 - Hydro Media
Norsk Hydro – Third quarter 2003

Variance analysis PetrochemicalsVariance analysis Petrochemicals
55
45554E - 10.2003 - *55 - Hydro Media
(32)
42(9)
-
(65)
(90)35
(20)--
10
(32)
253285
Year to date
(135)Variance operating income
(126)Variance EBITDA
15(9)
3
- Non-consolidated investees- Interest income and other- Depreciation and amortization
(135)30
(40)(5)
-15
- Margin- Volume- Fixed costs- Depreciation- Infrequent items- Other
(126)Variance EBITDA
28154
20032002
3rd quarterNOK million
Norsk Hydro – Third quarter 2003

45554E - 10.2003 - *56 - Hydro Media
Norsk Hydro – Third quarter 2003 56
ForwardForward--Looking Statements/Looking Statements/Use of NonUse of Non--GAAP Financial MeasuresGAAP Financial Measures
In order to utilize the “safe harbour" provisions of the United States Private Securities Litigation Reform Act of 1995, Hydro is providing the following cautionary statement: This presentation contains certain forward-looking statements with respect to the financial condition, results of operations and business of the Company and certain of the plans and objectives of the Company with respect to these items. By their nature, forward-looking statements involve risk and uncertainty because they relate to events and depend on circumstances that will occur in the future. The actual results and developments may differ materially from those expressed or implied in the forward-looking statements due to any number of different factors. These factors include, but are not limited to, changes in costs and prices, changes in economic conditions, and changes in demand for the Company's products. Additional information, including information on factors which may affect Hydro'sbusiness, is contained in the Company's 2002 Annual Report on Form 20-F filed with the U.S. Securities and Exchange Commission.
With respect to each non-GAAP financial measure Hydro uses in connection with its financial reporting and other public communications, Hydro provides a presentation of what Hydro believes to be the most directly comparable GAAP financial measure and a reconciliation between the non-GAAP and GAAP measures. This information can be found in Hydro’s earnings press releases, quarterly reports and other written communications, all of which have been posted to Hydro’s website (www.hydro.com).