Embed Size (px)
Citation preview

1
• Click to edit Master text styles‒Second level
Third level
Capital Programs - Short-Term Funding Needs and ConsiderationsBoard of Directors Item 10November 20, 2020
• Click to edit Master text styles‒Second level
Third level
Update
2
• Data collection (taxable retail sales) during COVID-19 showssignificant volatility
• Length and severity of economic disruption is unknown• Federal/State stimulus add uncertainty to forecasts• State of California revenue payments are unpredictable
• Deferred payments• accounting issues
Data only available thru Q1, which only includes 2 weeks of COVID-effectRecommendation: Wait for Q2 data (Nov 12), prepare forecast Q1 2021
1
2
DRAFT

2
• Click to edit Master text styles‒Second level
Third level
Challenges with CDTFA
Q1 2018
Q3 2018
Q1 2019
Q2 2019
Q4 2019
Q1 2020
Software transition effects sales tax dataThe California Department of Taxes and Fees Administration (CDTFA) transitions to new reporting software – Centralized Revenue Opportunity System (CROS) creating many issues with the data and caused reporting shortfalls or anomalies.
Software issuesyet to be resolved
MuniServices adjustments for delayed payments and other reporting deficiencies indicate that
statewide receipts from the local one cent tax rose 5.2% over the first three quarters of 2018 versus the
comparison period.
Slow start to 2019Local sales and use tax receipts from January through March sales were 1.0% higher than the first quarter of 2018 after factoring out accounting anomalies and back payments from previous state reporting shortfalls. This was the lowest percentage increase since first quarter 2010.
Online filing issuesThe local 1% share of California’s sales and use
tax from April through June sales was 20.4% higher than the same quarter of 2018. However, the actual gain came to 2.9% after factoring for online filing issues and accounting anomalies.
Marketplace Facilitator ActEffective October 1, 2019, companies such as Amazon, eBay, and Google who provide sales tax related services to other retailers are required to assume the obligation for collecting and remitting their client’s sales and use tax. This was implementation of the Wayfair v. South Dakota ruling that requires out-of-state retailers to collect and remit sales tax on merchandise sold to California customers.
COVID-19 PandemicTaxpayer relief programs accounted for much of the decline with receipts down roughly 3.1% after factoring for payment deferrals and other
accounting anomalies. Severe drops in auto sales, general consumer goods, service
stations, and restaurants were largely offset by new revenue from implementation of the Wayfair v. South Dakota decision that now requires out-
of-state retailers to collect and remit Californian’s sales and use tax.
3
• Click to edit Master text styles‒Second level
Third level
CDTFA Actual Sales Tax Revenues vs. Adjustments
3
4
DRAFT

3
• Click to edit Master text styles‒Second level
Third level
CDTFA Actual Sales Tax Revenues vs. Adjustments
• Click to edit Master text styles‒Second level
Third level
$
$5
$10
$15
$20
$25
$30
$35
$40
Jul-8
8
Ma
r-89
No
v-8
9
Jul-9
0
Ma
r-91
No
v-9
1
Jul-9
2
Ma
r-93
No
v-9
3
Jul-9
4
Ma
r-95
No
v-9
5
Jul-9
6
Ma
r-97
No
v-9
7
Jul-9
8
Ma
r-99
No
v-9
9
Jul-0
0
Ma
r-01
No
v-0
1
Jul-0
2
Ma
r-03
No
v-0
3
Jul-0
4
Ma
r-05
No
v-0
5
Jul-0
6
Ma
r-07
No
v-0
7
Jul-0
8
Ma
r-09
No
v-0
9
Jul-1
0
Ma
r-11
No
v-1
1
Jul-1
2
Ma
r-13
No
v-1
3
Jul-1
4
Ma
r-15
No
v-1
5
Jul-1
6
Ma
r-17
No
v-1
7
Jul-1
8
Ma
r-19
No
v-1
9
Jul-2
0
In M
illio
ns (
seas
onal
ly a
djus
ted)
Monthly TransNet Receipts
Gre
at R
eces
sion
6
5
6
DRAFT

4
• Click to edit Master text styles‒Second level
Third level
Gre
at R
eces
sion
Monthly TransNet Receipts
$
$5
$10
$15
$20
$25
$30
$35
$40
Jul-8
8
Ma
r-89
No
v-8
9
Jul-9
0
Ma
r-91
No
v-9
1
Jul-9
2
Ma
r-93
No
v-9
3
Jul-9
4
Ma
r-95
No
v-9
5
Jul-9
6
Ma
r-97
No
v-9
7
Jul-9
8
Ma
r-99
No
v-9
9
Jul-0
0
Ma
r-01
No
v-0
1
Jul-0
2
Ma
r-03
No
v-0
3
Jul-0
4
Ma
r-05
No
v-0
5
Jul-0
6
Ma
r-07
No
v-0
7
Jul-0
8
Ma
r-09
No
v-0
9
Jul-1
0
Ma
r-11
No
v-1
1
Jul-1
2
Ma
r-13
No
v-1
3
Jul-1
4
Ma
r-15
No
v-1
5
Jul-1
6
Ma
r-17
No
v-1
7
Jul-1
8
Ma
r-19
No
v-1
9
Jul-2
0
In M
illio
ns
(se
aso
na
lly a
dju
ste
d)
7
• Click to edit Master text styles‒Second level
Third level
Estimated COVID-19 Impact on the San Diego Regional Economy
8
• Jobs Lost• 450,000 (May 2020)• 176,000 (Sept. 2020)
• Lost Wages• $4.5-5.5 billion (March to Sept. 2020)
• San Diego GRP• $10-15 billion, -3.8% to -5.7% (calendar year 2020)
• Taxable Sales• $5-7 billion, - 8% to -11% (calendar year 2020)
7
8
DRAFT

5
• Click to edit Master text styles‒Second level
Third level
9
Estimated Job Loss in the San Diego Region by Employment Sector August 2019 to August 2020
-77,700
-36,100
-27,500
-11,500-9,300 -8,800
-4,700 -1,600 -800
1,800
-90,000
-80,000
-70,000
-60,000
-50,000
-40,000
-30,000
-20,000
-10,000
0
10,000
20% of newunemployed workers35,000 unemployed
-37%
-15%
-21%
-6% -14% -3%-5% -4% -1%
+1%
80% of new unemployed workers141,000 unemployed
Source: SANDAG estimates using August 2020 Employment Development Department Industry employment Release date September 18, 2020; and Applied Geographic Solutions, Inc., Thousand Oaks, California, Weekly Release September 14, 2020. Note: does not include uniformed service military employment.
• Click to edit Master text styles‒Second level
Third level
5%
-32%
-7%
-33%
-100%
-80%
-60%
-40%
-20%
0%
20%
40%
Auto Dealers Auto Repair/Maintenance Gas StationsCoffee and Snack Bars Fast Food Restaurants Grocery StoresSit Down Restaurants Home Centers/Hardware Stores Apparel StoresDepartment Stores Florists Furniture and Appliance StoresPharmacies Recreation Products
Activity Levels at Businesses in the San Diego Region
Sources: SafeGraph COVID-19 Response Dataset - Weekly Patterns
stay home order reopening begins reopening rolled back
30 to 80%
25 to 45%
30 to 50%
10
9
10
DRAFT

6
• Click to edit Master text styles‒Second level
Third level
TransNet Collection compared to Economic Activity data(year over year change)
-60%
-40%
-20%
0%
20%
40%
60%
Jan-20 Feb-20 Mar-20 Apr-20 May-20 Jun-20 Jul-20 Aug-20 Sep-20
Nov-19 Dec-19 Jan-20 Feb-20 Mar-20 Apr-20 May-20 Jun-20 Jul-20
Estimate Based on Economic Activity
CDTFA Sales Tax Payments
Reopening
month of collection
month of sale
Deferred Payments?
Peak Closures
Reclosures
Source: https://cdtfa.ca.gov/DataPortal/charts.htm?url=TaxSalesByCounty11
• Click to edit Master text styles‒Second level
Third level
Economic Outlook
‐7.8%+4.1%
‐4.7%
+4.2%
+2% +2%
200
220
240
260
280
300
320
2016 2017 2018 2019 2020 2021 2022 2023 2024 2025
GR
P in
Bill
ions
of 2
020
dolla
rs
June 2020 September 2020 Pre-COVID12
11
12
DRAFT

7
• Click to edit Master text styles‒Second level
Third level
13
Transnet Sales Tax Forecast Scenarios
$150
$200
$250
$300
$350
$400
200
2
200
3
200
4
200
5
200
6
200
7
200
8
200
9
201
0
201
1
201
2
201
3
201
4
201
5
201
6
201
7
201
8
201
9
202
0
202
1
202
2
202
3
202
4
202
5
Collection
PRECOVID
June 2020 Budget update
Based on actual collection
Consensus U-shape
• Click to edit Master text styles‒Second level
Third level
Short-Term Funding Picture
• Updated Costs and Revenues
• Identified Cashflow Needs FY 2021 – FY 2025
‒ $170 million to $220 million
14
13
14
DRAFT

8
• Click to edit Master text styles‒Second level
Third level
Major Corridor Debt Portfolio –$2.3 Billion
2008 2010 2012 2014 20162019
Refunding Only
2018 Short-TermNotes (TIFIA)
2019 Grant Anticipation Notes
(FFGA)
15
• Click to edit Master text styles‒Second level
Third level
Short-Term Funding Picture
• Revenue uncertainty
• Favorable economic conditions
16
15
16
DRAFT

9
• Click to edit Master text styles‒Second level
Third level
Options
• Refinance existing bonds to lower borrowing costs and create capacity to issue additional bonds
• Release Series 2008 debt service reserve funds
• Execute interfund loans
• Increase commercial paper program
17
• Click to edit Master text styles‒Second level
Third level
Refinancing and New Issuance• Lower borrowing costs
• New bond issuance
Opportunities Estimated Savings*
2017 federal TIFIA loan – Mid-Coast $156.2 million (2026-2046)
Series 2014A bonds $24.7 million ($14 million 2021 to 2025)
Series 2018A short-term notes $10.5 million (2026-2046)
*will vary based on rates at time of transactions
Opportunities Estimated Proceeds
Series 2021A bonds $113 million
18
17
18
DRAFT

10
• Click to edit Master text styles‒Second level
Third level
Release Debt Service Reserve Funds
• Series 2008 bonds issued with $17 million debt service reserve fund to support high credit rating
• Evolution of rating agency criteria – no debt service reserve on sales-tax revenue bonds in the portfolio since 2008
• No added benefit to maintaining
‒SANDAG funds debt service payments monthly in advance
19
• Click to edit Master text styles‒Second level
Third level
Interfund Loans
• Ordinance provision
• Internalizes risks
• Minimizes borrowing costs
• Generally requires interest payments
• Example – Major Corridors Program to Environmental Mitigation Program (EMP)
20
19
20
DRAFT

11
• Click to edit Master text styles‒Second level
Third level
Increase Commercial Paper Program
• Currently $100 million
• Could increase to $200 million
• Used by local agencies and SANDAG
• Short-term borrowing instrument (on second lien)
• Manage uncertainty
21
• Click to edit Master text styles‒Second level
Third level
Remaining Needs
• New issuance plus release of debt service reserve fund = approximately $130 million
• $40 million to $90 million gap
• Revised sales tax forecast in early 2021
• Any actions approved by the Board would be included in the FY 2022 budget
22
21
22
DRAFT

12
• Click to edit Master text styles‒Second level
Third level
Considerations
• Debt capacity
• Credit rating
23
• Click to edit Master text styles‒Second level
Third level
ScheduleNovember 2020
Committee and Board
Presentations*
December 2020
Financing Documents
January 2021
Request for Board Approval
March 2021
FY 2022Draft Budget
Early 2021
2018 Short-Term Notes Refinance and Release of
Debt Service Reserve Fund
May 2021
FY 2022 Budget Adoption
24
May 2021Apr 2021Mar 2021Feb 2021Jan 2021Dec 2020Nov 2020
November 2020
Underwriter SelectionBond and Disclosure
Counsel
* Including TIFIA refinancing documents
23
24
DRAFT
1
Proposed TIFIA 2020 Replacement Loan
San Diego County RegionalTransportation Commission
Board of Directors| Item 11 | November 20, 2020
2
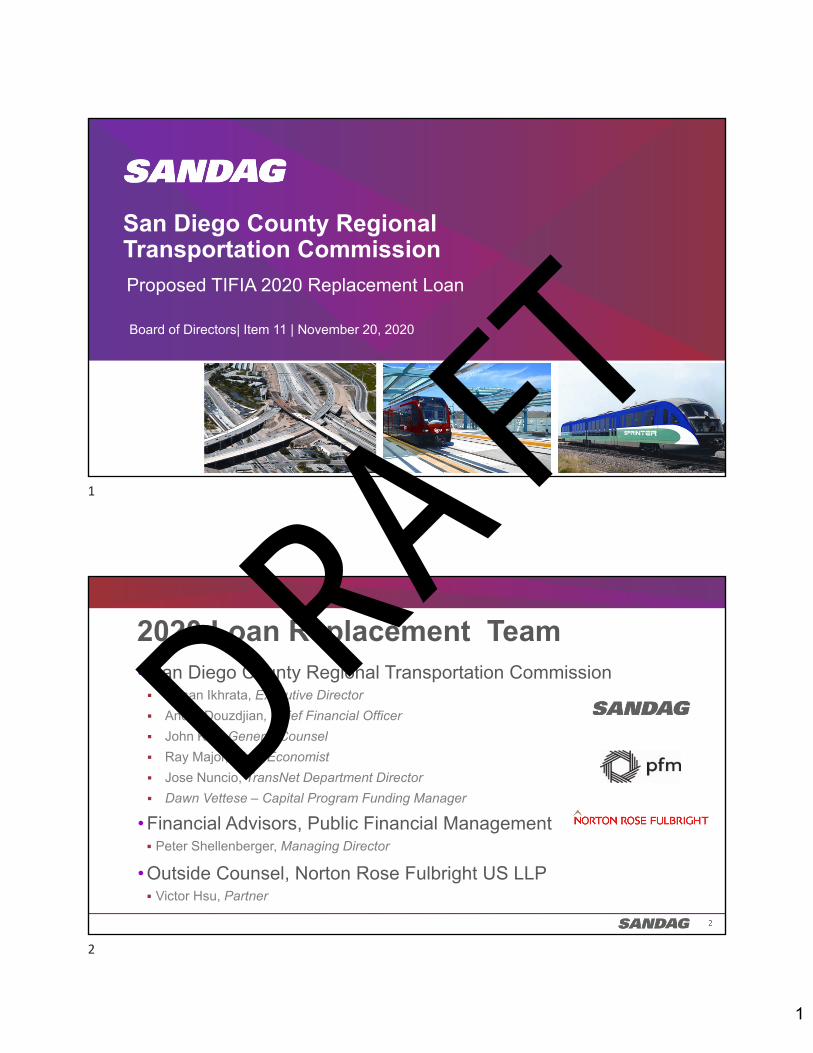
2020 Loan Replacement Team• San Diego County Regional Transportation Commission Hasan Ikhrata, Executive Director
Andre Douzdjian, Chief Financial Officer
John Kirk, General Counsel
Ray Major, Chief Economist
Jose Nuncio, TransNet Department Director
Dawn Vettese – Capital Program Funding Manager
• Financial Advisors, Public Financial Management Peter Shellenberger, Managing Director
•Outside Counsel, Norton Rose Fulbright US LLP Victor Hsu, Partner
1
2
DRAFT

2
3
2020 TIFIA Replacement Presentation
1. Why are we replacing the loan
2. Description of the main components of the loan
3. Review of various loan documents
4
Market Update
3
4
DRAFT

3
5
Loan Terms
• Single draw of funds
• 5-year deferred repayment
• Increasing debt service
• Issuance of short-term notes
• Debt service coverage
• Credit ratings
• Additional bonds test
6
Costs
• Cost of refinancing are estimated at $400,000 and include Bond Counsel Advisory Services Build America Bureau Legal Advisors
5
6
DRAFT

4
7
Debt Portfolio
Debt service calculated based on fixed-payer swap rate and excludes remarketing and liquidity fees.; Net of federal subsidy
Commission’s debt portfolio contains a prudent mix of fixed‐rate and synthetic fixed‐rate debt and a level debt service structure for our senior lien bonds
Summary of Outstanding Debt
Series Tax Status Coupon Type Original Issue Size Outstanding Par Call Option Final Maturity
2008A Tax‐Exempt Variable Rate $150,000,000 $100,575,000 Current 4/1/2038
2008B Tax‐Exempt Variable Rate $150,000,000 $100,575,000 Current 4/1/2038
2008C Tax‐Exempt Variable Rate $150,000,000 $100,575,000 Current 4/1/2038
2008D Tax‐Exempt Variable Rate $150,000,000 $100,575,000 Current 4/1/2038
2010A Taxable Fixed Rate $338,960,000 $338,960,000 Make‐Whole 4/1/2048
2012A Tax‐Exempt Fixed Rate $420,585,000 $40,935,000 4/1/2022 4/1/2048
2014A Tax‐Exempt Fixed Rate $350,000,000 $170,420,000 4/1/2024 4/1/2048
2016A Tax‐Exempt Fixed Rate $325,000,000 $307,880,000 4/1/2026 4/1/2048
2019A Taxable Fixed Rate $442,620,000 $442,620,000 4/1/2030 4/1/2048
2020A Taxable Fixed Rate $74,820,000 $74,820,000 4/1/2030 4/1/2048
2018A Notes Tax‐Exempt Fixed‐Rate $537,480,000 $537,480,000 Non‐Callable 4/1/2021
Total $2,315,415,000
Summary of TIFIA Loan Commitment
Series Tax Status Coupon Type Original Issue Size Outstanding Par Call Option Final Maturity
TIFIA* Taxable Fixed‐Rate $537,484,439 $0 Anytime 10/1/2045
Total with Loan Commitment
$2,315,419,439
8
Credit Rating Agency Reviews
• Current high credit ratings on SANDAG debt program
• Current ratings – senior lien: Standard & Poor’s: AAA
Fitch: AAA
• Current ratings – junior subordinate lien (TIFIA): Standard & Poor’s: A+
Fitch: A
7
8
DRAFT

5
9
Financial Advisor Memo (Attachment 1)
• Market update
• TIFIA loan structure
• Financial considerations
10
SANDAG Direct Agreement(Attachment 2)
Required since SANDAG is the administering agency to construct the project and is the grant recipient for the Mid-Coast New Starts grant from the Federal Transit Administration
Updates reference to the TIFIA Loan Agreement and signatories
9
10
DRAFT

6
11
MTS Direct Agreement(Attachment 3)
Required since MTS is the administering agency to procure the vehicles, traction power substations, and new fare collection system
Also required since MTS is the operator
Updates reference to the TIFIA Loan Agreement and signatories
12
TIFIA Loan Agreement(Attachment 4)
The replacement TIFIA Loan Agreement is an update of the original agreement
Updates interest rate
No other significant changes to terms
Updates old information
11
12
DRAFT

7
13
Tenth Supplemental Indenture(Attachment 5)
• Needed to reference new TIFIA loan and bond
• Seventh Supplemental Indenture remains in effect for all other provisions
14
Resolution RTC-2021-02(Attachment 6)
The Resolution approves the replacement TIFIA financing method and authorizes the Executive Director to execute the following documents on behalf of SANDAG acting as the RTC: TIFIA Loan Agreement and TIFIA Bond
Direct Agreements
Tenth Supplemental Indenture
13
14
DRAFT

8
15
Resolution 2021-07(Attachment 7)
The Resolution authorizes the Executive Director to execute the SANDAG direct agreement on behalf of SANDAG
16
Next Steps
• Early December – loan approval
• Late December/Early January– loan execution
15
16
DRAFT

9
17
RecommendationThe Transportation Committee recommends that the Board of Directors, also acting as the Regional Transportation Commission (RTC), approve a Transportation Infrastructure Finance and Innovation Act (TIFIA) Loan Agreement and associated Direct Agreements to secure a replacement loan for the Mid-Coast Corridor Transit Project and the Tenth Supplemental Indenture, providing for the issuance of a Junior Subordinate Sales Tax Revenue Bond evidencing the RTC obligations under the TIFIA Loan Agreement. Additionally, the Transportation Committee recommends that the Board:
18
Recommendation (continued)
1. Acting as the RTC, approve the replacement TIFIA financing method for the Mid-Coast Corridor Transit Project;
2. Acting as the RTC, adopt RTC Resolution No. RTC-2021-02, authorizing the Executive Director to execute the TIFIA Loan Agreement and Direct Agreements, the TIFIA Bond and the Tenth Supplemental Indenture; and
3. adopt SANDAG Resolution No. 2021-07, authorizing the Executive Director to execute the SANDAG Direct Agreement.
17
18
DRAFT

1
APPROVAL OF PROPOSED CONTRACT AWARD Rancho Lilac
SANDAG Board of Directors| November 20, 2020
State Route 76 Project
22
1
2
DRAFT

2
RFP TIMELINE and STATUS
2011
Caltrans Acquires Rancho Lilac
2014
SANDAG Board authorizes release of RFP
2016
Release of RFP to the public. Three proposals received
2017
SDHC selected for negotiations
2017–2020
Negotiation with SDHC on endowment
Caltrans Management of Property
May 22, 2020
SANDAG BOD meeting
3
4
3
4
DRAFT
3
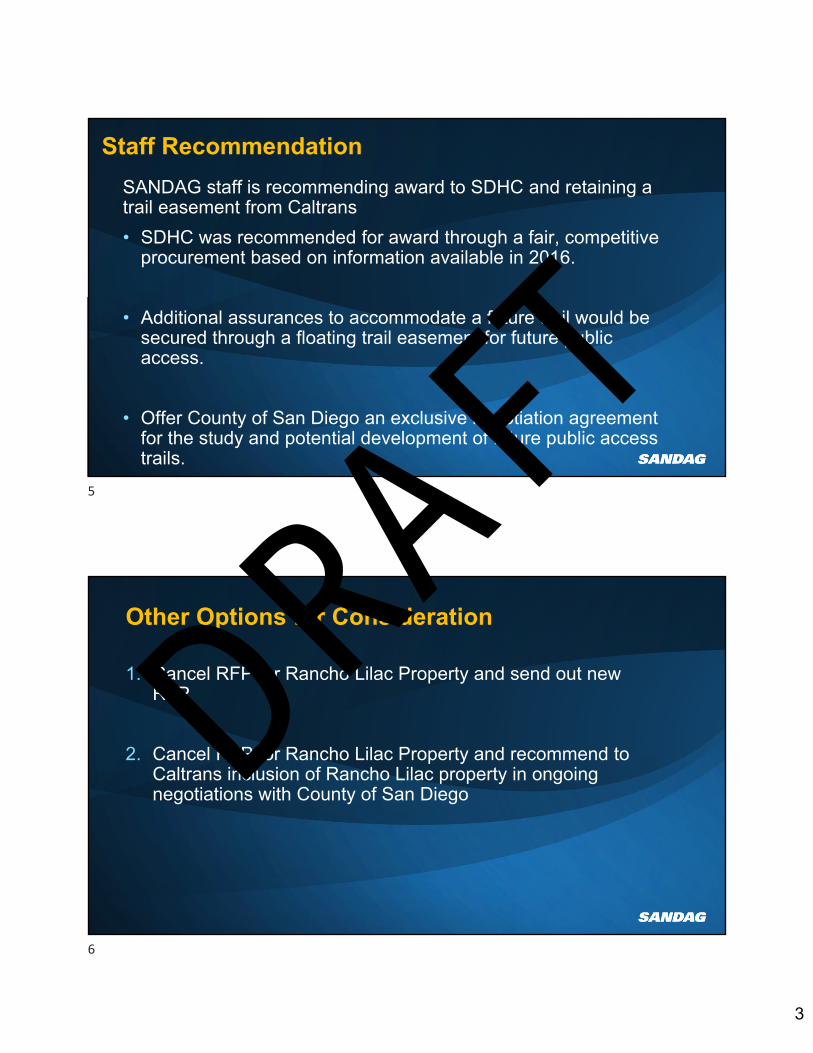
Staff Recommendation
SANDAG staff is recommending award to SDHC and retaining a trail easement from Caltrans
• SDHC was recommended for award through a fair, competitive procurement based on information available in 2016.
• Additional assurances to accommodate a future trail would be secured through a floating trail easement for future public access.
• Offer County of San Diego an exclusive negotiation agreement for the study and potential development of future public access trails. 5
Other Options for Consideration
1. Cancel RFP for Rancho Lilac Property and send out new RFP
2. Cancel RFP for Rancho Lilac Property and recommend to Caltrans inclusion of Rancho Lilac property in ongoing negotiations with County of San Diego
6
5
6
DRAFT

4
Next Steps
• Pending approval by the Board, SANDAG will execute an agreement with SDHC or take other action as directed by the Board.
• Caltrans would then bring this property to CTC for property transfer.
• Caltrans would grant a trail easement to SANDAG
• SANDAG and SDHC would enter into an agreement, and a conservation easement would be granted to SANDAG in exchange for the establishment of an endowment account.
• SANDAG would offer an exclusive negotiation agreement for the study and potential development of future public access trails to the County of San Diego.
• SDHC would then have 18 months to submit the HMP, to be reviewed and approved by SANDAG and Caltrans
7
Recommendation
8
Action: Approve
The Board of Directors is asked to: (1) authorize the Executive Director to execute an agreement for the transfer and long-term management of mitigation land with the San Diego Habitat Conservancy (SDHC) and accept a conservation easement as a condition of release of endowment funds, (2) accept a trail easement from Caltrans, and (3) offer to the County of San Diego an exclusive negotiation agreement for the study and potential development of a future trail system
7
8
DRAFT