Embed Size (px)
Citation preview

UNDERSTANDING NONPROFIT
FINANCIALSTATEMENTS
PAUL M. CONNOLLY
STEVEN BERGER, CPA
THIRD EDITION

UNDERSTANDING NONPROFIT
FINANCIALSTATEMENTS
PAUL M. CONNOLLY
STEVEN BERGER, CPA
THIRD EDITION

Library of Congress Cataloging-in-Publication Data
Berger, Steven H.
Understanding nonprofit financial statements / by Steven Berger. —3rd ed.
p. cm.
Includes bibliographical references.
ISBN 1-58686-104-2 (pbk.)
1. Nonprofit organizations–Finance. 2. Nonprofit organizations–Accounting. 3. Financial statements. I. Title.
HG4027.65.B47 2008
658.15'12--dc21
2008001683
© 2008 BoardSource.First printing, February 2008ISBN 1-58686-104-2
Published by BoardSource1828 L Street, NW, Suite 900Washington, DC 20036
This publication may not be reproduced without permission. Permission can beobtained by completing a request for permission form located atwww.boardsource.org. Revenue from publications sales ensures the capacity ofBoardSource to produce resources and provide services to strengthen the governingboards of nonprofit organizations. Copies of this book and all other BoardSourcepublications can be ordered by calling 800-883-6262. Discounts are available for bulkpurchases.
The views in each BoardSource publication are those of its author, and do notrepresent official positions of BoardSource or its sponsoring organizations.Information and guidance in this book is provided with the understanding thatBoardSource is not engaged in rendering professional opinions. If such opinions arerequired, the services of an attorney should be sought.

BoardSource envisions a world where every social sector organization has the leadership it needs to fulfill its mission and advance the public good. Our mission is to inspire and support excellence in nonprofit governance and board and staff leadership. Established in 1988, BoardSource’s work is grounded in the fundamental belief that boards are critical to organizational success. With decades of hands-on experience working with and supporting nonprofit boards, BoardSource is the recognized leader in nonprofit governance and leadership, and a go-to resource for nonprofit board and executive leaders. BoardSource supports a broad and diverse cross-section of social sector organizations with • leadership initiatives addressing key opportunities and issues within the
nonprofit sector• research and benchmarking of board composition, practices, and performance• membership and board support programs• customized diagnostics and performance assessment tools• a comprehensive library of topic papers, publications, and downloadable
infographics, tools, templates and more• live and virtual education and training• governance consultants who work directly with nonprofit leaders to design
specialized solutions to meet an organization’s needs• a biennial conference that brings together approximately 800 board leaders for
two days of learning and sharing A note to our global readers:The need for effective board leadership and governance knows no geographic boundaries, and BoardSource is committed to strong social sector board leadership and governance around the globe. While BoardSource uses United States laws and policies as the legal framework for our resources and recommendations, most of our resources do not focus on legal matters but rather on good governance practices, making them relevant to organizations working outside of the United States. We do suggest, however, that you refer to applicable laws in your country regarding financial reporting and other legal and transparency issues. BoardSource is a 501(c)(3) organization. For more information, please visit our website at boardsource.org, e-mail us at [email protected], or call us at 800-883-6262.

© 2008 BoardSource / UNDERSTANDING NONPROFIT FINANCIAL STATEMENTS / v
Contents
Preface..................................................................................................viii
Introduction ......................................................................................ix
Chapter 1: The Distinct Roles of the Board and the Chief Executive ................................................................................1
Chapter 2: Types of Nonprofit Organizations................................3
Chapter 3: Differentiating between Accounting and Finance Functions......................................................................7
Accounting Functions..............................................................7
Finance Functions..................................................................8
Chapter 4: Basic Elements of Audited Financial Statements......11
Opinion Letter......................................................................11
Statement of Financial Position (Balance Sheet) ..................13
Cash................................................................................16
Accounts Receivable............................................................17
Promises To Give (Pledges Receivable) ............................18
Property and Equipment (Fixed Assets)............................18
Accounts Payable and Accrued Liabilities ..........................19
Current Portion of Long-Term Liabilities ..........................20
Long-Term Liabilities ............................................................20
Unrestricted Net Asset Balances..........................................21
Restricted Net Asset Balances..............................................21
Statement of Activities (Income Statement)............................22
Support and Revenue ..........................................................24
Statement of Cash Flows ......................................................27
Net Investments ....................................................................27
Capital Expenditures — Net ............................................27
Proceeds from the Issuance of Long-Term Debt ..................27
Payments on Long-Term Debt ..............................................29
Statement of Functional Expenses ..........................................29
Footnotes ............................................................................32
vi / UNDERSTANDING NONPROFIT FINANCIAL STATEMENTS / © 2008 BoardSource
The Sarbanes-Oxley Act (SOX) and Its Relevance to Nonprofit Organizations....................................................32
Chapter 5: Comparing Interim to Audited Financial Statements........................................................................................37
Financial Information..............................................................37
Statistical Information ..........................................................39
Chapter 6: Using Financial Information To Meet Other Reporting Requirements..................................................................41
IRS Form 990......................................................................41
State Charitable Reports ..........................................................42
Charitable Organization Rating Groups..................................43
Chapter 7: Using Financial Information To Evaluate Organizational Performance ..................................................45
Ratio Analysis ..........................................................................45
Current Ratio ..................................................................46
Quick Ratio..........................................................................46
Days Cash on Hand ........................................................46
Days in Accounts Receivable............................................47
Average Payment Period......................................................47
Average Age of Plant............................................................48
Debt Service Coverage......................................................48
Return on Net Assets........................................................48
Operating Margin Percentage ..............................................49
Net Margin Percentage ........................................................49
Interest Expense Percentage................................................49
Interest Income Percentage................................................50
Efficiency Ratio....................................................................50
Fundraising Ratio ................................................................51
Chapter 8: Advanced Methods of Measuring OrganizationalPerformance ......................................................................53
Trending ..................................................................................53
Benchmarks ..........................................................................53
Balanced Scorecard ..................................................................56
How to Develop a Scorecard ..............................................57
Balanced Scorecard in Nonprofit Organizations ................59
Balancing the Scorecard ......................................................59
Conclusion ..........................................................................63
© 2008 BoardSource / UNDERSTANDING NONPROFIT FINANCIAL STATEMENTS / vii
Appendix 1: Supplemental Auditor Reports..................................64
SAS 114 Letter......................................................................64
Reports Required in Accordance with Office of Management and Budget Circular A-133............................66
Other Supplemental Information ............................................66
Appendix 2: Contents of the CD-ROM......................................68
Glossary..............................................................................70
About the Author..................................................................76
List of Boxes
Box 1: Major Categories of 501(c)(3) Nonprofit Organizations..............................................................4
Box 2: Accounting Functions..................................................7
Box 3: Finance Functions........................................................9
Box 4: Sample Statistical Information ......................................39
Box 5: Ratios Potentially Useful to Board Members..............45
Box 6: Balanced Scorecard Quadrants ....................................57
List of Exhibits
Exhibit 1: Auditor’s Opinion Letter ......................................12
Exhibit 2: Statement of Financial Position (Balance Sheet) ..................................................14
Exhibit 3: Statement of Activities ........................................22
Exhibit 4: Statement of Cash Flows......................................28
Exhibit 5: Statement of Functional Expenses......................30
Exhibit 6: Notes to Financial Statements ............................34
Exhibit 7: Comparison of Statements of Activities ..............38
Exhibit 8: Days Cash on Hand, All Sources —Five-Year Trend ....................................................54
Exhibit 9: Debt Service Coverage — Five-Year Trend ..........55
Exhibit 10: Balanced Scorecard ..............................................58
Exhibit 11: Balanced Scorecard Drill Down ..........................60

viii / UNDERSTANDING NONPROFIT FINANCIAL STATEMENTS / © 2008 BoardSource
PrefaceEvery board member of a nonprofit organization — whether or not a member of theboard’s finance committee — is charged by law with minimum responsibilities offinancial oversight for that organization. This book is designed to provide boardmembers with the ability to understand the basic financial documents that theywill encounter as board members — and to know what types of documents andinformation to request from the nonprofit’s managers. Without these documents andwithout a full understanding of them, no board member will be able to meet his orher fiduciary responsibilities.
© 2008 BoardSource / UNDERSTANDING NONPROFIT FINANCIAL STATEMENTS / ix
Introduction Every nonprofit organization exists to provide value and benefits. If it did not, theorganization would not attract a clientele, customers, or donors to sustain it. Thebenefits, which are rendered to the organization’s clientele, are called the valueproposition. Some of the more common ways to measure value are through customersatisfaction, employee satisfaction, operational excellence, community benefits, orfinancial results.
In each case, the value must be defined and measured. But raw performance data arenot enough to provide meaning. There must be some relative comparison so thatnumbers can be understood in a context that renders them meaningful. Thesecomparisons generally take the form of ratios that are derived from raw data. Forexample, some of the more important financial ratios that help define value includeoperating margin percentage, number of days cash on hand, or debt service quotient.
This book concentrates on one major and widely recognized method of measuringvalue: financial statements and their implications for outcomes. It is organized tomaximize a nonprofit board member’s understanding of the most important financialelements within his or her organization. At the outset, the book reviews the functionof the board in its goal-setting role, which includes financial outcomes. This sets thestage for examining the differences between simple accounting and the board’sfunction in analyzing accounting numbers to portray financial outcomes.Understanding the major elements of the financial statements is the heart of the book,and attention is given to the key ways in which those elements represent the realfinancial outcomes of the operations performed by the organization’s seniormanagement and staff over the relevant time period.
The remainder of the book highlights similarities and differences of interim versusaudited financial statements, some very specific ways to use available financialinformation to fulfill the board’s fiduciary responsibilities, and, finally, how to utilizefinancial information to measure organizational performance.
What should become evident is the relationship between long-term (five- to 10-year)financial plans and short-term (one year) budgets established by the board, and howthese are translated into actual operating results portrayed in the interim (monthly orquarterly) financial statements. It should also become clear how interim results relateto the final results reported in the audited financial statements and why any majordifferences must be taken seriously.
By the conclusion of the book, board members should have a greater ability toappraise and evaluate such things as statements of financial position and statementsof cash flow and activities, and to better understand and communicate with theorganization’s chief executive about the financial outcomes of the organization. Thisbook will also assist the board in working with chief executives to set organizationalgoals, which the executives are responsible for meeting, and for evaluating thefinancial aspects of the chief executive’s performance.

x / UNDERSTANDING NONPROFIT FINANCIAL STATEMENTS / © 2008 BoardSource
Included with this book is a CD-ROM that contains sample financial documents anda Microsoft® PowerPoint® presentation on financial practices that can be used atboard meetings to improve financial skills. A description of the contents of the CD-ROM is found in Appendix 2.
© 2008 BoardSource / UNDERSTANDING NONPROFIT FINANCIAL STATEMENTS / 1
1.
The Distinct Roles of the Board and the Chief ExecutiveAt the outset, it is important to understand the different roles played by the boardand the executive in sound financial management. The board is ultimately responsibleby law for the financial performance of the nonprofit it governs. To fulfill thisresponsibility, board members must have access to the information they need toperform their critical fiduciary responsibilities. It is the chief executive’sresponsibility — with the help of senior management — to provide that financialinformation in clear and understandable form.
In both theory and practice, there are a number of distinctions between the roles ofboard members and senior executives:
KEY BOARD ROLES
• Legal responsibility as the organization’s overseers.
• Governance, which includes
- Establishing, with the chief executive, the mission and vision for theorganization.
- Setting direction and establishing specific goals — including financialcomponents.
• Monitoring progress toward achieving the mission (actual outcomes comparedto the established goals).
• Hiring and evaluating the chief executive (based on achievement or lack thereof).
KEY CHIEF EXECUTIVE ROLES
• Collaborating with the board to set the long-term mission.
• Managing the daily operations to help achieve the organizational mission.
• Providing information to the board that allows for a comprehensiveunderstanding of whether goals are being met, including both financial andnonfinancial goals.
In concrete terms, the board is responsible for approving a long-term (five- to 10-year) financial plan and a short-term (one-year) capital and operating budgetprepared by staff. Both of these major financial documents should ideally be thebyproduct of the organization’s strategic plan. In the interim, the board’s oversight ofmanagement includes foremost the appropriate and timely review of the financial
2 / UNDERSTANDING NONPROFIT FINANCIAL STATEMENTS / © 2008 BoardSource
condition of the organization as presented in its financial statements. This requiresthat board members be knowledgeable and informed about the organization’sfinancial status and underlying trends. The result of these efforts will be to help thechief executive and the senior staff decide how best to manage and optimizeresources, especially in fiscally trying times.
TIPS FOR BOARD MEMBERS
1. Ensure the organization has a solid strategic plan. This will provide theexecutive staff with a road map for achieving agreed-upon goals.
2. Approve a financial plan that reflects the strategic plan. This allows the boardto determine whether funding exists for its plans.
3. Ensure that the one-year operating and capital budgets constitute the keyelements of the long-term strategic plan.
4. Help define specific metric indicators that relate to the organization’s financialoutcomes. This will be further discussed in Chapter 7.

© 2008 BoardSource / UNDERSTANDING NONPROFIT FINANCIAL STATEMENTS / 3
2.
Types of Nonprofit OrganizationsAmerican companies can be organized as for-profit (investor-owned) or nonprofit.Both types of corporations may accrue a surplus of revenues in excess of expenses(which is called “profit” by a for-profit organization, and “net assets” by a nonprofit).However, in nonprofit organizations, expenditures, operating surpluses, and assetsmay not be used for the private benefit of any board members, officers, or employees.
Section 501(c) of the Internal Revenue Code (IRC) creates the federal definition oforganizations that are generally exempt from income and most other federal taxes(state and local laws may further define and restrict which nonprofits are exemptfrom state and local taxes). The federal definition includes, among others, charities,social welfare organizations, and associations. If the proper filing requirements aremet, the benefits of 501(c) status include
• Exemption from federal and state income taxes on any surplus of revenues overexpenses.
• Exemption from federal and state taxes on capital gains from investments.
• Exemption from property taxes (in most states and localities).
• Exemption from state and local sales taxes (although they may have to becollected).
• The ability to obtain bond debt (to raise capital) where the interest income to thebond purchaser is generally tax exempt (thus allowing the debt to be issued atlower than commercial interest rates).
Section 501(c)(3) is the subsection under which most charities qualify for federalexemption. Those organizations must be operated exclusively for charitable, religious,educational, scientific, or other social welfare purposes. Additionally, charities must
• Be free of private inurement and private benefit.
• Have no substantial involvement in legislative activity.
• Have no participation in political or electioneering campaigns — except foreducation and get-out-the-vote purposes.
Designation as a 501(c)(3) nonprofit organization confers substantial financialbenefits not available to for-profit organizations or other tax-exempt organizations.The most significant additional benefit is the ability to offer donors (individuals orfor-profit corporations) a tax deduction for donations of cash or noncash assets.1
1. Even more important to some donors, there are cases where the tax deduction to a 501(c)(3)organization is valued at the stepped-up fair market (current) value of a donation. For example, stockthat was purchased by a donor for $10,000 and that has increased in value to $100,000 by the time hedonates it to a charity entitles the donor to a tax deduction for the current value of $100,000, not theoriginal cost of only $10,000.
4 / UNDERSTANDING NONPROFIT FINANCIAL STATEMENTS / © 2008 BoardSource
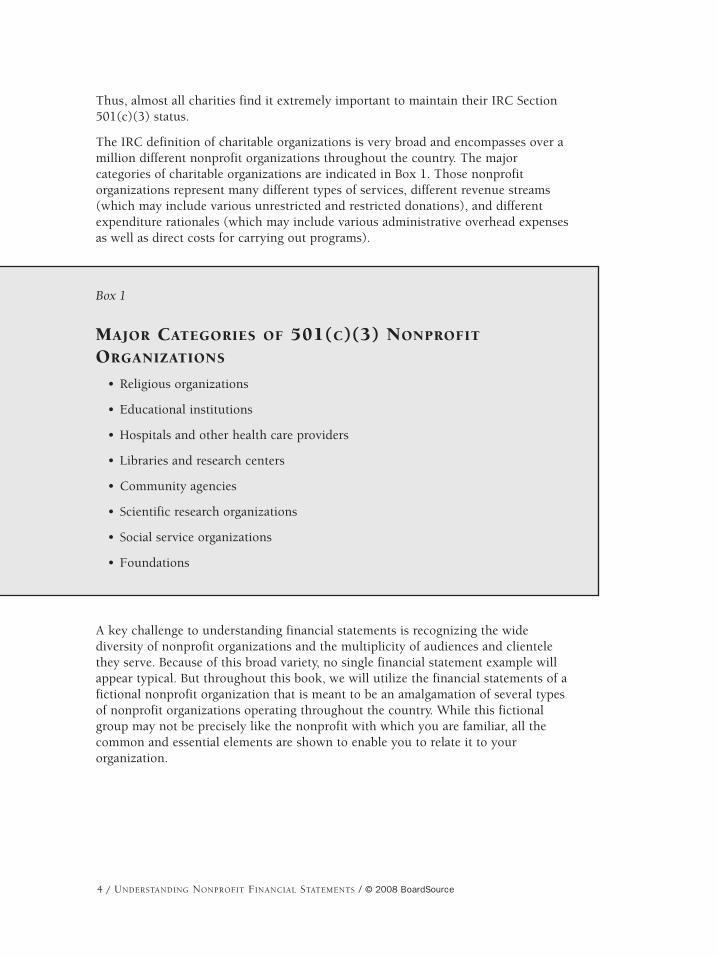
Thus, almost all charities find it extremely important to maintain their IRC Section501(c)(3) status.
The IRC definition of charitable organizations is very broad and encompasses over amillion different nonprofit organizations throughout the country. The majorcategories of charitable organizations are indicated in Box 1. Those nonprofitorganizations represent many different types of services, different revenue streams(which may include various unrestricted and restricted donations), and differentexpenditure rationales (which may include various administrative overhead expensesas well as direct costs for carrying out programs).
A key challenge to understanding financial statements is recognizing the widediversity of nonprofit organizations and the multiplicity of audiences and clientelethey serve. Because of this broad variety, no single financial statement example willappear typical. But throughout this book, we will utilize the financial statements of afictional nonprofit organization that is meant to be an amalgamation of several typesof nonprofit organizations operating throughout the country. While this fictionalgroup may not be precisely like the nonprofit with which you are familiar, all thecommon and essential elements are shown to enable you to relate it to yourorganization.
Box 1
MAJOR CATEGORIES OF 501(C)(3) NONPROFIT
ORGANIZATIONS
• Religious organizations
• Educational institutions
• Hospitals and other health care providers
• Libraries and research centers
• Community agencies
• Scientific research organizations
• Social service organizations
• Foundations

© 2008 BoardSource / UNDERSTANDING NONPROFIT FINANCIAL STATEMENTS / 5
TIPS FOR BOARD MEMBERS
1. Have an analysis prepared that quantifies the financial benefits of theorganization’s tax-exempt status. This allows the organization’s board tounderstand the financial value of the status. And it provides additional talking points when discussing with outsiders the organization’s value to the community.
2. In addition, analyze the value of the benefits being contributed to thecommunity by your nonprofit organization at least once a year.

© 2008 BoardSource / UNDERSTANDING NONPROFIT FINANCIAL STATEMENTS / 7
3.
Differentiating between Accountingand Finance FunctionsAt the outset, it is important to understand the differences between accountingfunctions and finance functions — and how board members relate to each.
ACCOUNTING FUNCTIONS
The accounting function enables a reader of financial statements to gain anunderstanding of the financial condition of the organization. There are five majorelements to the accounting function, highlighted in Box 2. Each of the elements iscrucial to the proper presentation of financial information. The first three elementsare basic yet essential to the development and recording of the financial transactionsof the organization. The last two elements, valuation and disclosure, set theaccounting function apart from a purely bookkeeping task.
Valuation — defined as assigning monetary worth to financial transactions — is themost crucial element among the accounting functions. Analysis of any statement offinancial position (balance sheet) makes it quickly obvious that many of the lineitems are estimates and not actual financial values. These estimates are recorded inthe form of allowances, accruals, adjustments, and reserves and are often given avalue based on best judgment. Valuation, therefore, is part art as well as part science.Valuations take different forms depending on the type of account each may be andwhat generally accepted accounting principles (GAAP) dictates. For example, the
Box 2
ACCOUNTING FUNCTIONS
• Identifying and recording all valid transactions.
• Classifying financial transactions on a timely basis.
• Identifying the time period in which these transactions occurred (accrualaccounting).
• Valuing these financial transactions in an appropriate manner.
• Disclosing these transactions in an adequate manner, in accordance with theorganization’s transparency practices.
8 / UNDERSTANDING NONPROFIT FINANCIAL STATEMENTS / © 2008 BoardSource
valuation of cash is easy; investments are valued at the fair market value; inventory isvalued at the lower of cost or fair market value; plant; property, and equipment are athistorical cost while the related accumulated depreciation is an estimate of the usefullife of the asset and the form of the GAAP depreciation employed. On the liabilityside of the balance sheet, every organization has a line item called “accruedliabilities.” This line consists of estimated expenditures made throughout theorganization before the month ended but no invoice has yet been received. It is theaccountant’s job, at the end of each month, to estimate, or value, the amount ofdollars that need to be added to the balance sheet and statement of activities for theseat yet unreceived invoices.
Disclosure, on the other hand, is a critical function because it requires that alltransactions be produced and displayed in a relatively uniform manner. Thisuniformity is prescribed by the accounting industry through a basic set ofunderstandings known as generally accepted accounting principles (GAAP). TheFinancial Accounting Standards Board (FASB), through periodic pronouncementscalled statements, enumerates and defines disclosure requirements for nonprofitorganizations, and the American Institute of Certified Public Accountants (AICPA), ina periodically updated Nonprofit Audit Guide, sets down other important GAAPrequirements for nonprofits to follow. These two sources provide the main guidanceneeded by the organization’s accountants and auditors to develop and produce themost rational and understandable financial statements. In addition, one moreauthoritative accounting and auditing source that should be recognized is theGovernment Auditing Standards, first published in 1972, and commonly referred to asthe “Yellow Book.” These standards cover federal entities and those organizationsreceiving federal funds. Various laws require compliance with the comptrollergeneral’s auditing standards in connection with audits of federal entities and funds.Thus, these standards apply to any nonprofit organization that receives federal funds.
FINANCE FUNCTIONS
The accounting functions create standardized and understandable information thatcan be used for financial analysis. The finance function (see Box 3) provides theanalysis that makes sense of the numbers generated by the accounting functions.Financial analysis goes beyond the numbers to ascertain trends and tendencies thatmay have positive or negative impacts on the organization. One widely used methodfor doing this is by developing ratios from the accounting numbers, which canprovide the reader with enhanced information about the performance of theorganization. Such ratios as operating margin percentage, the number of days cashon hand, and the debt service ratio can then be trended across time and compared toother organizations within the organization’s sector (known as benchmarking).Conclusions can then be drawn from the analysis, courses of action evaluated, anddecision made. (These concepts will be addressed in detail in Chapters 4 and 7.)
Conclusions drawn from ratio analysis have been the subject of some controversy inrecent years. For example, boards sometimes try to set goals based on financial-ratiobenchmarking, which management is then obligated to achieve. In many nonprofitagencies, these new goals — and accountability for achieving them — is a culture
© 2008 BoardSource / UNDERSTANDING NONPROFIT FINANCIAL STATEMENTS / 9
2. “Misgivings — Recent Studies Raise an Uncharitable Question: Is Nonprofit Accounting Off Track,”Joseph McCafferty, CFO Magazine, January 2007, page 38.
Box 3
FINANCE FUNCTIONS
• Collecting
• Analyzing
• Communicating accounting and statistical information.
change, often challenged and sometimes unwelcomed. Occasionally, this resistancehas led to outright deception: Joseph McCafferty reported in CFO Magazine in 2007that at many organizations, some numbers (particularly fundraising expenses)reported on nonprofit financial statements (primarily the Statement of FinancialPosition and Statement of Activities) are being consistently misreported.2 This iscreating distorted efficiency and fundraising ratios. While we will review these laterin Chapter 7, it is important now to note that it is the board’s obligation to uncoverany such misstatements and to ensure that the underlying accounting numbers areproperly and accurately reported. Later chapters will highlight ways that boards canplay their role in helping to ensure proper accounting and reporting.
TIPS FOR BOARD MEMBERS
1. Request from management and utilize financial ratios that will help inevaluating progress toward achieving the established goals of the organization.
2. Understand the information that lies behind each ratio that is used. Forexample, when examining the fundraising ratio, make sure that expenses forraising funds are honestly and fairly reported — and not omitted entirely. Sinceit is highly unlikely that a donation can be obtained without some outlay ofexpenses, if fundraising expenses are entirely absent or under-reported, thefundraising ratio will be distorted and deceptive. Ask questions of managementand probe accounting and expense allocation practices.
3. Ensure that the organization presents its financial information according toGAAP.
© 2008 BoardSource / UNDERSTANDING NONPROFIT FINANCIAL STATEMENTS / 11
4.
Basic Elements of Audited Financial StatementsSince 1995, a generally accepted set of financial documents that provides basicfinancial information has been required for nonprofit organizations by FinancialAccounting Standards Board Statement Number 117 (FAS 117). Review of thesefinancial statements on a periodic basis by an organization’s board is necessary for itsrequired level of financial oversight:
• Statement of Financial Position (Balance Sheet)
• Statement of Activities (Income Statement)
• Statement of Cash Flows
• Statement of Functional Expenses (required for voluntary health and welfareorganizations only; useful for all other nonprofit organizations)
• Notes (footnotes)
Creation of the statements above is the responsibility of management and they aretypically produced monthly. The monthly statements are presented for the month justended as well as for the year to date to provide valuable reference points and to allowthe board to see how well the actual results follow projected assumptions. At year end,the year-to-date figures reflect the accumulation of the previous 12 months oftransaction activities applied to the balance sheet and income statement. (FAS 117 alsorequires that the financial statements focus on the entity as a whole, rather thanreporting on separate fund groups.)
Regardless of the line item, it is required that each entry be reported at net realizablevalue. This is defined as the amount in cash value that the organization expects eitherto receive or pay out. Net realizable values are almost always estimates and aredeveloped utilizing generally accepted accounting principles (GAAP) methodologies.Each method has a considerable impact on the organization’s bottom line and financialposition; therefore, these elements must be fully understood by board members. Themost significant methods, which decrease the value of the asset or the income, will bereviewed throughout this text.
OPINION LETTER
Before reviewing the actual financial statements, it should be noted that a complete setof audited financial statements will always include the auditor’s opinion letter. Theopinion letter has a basic structure set down in authoritative pronouncements by FASBand the AICPA. It is produced by the organization’s external auditors at the conclusionof their review of the year-end figures, and it expresses judgment on whether the
12 / UNDERSTANDING NONPROFIT FINANCIAL STATEMENTS / © 2008 BoardSource
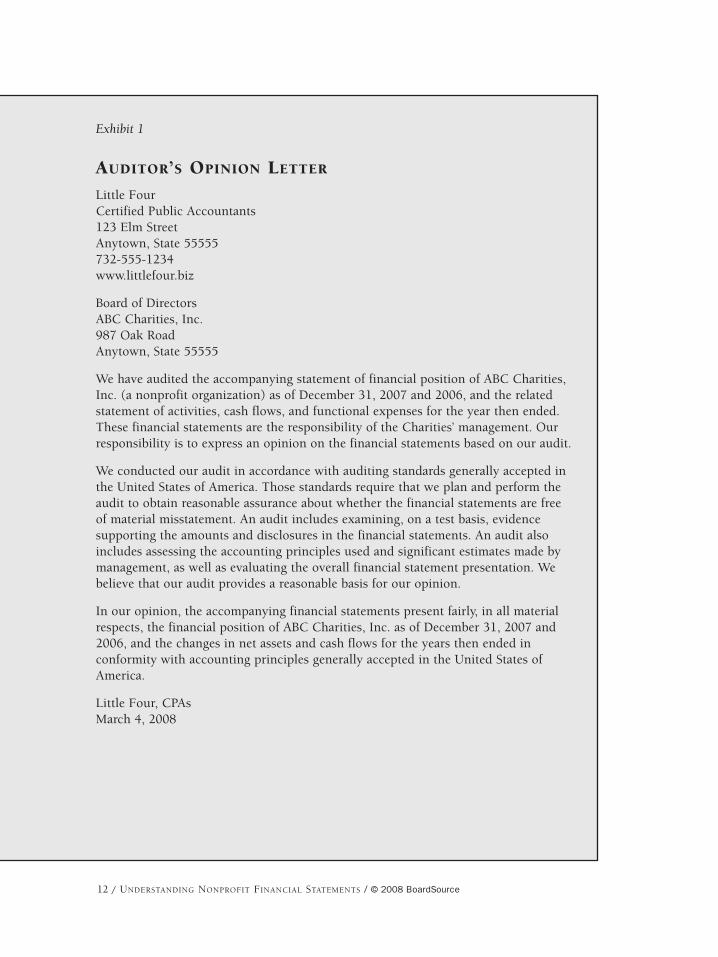
Exhibit 1
AUDITOR’S OPINION LETTER
Little FourCertified Public Accountants123 Elm StreetAnytown, State 55555732-555-1234www.littlefour.biz
Board of DirectorsABC Charities, Inc.987 Oak RoadAnytown, State 55555
We have audited the accompanying statement of financial position of ABC Charities,Inc. (a nonprofit organization) as of December 31, 2007 and 2006, and the relatedstatement of activities, cash flows, and functional expenses for the year then ended.These financial statements are the responsibility of the Charities’ management. Ourresponsibility is to express an opinion on the financial statements based on our audit.
We conducted our audit in accordance with auditing standards generally accepted inthe United States of America. Those standards require that we plan and perform theaudit to obtain reasonable assurance about whether the financial statements are freeof material misstatement. An audit includes examining, on a test basis, evidencesupporting the amounts and disclosures in the financial statements. An audit alsoincludes assessing the accounting principles used and significant estimates made bymanagement, as well as evaluating the overall financial statement presentation. Webelieve that our audit provides a reasonable basis for our opinion.
In our opinion, the accompanying financial statements present fairly, in all materialrespects, the financial position of ABC Charities, Inc. as of December 31, 2007 and2006, and the changes in net assets and cash flows for the years then ended inconformity with accounting principles generally accepted in the United States ofAmerica.
Little Four, CPAsMarch 4, 2008
© 2008 BoardSource / UNDERSTANDING NONPROFIT FINANCIAL STATEMENTS / 13
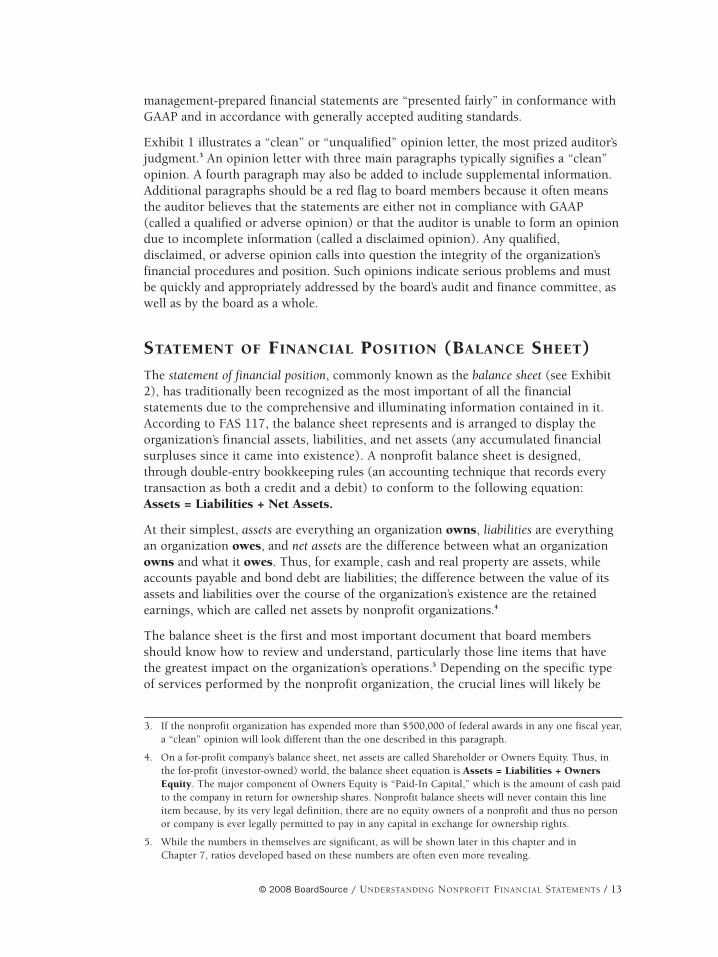
management-prepared financial statements are “presented fairly” in conformance withGAAP and in accordance with generally accepted auditing standards.
Exhibit 1 illustrates a “clean” or “unqualified” opinion letter, the most prized auditor’sjudgment.3 An opinion letter with three main paragraphs typically signifies a “clean”opinion. A fourth paragraph may also be added to include supplemental information.Additional paragraphs should be a red flag to board members because it often meansthe auditor believes that the statements are either not in compliance with GAAP(called a qualified or adverse opinion) or that the auditor is unable to form an opiniondue to incomplete information (called a disclaimed opinion). Any qualified,disclaimed, or adverse opinion calls into question the integrity of the organization’sfinancial procedures and position. Such opinions indicate serious problems and mustbe quickly and appropriately addressed by the board’s audit and finance committee, aswell as by the board as a whole.
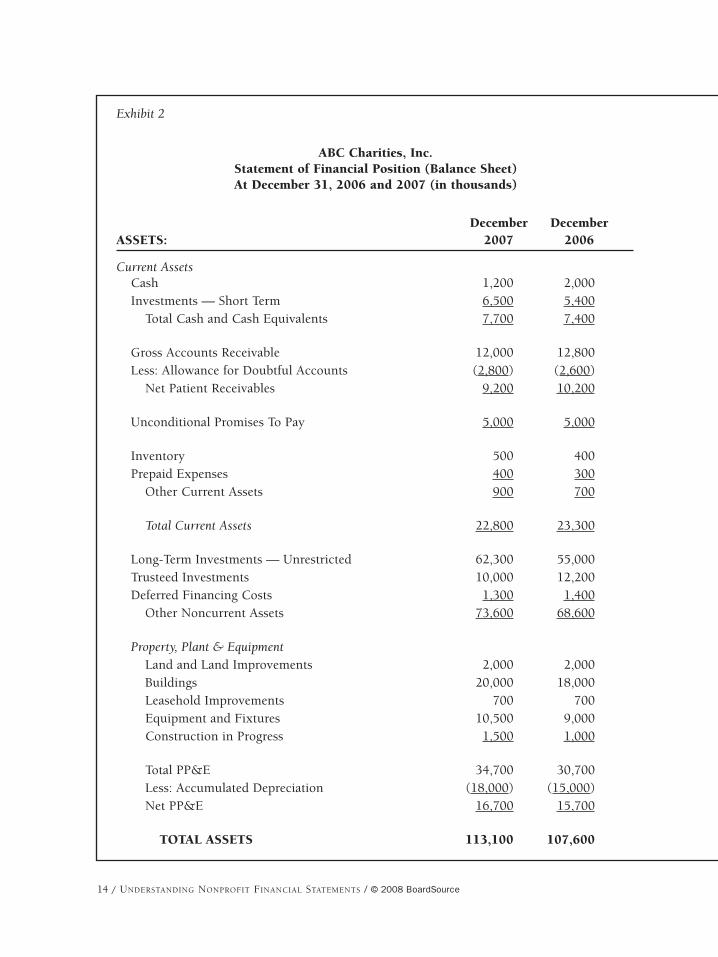
STATEMENT OF FINANCIAL POSITION (BALANCE SHEET)
The statement of financial position, commonly known as the balance sheet (see Exhibit2), has traditionally been recognized as the most important of all the financialstatements due to the comprehensive and illuminating information contained in it.According to FAS 117, the balance sheet represents and is arranged to display theorganization’s financial assets, liabilities, and net assets (any accumulated financialsurpluses since it came into existence). A nonprofit balance sheet is designed,through double-entry bookkeeping rules (an accounting technique that records everytransaction as both a credit and a debit) to conform to the following equation:Assets = Liabilities + Net Assets.
At their simplest, assets are everything an organization owns, liabilities are everythingan organization owes, and net assets are the difference between what an organizationowns and what it owes. Thus, for example, cash and real property are assets, whileaccounts payable and bond debt are liabilities; the difference between the value of itsassets and liabilities over the course of the organization’s existence are the retainedearnings, which are called net assets by nonprofit organizations.4
The balance sheet is the first and most important document that board membersshould know how to review and understand, particularly those line items that havethe greatest impact on the organization’s operations.5 Depending on the specific typeof services performed by the nonprofit organization, the crucial lines will likely be
3. If the nonprofit organization has expended more than $500,000 of federal awards in any one fiscal year, a “clean” opinion will look different than the one described in this paragraph.
4. On a for-profit company’s balance sheet, net assets are called Shareholder or Owners Equity. Thus, inthe for-profit (investor-owned) world, the balance sheet equation is Assets = Liabilities + OwnersEquity. The major component of Owners Equity is “Paid-In Capital,” which is the amount of cash paidto the company in return for ownership shares. Nonprofit balance sheets will never contain this lineitem because, by its very legal definition, there are no equity owners of a nonprofit and thus no personor company is ever legally permitted to pay in any capital in exchange for ownership rights.
5. While the numbers in themselves are significant, as will be shown later in this chapter and in Chapter 7, ratios developed based on these numbers are often even more revealing.
14 / UNDERSTANDING NONPROFIT FINANCIAL STATEMENTS / © 2008 BoardSource
December DecemberASSETS: 2007 2006
Current AssetsCash 1,200 2,000 Investments — Short Term 6,500 5,400
Total Cash and Cash Equivalents 7,700 7,400
Gross Accounts Receivable 12,000 12,800 Less: Allowance for Doubtful Accounts (2,800) (2,600)
Net Patient Receivables 9,200 10,200
Unconditional Promises To Pay 5,000 5,000
Inventory 500 400 Prepaid Expenses 400 300
Other Current Assets 900 700
Total Current Assets 22,800 23,300
Long-Term Investments — Unrestricted 62,300 55,000 Trusteed Investments 10,000 12,200 Deferred Financing Costs 1,300 1,400
Other Noncurrent Assets 73,600 68,600
Property, Plant & EquipmentLand and Land Improvements 2,000 2,000 Buildings 20,000 18,000 Leasehold Improvements 700 700 Equipment and Fixtures 10,500 9,000 Construction in Progress 1,500 1,000
Total PP&E 34,700 30,700 Less: Accumulated Depreciation (18,000) (15,000)Net PP&E 16,700 15,700
TOTAL ASSETS 113,100 107,600
Exhibit 2
ABC Charities, Inc.Statement of Financial Position (Balance Sheet)At December 31, 2006 and 2007 (in thousands)

© 2008 BoardSource / UNDERSTANDING NONPROFIT FINANCIAL STATEMENTS / 15
December DecemberLIABILITIES: 2007 2006
Current LiabilitiesAccounts Payable 6,000 4,500 Current Retirement on L/T Debt 1,500 1,400Total Current Liabilites 7,500 5,900
Long-Term Debt 64,800 66,200 Other Long-Term Liabilites 2,000 2,100Total Long-Term Liabilites 66,800 68,300
TOTAL LIABILITES 74,300 74,200
NET ASSETSUnrestricted 32,600 27,900 Temporarily Restricted 4,200 4,200 Permanently Restricted 2,000 1,300
TOTAL NET ASSETS 38,800 33,400
TOTAL LIABILITIES AND NET ASSETS 113,100 107,600
16 / UNDERSTANDING NONPROFIT FINANCIAL STATEMENTS / © 2008 BoardSource
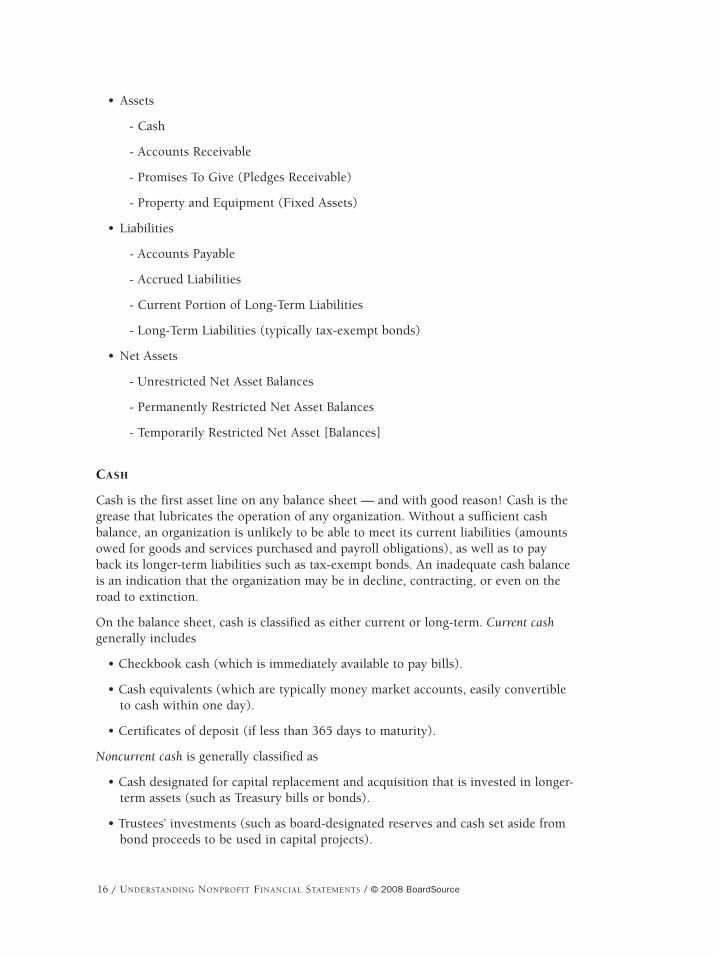
• Assets
- Cash
- Accounts Receivable
- Promises To Give (Pledges Receivable)
- Property and Equipment (Fixed Assets)
• Liabilities
- Accounts Payable
- Accrued Liabilities
- Current Portion of Long-Term Liabilities
- Long-Term Liabilities (typically tax-exempt bonds)
• Net Assets
- Unrestricted Net Asset Balances
- Permanently Restricted Net Asset Balances
- Temporarily Restricted Net Asset [Balances]
CASH
Cash is the first asset line on any balance sheet — and with good reason! Cash is thegrease that lubricates the operation of any organization. Without a sufficient cashbalance, an organization is unlikely to be able to meet its current liabilities (amountsowed for goods and services purchased and payroll obligations), as well as to payback its longer-term liabilities such as tax-exempt bonds. An inadequate cash balanceis an indication that the organization may be in decline, contracting, or even on theroad to extinction.
On the balance sheet, cash is classified as either current or long-term. Current cashgenerally includes
• Checkbook cash (which is immediately available to pay bills).
• Cash equivalents (which are typically money market accounts, easily convertibleto cash within one day).
• Certificates of deposit (if less than 365 days to maturity).
Noncurrent cash is generally classified as
• Cash designated for capital replacement and acquisition that is invested in longer-term assets (such as Treasury bills or bonds).
• Trustees’ investments (such as board-designated reserves and cash set aside frombond proceeds to be used in capital projects).

© 2008 BoardSource / UNDERSTANDING NONPROFIT FINANCIAL STATEMENTS / 17
Determining whether the levels of short-term and long-term (noncurrent) cash aresufficient is critical to an understanding of the organization’s financial health.Management should be expected to present information on a monthly basis in atrended format (preferably as a graph) to highlight the movement of theorganization’s cash balances.
ACCOUNTS RECEIVABLE
Many nonprofit organizations are service organizations, such as universities, hospitals,and social service agencies. Organizations that charge fees for their services usuallyprovide those services before payments are made; the money owed by the client orpatient or student for the services rendered are known as accounts receivable. In somenonprofit organizations, the accounts receivable may be the largest current asset.
The accounting transaction creates a receivable (a debit) on the balance sheet and acredit to service revenues on the income statement. So, for example, a transaction torecord the tuition money due from student Joe Smith would be entered on auniversity’s balance sheet accordingly:
Debit: Accounts Receivable $15,000(recorded on the balance sheet)
Credit: Service Revenue $15,000(e.g., tuition) (recorded on the income statement)
Converting accounts receivable assets into cash is a major goal of nonprofitorganizations with substantial accounts receivables. The preferred way to movereceivables to zero is through cash collections (at a rate of 100 percent of thereceivable). A less-favored method is through write-downs and write-offs, whichreduce the anticipated cash due by converting receivables to bad debts. However, theconsequence of write-offs and write-downs is a reduction of revenues on the incomestatement. So, for instance, a transaction to reflect the fact that student Joe Smith canonly pay $12,000 of his tuition instead of the full $15,000 would be expressed as areduction to previously recorded service revenue:
Debit: Cash $12,000(balance sheet)
Debit: Service Revenue Adjustment — Uncollectible $3,000(income statement)
Credit: Accounts Receivable — Joe Smith $15,000(balance sheet)
The above transaction is a direct write-off for bad debts (uncollectible accounts). Themore common method for recording bad-debt expenses and write-offs of customeraccounts is through the use of an allowance (or reserve) for accounts that aredoubtful of collection. This additional account incorporates a monthly estimate of thevalue of write-offs that are expected against the current accounts receivable balances,based upon the length of time that the accounts have remained unpaid or overdueand on the historic trends for such accounts. Typically, the difference between thismonth’s allowance for doubtful accounts and last month’s allowance for such

18 / UNDERSTANDING NONPROFIT FINANCIAL STATEMENTS / © 2008 BoardSource
accounts becomes this month’s bad-debt expense, shown as an operating expense onthe income statement:
This month’s allowance for doubtful accounts $5,000
Last month’s allowance for doubtful accounts $4,800
Bad debt expense — current month $200
Because they reduce revenues on the income statement, bad debts and write-offsshould generally be discouraged as the method for reducing the level of accountsreceivable. The board of directors and senior management should be in accord whenemphasizing to the organization’s finance division the need to maximize cashcollections and to minimize bad debts and write-offs.
PROMISES TO GIVE (PLEDGES RECEIVABLE)
In many nonprofit organizations, unconditional promises to give (previously known aspledges receivable) may represent a significant component of total assets. This is thecase when the organization’s primary revenue stream is from contributions. Whencontributions are promised or pledged (but not yet received), the organization postscontribution revenue to its statement of activities and a similar amount to theunconditional-promise-to-give line item on the balance sheet.
A question that generally arises regarding promises to give is “when is a pledge reallya pledge?” According to Statement of Financial Accounting Standards 116 (FAS 116)paragraph 6, “a promise to give is a written or oral agreement to contribute cash orother assets to another entity; however, to be recognized in financial statements theremust be sufficient evidence in the form of verifiable documentation that a promisewas made and received. A communication that does not indicate clearly whether it isa promise is considered an unconditional promise to give if it indicates anunconditional intention to give that is legally enforceable.” Thus it is incumbent onthe nonprofit organization to be have pledge policies in place that are (1) in line withthe FAS 116 standards and (2) effective in minimizing the risk of noncollection ofpledges, whether made through the mail or by phone.
The unconditional-promises-to-give balance sheet line is reported as a net number,already reflecting any reduction for the estimated amount of promises that will beuncollectible. The amount of the uncollectible is calculated based on historicalaverages and the amount of time that a pledge has remained unpaid. (It is theequivalent to the allowance for doubtful accounts applied to accounts receivable.)
As with any receivable, it is in the interest of the organization to minimize the netamount on this line at any point in time. Good management mandates that thesepromises be monitored and reasonable efforts made to collect the promises to give.
PROPERTY AND EQUIPMENT (FIXED ASSETS)
Many nonprofit organizations, particularly those that provide services, often have asubstantial percentage of their assets in so-called fixed assets. Fixed assets are tangibleitems, such as land, land improvements, buildings, building equipment, movable
© 2008 BoardSource / UNDERSTANDING NONPROFIT FINANCIAL STATEMENTS / 19
equipment, furniture, leasehold improvements, or capitalized leases. Organizations are permitted to develop their own reasonable policies for the capitalization of fixedassets, based on the useful life of the asset. For example, many organizations classifya fixed asset as any tangible item that has a useful life greater than one year and aminimum purchase price of $500. Other organizations may choose a higher minimumpurchase price or a longer life span. The longer the life and the lower the minimumpurchase price, the more assets will be reflected in this line item (and the larger theplant ledger).6 Generally, each organization is permitted to develop its own policy(known as the capitalization policy) for classifying items it owns as fixed assets,based on reasonable criteria or standard industry practices.
The plant ledger and the balance sheet reflect the current value of a fixed asset, whichis determined by subtracting the depreciation expense over an asset’s life (to date)from its original cost. This is known as accumulated depreciation. On the balancesheet, the gross property and equipment totals, less their accumulated depreciation,equals the net property and equipment line. This is also commonly referred to as thenet book value.
Depreciation is, of course, a key concept on the balance sheet. The depreciationexpense concept allows an organization to take each fixed asset on the plant ledger (abuilding or piece of equipment costing more than the minimum price chosen as partof the organization’s capitalization policy) and to depreciate (or amortize) it over theuseful life of the fixed asset. In addition to being a major element of the accumulateddepreciation line, depreciation is also considered a noncash expense, not a fixed asset,and is an important line item on the Statement of Activities. As an example, if anorganization paid $1,000,000 for its office building, and determined that the usefullife of the building was 25 years, the annual depreciation expense to be recorded inthe Statement of Activities, according to GAAP, would be $40,000 ($1,000,000divided by 25 years). The other side of this accounting entry would be $40,000 addedto the accumulated depreciation.
ACCOUNTS PAYABLE AND ACCRUED LIABILITIES
Accounts payable represents the amount of money known to be owed to trade vendors(i.e., companies that supply the organization with goods and services) and accruedliabilities is the amount estimated to be owed to vendors and suppliers (accruedexpenses) that have provided goods or services to the organization. Accrued liabilitiesmay also include vacation accruals, accrued payroll, and accrued pension.
Accounts payables include all unpaid invoices that have been recorded, while accruedexpenses are estimates of the costs for services that have been performed, but forwhich invoices have not been sent by the vendor. Both major items become liabilitiesfor which cash will need to be paid out in the near future.
Accrual of payables and liabilities is one of the five major accounting functions (seeChapter 3). It is employed to match the time period in which expenses are incurred
6. The plant ledger is a subsidiary ledger of the general ledger, where all the elements for each individualasset are recorded. The key elements are the asset’s description, original cost, date of acquisition,annual depreciation expense, and accumulated depreciation.

20 / UNDERSTANDING NONPROFIT FINANCIAL STATEMENTS / © 2008 BoardSource
with the concurrent revenues produced. Accrual accounting is generally required byGAAP because it shows a more reasonable expression of the true state of anorganization’s financial position than does the cash method of accounting. The cashmethod — which does not necessarily record the obligation of the organization to payfor services or goods that were required to produce the cash receipts or does not doso in the same time period — can be very misleading to the reader of a nonprofit’sfinancial statements. For this reason, most nonprofit organizations currently use theaccrual method for their accounting.
CURRENT PORTION OF LONG-TERM LIABILITIES
The current principal of outstanding bonds due to be paid by the organization withinthe next 12 months is referred to as the current portion of long-term liabilities. Thesepayments may be due and payable quarterly, semiannually, or annually, based on theterms of the bonds and the amortization schedule. After the original bond issuance isrecorded (see Long-Term Liabilities below), the current portion is reserved andreported separately on the balance sheet in the current liabilities section. The examplebelow reclassifies the current portion of the principal on the bonds payable from thelong-term section to the current-liability section.
Debit: Bonds Payable — Long Term $400,000(balance sheet)
Credit: Bonds Payable — Current Portion $400,000(balance sheet)
LONG-TERM LIABILITIES
In larger nonprofit organizations, the most common type of long-term liability is tax-exempt bonds payable. In smaller nonprofit organizations, a common type oflong-term liability is mortgages or notes payable. In both cases, this line representsthe amount of cash that the organization has received (less discounts and other fees)through the issuance of debt. These proceeds are typically used to finance a majorcapital purchase, expansion, or renovation that will improve the operations andservices of the organization. In the case of a bond offering, the accounting treatmentfor this type of transaction records the cash received and the liabilities created by theissuance of bonds for expansion purposes, as in this example:
Debit: Cash $9,500,000(balance sheet)
Debit: Deferred Financing Costs $500,000(balance sheet)
Credit: Bonds Payable $10,000,000(balance sheet)
The deferred financing costs are amortized (allocated) over the life of the bond,which could range from 10 to 30 years. When the deferred costs are reduced on amonthly basis, they become an income statement expense, thus decreasing theoperating and net margins. The transaction below represents the write-off of the
© 2008 BoardSource / UNDERSTANDING NONPROFIT FINANCIAL STATEMENTS / 21
deferred financing costs on the balance sheet on a monthly basis over a 30-yearperiod.
Debit: Bond Amortization Cost $1,389(income statement) ($500,000 divided by 360 monthly periods(may be combined with depreciation) [30 years x 12 months per year])
Credit: Deferred Financing Costs (balance sheet) $1,389
Mortgage receipts will have similar balance sheet treatment.
UNRESTRICTED NET ASSET BALANCES
Unrestricted net assets are the accumulation of all the organization’s financialsurpluses since it came into existence. (It is the equivalent of retained earnings on afor-profit balance sheet.) The unrestricted net asset balance assists board members indetermining the underlying financial worth of the organization, because it is the valueleft after the organization’s total liabilities are subtracted from its total assets. Boardsneed to be aware that these balances may not be available for future expansion or useduring adverse times. These balances do not necessarily represent available cash orother liquid assets but could be related to property. It is always judicious to monitortrends of an organization’s unrestricted net assets over time; most boards expect to seea continuously rising trend for this balance sheet line, as it likely representsconsistently positive operating margins.
RESTRICTED NET ASSET BALANCES
These are a nonprofit’s assets (usually cash) that a donor has restricted in their use.The restrictions are usually in the form of either a time limit for use or a restrictionon what the asset may be used for. FAS 117 requires that restricted net assets onnonprofit balance sheets be divided into two major categories: permanently restrictedand temporarily restricted. The differences can be summarized as follows.
Temporarily Restricted Net Assets
The use of the asset is restricted by a donor, but the restriction(s) can usually be meteither with the passage of time or by the purpose being fulfilled. The simplestexample of such a restricted asset is a one-year grant from a foundation to a nonprofitfor a specific work plan. To meet the restrictions, the nonprofit must fulfill the workplan within the year’s time limit. But restrictions can also be more complicated: Forexample, a donor may stipulate that the principal of his $1,000,000 donation cannotbe utilized for the first 20 years; only the interest may be used by the nonprofit.However, at the end of the 20 years, the donor specifies that the principal will nolonger be restricted. Therefore, the $1,000,000 is classified as a temporarily restrictednet asset for 20 years, at which point, the nonprofit may reclassify it as unrestricted, ifit so chooses.
It is the responsibility of management — by careful tracking of expenditures — todemonstrate to the auditors each year whether the use restrictions of a restricted asset
22 / UNDERSTANDING NONPROFIT FINANCIAL STATEMENTS / © 2008 BoardSource
have been fulfilled, so that the auditorsmay then certify that the asset (usuallycash) has been used as the donorintended.
Permanently Restricted Net Assets
The use of the asset is restricted by adonor, and the restriction never expires,nor can it be removed. An example of apermanently restricted net asset is adonation to endow a university facultyposition. Such endowments oftenstipulate that the original donatedprincipal can never be reduced or used,and that only the interest earned on theprincipal may be used to fund theposition in perpetuity.
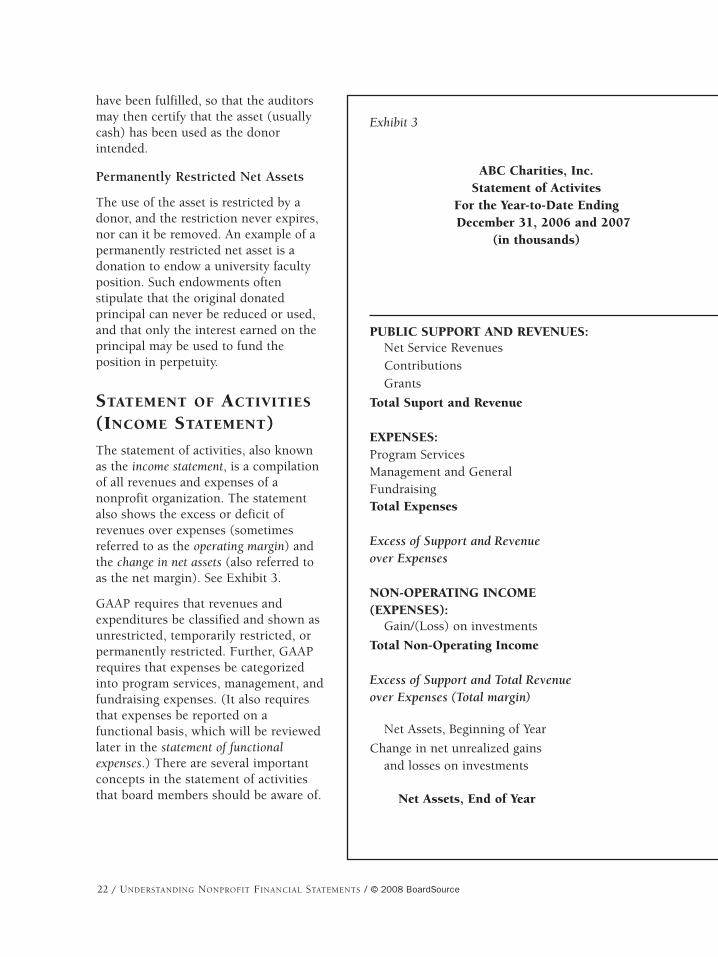
STATEMENT OF ACTIVITIES
(INCOME STATEMENT)
The statement of activities, also knownas the income statement, is a compilationof all revenues and expenses of anonprofit organization. The statementalso shows the excess or deficit ofrevenues over expenses (sometimesreferred to as the operating margin) andthe change in net assets (also referred toas the net margin). See Exhibit 3.
GAAP requires that revenues andexpenditures be classified and shown asunrestricted, temporarily restricted, orpermanently restricted. Further, GAAPrequires that expenses be categorizedinto program services, management, andfundraising expenses. (It also requiresthat expenses be reported on afunctional basis, which will be reviewedlater in the statement of functionalexpenses.) There are several importantconcepts in the statement of activitiesthat board members should be aware of.
Exhibit 3
PUBLIC SUPPORT AND REVENUES:Net Service Revenues Contributions Grants
Total Suport and Revenue
EXPENSES:Program Services Management and General Fundraising Total Expenses
Excess of Support and Revenue over Expenses
NON-OPERATING INCOME (EXPENSES):
Gain/(Loss) on investments
Total Non-Operating Income
Excess of Support and Total Revenue over Expenses (Total margin)
Net Assets, Beginning of Year
Change in net unrealized gains and losses on investments
Net Assets, End of Year
ABC Charities, Inc. Statement of Activites
For the Year-to-Date Ending December 31, 2006 and 2007
(in thousands)

© 2008 BoardSource / UNDERSTANDING NONPROFIT FINANCIAL STATEMENTS / 23
ABC Charities, Inc. Statement of ActivitesFor the Year-to-Date Ending December 31, 2006 and 2007
(in thousands)Twelve Months Ended 12/31/2007
Temporarily Permanently Total Total Percentage Unrestricted Restricted Restricted 2007 2006 Change
43,600 10,000 - 53,600 50,000 7.20%
9,000 - 700 9,700 9,000 7.78%3,400 - - 3,400 3,200 6.25%
56,000 10,000 700 66,700 62,200 7.23%
40,600 7,000 - 47,600 45,800 3.30% 10,190 3,000 - 13,190 12,000 12.33%
710 - - 710 700 1.43% 51,500 10,000 0 61,500 58,500 5.13%
4,500 0 700 5,200 3,700 40.54%
1,200 - - 1,200 1,000 20.00%
1,200 - - 1,200 1,000 20.00%
5,700 - 700 6,400 4,700 36.17%
59,500 4,200 1,300 65,000 62,300 4.33%
(1,000) - - (1,000) (2,000) -50.00%
64,200 4,200 2,000 70,400 65,000 8.31%
Twelve months ended 12/31/07
24 / UNDERSTANDING NONPROFIT FINANCIAL STATEMENTS / © 2008 BoardSource
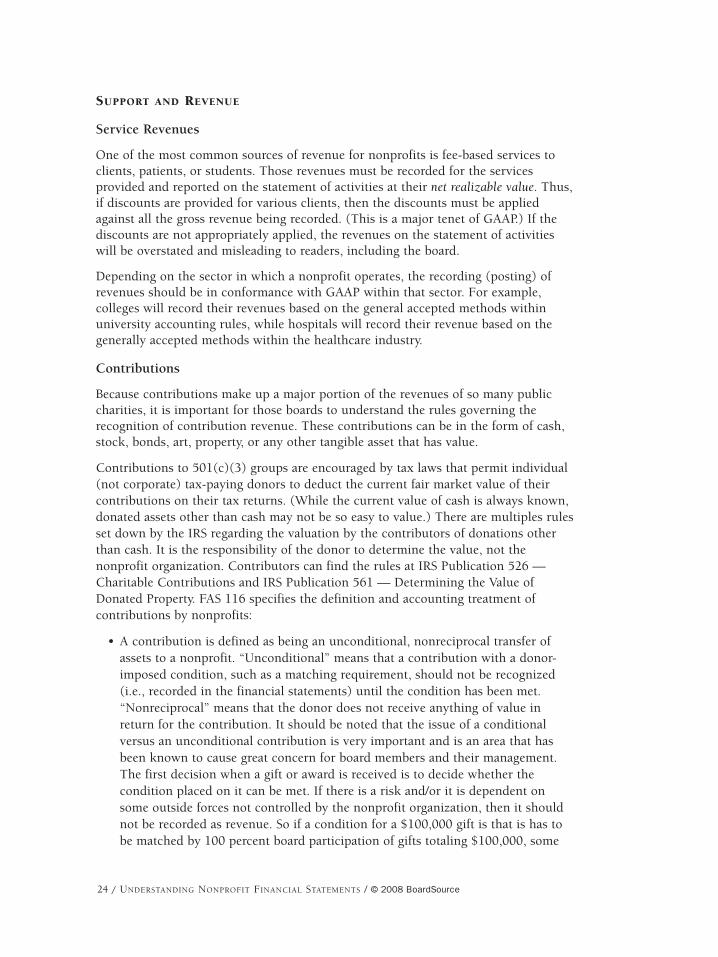
SUPPORT AND REVENUE
Service Revenues
One of the most common sources of revenue for nonprofits is fee-based services toclients, patients, or students. Those revenues must be recorded for the servicesprovided and reported on the statement of activities at their net realizable value. Thus,if discounts are provided for various clients, then the discounts must be appliedagainst all the gross revenue being recorded. (This is a major tenet of GAAP.) If thediscounts are not appropriately applied, the revenues on the statement of activitieswill be overstated and misleading to readers, including the board.
Depending on the sector in which a nonprofit operates, the recording (posting) ofrevenues should be in conformance with GAAP within that sector. For example,colleges will record their revenues based on the general accepted methods withinuniversity accounting rules, while hospitals will record their revenue based on thegenerally accepted methods within the healthcare industry.
Contributions
Because contributions make up a major portion of the revenues of so many publiccharities, it is important for those boards to understand the rules governing therecognition of contribution revenue. These contributions can be in the form of cash,stock, bonds, art, property, or any other tangible asset that has value.
Contributions to 501(c)(3) groups are encouraged by tax laws that permit individual(not corporate) tax-paying donors to deduct the current fair market value of theircontributions on their tax returns. (While the current value of cash is always known,donated assets other than cash may not be so easy to value.) There are multiples rulesset down by the IRS regarding the valuation by the contributors of donations otherthan cash. It is the responsibility of the donor to determine the value, not thenonprofit organization. Contributors can find the rules at IRS Publication 526 —Charitable Contributions and IRS Publication 561 — Determining the Value ofDonated Property. FAS 116 specifies the definition and accounting treatment ofcontributions by nonprofits:
• A contribution is defined as being an unconditional, nonreciprocal transfer ofassets to a nonprofit. “Unconditional” means that a contribution with a donor-imposed condition, such as a matching requirement, should not be recognized(i.e., recorded in the financial statements) until the condition has been met.“Nonreciprocal” means that the donor does not receive anything of value inreturn for the contribution. It should be noted that the issue of a conditionalversus an unconditional contribution is very important and is an area that hasbeen known to cause great concern for board members and their management.The first decision when a gift or award is received is to decide whether thecondition placed on it can be met. If there is a risk and/or it is dependent onsome outside forces not controlled by the nonprofit organization, then it shouldnot be recorded as revenue. So if a condition for a $100,000 gift is that is has tobe matched by 100 percent board participation of gifts totaling $100,000, some

© 2008 BoardSource / UNDERSTANDING NONPROFIT FINANCIAL STATEMENTS / 25
thought must be given before simply recording it as revenue. If this particularboard has never had more than 20 percent of its members give and never raisedmore $7,000 among them, then the revenue should not be recorded. However, ifthe board is very influential and continually has had 100 percent participationwith consistently more than $100,000 raised, then the revenue should berecognized at the time of the gift. Once it is determined that the award is not“conditional” and can be recorded when notice of the award is received, then thenext decision is the asset class — is it unrestricted, temporarily restricted, orpermanently restricted.
• A contribution is recorded, not just when cash is received, but also if and when apledge is made. This means the recipient organization must record a pledgereceivable and contribution income prior to actually receiving the cash.
• A contribution is recorded immediately as income, even though it may havedonor restrictions that have not been met. This is based on FASB’s determinationthat a restricted contribution only limits the use of the funds, but does not resultin a liability for the nonprofit. Therefore, a contribution is recognized as incomecurrently, even though the related expenditure to satisfy a restriction may not bemade until a future period.
Grants
Another significant benefit of 501(c)(3) tax-exempt designation for nonprofits is theability to accept grants from charitable and corporate foundations and fromgovernment agencies. Grants can be restricted or unrestricted and are recorded at theirfair market value when received.
Grants are typically made to a nonprofit organization by corporations, foundations,and government agencies to help the nonprofit meet its charitable mission. Grantrevenue is a major source of funding for many nonprofits and is often used toaugment donations and service revenues, enabling an organization to expand theservices and support needed by its clients, patients, or students.
Expenses
FAS 117 requires that expenses must be categorized and grouped into programservices, management, and fundraising functions. While practices vary widely fromorganization to organization in the nonprofit sector as to how expenses arecategorized, it is important to understand the basic guidelines. The three majorcategories prescribed by FAS 117 are
1. Program Services: These are the expenditures, goods, and services used inactivities to fulfill the purpose or mission of the organization. In general, themost common expenses include salaries and benefits for staff, supplies,purchased services, and even the depreciation allocated for the buildings andequipment used to service the organization’s clientele.
2. Management and General: This category includes expenditures on generaloversight and management (except for direct conduct of program services or

26 / UNDERSTANDING NONPROFIT FINANCIAL STATEMENTS / © 2008 BoardSource
fundraising activities), general record keeping, budgeting, finance, and othergeneral and administrative activities. Also included are expenses that arecategorized as indirect, shared, or overhead — those that are essential toprogram administration but are difficult to allocate to specific programs. A fewexamples of overhead expenses include allocated portions of a chief executive’stime or lease costs for shared space (such as restrooms). It is important forboards to recognize the indispensable value of these supporting services to thefunction and success of the organization’s program services.
3. Fundraising: This category recognizes expenses incurred in the solicitation ofcontributions and grants from individuals, foundations, government agencies,and others. It can include costs of fundraising activities as widely varied asdirect mail, a walk-a-thon, or a fundraising dinner. What is important for boardmembers is to recognize that this is where all the expenses incurred in theproduction of fundraising revenues is captured. It is essential to someimportant ratios and is useful to the board, particularly for planning andmonitoring.
Because it is required that each organization assign expenses among these functionsaccording to generally accepted accounting principles and practices within its sector,board members may want to do additional reading on the subject or initiatediscussion with the group’s external auditors.
Non-Operating Revenues and Expenses
An organization may also have revenues and expenses that are not related to itsprograms or mission. These are called non-operating revenues and expenses. The mostcommon item that falls into this category is realized investment income or losses —gain or loss from the sale of invested assets (such as common stock or mutual funds)that are owned by the organization. There are very specific accounting rules forreporting these revenues. (Note: unrealized investment income or losses are notshown in this section of the statement, but rather as a Change in Net Assets.)
Change in Net Assets
As stated in the previous section, unrealized income or losses on investments (increasesor decreases to the value of the investment instruments, such as stocks and bonds)are reported as a change in net assets. The unrealized income or losses oninvestments are the differences between the fair market values of all the organization’sassets that have potential for investment and that are still being held by theorganization. The change is shown as of the end of the last accounting period and forthe current accounting period.
FAS 124 requires that unrealized income or losses be reported on the statement ofactivities after the “total margin” line because they are unrealized and therefore onlyhave the potential to influence the bottom line of the organization. Therefore, theFASB requires that they be shown, but after actual operating revenues and expenses.See the next to last line in Exhibit 3 (page 22).

© 2008 BoardSource / UNDERSTANDING NONPROFIT FINANCIAL STATEMENTS / 27
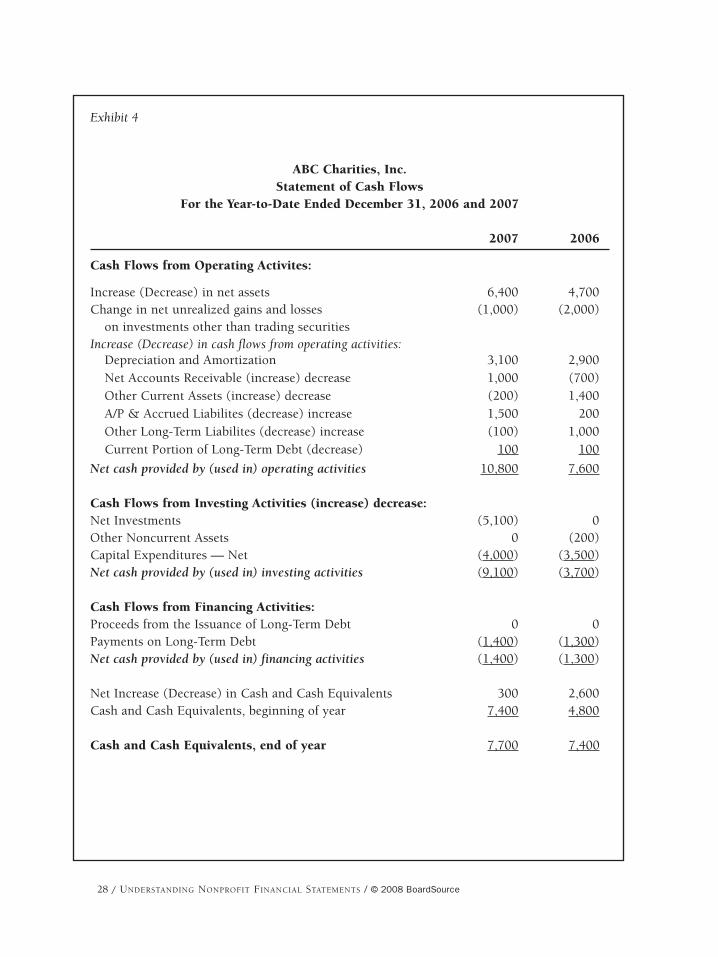
STATEMENT OF CASH FLOWS
The statement of cash flows (see Exhibit 4) is also mandated by FAS 117. It reports thesources and uses of the organization’s short-term cash and cash equivalents for theperiod concurrent with the statement of activities (income statement). It is asummary of where the organization’s cash came from and how it was used.
The statement of cash flows is often overlooked as a source of information for boardmembers and administrators, but it is necessary to complete the reader’sunderstanding of a nonprofit organization’s financial condition. The most importantline items to review are net investments, capital expenditures, proceeds from theissuance of long-term debt, and payments on long-term debt.
NET INVESTMENTS
If an organization chooses to use any of its short-term cash to invest in higheryielding, longer-term financial instruments (e.g., bonds or mutual funds), the totalnet value of the investments is reported on this line of the statement of cash flows. Itis important for board members to review this line if there was a reduction of short-term cash to which this could have been a contributing factor.
CAPITAL EXPENDITURES — NET
As one of the most important lines on the statement of cash flows, capitalexpenditures — net is the only place in the entire set of financial statements where areader can determine the total net amount of cash spent on fixed assets. A boardmember should review the amount reported on this line and compare it to thedepreciation expense reported above it on the statement.7
If the net capital expenditures plus payments on long-term debt (see page 27) exceedthe reported depreciation expense, then the organization has spent more cash on newfixed assets and old debt principal than it recorded as operating expenses. This willtypically translate as net cash outlays for the organization. It is an area that may needto be reviewed by management and the board if the organization is experiencing cashflow shortages.
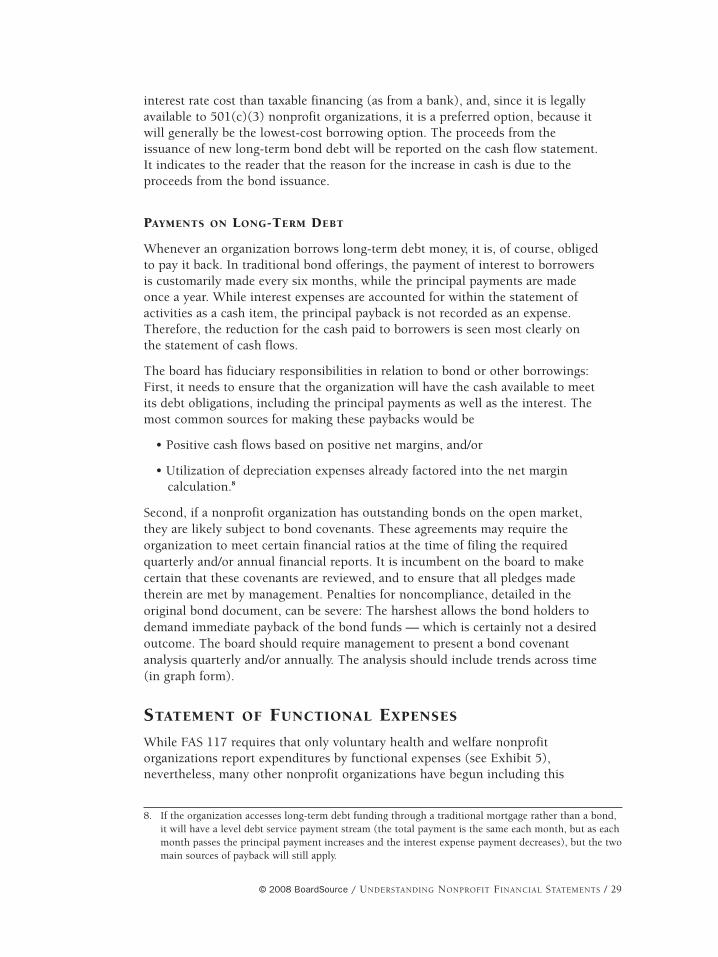
PROCEEDS FROM THE ISSUANCE OF LONG-TERM DEBT
When a nonprofit organization needs to spend money to expand its operations(renovations, new facilities, new equipment), it has several options. It can useaccumulated cash or investments, create more cash through increased giving, such asa capital campaign, lease (if appropriate), or borrow money. If the amount needed islarge and borrowing appears to be the best option, an organization may turn to tax-exempt bonds as its means of debt financing. Tax-exempt financing will have a lower
7. Depreciation is an expense reported on the statement of activities (income statement), but it is also anoncash expense, which is why it is added back on the cash flow statement.
28 / UNDERSTANDING NONPROFIT FINANCIAL STATEMENTS / © 2008 BoardSource
Exhibit 4
ABC Charities, Inc.Statement of Cash Flows
For the Year-to-Date Ended December 31, 2006 and 2007
2007 2006
Cash Flows from Operating Activites:
Increase (Decrease) in net assets 6,400 4,700 Change in net unrealized gains and losses (1,000) (2,000)
on investments other than trading securitiesIncrease (Decrease) in cash flows from operating activities:
Depreciation and Amortization 3,100 2,900 Net Accounts Receivable (increase) decrease 1,000 (700)Other Current Assets (increase) decrease (200) 1,400 A/P & Accrued Liabilites (decrease) increase 1,500 200 Other Long-Term Liabilites (decrease) increase (100) 1,000 Current Portion of Long-Term Debt (decrease) 100 100
Net cash provided by (used in) operating activities 10,800 7,600
Cash Flows from Investing Activities (increase) decrease:Net Investments (5,100) 0 Other Noncurrent Assets 0 (200)Capital Expenditures — Net (4,000) (3,500)Net cash provided by (used in) investing activities (9,100) (3,700)
Cash Flows from Financing Activities:Proceeds from the Issuance of Long-Term Debt 0 0 Payments on Long-Term Debt (1,400) (1,300)Net cash provided by (used in) financing activities (1,400) (1,300)
Net Increase (Decrease) in Cash and Cash Equivalents 300 2,600 Cash and Cash Equivalents, beginning of year 7,400 4,800
Cash and Cash Equivalents, end of year 7,700 7,400
© 2008 BoardSource / UNDERSTANDING NONPROFIT FINANCIAL STATEMENTS / 29
interest rate cost than taxable financing (as from a bank), and, since it is legallyavailable to 501(c)(3) nonprofit organizations, it is a preferred option, because itwill generally be the lowest-cost borrowing option. The proceeds from theissuance of new long-term bond debt will be reported on the cash flow statement.It indicates to the reader that the reason for the increase in cash is due to theproceeds from the bond issuance.
PAYMENTS ON LONG-TERM DEBT
Whenever an organization borrows long-term debt money, it is, of course, obligedto pay it back. In traditional bond offerings, the payment of interest to borrowersis customarily made every six months, while the principal payments are madeonce a year. While interest expenses are accounted for within the statement ofactivities as a cash item, the principal payback is not recorded as an expense.Therefore, the reduction for the cash paid to borrowers is seen most clearly onthe statement of cash flows.
The board has fiduciary responsibilities in relation to bond or other borrowings:First, it needs to ensure that the organization will have the cash available to meetits debt obligations, including the principal payments as well as the interest. Themost common sources for making these paybacks would be
• Positive cash flows based on positive net margins, and/or
• Utilization of depreciation expenses already factored into the net margincalculation.8
Second, if a nonprofit organization has outstanding bonds on the open market,they are likely subject to bond covenants. These agreements may require theorganization to meet certain financial ratios at the time of filing the requiredquarterly and/or annual financial reports. It is incumbent on the board to makecertain that these covenants are reviewed, and to ensure that all pledges madetherein are met by management. Penalties for noncompliance, detailed in theoriginal bond document, can be severe: The harshest allows the bond holders todemand immediate payback of the bond funds — which is certainly not a desiredoutcome. The board should require management to present a bond covenantanalysis quarterly and/or annually. The analysis should include trends across time(in graph form).
STATEMENT OF FUNCTIONAL EXPENSES
While FAS 117 requires that only voluntary health and welfare nonprofitorganizations report expenditures by functional expenses (see Exhibit 5),nevertheless, many other nonprofit organizations have begun including this
8. If the organization accesses long-term debt funding through a traditional mortgage rather than a bond,it will have a level debt service payment stream (the total payment is the same each month, but as eachmonth passes the principal payment increases and the interest expense payment decreases), but the twomain sources of payback will still apply.

30 / UNDERSTANDING NONPROFIT FINANCIAL STATEMENTS / © 2008 BoardSource
report, since, in the words of FAS 117, it “helps donors, creditors, and others inassessing an organization’s service efforts, including the costs of its services and howit uses resources.”
The statement of functional expenses enables a reader to determine quickly if anorganization is utilizing its revenue and support dollars primarily to achieve itsprogram mission, or using them largely to pay for support services, such asfundraising or administrative activities. It is useful for board members to compare thepercentages spent on each category of functional expenses by their organization to thepercentages spent by other, similar groups. Many nonprofit sectors, such as artsgroups, libraries, hospitals, and others, have developed their own benchmarks for thepercentage of expenses that are usually and customarily devoted to program servicesversus supporting services.
The primary functional classifications and their definitions (discussed in detail earlierunder the Statement of Activities on page 22) are
Exhibit 5
For the Year-to-Date Ended December 31, 2006 and 2007
Mental SubstanceHealth Abuse Clinic
STAFFING EXPENSESSalaries 8,000 6,000 11,000 Fringe Benefits 1,680 1,260 2,310 Contract Services 720 540 990
Total Salaries and Benefits 10,400 7,800 14,300
NONSTAFFING EXPENSESMedical Supplies 1,000 400 1,600 Office Supplies 400 200 380 Other Expenses 800 500 800 Rent Expense 500 720 1,400 Legal - - - Accounting - - - Bad Debt Expense 500 200 700 Depreciation — Buildings and Equipment 600 200 1,600 Interest & Financing Expenses 600 200 1,800
Total Nonstaffing Expenses 4,400 2,420 8,280
Statement of Functional ExpensesABC Charities, Inc.
For the Year-to-Date Ended December 31, 2006 and 2007

© 2008 BoardSource / UNDERSTANDING NONPROFIT FINANCIAL STATEMENTS / 31
• Program services: expenditures, goods, and services used in activities to fulfill thepurpose or mission of the organization.
• Supporting activities:
- Management and general: expenditures on general oversight, administrative,and management functions.
- Fundraising: expenses incurred in the solicitation of contributions fromindividuals, foundations, government agencies, and others.
- Membership development: costs of soliciting for prospective members andmembership dues, membership relations, and similar activities.
The allocation of so-called joint, shared, or overhead expenses between programservices and supporting activities is a point of controversy for many groups andnonprofit sectors. While GAAP tries to define the parameters within which certainexpenses like space costs, management costs, and fundraising costs are allocated
Total Management 2007 2006Program and Fund- Total Total %Support General Raising Expenses Expenses Change
25,000 9,000 400 34,400 33,000 4.24%
5,250 1,890 85 7,225 6,930 4.26% 2,250 - - 2,250 2,500 -10.00%
32,500 10,890 485 43,875 42,430 3.41%
3,000 - - 3,000 2,820 6.38%
980 200 50 1,230 1,200 2.50% 2,100 500 50 2,650 1,970 34.52%
2,620 - 25 2,645 2,500 5.80% - 300 - 300 280 7.14% - 100 - 100 100 0.00%
1,400 - 100 1,500 1,000 50.00% 2,400 600 - 3,000 2,900 3.45%
2,600 600 - 3,200 3,300 -3.03%
15,100 2,300 225 17,625 16,070 9.68%
32 / UNDERSTANDING NONPROFIT FINANCIAL STATEMENTS / © 2008 BoardSource
between the two, the application of such guidelines may be — and often is —inconsistent.
For example, the AICPA (in Statement of Position 98-2) outlines the criteria forallocation of certain “joint” costs between program and fundraising, but theapplication of those criteria may vary dramatically from organization to organization.The result can be, for example, that one group may allocate a much greaterpercentage of direct mail costs to public education (a program service) and a muchsmaller percentage to fundraising (a supporting activity) than another organizationwith similar direct mail activities, resulting in dramatically different ratios of programto supporting services for the two groups.
Likewise, time spent by an organization’s chief executive on program activities mayrightfully be allocated to that, rather than to administrative, supporting costs.Similarly, various shared expenses, such as rent, utilities, insurance, and other itemsmay be divided by one organization by a reasonable, consistent allocationmethodology. But a different methodology used by another group to allocate thosesame costs — while also reasonable and consistent — may produce widely varyingresults from the former.
Any internal allocation guidelines that are reasonable, justifiable, and consistent, arelikely to be accepted by auditors and donors. But this lack of standard allocationpractices makes functional accounting less than reliable as a benchmark standard.
FOOTNOTES
No set of financial statements is complete without the footnotes or notes that providefurther crucial information to the reader about the organization’s financial policiesand procedures. Many footnotes are required by GAAP and, in some cases, even theformat is prescribed. For example, the first footnote on all financial statements is asummary of significant accounting policies; it discloses the various accountingpolicies and practices used by the organization in the creation of its accounting booksand records (see Exhibit 6 on page 34).
Additional notes may be used to describe, in detail, the nonprofit’s programs,investments and investment policies, affiliated organization investments, property andequipment, lease commitments, contingent liabilities, long-term debts and leases,joint cost allocations, related party transactions, pension plans, temporarily andpermanently restricted assets, and any significant subsequent events.
Board members overlook the notes at their peril, for they provide essential additionalinformation about key issues that affect an organization’s financial status — and theyare necessary to a full understanding of the financial statements.
THE SARBANES-OXLEY (SOX) ACT AND ITS RELEVANCE
TO NONPROFIT ORGANIZATIONS
The Sarbanes-Oxley Act set new standards for investor-owned companies in 2002.The law came about because highly publicized accounting improprieties at investor-

© 2008 BoardSource / UNDERSTANDING NONPROFIT FINANCIAL STATEMENTS / 33
owned companies, such as Enron, Worldcom, and Xerox, provoked such a publicoutcry that Congress was prompted to legislate better accounting controls forinvestor-owned companies. It was enacted to ensure that internal controls overfinancial reporting became one of management’s highest priorities by codifying board,governance, management, and auditor responsibility for maintaining boardobjectivity and auditor independence and by ensuring that companies have processesand controls in place to produce timely and accurate financial reports for boards andshareholders.
SOX’s main provisions:
• Require establishment of an independent and competent audit committee of theboard;
• Require periodic change of auditors, prohibit auditing firms from providing non-audit services concurrent with auditing services, and increase disclosure of allcritical accounting policies and practices by the auditors;
• Impose disclosure and conflict-of-interest requirements on boards of directors;
• Require public disclosure of internal control mechanisms, material off-balancesheet adjustments, and corrections to past financial statements; and
• Provide protections for whistleblowers and prohibit retaliation against them.
But, with two exceptions, the SOX legislation applies only to publicly tradedcompanies. So why discuss these provisions in a book devoted to nonprofits?
First, the goal of SOX is certainly relevant and appropriate for any nonprofitorganization. The primary aim of SOX is to ensure that the financial informationbeing reported to a board by management is accurate and can be relied upon in theirdecision making. SOX provides corporate directors with added assurance thatauditors are independent and that internal controls are adequate — without whichthere is no reasonable expectation that the numbers being reported have authenticity.
Second, the nonprofit sector has had its share of similar scandals. This has promptedseveral watchdog organizations, legislators, and standard-setting groups for severalsegments within the nonprofit community to study SOX-like controls in more detail.For example, in the health care industry, the National Association of InsuranceCommissioners has adopted revisions to its Model Audit Rule that would imposeSOX-like requirements in three areas: management reports on Internal Control ofFinancial Reporting, the audit committee’s composition and responsibilities, andauditor independence and scope of services. In California, the first state to adoptsuch a law, the Nonprofit Integrity Act of 2004 requires that any charity registeredwith the attorney general and receiving annual gross revenues of $2 million or moremust form an audit committee.9
Studies of investor-owned companies have shown that stronger internal controls haveresulted in increased investor confidence and long-term shareholder value — whichin the nonprofit world would translate to increased donor confidence and communitysupport. In addition, many companies have found that compliance has improvedtheir processes and systems, eliminated redundancies, improved the control

34 / UNDERSTANDING NONPROFIT FINANCIAL STATEMENTS / © 2008 BoardSource
Exhibit 6
ABC Charities, Inc.Notes to Financial StatementsYears Ended December 31, 2007 and 2006
1. SUMMARY OF SIGNIFICANT POLICIES
a. Operations
ABC Charities, Inc. is a not-for-profit health services organization, providing generaland mental health and substance abuse services.
The Charities is exempt from federal income taxes under Section 501(c)(3) of theInternal Revenue Code and from Federal Unemployment Compensation tax.
Contributions to the Charities are deductible for income tax purposes within thelimitations of the law.
b. Basis of Accounting
The accompanying financial statements have been prepared on the accrual basis ofaccounting and are presented in accordance with Financial Accounting Standards BoardStatements No. 117, Financial Statements of Not-for-Profit Organizations. Under SFAS117, the Charities is required to report information regarding its financial position andactivities according to three classes of net assets: unrestricted net assets, temporarilyrestricted net assets, and permanently restricted net assets. The Charities hadunrestricted and temporarily restricted net assets in 2007 and 2006.
c. Net Assets Accounting
ABC Charities reports grants and gifts as restricted support if they are received withdonor stipulations that limit the use of donated assets. When a donor restrictionexpires, that is, when a stipulated time restriction ends or purpose restriction isaccomplished, temporarily restricted net assets are reclassified to unrestricted net assetsand reported in the statement of activities as net assets released from restrictions.Grants and donations of fixed assets are recorded as unrestricted support, unlessexplicit donor stipulations specify how those assets must be used.
d. Property and Equipment
Property and equipment are stated at cost or, if donated, at the approximate fair marketvalue at the date of donation.
Depreciation is computed using the straight-line method over the estimated useful livesof related assets, which range as follows:
Land Improvements 20 – 40 yearsBuilding 20 – 40 yearsLeasehold Improvements 10 – 20 yearsEquipment and Fixtures 5 – 10 years
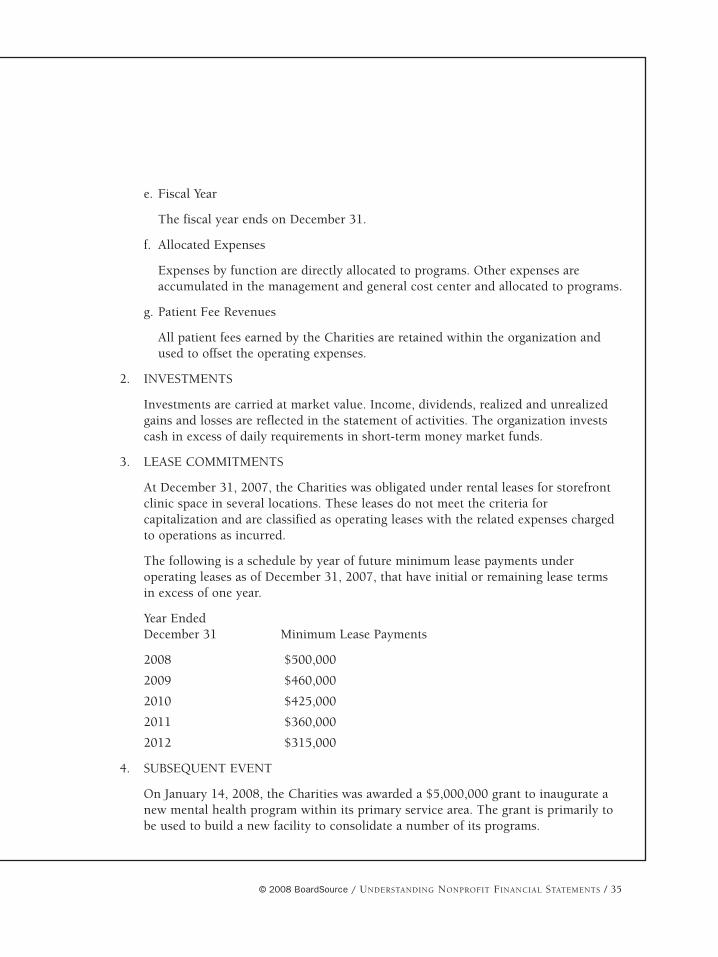
© 2008 BoardSource / UNDERSTANDING NONPROFIT FINANCIAL STATEMENTS / 35
e. Fiscal Year
The fiscal year ends on December 31.
f. Allocated Expenses
Expenses by function are directly allocated to programs. Other expenses areaccumulated in the management and general cost center and allocated to programs.
g. Patient Fee Revenues
All patient fees earned by the Charities are retained within the organization andused to offset the operating expenses.
2. INVESTMENTS
Investments are carried at market value. Income, dividends, realized and unrealizedgains and losses are reflected in the statement of activities. The organization investscash in excess of daily requirements in short-term money market funds.
3. LEASE COMMITMENTS
At December 31, 2007, the Charities was obligated under rental leases for storefrontclinic space in several locations. These leases do not meet the criteria forcapitalization and are classified as operating leases with the related expenses chargedto operations as incurred.
The following is a schedule by year of future minimum lease payments underoperating leases as of December 31, 2007, that have initial or remaining lease termsin excess of one year.
Year Ended December 31 Minimum Lease Payments
2008 $500,000
2009 $460,000
2010 $425,000
2011 $360,000
2012 $315,000
4. SUBSEQUENT EVENT
On January 14, 2008, the Charities was awarded a $5,000,000 grant to inaugurate anew mental health program within its primary service area. The grant is primarily tobe used to build a new facility to consolidate a number of its programs.

36 / UNDERSTANDING NONPROFIT FINANCIAL STATEMENTS / © 2008 BoardSource
environment, enhanced performance, and increased understanding of risk intelligenceand corporate governance.10 Even if the adoption of all SOX clauses may not belegally required for all nonprofits, periodic assessment of the organization’s internalprocesses and financial controls should be on the agenda of every board.
TIPS FOR BOARD MEMBERS
1. Request that management show cash to the board in a trended monthly format(preferably as a graph) to highlight the movement of the organization’s cashbalances.
2. If accounts receivable or promises to give are a major portion of yourorganization’s balance sheet, ask the organization’s finance division tosummarize its effort to maximize cash collections and to minimize bad debtsand write-offs. Also request that they provide the policy for classifyingpurchases as capital assets and for depreciating them.
3. Examine the most recent footnotes to the financial statements and discuss withthe auditors any significant issues.
4. Analyze with senior management the benefits and costs of adopting SOX-likeprocedures. Discuss with the auditors the changes that would need to be madeunder the adoption.
9. The Sarbanes-Oxley Act and Implications for Nonprofit Organizations, Boardsource, 2006,http://www.boardsource.org/dl.asp?document_id=558.
10. “Time for a second look at SOX compliance,” by John T. Bigalke and Steven J. Burrill, HFM magazine,August 2007, page 57.
© 2008 BoardSource / UNDERSTANDING NONPROFIT FINANCIAL STATEMENTS / 37
5.
Comparing Interim to AuditedFinancial Statements
FINANCIAL INFORMATION
As stated earlier, the board’s fiduciary responsibilities necessitate that financialinformation be provided to it on an interim basis (monthly or quarterly). The boardhas the right to request from management that the interim statement be reported inthe format it prefers. However, most boards have found that needless problems arecreated if the interim information is not given to it in substantially the same format asthe year-end audited financial statements.
The main reason for this is that the year-end statements must be reported inconformance with generally accepted accounting principles (GAAP) and inaccordance with generally accepted auditing standards (GAAS). If the interimstatements do not also comply with those principles, then crucial information may beomitted from those reports to the board and the board may find itself unhappilysurprised by information in the year-end statements.
There may be plausible reasons for the interim financial statements to the board to bedifferent in some respects from the year-end GAAP format. Not everyone agrees at alltimes with all GAAP methodology. Although GAAP is developed by industryprofessionals and is designed to represent an organization’s financial information inthe least confusing manner, this may not always be the case.
For example, GAAP stipulates that interest income earned on short-term and long-term investment assets be reported as non-operating revenues. This means that anorganization’s operating margin will be reduced by the amount of the interest expense(although the net margin will reflect the higher earnings represented by the interestincome). This will be the case in most nonprofit organizations that provideprogrammatic services, and therefore where investment income returns are not theprimary mission.
In that case, some board members might prefer for their own clarification that (1) theinterim statement of activities be reported with the interest income shown in therevenues section, or alternatively, (2) the interest expense be offset against the interestincome and the “net” amount be reported as interest income in the non-operatingsection. (See Exhibit 7.) This isolates for the board the “true” operating marginresults with both sides of the interest equation factored out.
In general, it is appropriate and permissible for the board to request presentation ofthe interim statements in whatever manner and format enhances their understanding.Still, the key concept should be that, if interim statements are presented that do notconform to GAAP, then an additional statement should be prepared and presented

38 / UNDERSTANDING NONPROFIT FINANCIAL STATEMENTS / © 2008 BoardSource
Exhibit 7
ABC Charities, Inc.Comparison of Statements of Activities
For the Year-to-Date Ending December 31, 2007(in thousands)
FORMAT
Audit (GAAP) Interim #1 Interim #22007 2007 2007
PUBLIC SUPPORT AND REVENUEService Revenues 53,600 53,60053,600Contributions 9,700 9,700 9,700 Grants 3,400 3,400 3,400 Investment Income - 1,200 -
Total Support and Revenue 66,700 67,900 66,700
EXPENSESProgram Services 47,600 47,600 47,600 Management and General 13,190 13,190 11,990 Fundraising 710 710 710
Total Expenses 61,500 61,500 60,300
Excess of Support and Revenue 5,200 6,400 6,400over Expenses (Operating Margin)
NON-OPERATING INCOMEGain/(Loss) on investments 1,200 - -
Total Non-Operating Income 1,200 - -
Excess of Support and Total Revenue 6,400 6,400 6,400over Expenses (Total Margin)
Net Assets, Beginning of Year 65,000 65,000 65,000 Change in net unrealized gains (1,000) (1,000) (1,000)
and losses on investments
Net Assets, End of Year 70,400 70,400 70,400
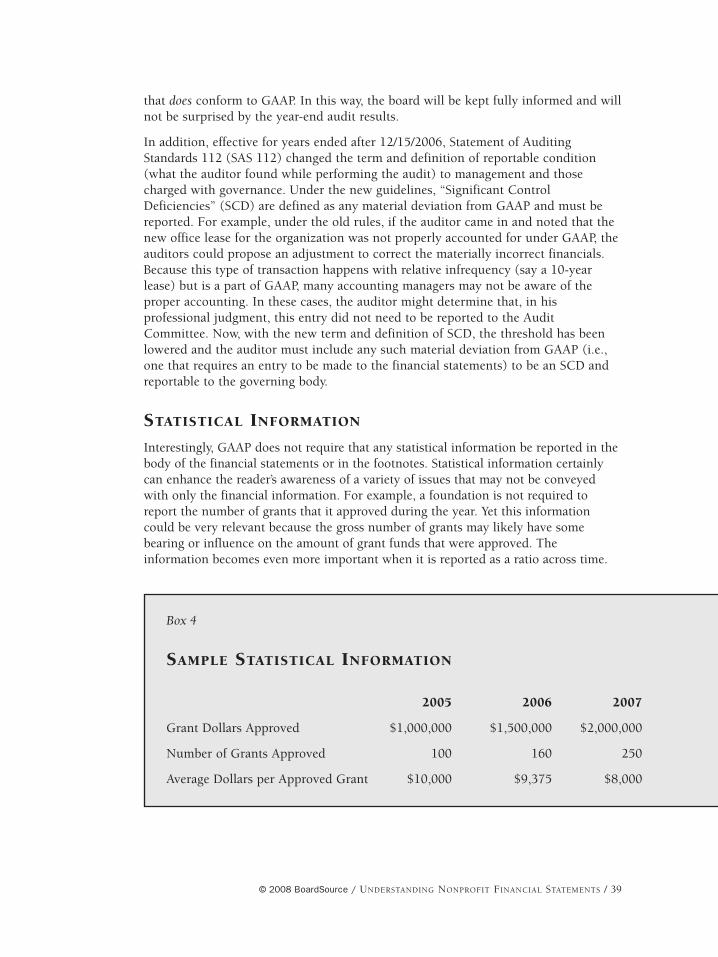
© 2008 BoardSource / UNDERSTANDING NONPROFIT FINANCIAL STATEMENTS / 39
that does conform to GAAP. In this way, the board will be kept fully informed and willnot be surprised by the year-end audit results.
In addition, effective for years ended after 12/15/2006, Statement of AuditingStandards 112 (SAS 112) changed the term and definition of reportable condition(what the auditor found while performing the audit) to management and thosecharged with governance. Under the new guidelines, “Significant ControlDeficiencies” (SCD) are defined as any material deviation from GAAP and must bereported. For example, under the old rules, if the auditor came in and noted that thenew office lease for the organization was not properly accounted for under GAAP, theauditors could propose an adjustment to correct the materially incorrect financials.Because this type of transaction happens with relative infrequency (say a 10-yearlease) but is a part of GAAP, many accounting managers may not be aware of theproper accounting. In these cases, the auditor might determine that, in hisprofessional judgment, this entry did not need to be reported to the AuditCommittee. Now, with the new term and definition of SCD, the threshold has beenlowered and the auditor must include any such material deviation from GAAP (i.e.,one that requires an entry to be made to the financial statements) to be an SCD andreportable to the governing body.
STATISTICAL INFORMATION
Interestingly, GAAP does not require that any statistical information be reported in thebody of the financial statements or in the footnotes. Statistical information certainlycan enhance the reader’s awareness of a variety of issues that may not be conveyedwith only the financial information. For example, a foundation is not required toreport the number of grants that it approved during the year. Yet this informationcould be very relevant because the gross number of grants may likely have somebearing or influence on the amount of grant funds that were approved. Theinformation becomes even more important when it is reported as a ratio across time.
Box 4
SAMPLE STATISTICAL INFORMATION
2005 2006 2007
Grant Dollars Approved $1,000,000 $1,500,000 $2,000,000
Number of Grants Approved 100 160 250
Average Dollars per Approved Grant $10,000 $9,375 $8,000

40 / UNDERSTANDING NONPROFIT FINANCIAL STATEMENTS / © 2008 BoardSource
So, as addenda to the interim financial reports, the board may want to considerrequesting of management statistical analyses or summaries that may furtherilluminate the operations of the nonprofit for board members. The information in Box4, for example, provides a foundation’s board with certain insights that wouldotherwise have been unavailable in the financial statements, and helps to developconclusions that otherwise would not have been obtainable. A board member mightobserve from the information in Box 4 that, although the nonprofit organization paidout more funds in the two years since 2005, the amount of dollars approved per grantdeclined each year. Board members, donors, or potential donors may be vitallyinterested in the trend of dollars per approved grant. If this is the case, then the boardshould be receiving this type of information regularly. Yet without a request tomanagement for such an analysis, it would be unobtainable from the financialstatements. Some statistical information, and the ratios derived from them, may bemore critical in the board’s evaluation of management’s performance than even thefinancial statements, and so should be highlighted in the board’s interim financial andoperational reports to the board.
TIPS FOR BOARD MEMBERS
1. Request that management present the interim monthly financial statements,particularly the balance sheet and the income statement, in the same format asthe year-end audited financial statement. If management does so, anydifferences between the final year-end interim and audited statements will beeasily identified.
2. Management and board members should determine what additional statisticalinformation would be most useful to the board and would best elucidateprogress toward achievement of the group’s mission (critical success factors).

© 2008 BoardSource / UNDERSTANDING NONPROFIT FINANCIAL STATEMENTS / 41
6.
Using Financial Information To Meet Other ReportingRequirementsIt is crucial that the board have a full understanding of the information that is in anorganization’s financial statements for another reason: The financial statements areused as the basis for other important public reports, both required and optional.There are three in particular that boards should be aware of: the IRS Form 990, statecharitable reports, and private charitable rating organization reports.
IRS FORM 990
Nonprofit organizations that have applied for and been approved by the IRS underSection 501(c) are, of course, exempt from most federal taxes (see Chapter 2).Nevertheless, they are still required by law to file an informational form with the IRSannually. This document is titled the Form 990.
There are several major elements of Form 990: The organization is required to reportits revenues and expenses, its statement of financial position (balance sheet), and itsstatement of functional expenses. The data for these sections are usually taken fromthe audited financial statements of the organization. In addition, the form requiresand thus provides an opportunity for the organization to introduce its programs andservices to the reader.
The Form 990 also requires information on compensation paid to the officers,directors, trustees, and the chief executive officer, as well as the compensation of thefive highest-paid employees who are not in the previous group. Also, the amountspaid to the five highest-paid nonsalaried individuals or companies must also bedisclosed.
Because of the importance of the Form 990 to preserving the organization’s federaltax-exempt status, at least one board member, presumably from the financecommittee, should review the questions before the form is submitted. This oversightis necessary to ensure that the most accurate information is submitted to the IRS. Infact, best practice would dictate that the finance expert on the board review the entirereturn. In addition, some auditing firms are submitting the Form 990 to the entireboard or committee with the audit and going through the form with them as they gothrough the SAS 61 report (now SAS 114), the financial statements and the report tothe board or management letter.
In addition to accuracy, nonprofit organizations need to ensure proper explanations,where necessary, of their financial results, as reported on Form 990. For example, anorganization that is saving and building its cash reserves to finance the purchase of a

42 / UNDERSTANDING NONPROFIT FINANCIAL STATEMENTS / © 2008 BoardSource
new facility (from which to run its programs) may have accumulated significantreserves. As such, although the amount of the reserves and the related investmentaccounts may be accurate, management or the board may have concerns that funderswill look at this information and think that the organization does not need the grantthat they are requesting. Some explanation (not required by the IRS on Form 990)put onto the form in key locations could be very helpful in further explaining therationale for such large reserves. This could ensure potential funders of the continuedneed for funds and present management in a more responsible light.
For the first time in many years, the IRS is updating and expanding the Form 990.The changes make it clear that the IRS is seeking to use the Form 990 as a means oflearning more about the interests and relationships of board members of tax-exemptorganizations and of identifying the potential for conflicts and bias between relatedboards.
Some of the more noteworthy changes that will be required for forms filed byorganizations for their fiscal year beginning 2008 include
• Expanded definitions and disclosure of the family and business relationships ofofficers, directors, trustees, and key employees.
• Questions on executive compensation details regarding loans, executiveperquisites, deferred compensation, and other retirement benefits; relatedorganizations; and corporate governance.
• New reporting of compensation and benefits paid to officers, directors, trustees,and key employees of related organizations.
• New reporting of compensation and benefits payable to so-called “disqualified”persons.
• New disclosure requirements (required by the Pension Protection Act of 2006)relating to transfers to and from controlled entities.
STATE CHARITABLE REPORTS
A nonprofit that is active in a state will most likely be required to register and reportannually to that state government, usually the Secretary of State’s office. (Presently,only 10 states have no registration or reporting requirement for nonprofits.) Whethera nonprofit is “active” within a state usually requires some minimum of activity —but in most states that can be as little as soliciting a contribution by mail or Internetfrom any resident of the state. Therefore, many nonprofits find it necessary to registerand report in more than one state.
Usually an organization’s audited financial statements will provide most or all of theinformation that is required to be reported, or the reporting requirement may besatisfied by simply filing the group’s audited financial statements with the state. Manystates have also made it easier for multistate filers by adopting the UniformRegistration Form, which standardizes the information requested by those states. Butwhether a nonprofit is active in one or all 50 states, it is important for its board to be
© 2008 BoardSource / UNDERSTANDING NONPROFIT FINANCIAL STATEMENTS / 43
aware that it very likely has a state reporting burden (and some major cities havesimilar requirements).
CHARITABLE ORGANIZATION RATING GROUPS
There is another reason to provide a Form 990 to the government that has the mostaccurate and comprehensive data. Unlike individual income tax forms, the Form 990is considered an informational report. Therefore, unlike individual tax forms whoseconfidentiality is strictly guarded by law from public disclosure, the Form 990 isavailable to anyone who requests it from the IRS. Or it may be requested directlyfrom the nonprofit organization and must, by law, be provided within a short periodof time.
The Internet has also made the Form 990’s information even more publiclyaccessible. Since the late 1990s, Philanthropic Research, Inc., a 501(c)(3) publiccharity founded in 1994, has compiled on its Web site, GuideStar, more than 1million Form 990s filed by IRS-recognized nonprofit organizations. Likewise, theBetter Business Bureau’s Wise Giving Alliance takes information from the Form 990and financial statements and publishes it online and in print in its Wise GivingGuide. (The Wise Giving Alliance and GuideStar, which are private, non-governmentgroups, also make evaluations and ratings of charitable organizations based on theirown sometimes-controversial ratios and metrics of the financial information.)
With the click of a mouse, the financial and other supplemental information of manynonprofits is now available to most people, including sensitive salary and other data.For this reason, it is prudent for all board members to review the information filedwith federal and state agencies, and to be aware of what charitable rating groups maybe saying about their organization.
TIPS FOR BOARD MEMBERS
1. One or more board members should meet with the CFO and CEO (or auditors)to review each year’s Form 990 and to discuss the upcoming form changes andany potential impacts on the organization.
2. Board members should visit charitable rating Web sites and learn what (ifanything) is being written there about their organization. Seewww.guidestar.org and www.bbb.org.
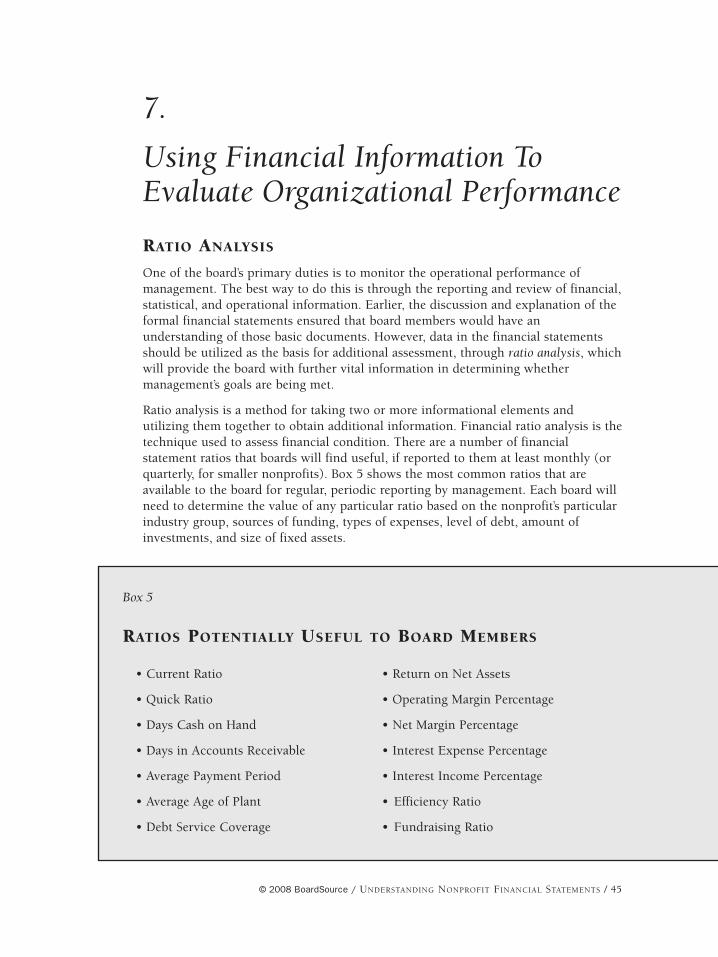
© 2008 BoardSource / UNDERSTANDING NONPROFIT FINANCIAL STATEMENTS / 45
7.
Using Financial Information ToEvaluate Organizational Performance
RATIO ANALYSIS
One of the board’s primary duties is to monitor the operational performance ofmanagement. The best way to do this is through the reporting and review of financial,statistical, and operational information. Earlier, the discussion and explanation of theformal financial statements ensured that board members would have anunderstanding of those basic documents. However, data in the financial statementsshould be utilized as the basis for additional assessment, through ratio analysis, whichwill provide the board with further vital information in determining whethermanagement’s goals are being met.
Ratio analysis is a method for taking two or more informational elements andutilizing them together to obtain additional information. Financial ratio analysis is thetechnique used to assess financial condition. There are a number of financialstatement ratios that boards will find useful, if reported to them at least monthly (orquarterly, for smaller nonprofits). Box 5 shows the most common ratios that areavailable to the board for regular, periodic reporting by management. Each board willneed to determine the value of any particular ratio based on the nonprofit’s particularindustry group, sources of funding, types of expenses, level of debt, amount ofinvestments, and size of fixed assets.
Box 5
RATIOS POTENTIALLY USEFUL TO BOARD MEMBERS
• Current Ratio
• Quick Ratio
• Days Cash on Hand
• Days in Accounts Receivable
• Average Payment Period
• Average Age of Plant
• Debt Service Coverage
• Return on Net Assets
• Operating Margin Percentage
• Net Margin Percentage
• Interest Expense Percentage
• Interest Income Percentage
• Efficiency Ratio
• Fundraising Ratio

46 / UNDERSTANDING NONPROFIT FINANCIAL STATEMENTS / © 2008 BoardSource
CURRENT RATIO
The current ratio, which computes the organization’s ability to meet its currentobligations, is one of the most commonly used in all nonprofit sectors to measureliquidity. It measures the number of dollars held in current assets as a percentage ofthe dollars owed in current liabilities. A result of 1.0 means that the organization hasexactly enough current assets (assets that are convertible to cash within a shortperiod of time, usually within one year) to pay off all of its current liabilities(liabilities that are payable within a short period of time, usually within one year).
A healthy ratio for most organizations will be in the 2.0 to 4.0 range. That level willassure any reader that the organization is financially solvent, having double toquadruple the financial means, in the near term, to pay off its short-term liabilities.
The current ratio is expressed in the following equation:
Current Assets
Current Liabilities
(For example: $22,800 / $7,500 = 3.04 current ratio)
QUICK RATIO
The quick ratio is an adjunct to the current ratio. It is also known as the asset-testratio because it measures the organization’s ability to meet short-term obligationsfrom its most liquid, or quick, assets. Quick assets are defined as cash or assetsquickly and easily convertible into cash, such as marketable securities and accountsreceivable (but not inventory or other assets that may take some time and effort toconvert to cash). Like the current ratio, a range between 2.0 and 4.0 would beconsidered healthy.
The quick ratio is expressed in the following equation:
Cash + Cash Equivalent + Accounts Receivable + Unconditional Promises To Pay
Current Liabilities
(For example: $21,900 / $7,500 = 2.92 quick ratio)
DAYS CASH ON HAND
This may be the most important of all the ratios for board members. Days cash onhand measures the number of days of average cash expenses that the organizationmaintains. The ratio can be expressed in terms of either days cash on hand in short-term sources or in all sources. Like the current ratio, a higher value will always bepreferred. The board will be able to assess the organization’s ability to meet itsfinancial obligations based on the outcomes from this ratio.
© 2008 BoardSource / UNDERSTANDING NONPROFIT FINANCIAL STATEMENTS / 47
The two ratios of days cash on hand are shown in the following equations:
1) Days Cash on Hand (Short-Term Sources) =
Cash + Short-Term Investments
(Total Expenses – Depreciation) / 365
(For example: $1,200 + $6,500 / (($61,500 – $3,200) / 365) = 48.2 days cash on hand)
2) Days Cash on Hand (All Sources) =
Cash + Short-Term Investments + All Long-Term Investments
(Total Expenses – Depreciation) / 365
(For example: $1,200 + $6,500 + $62,300 + $10,000 / (($61,500 – $3,200) / 365) = 500.8 days cash on hand)
It should be noted that cash from short-term or all sources may include cash fromtemporarily restricted sources, which is generally not available to meet currentobligations due to its restrictions. Thus, it is possible for this ratio to overstate theorganization’s ability to meet its basic operating needs. For ratio purposes, the boardmay want to exclude restricted cash from this equation.
DAYS IN ACCOUNTS RECEIVABLE
Days in accounts receivable is a critical ratio, particularly in those nonprofits thatprovide fee-based client services. It measures the average time that receivables areoutstanding, and is also known as the average collection period. Higher ratio resultslead to fewer days cash on hand and potentially to greater short-term financingrequirement. Management should always strive to keep the days in accountsreceivable ratio as low as possible. Although nonprofit organizations exist in manydifferent industries with many different processes and procedures for this ubiquitousratio, 30 days is a solid benchmark.
The days in accounts receivable ratio is expressed in the following equation:
Net Accounts Receivable
Net Service Revenues / 365
(For example: $9,200 / ($53,600 / 365) = 62.65 days in accounts receivable)
AVERAGE PAYMENT PERIOD
The average payment period ratio is the flip side of days in accounts receivable. Itmeasures the average time that elapses before the organization’s current liabilities arepaid. High values may indicate potential liquidity problems, particularly if there is alow number of days cash on hand. Low values may indicate that invoices are paidtoo quickly.

48 / UNDERSTANDING NONPROFIT FINANCIAL STATEMENTS / © 2008 BoardSource
The average payment period ratio is expressed in the following equation:
Current Liabilities
(Total Expenses – Depreciation) / 365
(For example: $7,500 / (($61,500 – $3,200) / 365) = 46.9 days average payment period)
AVERAGE AGE OF PLANT
This is a very important ratio for those nonprofit organizations that own substantialfixed assets, particularly buildings and equipment. Average age of plant measures theaverage age in years of the organization’s fixed assets. Values between 5.0 and 9.0years usually indicate a relatively young plant with all of its equipment, new and old.Each industry will have its own benchmark and these should be known and usedappropriately. The importance to a nonprofit of this ratio is that lower numbers mayindicate newer, better facilities and equipment that will typically enhance clientsatisfaction, while higher results may indicate the opposite — as well as the need tobegin planning for the financing and replacement of older fixed assets.
The average age of plant ratio is expressed in the following equation:
Accumulated Depreciation
Depreciation Expenses
(For example: $18,000 / $3,000 = 6.0 average age of plant)
DEBT SERVICE COVERAGE
The debt service coverage ratio is a key ratio used by investment managers, banks, andbond rating agencies to determine the organization’s ability to pay back its bond debt,mortgages, or other borrowings. It measures the relationship between theorganization’s bottom line cash and its annual debt service payments (principal +interest expense). A higher ratio, typically between 2.0 and 5.0, is preferred as itindicates a higher level of profitability compared to its debt obligations.
The debt service coverage ratio is expressed in the following equation:
Excess of Support and Total Revenues over Expenses + Depreciation + Interest Expense
Principal Payments + Interest Expense
(For example: ($6,400 + $3,000 + $3,200) / ($1,500 + $3,200) = 2.68 debt servicecoverage)
RETURN ON NET ASSETS
This is a profitability ratio that is used to determine the organization’s return of totalmargin compared to its unrestricted net assets, expressed as a percentage. The ratio
© 2008 BoardSource / UNDERSTANDING NONPROFIT FINANCIAL STATEMENTS / 49
measures the ability to fund additions, renovations, and new program initiativeswithout having to add new debt. The higher the result, the better.
The return on net assets ratio is expressed in the following equation:
Excess of Support and Total Revenues over Expenses
Unrestricted Net Assets
(For example: $6,400 / $32,600 = 19.6% return on net assets)
OPERATING MARGIN PERCENTAGE
Operating margin percentage is a useful ratio because it measures the organization’sbottom line (before non-operating revenues), compared to its total revenues. Thecomputed ratio allows the reader to quickly, and rather accurately, determine theextent of the organization’s profitability on its core operations. Higher values arepreferable.
The operating margin percentage ratio is expressed in the following equation:
Excess of Support and Revenues over Expenses
Total Support and Revenues
(For example: $5,200 / $66,700 = 7.8% operating margin)
NET MARGIN PERCENTAGE
Similar to the operating margin percentage ratio, the net (or total) margin percentagemeasures profitability based on all revenues, including non-operating revenues. Thistypically means investment income is included, although it is generally classified asnon-operating and is reported below the operating margin (excess of operatingrevenues over expenses). Higher margins are preferred as a result of this calculation.
The net margin percentage ratio is expressed in the following equation:
Excess of Support and Total Revenues over Expenses
Total Support and Revenues
(For example: $6,400 / $66,700 = 9.6% net margin)
INTEREST EXPENSE PERCENTAGE
The board may be interested in the rate being paid on its borrowed money,particularly if the amounts are large. The interest expense percentage ratio measures theoverall average interest rate being paid by the organization to finance its long-termdebt. It allows the board to determine whether the current rate is sustainable andcompetitive or whether refinancing should be explored.
50 / UNDERSTANDING NONPROFIT FINANCIAL STATEMENTS / © 2008 BoardSource
The interest expense percentage ratio is expressed in the following equation:
Total Interest Expense
Current and Long-Term Bond Debt
(For example: $3,200 / ($1,500 + $64,800) = 4.8% interest expense)
INTEREST INCOME PERCENTAGE
In contrast to the interest expense percentage ratio, the interest income percentagemeasures the overall average percentage earnings on all of the organization’s assetswith potential to be invested. It allows the board to quickly evaluate overallinvestment returns, which may be useful in future investment decision making.
The interest income percentage ratio is expressed in the following equation:
Total Interest Income + Dividend Income + Realized Gains on Securities
Cash + Cash Equivalent + All Long-Term Investments
(For example: $1,200 / ($1,200 + $6,500 + $62,300 + $10,000) = 1.5% interest income)
EFFICIENCY RATIO
The efficiency ratio allows directors to see how much a nonprofit is spending onoverhead and fundraising services compared to how much is being spent onprograms. A higher number is always better; charity rating groups typicallyrecommend at least 70 – 80 percent.
The efficiency ratio is expressed in the following equation:
Management and General Expenses + Fundraising Expenses
Program Service Expenses
(For example: ($10,190 + $710) / $40,600 = 26.85% efficiency ratio)
In recent years, the efficiency ratio has taken on added importance because moreoutsiders — donors, charity rating groups, and regulators — are focusing on it as aprimary indicator of whether a nonprofit is using its funds wisely and efficiently tofurther its mission — or spending too much on nonprogram activities. The board ofany nonprofit whose efficiency ratio falls below 70 percent had better discuss withmanagement and auditors the reason(s) for the low ratio. One reason, for examplecould be that expenses are not being accurately and appropriately allocated in theaudited financial statements between program activities and management and generalor fundraising.
© 2008 BoardSource / UNDERSTANDING NONPROFIT FINANCIAL STATEMENTS / 51
FUNDRAISING RATIO
Like the efficiency ratio, the fundraising ratio is being closely observed by manydonors and outside groups. The fundraising ratio’s purpose is to provide a quick, easy,and understandable view of the percentage of dollars being spent to raise a nonprofit’scontributions and grant revenue. If the percentage is high, then questions should beraised by the board about whether fundraising activities are too “inefficient” (i.e., toomuch of each donation is being spent to obtain it) — and whether the dollars raisedby the nonprofit are really being used to benefit its clientele and achieve itsprogrammatic mission. If the percentage is low, donors, outsiders, and the board maybe more assured that contributions and grants are being put to their intended use onprogram activities. Analysis should always be ongoing. It should be noted that in2002 the IRS started to send out “educational” letters to those nonprofit organizationsthat had contribution revenue but little or no (or proportionately low) fundraisingexpenses. These letters said for the nonprofit organization should give this areaanother look while the IRS would continue to monitor this in the future.
The fundraising ratio is expressed in the following equation:
Fundraising Expenses
Contribution Revenue + Grant Revenue
(For example: $710 / ($9,000 + $3,400) = 5.73% fundraising ratio)
A nonprofit fundraising ratio that exceeds 20 – 30 percent should alert the board thatit needs to discuss the reasons for this with management and auditors — and beprepared to explain publicly the reasons for a high ratio.11
Interestingly, while these ratios have value in the determining some financial andoperational outcomes, a Wall Street Journal article, published in 2007, points out thatdonors, “especially younger, business-minded ones, now tend to want moreinformation on how successful a charity’s programs are in addressing the issues thecharity sets out to resolve, from feeding the homeless to securing employment for thedisabled... The problem is, it can be difficult — and expensive — to measure whethercharitable programs are actually working, and most nonprofits aren’t willing to devotescarce resources to collecting such information.”12
Thus, the article concludes with several very useful suggestions for potential donorsto nonprofit organizations, as follows: “It’s also smart to see if the charity’s progresshas ever been evaluated by a third party, rather than just the charity itself. Check thecharity’s Web site or annual report for specific details on how it gauges its results. Ifthe information isn’t there, call the charity and ask. Be wary about giving, however, ifa charity doesn’t answer your questions or provide annual reports or other filings.
11. There may, in fact, be many legitimate reasons for a high fundraising ratio. For example, a newlyfounded nonprofit may need to spend proportionately more than other established groups to raisedonations and grants in its early years, and this may result in a high ratio in the first years of itsoperation. In any case, the board should be prepared to justify and explain a high ratio to any inquirers.
12. “Doing Due Diligence on Your Donations,” Rachel Emma Silverman and Sally Beatty, Wall StreetJournal, 12/20/07, page D1. Reprinted by permission of Wall Street Journal ©2007 Dow Jones &Company, Inc. All rights reserved Worldwide. License number #1874800753127.
52 / UNDERSTANDING NONPROFIT FINANCIAL STATEMENTS / © 2008 BoardSource
Another way to learn about a charity: Volunteer with the group, or visit a site to getto know staffers, clients and facilities.”
Nonprofit boards and their senior management need to be aware of these tips that arebeing given to potential donors and make sure that their books and records are ableto support these types of donor information requests.
TIPS FOR BOARD MEMBERS
The ratios described above are the basic ones that may be of use to a nonprofit boardand which it should expect to see on a regular basis from management. Over time,board members will be able to determine which are the most important to them —because they provide critical and substantial information about the organization’soperations and its ability to further its mission — and what additional ratio analysismight be useful. Conversations with management and auditors to determine theappropriate metrics are more than worth the time they take for board members.

© 2008 BoardSource / UNDERSTANDING NONPROFIT FINANCIAL STATEMENTS / 53
8.
Advanced Methods of MeasuringOrganizational PerformanceIn earlier chapters, some advanced analysis techniques were referenced, such astrending and benchmarks, particularly with respect to ratios. This chapter will definethose concepts in more detail, show how they can enhance statistical and ratioanalysis, and then discuss the balanced scorecard, an analysis technique that integratesfinancial information with other types of analysis to help board members determinein a more comprehensive way if management is moving toward achieving its goalsand if progress is being made in furthering the organization’s mission.
TRENDING
Trending refers to the display and analysis of data or information across time. Withouttrending, board members will only have a snapshot at one particular moment of anorganization’s financial and other data. The use of trending greatly enhances theboard’s understanding of the directions in which an organization is heading.
Take, for example, one of the important financial ratios identified in Chapter 7, dayscash on hand (all sources). A good interim financial report would include this ratioand directors would be able to observe as in Exhibit 8 that the 2007 days cash onhand (all sources) was 499.15 days. This ratio indicates to the board that theorganization is in a strong position to meet its financial obligations.
But is this the entire story? A better interim financial report would also include ratiosfrom prior years and a narrative explanation, to enable the board to observe andunderstand the direction and trend of cash on hand. From Exhibit 8, for example, aboard could quickly grasp any trends that may be relevant over the past five years —for example, although cash on hand is an excellent ratio today, is this a decline fromprior years? Does that indicate a trend that the board needs to be concerned about?An accompanying narrative would address any trends and explain unusual data, suchas the substantial increase in cash in 2005 in Exhibit 8.
Trending is often more easily understood in well-designed graphs, charts, and tablesthan in raw numbers or narrative explanations. Board members should askmanagement to provide graphs and charts routinely to illustrate the essentialelements of financial performance.
BENCHMARKS
Benchmarking is another useful management technique. It requires an organization tocompare its ratios, trends, and analysis, both financial and nonfinancial, with those ofits peers. Benchmarking enables a board to determine whether a nonprofit isoperating and performing at a level that comports with similar organizations.
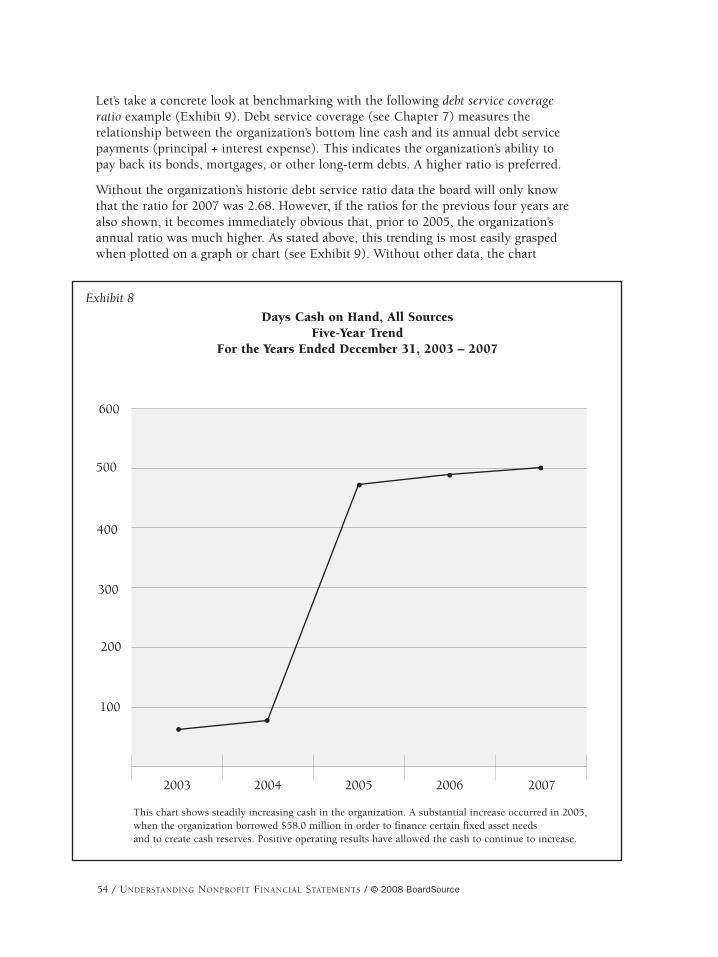
54 / UNDERSTANDING NONPROFIT FINANCIAL STATEMENTS / © 2008 BoardSource
Let’s take a concrete look at benchmarking with the following debt service coverageratio example (Exhibit 9). Debt service coverage (see Chapter 7) measures therelationship between the organization’s bottom line cash and its annual debt servicepayments (principal + interest expense). This indicates the organization’s ability topay back its bonds, mortgages, or other long-term debts. A higher ratio is preferred.
Without the organization’s historic debt service ratio data the board will only knowthat the ratio for 2007 was 2.68. However, if the ratios for the previous four years arealso shown, it becomes immediately obvious that, prior to 2005, the organization’sannual ratio was much higher. As stated above, this trending is most easily graspedwhen plotted on a graph or chart (see Exhibit 9). Without other data, the chart
2003 2004 2005 2006 2007
100
200
300
400
500
600
Days Cash on Hand, All SourcesFive-Year Trend
For the Years Ended December 31, 2003 – 2007
This chart shows steadily increasing cash in the organization. A substantial increase occurred in 2005,when the organization borrowed $58.0 million in order to finance certain fixed asset needs and to create cash reserves. Positive operating results have allowed the cash to continue to increase.
Exhibit 8

© 2008 BoardSource / UNDERSTANDING NONPROFIT FINANCIAL STATEMENTS / 55
indicates a significant decline in the debt service coverage ratio and therefore areduced ability to borrow additional funds in the future.
But is this the whole story? Not necessarily. For example, perhaps the ratios of theearlier years were much higher than other organizations in the group’s nonprofitsector. Or higher than that considered acceptable or optimal by lenders or bond-rating agencies. To learn that important information, it is necessary to additionallyplot the average (or possibly median) of the debt service ratios of a group oforganizations in the nonprofit’s sector that perform similar functions (and which havealso borrowed funds), as shown in Exhibit 9.
2003 2004 2005 2006 2007
2.0
4.0
6.0
8.0
10.0
12.0
Debt Service CoverageFive-Year Trend
For the Years Ended December 31, 2003 – 2007
This chart shows a substantial decrease in debt service coverage occurred in 2005, when theorganization borrowed $58.0 million. This increased the prior outstanding debt balance from $10.0million to $68.0 million. Subsequently, the organization had a lower debt service coverage ratio. This indicates that the organization has less opportunity to finance additional borrowings in the near future, particularly since its ratio is considerably lower than the benchmark median for similar“A” rated nonprofit organizations.
“A” rated nonprofit median
Actual debt service coverage ratio
Exhibit 9

56 / UNDERSTANDING NONPROFIT FINANCIAL STATEMENTS / © 2008 BoardSource
With the addition of the second plot, the board is able to see significant variancesbetween its nonprofit’s ratio and those of other, similarly situated organizations.Exhibit 9 shows that, while there was a precipitous drop of the debt service ratio in2005, it is not as significant or threatening when compared with the average ratios ofother organizations. Still, the chart indicates a variance and shows the board the valueits nonprofit needs to strive for. Exhibit 9 can provide valuable information for theboard, management, lenders, and bond-rating agencies. And benchmarking chartslike Exhibit 9 for other important ratios can likewise provide essential additionalanalysis of other elements of the financial statements.
BALANCED SCORECARD
There is an additional management tool that enables the board to gain an even betterunderstanding of the organization’s operations as a whole — the balanced scorecard.Balanced scorecards have gained acceptance over the past decade for their ability topaint a relatively complete picture of organizational performance. Scorecards take intoaccount the key financial elements, as described in chapters above, as well as otherkey elements that drive the outcomes mandated by the board. The exhibits in thissection show one of the many ways to present this information.
The scorecard is simply a means by which the organization can keep track of itsoutcomes as compared to its goals. It “provides executives with a comprehensiveframework that translates a company’s vision and strategy into a coherent set ofperformance measures” that can be communicated to the various stakeholders in thenonprofit.13 Furthermore, “the balanced scorecard retains financial measurement as acritical summary of managerial and business performance, but it highlights a moregeneral and integrated set of measurements that link customer, internal process,employee, and system performance to long-term financial success.”14
The balanced scorecard utilizes four different quadrants of performance measures tocreate a natural and continuous feedback loop that can then be used to monitor andimprove the organization’s level of effectiveness. The four quadrants are
• Financial Perspective
• Customer Perspective
• Internal Perspective
• Learning and Growth
An organization may use different performance measures within each of the fourgroupings. Box 6 lists some of the more common considerations that are utilized foreach quadrant. Once again, keep in mind that each organization must use those itemsthat represent its own particular and unique critical success factors.
13. The Balanced Scorecard, Kaplan and Norton, Harvard Business School Press, 1996, page 24.
14. Ibid., page 21.

© 2008 BoardSource / UNDERSTANDING NONPROFIT FINANCIAL STATEMENTS / 57
Initially, it may appear that balanced scorecards are only useful for larger nonprofits,or for those nonprofits that have major competitors, both for-profit and nonprofit.However, that is not the case. All nonprofits can benefit from the disciplined reviewrequired by the balanced scorecard of the mission, goals, and strategies of thenonprofit.
HOW TO DEVELOP A SCORECARD
There are several ways to develop a balanced scorecard, including
• Developing an executable organizational “business” strategy by outlining theimportant elements that will make the nonprofit successful.
• Describing the strategy for users and employees to enhance their understandingand encourage their buy-in.
• Designing and developing the scorecard framework with objectives andperformance measurements that closely follow the strategic objectives outlinedby the organization.
A scorecard does not stand alone as an unrelated set of metrics. Instead, it integratesthe financial and nonfinancial goals and establishes a monitoring system to ensure theorganization’s desired outcomes are achieved.
Box 6
BALANCED SCORECARD QUADRANTS
FINANCIAL PERSPECTIVE
• Return on Capital
• Competitive Position
• Volume Growth
• Reduced Cash Outlays
• Improved Cash Receipts
CUSTOMER PERSPECTIVE
• Customer Satisfaction
• Employee Satisfaction
• Funder Satisfaction
INTERNAL PERSPECTIVE
• Product Innovation
• Perfect Orders (reduce errors)
LEARNING AND GROWTH
• Strategic Awareness
• Mandated Hours of Education perEmployee
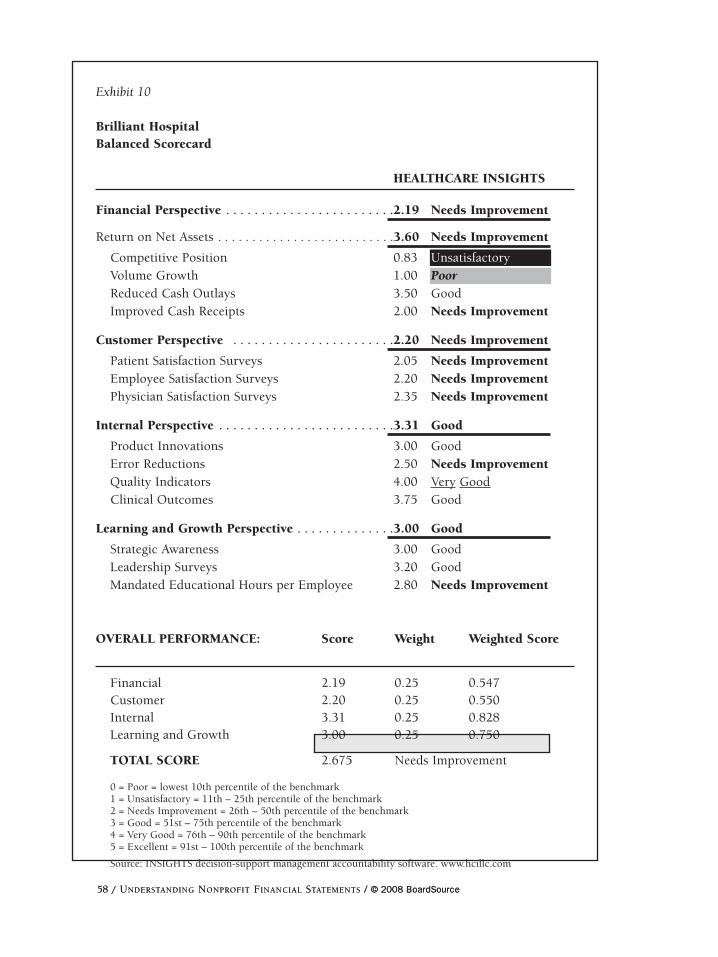
58 / UNDERSTANDING NONPROFIT FINANCIAL STATEMENTS / © 2008 BoardSource 58 / UNDERSTANDING NONPROFIT FINANCIAL STATEMENTS / © 2008 BoardSource
Exhibit 10
Brilliant Hospital Balanced Scorecard
HEALTHCARE INSIGHTS
Financial Perspective . . . . . . . . . . . . . . . . . . . . . . . .2.19 Needs Improvement
Return on Net Assets . . . . . . . . . . . . . . . . . . . . . . . . . .3.60 Needs Improvement
Competitive Position 0.83 UnsatisfactoryVolume Growth 1.00 PoorReduced Cash Outlays 3.50 GoodImproved Cash Receipts 2.00 Needs Improvement
Customer Perspective . . . . . . . . . . . . . . . . . . . . . . .2.20 Needs Improvement
Patient Satisfaction Surveys 2.05 Needs ImprovementEmployee Satisfaction Surveys 2.20 Needs ImprovementPhysician Satisfaction Surveys 2.35 Needs Improvement
Internal Perspective . . . . . . . . . . . . . . . . . . . . . . . . .3.31 Good
Product Innovations 3.00 GoodError Reductions 2.50 Needs ImprovementQuality Indicators 4.00 Very GoodClinical Outcomes 3.75 Good
Learning and Growth Perspective . . . . . . . . . . . . . .3.00 Good
Strategic Awareness 3.00 GoodLeadership Surveys 3.20 GoodMandated Educational Hours per Employee 2.80 Needs Improvement
OVERALL PERFORMANCE: Score Weight Weighted Score
Financial 2.19 0.25 0.547 Customer 2.20 0.25 0.550 Internal 3.31 0.25 0.828 Learning and Growth 3.00 0.25 0.750
TOTAL SCORE 2.675 Needs Improvement
0 = Poor = lowest 10th percentile of the benchmark1 = Unsatisfactory = 11th – 25th percentile of the benchmark2 = Needs Improvement = 26th – 50th percentile of the benchmark3 = Good = 51st – 75th percentile of the benchmark4 = Very Good = 76th – 90th percentile of the benchmark5 = Excellent = 91st – 100th percentile of the benchmark
Source: INSIGHTS decision-support management accountability software. www.hcillc.com

© 2008 BoardSource / UNDERSTANDING NONPROFIT FINANCIAL STATEMENTS / 59© 2008 BoardSource / UNDERSTANDING NONPROFIT FINANCIAL STATEMENTS / 59
BALANCED SCORECARD IN NONPROFIT ORGANIZATIONS
Any nonprofit organization, regardless of what sector it is in, can benefit fromutilizing the balanced scorecard. Exhibit 10 illustrates some of the specific elementsthat could and should be used in the measure of performance, for example, for anonprofit hospital.
As can be observed in Exhibit 10, the factors considered go well beyond financialindicators, thereby allowing users to gain a more complete insight into the goals,achievements, and shortcomings of the organization. Financial and nonfinancialconsiderations are both critical in evaluating this nonprofit hospital, so it is crucialthat the hospital sets goals for all, not just financial outcomes. (In fact, excelling inthe nonfinancial elements is likely to buttress and enhance financial success.)
Further, the scorecard is only half completed when the organization describes itsgoals and measures performance against them. Exhibit 11, shows the organization’sscorecard as compared to quadrant goals and measurements of other peerorganizations, as indicated in the last column (with proprietary data from abenchmark service). It is important to obtain such data so the board can learn how itsorganization and management are performing relative to their peers. The futuresuccess of its nonprofit may well be based on the results of this peer analysis.
BALANCING THE SCORECARD
It will probably occur to the reader that not all quadrants and metrics will be equalfor every organization. To some nonprofits, for example, the customer perspectivemay be more important to its mission and ultimate result than the internalperspective, and vice versa. Therefore, it is important for each organization to“balance” its scorecard by weighting the value of its own unique metrics. Through theprocess of balancing of the scorecard, an organization can determine and value itsmost important success criteria in an objective manner.
For most organizations, the scorecard will generally have a relative equal weight forthe four quadrants, with no one quadrant having a disproportionate share of the totalallocated to it. A balanced approach might be 30 percent each to financial andinternal process and 20 percent each to customer perspective and learning andgrowth. On the other hand, an unbalanced scorecard might allocate 70 percent of thetotal to the financial quadrant, leaving only 30 percent for the other three. While thisallocation may have a short-term benefit, in the long term it could have a deleteriousimpact on the organization’s outcomes, financial and nonfinancial.
The balanced scorecard is an exceptional technique for enabling boards to promoteexcellence in management and achievement of its mission and goals.
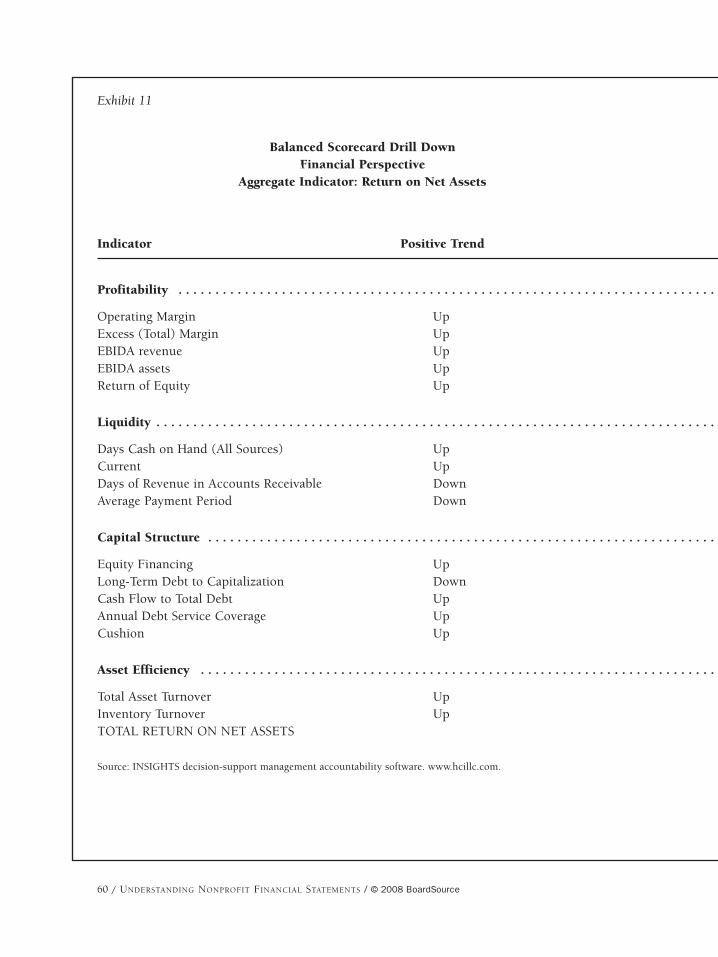
60 / UNDERSTANDING NONPROFIT FINANCIAL STATEMENTS / © 2008 BoardSource
Balanced Scorecard Drill DownFinancial Perspective
Aggregate Indicator: Return on Net Assets
Exhibit 11
Balanced Scorecard Drill DownFinancial PerspectiveAggregate Indicator: Return on Net Assets
Indicator Positive Trend
Profitability . . . . . . . . . . . . . . . . . . . . . . . . . . . . . . . . . . . . . . . . . . . . . . . . . . . . . . . . . . . . . . . . . . . . . . . . . . . . . . . . . . . . . . . . . . . . . . . . . . . . . . . . . . . . . . . . . . . . . . . . . . . . . . . . . . . . . . . . . . .G
Operating Margin Up Excess (Total) Margin Up EBIDA revenue Up EBIDA assets Up Return of Equity Up
Liquidity . . . . . . . . . . . . . . . . . . . . . . . . . . . . . . . . . . . . . . . . . . . . . . . . . . . . . . . . . . . . . . . . . . . . . . . . . . . . . . . . . . . . . . . . . . . . . . . . . . . . . . . . . . . . . . . . . . . . . . . . . . . . . . . . . . . . . . . . . . . . . .P
Days Cash on Hand (All Sources) Up Current Up Days of Revenue in Accounts Receivable Down Average Payment Period Down
Capital Structure . . . . . . . . . . . . . . . . . . . . . . . . . . . . . . . . . . . . . . . . . . . . . . . . . . . . . . . . . . . . . . . . . . . . . . . . . . . . . . . . . . . . . . . . . . . . . . . . . . . . . . . . . . . . . . . . . . . . . . . . . . . . . . . . . . . . . . .P
Equity Financing Up Long-Term Debt to Capitalization Down Cash Flow to Total Debt Up Annual Debt Service Coverage Up Cushion Up
Asset Efficiency . . . . . . . . . . . . . . . . . . . . . . . . . . . . . . . . . . . . . . . . . . . . . . . . . . . . . . . . . . . . . . . . . . . . . . . . . . . . . . . . . . . . . . . . . . . . . . . . . . . . . . . . . . . . . . . . . . . . . . . . . . . . . . . . . . . . . . . .G
Total Asset Turnover Up Inventory Turnover Up TOTAL RETURN ON NET ASSETS
Source: INSIGHTS decision-support management accountability software. www.hcillc.com.

© 2008 BoardSource / UNDERSTANDING NONPROFIT FINANCIAL STATEMENTS / 61
H E A L T H C A R E I N S I G H T S
PRIOR YEAR CURRENT YEAR
Month Year-to-Date Month Year-to-Date Comparison to Benchmark
. . . . . . . . . . . . . . . . . . . . . . . . . . . . . . . . . . . . . . . . . . . . . . . . . . . . . . . . . . . . . . . . . .Good
0.04 0.05 0.04 0.05 Very Good 0.07 0.08 0.11 0.13 EXCELLENT 0.18 0.16 0.17 0.16 Good 0.08 0.07 0.12 0.11 Good 0.09 0.07 0.09 0.08 Good
. . . . . . . . . . . . . . . . . . . . . . . . . . . . . . . . . . . . . . . . . . . . . . . . . . . . . . . . . . . . . . . . . .Poor
224.00 227.00 234.00 240.00 EXCELLENT 1.1 1.1 1.2 1.2 Poor
82.00 91.00 85.00 86.00 Poor 110.00 112.00 105.00 107.00 Unsatisfactory
. . . . . . . . . . . . . . . . . . . . . . . . . . . . . . . . . . . . . . . . . . . . . . . . . . . . . . . . . . . . . . . . . .Poor
0.15 0.14 0.15 0.14 Poor 0.72 0.72 0.71 0.72 Needs Improvement
0.04 0.03 0.04 0.03 Poor 2.04 2.10 2.10 2.00 Poor
9.40 9.20 9.50 9.60 Good
. . . . . . . . . . . . . . . . . . . . . . . . . . . . . . . . . . . . . . . . . . . . . . . . . . . . . . . . . . . . . . . . . .Good
1.28 1.18 1.26 1.25 Very Good 14 15 15 16 Good
Needs Improvement

62 / UNDERSTANDING NONPROFIT FINANCIAL STATEMENTS / © 2008 BoardSource
TIPS FOR BOARD MEMBERS
1. Determine what financial ratios are most pertinent and useful for the board andask management to provide them in the interim (monthly or quarterly)financial report for the board’s review. Request that it be presented to show anyvariances between actual and budgeted ratios and, where appropriate, betweenthe nonprofit’s ratios and those of its peers or sector.
2. Develop with management a balanced scorecard, and request that it be updatedand presented to the board at appropriate times (monthly, quarterly, or semi-annually).15 The balanced scorecard will include all of the vital operationalelements that were previously agreed upon, and the comparison of these goalswith actual results. Thus, the balanced scorecard provides the best summary ofcompliance (or noncompliance) with the board’s approved financial andnonfinancial goals.
15. The board of an organization experiencing a number of troublesome areas may want to request thescorecard more, rather than less, frequently.
© 2008 BoardSource / UNDERSTANDING NONPROFIT FINANCIAL STATEMENTS / 63
ConclusionTo most board members, fulfilling their fiduciary responsibilities in the financial areais the most difficult task they encounter as a director. It is our hope that this bookhas helped to make this a less daunting duty.
At the beginning, it was the stated goal of this book to give board members the abilityto understand the basic financial documents that they will encounter — and to knowwhat types of documents and information to request from the nonprofit’s managers.Along the way, we have also provided advice on how to use that information tomeasure a nonprofit’s progress toward meeting its mission and goals, in both financialand nonfinancial areas. A board that takes that guidance to heart and puts thoserecommendations into practice will have gone a long way toward meeting its mostimportant fiduciary responsibilities.
Understanding Nonprofit Financial Statements has provided the basic financial buildingblocks. Now it’s up to you to use them!
64 / UNDERSTANDING NONPROFIT FINANCIAL STATEMENTS / © 2008 BoardSource
Appendix 1
SUPPLEMENTAL AUDITOR REPORTS
Nonprofit board members should be aware of two other reports that may be includedin the auditor’s annual report. These reports are intended to provide, when necessary,additional information to board members, allowing for greater understanding ofmanagement’s performance in utilizing accounting principles and practices. Thesereports — (1) SAS 114 letter, and (2) Reports Required in Accordance with Office ofManagement and Budget Circular A-133 — are described below. Additionally, othersupplemental information that may also be necessary is outlined.
SAS 114 LETTER
The American Institute of Certified Public Accountants’ Statement on AuditingStandards No. 114 (SAS 114) — The Auditor’s Communication with Those Chargedwith Governance requires communication of certain matters to the audit committee,or its equivalent, on an annual basis. The report, usually referred to as a managementletter, is intended solely for the use of the board of directors and management. It ismeant to highlight issues and concerns observed by the auditors that they wish tocommunicate to the board. Although there are more and more requests fromoutsiders who wish to see this report, the organization is the final authority onwhether it chooses to release it. That decision will usually be governed in evaluatingwho is making the request.
Statement of Auditing Standards No. 114, The Auditor’s Communication with ThoseCharged with Governance
Issue Date: December 19, 2006
Effective Date: This SAS is effective for periods beginning on or after December 15,2006. Early application is permitted.
Executive Summary
Statement on Auditing Standards (SAS) No. 114 supersedes SAS No. 61,Communication with Audit Committees, as amended. This SAS establishes standardsand provides guidance to an auditor on matters to be communicated with thosecharged with governance.
In the wake of well-publicized audit failures and emerging best practices in corporategovernance, expectations have increased for auditors to communicate openly andcandidly with those charged with governance regarding significant findings and issuesrelated to the audit. The Auditing Standards Board (ASB) believes SAS is responsive tothe issues and expectations in the U.S. nonissuer community and will improve auditpractice and serve the public interest.
In developing this SAS, the ASB considered the communication requirements of theProposed International Standard on Auditing 260 (Revised), The Auditor’s
© 2008 BoardSource / UNDERSTANDING NONPROFIT FINANCIAL STATEMENTS / 65
Communication with Those Charged with Governance, which was issued by theInternational Auditing and Assurance Standards Board in March 2005.
SAS No. 61 established communication requirements applicable to entities that eitherhave an audit committee or that have otherwise formally designated oversight of thefinancial reporting process to a group equivalent to an audit committee. SAS No. 114broadens the applicability of the SAS to audits of the financial statements of allnonissuers and establishes a requirement for the auditor to communicate with thosecharged with governance certain significant matters related to the audit.
The SAS uses the term those charged with governance to refer to those withresponsibility for overseeing the strategic direction of the entity and obligationsrelated to the accountability of the entity, including overseeing the entity’s financialreporting process. It uses the term management to refer to those who are responsiblefor achieving the objectives of the enterprise and who have the authority to establishpolicies and make decisions by which those objectives are to be pursued.Management is responsible for the entity’s financial statements.
The SAS identifies specific matters to be communicated, many of which are generallyconsistent with the requirements in SAS No. 61. However, the SAS includes certainadditional matters to be communicated and provides additional guidance on thecommunication process.
In particular, the SAS:
• Describes the principal purposes of communication with those charged withgovernance and stresses the importance of effective two-way communication.
• Requires the auditor to determine the appropriate person(s) in the entity’sgovernance structure with whom to communicate particular matters. That personmay vary depending on the nature of the matter to be communicated.
• Recognizes the diversity in governance structures among entities (including theexistence of audit committees or other subgroups charged with governance) andencourages the use of professional judgment in deciding with whom tocommunicate particular matters.
• Recognizes the unique considerations for communicating with those chargedwith governance when all of those charged with governance are involved inmanaging the entity, which may be the case with some small entities.
• Adds requirements to communicate
- An overview of the planned scope and timing of the audit.
- Representations the auditor is requesting from management.
• Provides additional guidance on the communication process, including the formsand timing of communication. Significant findings from the audit should be inwriting when, in the auditor’s professional judgment, oral communication wouldnot be adequate. Other communications may be oral or in writing,
66 / UNDERSTANDING NONPROFIT FINANCIAL STATEMENTS / © 2008 BoardSource
• Requires the auditor to evaluate the adequacy of the two-way communicationbetween the auditor and those charged with governance.
• Establishes a requirement to document required communications with thosecharged with governance.
REPORTS REQUIRED IN ACCORDANCE WITH OFFICE OF MANAGEMENT AND
BUDGET CIRCULAR A-133
If the organization receives federal funding over a certain threshold amount, it may besubject to an Office of Management and Budget (OMB) audit. This audit requiresadditional reporting as part of the financial reports to the audit committee or theboard, including
• Independent Auditor’s Report on Compliance and on Internal Control overFinancial Reporting Based on an Audit of Financial Statements Performed inAccordance with Government Auditing Standards
• Independent Auditor’s Report on Compliance with Requirements Applicable toEach Major Program and Internal Control over Compliance in Accordance withOMB Circular A-133
• Schedule of Expenditures of Federal Awards
• Notes to Schedule of Expenditures of Federal Awards
• Schedule of Findings and Questioned Costs
OTHER SUPPLEMENTAL INFORMATION
Management, the audit committee, or the board may request that other informationor reports be included as part of the reports issued by the auditors. The supplementalinformation or reports are presented for purposes of additional analysis and are not arequired part of the basic financial statements. Such information is often subject tothe auditing procedures applied in the audit of the basic financial statements and theauditors will often state their opinion as to whether this information is fairly stated inall material respects in relation to the basic financial statements taken as a whole.
Examples of some commonly included supplemental reports and information are
• Consolidating statements
• Investment statistics
• Grant and contract summaries
© 2008 BoardSource / UNDERSTANDING NONPROFIT FINANCIAL STATEMENTS / 67
TIPS FOR BOARD MEMBERS
1. The audit committee or board should ask the auditors if an SAS 114management letter is necessary or required at the conclusion of every audit. If so, a copy should be provided to them.
2. If a management letter is issued by the auditor, the board should ensure thatmanagement has provided action plans to correct any of the issues discussed inthe letter. The action plans should be included in the auditor’s report andshould include timetables for completions. Finally, the board should scheduletime on the agenda of each meeting throughout the upcoming year to reviewthe level of completion of each item in the action plan.
68 / UNDERSTANDING NONPROFIT FINANCIAL STATEMENTS / © 2008 BoardSource
Appendix 2: Contents of the CD-ROM
The attached CD-ROM contains the electronic form of Presenting: NonprofitFinancials: An Overview of Board Fiduciary Responsibility, by Thomas A.McLaughlin. The tools on this CD-ROM are published by BoardSource and can beused as is or, in some cases, customized for your organization’s needs. The purpose ofthis presentation is to familiarize board members — experienced and novice — withthe financial information they need. Included in this presentation are definitions, jobdescriptions, and sample financial documents that will give board members anoverview of the lines of responsibility within the organization and an understandingof how to assess a nonprofit’s financial health.
The files on this CD-ROM are in four formats:
• Microsoft® PowerPoint® graphics presentation format (.ppt)
• Microsoft Word for Windows and Macintosh, version 6.0 (.doc)
• plain text format (.txt)
• Adobe PDF format, version 4.0 (.pdf)
The documents for each format are contained in the appropriately-namedsubdirectory.
The CD-ROM is the copyright of BoardSource and is protected under federalcopyright law. Any unlawful duplication of this CD-ROM is in violation of thatcopyright. Before customizing Microsoft Word or text documents, save a backup copyon your hard drive, and work from the copy on your hard drive.
Contents
Microsoft® PowerPoint® graphics presentation files
• Presenting: Nonprofit Financials presentation with talking points
Word files
• Presenting: Nonprofit Financials presentation text
• Talking points
Generic text files
• Presenting: Nonprofit Financials presentation text
• Talking points
Adobe PDF file
• Sample financial documents

© 2008 BoardSource / UNDERSTANDING NONPROFIT FINANCIAL STATEMENTS / 69
The slides are in Microsoft® PowerPoint® graphics presentation format that can beused as an on-screen presentation or printed as overhead transparency slides orhandouts for the board. The CD-ROM also contains additional generic text files withthe same information that appears on the slides and in the presentation notes andtalking points. Use some or all of the sections depending on how they apply to yournonprofit.
We hope you enjoy the flexibility and customization capabilities of electronic text. If you have any questions regarding the files on this CD-ROM, call BoardSource at800-883-6262.
BoardSourceSuite 9001828 L Street, NWWashington, DC 20036-5104202-452-6262Fax 202-452-6299

70 / UNDERSTANDING NONPROFIT FINANCIAL STATEMENTS / © 2008 BoardSource
Glossary
Accounts payable — the amount of money known to be owed (i.e., unpaid invoicesthat have been recorded) to vendors and suppliers that have provided goods orservices to an organization.
Accounts receivable— money owed to a nonprofit for services rendered or goodsprovided on credit.
Accrual accounting — a method of accounting that recognizes economic eventsregardless of when cash transactions occur. Economic events are recognized bymatching revenues to expenses at the time when the transaction occurs rather thanwhen payment is made or received. Accrual accounting is generally required becauseit shows a more reasonable expression of the true state of an organization’s financialposition than does the Cash method of accounting.
Accrued liabilities — the amount estimated to be owed (i.e., invoices that have notyet been received and recorded) to vendors and suppliers that have provided goods orservices to the organization.
AICPA — American Institute of Certified Public Accountants, the professionalassociation of the accounting industry.
Assets — everything of value that an organization owns. It can include both tangibleand intangible property, such as cash, stock, inventories, real estate, furniture andequipment, property rights, accounts receivable, or goodwill.
Audit — an examination of records and financial accounts to determine theiraccuracy and produce financial statements that fairly reflect the true financial statusof an organization.
Auditor — the person, usually a Certified Public Accountant, conducting anindependent audit for an organization.
Average payment period ratio — measures the average time that elapses before theorganization’s current liabilities are paid.
Bad debts — accounts receivable that are uncollectible or of doubtful collection.
Bad-debt expense — a statement of activities account that includes credit sales thatare uncollectible.
Balance Sheet — see Statement of Financial Position.
Balanced scorecard — an integrated set of measurements assisting an organizationin keeping track of its outcomes as compared to its goals. It utilizes four performancemeasures — financial perspective, customer perspective, internal perspective, andlearning and growth — to help monitor and improve an organization’s level ofeffectiveness.
Benchmarking — compares ratios, trends, and analyses (both financial andnonfinancial) of a nonprofit with those of its peers, and measures an organization’sresults against its best-performing peers.

© 2008 BoardSource / UNDERSTANDING NONPROFIT FINANCIAL STATEMENTS / 71
Bond — a certificate of debt issued by a government or corporation to raise moneyfor an organization.
Budget — a detailed annual financial plan that anticipates and projects both revenuesand expenses of an organization.
Capital expenditures — funds that are used to acquire long-term assets, such asbuildings, land, equipment, etc.
Capitalization — converting an expense into an asset; it spreads the cost of an assetover the length of time of its usefulness. Capitalization of a fixed asset converts anexpenditure into a fixed asset, based on the dollar value and useful life of the asset.
Cash — assets in the form of currency, or cash equivalents that can be easily andquickly converted into currency.
Cash method of accounting — a method of accounting that records revenues whenthey are received instead of earned, and expenses when they are disbursed instead ofincurred. Revenues are not matched with expenses.
Cash/current — generally includes cash in bank accounts, cash equivalents(anything easily convertible to cash within one day, such as money market accounts),and certificates of deposit (if less than 365 days to maturity).
Cash/noncurrent — generally includes cash designated for capital replacement andacquisition that is invested in longer-term assets (such as Treasury bills or bonds) andtrustees’ investments (cash set aside from bond proceeds to be used in capitalprojects), with maturity expected to be greater than 365 days.
Contribution — a gift or an unconditional, nonreciprocal transfer of assets to anonprofit. Contributions may be in the form of cash, stock, bonds, art, property, orany other tangible asset that has value; qualified nonprofit 501(c)(3) organizationsmay accept contributions from individuals, other nonprofits, or for-profitcorporations, for which the donor may take a tax deduction.
Current ratio — measures an organization’s liquidity, or how readily the organizationis able to pay off all its current liabilities.
Days cash on hand ratio — measures the number of days of average cash expensesthat the organization maintains. The ratio can be expressed in terms of either dayscash on hand in short-term sources or in all sources.
Days in accounts receivable ratio — measures the average time that accountsreceivable are outstanding (also known as the average collection period).
Debt service coverage ratio — measures the ability of an organization to pay backits long-term debt by comparing its bottom line cash with its annual debt servicepayments (principal + interest expense).
Depreciation — the process of allocating (amortizing) the original cost or fair marketvalue of a long-term tangible asset over its estimated useful life.

72 / UNDERSTANDING NONPROFIT FINANCIAL STATEMENTS / © 2008 BoardSource
Depreciation expense — an expense deduction on the statement of activities arrivedat by allocating (amortizing) a defined part of a long-term asset over its estimateduseful life.
Disclaimed opinion letter — see Opinion letter.
Efficiency ratio — measures the proportion that a nonprofit is spending on programsto achieve its mission by comparing spending on management and general plusfundraising, to its spending on programs.
Expenses — the resources expended to run the operations and programs of anorganization.
Fixed assets — tangible property with a long-term useful life, such as land, landimprovements, buildings, building equipment, movable equipment, furniture,leasehold improvements, or capitalized leases.
Footnotes (also referred to as notes) to financial statements — addenda to thefinancial statements. Some are required by GAAP, such as the first footnote on allfinancial statements, which is a summary of significant accounting policies used inthe creation of a nonprofit’s accounting books and records. Additional notes may beused to describe the nonprofit’s programs, investments and investment policies,affiliated organization investments, property and equipment, lease commitments,contingent liabilities, long-term debts and leases, joint cost allocations, related partytransactions, pension plans, temporarily and permanently restricted assets, and anysignificant subsequent events.
Form 990 — the informational tax form that must be filed annually with the IRS bymost nonprofit organizations that have applied for tax exemption and have beenapproved by the IRS under Section 501(c)(3). It is a public document, available forinspection.
Fundraising expenditures — expenses incurred in the solicitation of contributionsand grants from individuals, foundations, government agencies, and others.
Fundraising ratio — measures the efficiency of a nonprofit’s fundraising programs bycomparing the amount spent on fundraising to how much it receives in contributionand grant revenue.
Generally accepted accounting principles (GAAP) — a basic set of principles,standards, and procedures prescribed by the American Institute of Certified PublicAccountants that attempt to achieve uniformity in the way that nonprofits displaytheir finances. They are a combination of authoritative rules and generally acceptedways of reporting and recording financial information.
Generally accepted auditing standards (GAAS) — the rules that CPA auditorsmust follow when performing an independent audit.
Grant — an award or contract received by a nonprofit from a foundation, anothernonprofit, a corporation, government, or other entity.
Income Statement — see Statement of Activities below.
© 2008 BoardSource / UNDERSTANDING NONPROFIT FINANCIAL STATEMENTS / 73
Interest expense ratio — measures the overall average percentage interest rate beingpaid by the organization to finance its debt.
Interest income ratio — measures the overall average percentage earnings on all ofthe organization’s assets that have the potential to be invested.
Liabilities — everything an organization owes, the sum of its debts and obligations.Current liabilities are those that are due to be paid within 365 days. Long-termliabilities have a due date beyond 365 days.
Management and general expenses — expenditures on general oversight andmanagement (except for direct conduct of program services or fundraising activities),general record keeping, budgeting, finance, and other general and administrativeactivities. Also included are expenses that are categorized as indirect, shared, oroverhead — those that are essential to program administration but are difficult toallocate to specific programs.
Management letter — a letter that an independent auditor may issue with the auditreport if there are significant issues of concern to the auditor uncovered during theaudit.
Net assets — the difference between an organization’s assets (what it owns) and itsliabilities (what it owes). It is the accumulation of all the organization’s financialsurpluses since it came into existence (the equivalent of retained earnings on a for-profit balance sheet). Assets can be unrestricted as to their use or time of use. Or theymay be restricted assets, as when a donor puts limits on their use. The restriction canbe either temporary (if the restriction can be met either with the passage of time orby the purpose being fulfilled), or permanent (if the restriction never expires andcannot be removed).
Net margin — see Net assets.
Net (or total) margin ratio — measures profitability based on all revenues,including non-operating revenues. This typically means investment income isincluded, although it is generally classified as non-operating.
Non-operating revenues and expenses — revenues and expenses that are not relatedto a nonprofit’s programs or mission, such as gain or loss from the sale of investedassets.
Nonprofit Audit Guide — periodically updated collection of generally acceptedaccounting principles (GAAP) and other authoritative guidance, as they apply tononprofit organizations’ accounting. Issued by the AICPA.
OMB Circular A-133 — a publication of the U.S. Office of Management and Budgetprescribing audit requirements for nonprofits with government contracts.
Operating margin — the excess or deficit of revenues over expenses.
Operating margin ratio — measures profitability by comparing an organization’sbottom line (the excess of support and revenues over expenses) to its total revenues.
74 / UNDERSTANDING NONPROFIT FINANCIAL STATEMENTS / © 2008 BoardSource
Opinion letter — produced by an organization’s external auditors at the conclusionof their review of the year-end figures, it expresses judgment on whether themanagement-prepared financial statements are “presented fairly” in accordance withGAAP and accurately reflect the financial status of the nonprofit. A clean opinionletter indicates full compliance with GAAP. A qualified or adverse opinion letter is ajudgment by the external auditor that he believes that an organization’s financialstatements are not in compliance with GAAP. A disclaimed opinion letter is ajudgment by the external auditor that he is unable to form an opinion on anonprofit’s financial statements due to incomplete information provided bymanagement.
Permanently restricted assets — see Net assets.
Plant ledger — a subsidiary ledger of the general ledger, where all the elements foreach individual asset are recorded, such as the asset’s description, original cost, dateof acquisition, annual depreciation expense, and accumulated depreciation.
Pledge — a written or oral agreement by a donor to make a contribution to anonprofit organization. A promise to pay.
Private inurement — in the nonprofit context, financial benefits paid to a nonprofitorganization “insider” (director, officer, senior manager).
Program services expenses — expenditures, goods, and services used in activities tofulfill the purpose or mission of the organization.
Qualified or adverse opinion letter — see Opinion letter.
Quick ratio — measures the organization’s ability to meet short-term obligationsfrom its most liquid, or quick, assets. It compares assets that are quickly and easilyconvertible into cash (such as cash, cash equivalents, and accounts receivable) to theorganization’s current liabilities. (Also known as the asset-test ratio.)
Ratio analysis — a method for taking two or more informational elements andutilizing them together to obtain additional information. Financial ratio showsrelationships between raw data in the financial statements, usually expressed aspercentages.
Reserves — Surplus of funds available for unexpected circumstances.
Restricted assets — see Net assets.
Return on net assets ratio — measures profitability based on net revenues bycomparing a nonprofit’s excess of support and revenues over expenses to itsunrestricted net assets.
Revenue — income derived by a nonprofit from providing goods and services andfrom other earning opportunities.
Sarbanes-Oxley (SOX) Act of 2002 — a law enacted to ensure that publicly tradedfor-profit companies have processes and controls in place to produce timely, fair, andaccurate financial reports for boards and shareholders. It regulates audits and auditing

© 2008 BoardSource / UNDERSTANDING NONPROFIT FINANCIAL STATEMENTS / 75
processes to ensure board objectivity and auditor independence. Two provisions(whistleblower protection and document destruction) apply to nonprofits.
Statement of Activities (also known as the Income Statement) — a compilation ofall revenues and expenses of a nonprofit organization; it also shows the excess ordeficit of revenues over expenses and the change in net assets.
Statement of Cash Flows — reports the sources and uses of the organization’s short-term cash and cash equivalents for the period concurrent with the statement ofactivities. It is a summary of where the organization’s cash came from and how it wasused.
Statement of Financial Position (more commonly known as the Balance Sheet) —represents and displays all of an organization’s financial assets, liabilities, and netassets at a snapshot in time, usually the end of an accounting period (month, quarter,year), and conforms to the following equation: assets = liabilities + net assets.
Statement of Functional Expenses — displays all income and expendituresaccording to their primary functional classifications, such as program services,management and general expenses, and fundraising.
Support — income derived by a nonprofit from contributions and grants.
Temporarily restricted assets — see Net assets.
Trending — the display and analysis of data or information over time.
Unconditional promises to give (also known as pledges receivable) —contributions to a nonprofit that have been promised or pledged, but not yetreceived.
Unrestricted assets — see Net assets.
76 / UNDERSTANDING NONPROFIT FINANCIAL STATEMENTS / © 2008 BoardSource
Suggested Resources
BoardSource. The Nonprofit Board Answer Book, Second Edition: A Practical Guide forBoard Members and Chief Executives. Washington, DC: BoardSource and Jossey-Bass,2007. The second edition of this best-selling, indispensable resource contains 80questions and answers — a wealth of information about board structure and process,meetings, board composition, orientation, board-staff relations, financial management,and much more. The book offers insight gained from hundreds of board self-assessments and questions and challenges from thousands of nonprofit leaders.Written in an easy-to-use question-and-answer format, it includes action steps,examples, and worksheets.
Butler, Lawrence M. The Nonprofit Dashboard: A Tool for Tracking Progress.Washington, DC: BoardSource, 2007. Dashboard reports communicate criticalinformation to your board in a concise, visual, more compelling way. Dashboards helpnonprofit leaders focus attention on what matters most in their organizations. Thisbook, for board members and senior staff, presents different options for creatingdashboards and offers detailed illustrations and considerations. To help organizationsget started with their own dashboard reports, the accompanying CD-ROM includes adashboard generator file with two different customizable dashboard templates andhow-to instructions for working with the file.
Fry, Robert P. Minding the Money: An Investment Guide for Nonprofit Board Members.Washington, DC: BoardSource, 2004. Minding the Money will introduce yourorganization to the current investment world of hard-won dollars and will involvenonprofit board members in investment planning in a non-intimidating way. Withaction questions, helpful tips, and real-life case studies, readers will understanddifficult financial concepts they can implement in their own board service. Acustomizable CD-ROM offers practical appendices, including sample policies, self-guided investment audits, and Web links to applicable state statues.
Lang, Andrew S. Financial Responsibilities of Nonprofit Boards.Washington, DC:BoardSource, 2003. Provide your board members with an understanding of theirfinancial responsibilities including an overview of financial oversight and ways toensure against risk. Written in non-technical language, this booklet will help yourboard understand financial planning, the IRS Form 990, and the audit process. Alsoincluded are financial board and staff job descriptions and charts on all the financialdocuments and reports, including due dates and filing procedures.
Lawrence, Barbara and Outi Flynn. The Nonprofit Policy Sampler, Second Edition.Washington, DC: BoardSource, 2006. The Nonprofit Policy Sampler is designed to helpboard and staff leaders advance their organizations, make better collective decisions,and guide individual actions and behaviors. This tool provides key elements andpractical tips for 48 topic areas, along with more than 240 sample policies, jobdescriptions, committee charters, codes of ethics, board member agreements, missionand vision statements, and more. Each topic includes anywhere from two to 10sample documents so that nonprofit leaders can select an appropriate sample fromwhich to start drafting or revising their own policy. All samples are professionallyand legally reviewed. Samples are included on the CD-ROM.

© 2008 BoardSource / UNDERSTANDING NONPROFIT FINANCIAL STATEMENTS / 77
McLaughlin, Thomas A. Financial Committees. Washington, DC: BoardSource, 2004.Accountability is increasingly important to nonprofits, and every board must beengaged in understanding its fiduciary duties. Learn about the core responsibilitiesfinance, audit, and investment committees can hold. Discover how these committeescan address challenges in helping the rest of the board understand complicated fiscalissues. This book will also help finance committees to stress the importance of boardmember independence in oversight and audit functions, and prepare the board toaddress potential new legal regulations.
78 / UNDERSTANDING NONPROFIT FINANCIAL STATEMENTS / © 2008 BoardSource
About the AuthorSteven Berger is president of Healthcare Insights, LLC, which specializes in theteaching and consulting of health care financial management issues. HealthcareInsights also created and sells INSIGHTS, a decision support managementaccountability software system tool that is used to streamline budgeting, improvemonitoring, and enhance reporting. Prior to his role at Healthcare Insights, LLC, Mr.Berger was Vice President, Finance for seven years at a 250-bed Highland ParkHospital in suburban Chicago, Illinois. Before Highland Park Hospital and since1978, he has been a hospital/health system finance officer in New York, New Jersey,and Missouri.
Mr. Berger has many years of health care financial management experience. He holdsa Bachelor of Science degree in history and a Master of Science degree in accountingfrom the State University of New York at Binghamton. He is a CPA, and a Fellow ofthe Healthcare Financial Management Association (FHFMA) where he has served aspresident of the First Illinois Chapter. Mr. Berger is also a Fellow of the AmericanCollege of Healthcare Executives (FACHE). He has presented many health carefinance–related seminars throughout the United States and Canada, including severaltwo-day classes: Fundamentals of Healthcare Financial Management, Turning Datainto Useful Information, Hospital Financial Management for the NonfinancialManager, Creating and Guiding the Information-Driven Hospital, and The Zen ofBudgeting. He has also presented board-level financial training for BoardSource at itsannual meeting.
Mr. Berger has written several articles on health care financial and generalmanagement issues that were published in Healthcare Financial Managementmagazine, including an April 2002 column on management accountability. He is theauthor of two hospital/health care financial management books. Fundamentals ofHealthcare Financial Management, first published in 1999 by McGraw-Hill and theHealthcare Financial Management Association, is written from a practitioner’s point ofview and is a distillation of Mr. Berger’s many years on the inside of health careinstitutions. The third edition of the book was published by Jossey-Bass(www.josseybass.com) in January 2008. Additionally, Mr. Berger is the co-author ofHFMA’s Introduction to Hospital Accounting, 4th Edition, which was published in thesummer of 2002 by Kendall Hunt. In 2005, Mr. Berger wrote The Power of Clinicaland Financial Metrics, which was published by Health Administration Press(www.ache.org).
Finally, Mr. Berger served a term as president of the board of Turning Point, a501(c)(3) nonprofit community mental health agency. It is the experience that led tothe creation of this book.
Additional information on training, consulting, or management accountabilitysoftware (operating and capital budgeting, position control, balanced scorecard, laborproductivity, monitoring and measuring goals through automated e-mail alerts) canbe obtained at www.hcillc.com or e-mail at [email protected].