Embed Size (px)
Citation preview

CANADA
Department of Northern Affairs and National Resources
FORESTRY BRANCH
f
THINNING IN LODGEPOLE PINE STANDS
IN ALBERTA
by
L. A. Smithers
Forest Research Division Technical Note No. 52
1957.
c;?9

Published under the authority of
The Minister of Northern Affairs and National Resources
Ottawa, 1957

CONTENTS
PAGE
INTRODUCTION. . . . . . . . . . . . . . . . . . . . . . . . . . . . . . . . . . . . . . . . . . . . . . . . . . . . 3
METHODS................................................. ........ 3
PRESENTATION OF THE DATA:
Diameter Growth . . . . . . . . . . . . . . . . . . . . . . . . . . . . . . . . . . . . . . . . . . . . . 6
Height Growth. . . . . . . . . . . . . . . . . . . . . . . . . . . . . . . . . . . . . . . . . . . . . . . 1 1
Basal Area per Acre. . . . . . . . . . . . . . . . . . . . . . . . . . . . . . . . . . . . . . . . . .. 12
Cubic Foot Volume . . . . . . . . . . . . . . . . .. . . . . . . . . . . . . . . . . . . . . . . . .. 16
Mortality. . . . . . . . . . . . . . . . . . . . . . . . . . . . . . . . . . . . . . . . . . . . . . . . . . . . 19
DISCUSSION. . . . . . . . . . . . . . . . . . . . . ... . . . . . . . . . . . . . . . . . . . . . . . . . . . . . .. 21
GENERAL CONCLUSIONS. . . . . . . . . . . . . . . . . . . . . . . . . . . . . . . . . . . . . . . . . .. 24
SUMMARy........................................................ 25
REFERENCES. . . . . . . . . . . . . . . . . . . . . . . . . . . . . . . . . . . . . . . . . . . . . . . . . . . .. 26
79694-11 1


Thinning in Lodgepole Pine Stands in Alberta
BY
L. A. Smithers 1
INTRODUCTION
Lodgepole pine (Pinus contorta Dougl. val'. latifolia Engelm.) is one of the most important commercial tree species growing in the Province of Alberta. At the present time stands of this species occupy nearly one-third of the potential forest land of the province, and because of its adaptability to a variety of site conditions, it is unlikely that its position in the forest economy of Alberta will decrease in the immediate future. From a forester's standpoint lodgepole pine possesses a number of admirable characteristics. The abundance of viable seed stored in the serotinous cones of this species lends itself to the manipulation of the silviculturist, while its ability to reproduce and yield high quantities of cellulose volume on the medium and good sites, and its faculty for surviving and providing watershed protection on the poorest of mountain soils, all ensure it a place in the future forests of Alberta.
Unfortunately lodgepole pine has one serious drawback from both the forester's and lumberman's point of view. Characteristically this species reproduces in extremely dense stands following fire and subsequent stagnation seriously retards the production of high-quality large-sized individual trees. Although there are some indications that reproduction following suitable harvest cutting methods may reduce stocking to some degree (Crossley 1955), it is doubtful if wild fires can be completely excluded from the forest in the foreseeable future and consequently the problem of excessive stocking and stagnation must be faced. At the present time the demands of industry for largesized lodgepole pine in the form of hydro poles and piling are being met by a high grading, partial cutting method in stands of moderate and low stocking. However, such a practice could not indefinitely withstand the demands of an expanded industry, nor could such a practice be silviculturally acceptable.
One of the most obvious solutions to this problem is the development of thinning practices which will provide maximum per acre production of largesized material consistent with the economic limitations of the industry.
Foreseeing these problems, the Forestry Branch as early as 1937 undertook a program of research designed to develop practical methods of thinning lodgepole pine stands. The purpose of this Technical Note is to present tentative conclusions on thinning carried out in Alberta, and in some cases to indicate the necessity for further research.
METHODS
Stretching as they do from Alaska, south to the Northwestern United States and from the foothills of the Rocky Mountains westward almost to the Pacific Ocean, lodgepole pine forests exhibit a wide variety of growing conditions. Nevertheless, the problems of overstocking and stagnation are common to lodgepole pine wherever it occurs. Stands of this species in Alberta generally
1 Research Forester. Alberta District Office. Calgary. Alta.
3

grow in one of two forms; either poplar (populus tremuloides Michx.) is present in the stand, in which case the problem of stagnation is minimized; or it grows in pure stands which frequently include an understory of white spruce (Picea glauca (Moench) Voss). It is under the latter circumstances that stagnation may become an acute problem. Thinning studies in Alberta have, therefore, been confined largely to pure pine stands.
The methods of thinning most likely to prove successful in any particular forest type are largely dictated by the silvical characteristics of the component species. Lodgepole pine is a highly intolerant species which loses its foliage readily under shaded conditions. This indicates that the thriftiest and best-crowned trees are the ones most likely to be able to respond to conditions of increased light and moisture. Consequently the maj ority of the thinning methods tested were based on some form of thinning from below to release the best individuals in the stand. Such treatments included crop tree release thinnings, uniform thinnings from below and regular spacing treatments. In only one case was an attempt made to release codominant stems by the removal of the largest trees.
The most desirable age for thinning is controlled by two factors: degree of response at various ages; and economic considerations. Under these circumstances it was necessary to carry out studies in a variety of age classes.
Because of difficulties encountered in the use of the dominant height/age relationship to define site quality (Smithers 1955), a general assessment of the relative site quality of the sample plots included in this study has been based on the physiographic site conditions (Hills 1952) and the basal area yields of fully stocked undisturbed stands. Observation of physiographic conditions in the stands dealt with in this study indicated that available moisture was the limiting factor governing productivity. Droughtiness was caused by topographic position as well as local climate variations and coarseness of soil texture. Arbitrary site productivity ratings were therefore assigned to the stands on the basis of a moisture rating combined with the basal area productivity of the untreated stands.
Although it was expected that lodgepole pine would respond best to relatively heavy thinnings, a variety of thinning intensities were tested. These have been expressed in terms of residual basal area rather than on a basis of quantity of material removed.
Usually, axes and saws were used for f-elling and the thinnings were carried off the experimental area to avoid damage to the residual trees. In one of the studies the material to be removed was sufficiently small to be pulled from the ground by hand while in another case the residual trees were protected by asbestos cylinders and all other trees were killed by burning with a torch.
Table 1 shows a summary of information for each of the thinning experiments. Permanent sample plots were used to determine the behaviour of the treated stands. Plot sizes varied from 1/10 acre to 1 acre, plus surrounds, depending on the age and stocking of the stand. The methods of laying out and measuring these plots were those specified by Robertson and Mulloy (1946)2. Remeasurement of the sample plots took place immediately following thinning and at one-year or five-year intervals thereafter.
Field data were compiled in the form of stand and stock tables at each date of measurement and the diameter and height growth of individual trees was determined. Because of the bulk of these data it would be undesirable to present all the information, even in summarized form, in a single report. Therefore, the main trends only are illustrated with data from the experiments.
'Sample plots were established and remeasured during the period 1937-52 by H. A. Parker, Forest Research Officer, Forestry Branch (retired).
4

•
TABLE 1. T H INNING EXPERIMENT-LODGEPOLE PINE
Date of Stand Age Original Experiment Number of Size of Plot
Establish-Remeasurement at Establish- Thinning Intensity of Stocking
Number Sample Plots (acres) ment Dates ment Method Thinning (stems (years) per acre)
1 6 1/10 1939 1941, '43, '46, '50 5 Regular spacing Control, 3' x 3' 500,000 6' x 6'
2 2 1/2 1949 1950, '51, '52 , '53, '54 13 Thinned by burning Control and 6·6' x 6 ·6' 250,000
3 2 1/5 1937 1942, '47, '52 41 Crop tree release 79% Residual B.A. 4 , 200
4 32 1/10 1937 1942, '47, '52 4 1 Uniform 16 Controls 990-8,500 low thinning 16 Treated
55%-85% Residual B.A.
<:Jl 5 20 1/10 1939 1946, 1950 43 Crop tree release 10 Controls 1,400-7,000
10 Treated 60%-80% Residual B.A.
6 2 1/5 1937 1942, '47, '52 51 Crop tree release Control and 70% 2 , 500 Residual B.A.
7 2 1/10 1939 1946, 1950 73 Uniform Control and 22% 9,000 low thinning Residual B.A.
8 4 1 1938 1943, '48, '53 73 Crop tree release 1 Control 3,000 53%-87% Residual B.A.
9 2 1 1938 1945, '49, '53 73 Uniform 1 Control 2,000 low thinning 52% Residual B.A.
10 3 1 1938 1945, '49, '53 73 H igh thinning 1 Control 900 100 best trees cut 200 best trees cut

PRESENTATION OF THE DATA
Diameter Growth
The response of diameter growth to thinning is perhaps the most important factor in judging the success of the thinning treatment. Unless diameter growth is increased on the selected crop trees the thinning must be regarded as a failure. With only minor exceptions all the treated stands have shown a stimulation of diameter growth in response to thinning. However, this response has been variable and shows a definite relationship with the characteristics of the stand and the nature of the treatment.
Tree size, or more appropriately position in the stand diameter distribution, showed a strong influence on the diameter growth. In each experiment the diameter growth was greatest on the largest trees in the thinned stand. Figure 1 shows typical effect of thinning on the diarrieter growth of trees at various positions in the stand diameter distribution.
In order to illustrate the effect of stand age on diameter growth stimulation, a comparison has been made among four sample plots; two controls and two treated. These plots were selected for comparison because of their similarity as regards site quality, intensity of thinning, and degree of stagnation. Table 2 shows the diameter growth for the two pairs of plots. Stand 1 was 5 years of age at treatment while Stand 2 was 75 years old.
C\J 10
I ..... r<) 2.l -c: QI E QI ... u .£ ... QI Q; E 0 (5
2.4
2.0
1.6
1.2
.8
.4
0 500th largest
LEGEND
Treated ---
Control
--.-. ----
-- --.--
------- ---
400th largest
300th largest
200th largest
Diameter Frequency Indel<
lOOth largest
Figure 1. Influence of tree size and position in the diameter d istribution on diameter growth of lodgepole pine.
o
The similarity in diameter growth of the control plots indicated the comparability of the two sets of data. However, the young stand has shown far greater diameter-growth response to the treatment. This suggests that age may well be an important factor in developing thinning practice.
6

TABLE 2. AVERAGE ANNUAL DIAMETER GROWT H IN INCHES 1939-50
Stand 1 Stand 2 - (5 years old) (75 years old)
100 largest trees per acre . . . . . . . . . . . . . .
Average of all trees .... ........ . . ..
. ... . . .
.. . .. . ..
. .... .
. . . . .. .
Control Treated Control Treated
·080 ·345 ·075 ·136
·066 ·238 ·064 ·104
It might be argued that the length of time during which the stand had been stagnated rather than absolute age might have been the controlling factor in this example. Therefore a parallel comparison has been made between Stand 2 and another 75-year-old stand, No. 3 in Table 3. Although Stand 3 was on a similar physiographic site it was appreciably less stagnant at date of thinning. The degree of stagnation is illustrated by the average diameters of the stands at date of thinning which were 1 ·82 inches for Stand 2 and 4·2 inches for Stand 3.
TABLE 3.-AVERAGE ANNUAL DIAMETER INCREMENT I N INCHES 1939-50
Stand 2 Stand 3 - (75 years old) (75 years old)
Control Treated Control Treated
100 largest trees ............ ......................... ·075 ·136 ·070 ·138
Average of all trees ................... ............... ·064 ·104 ·106 ·106
The similarity in diameter growth rate shown by Stands 2 and 3, in spite of the great difference in degree of stagnation in the two stands, suggests that the difference in growth rate between Stands 1 and 2 may be truly attributed to age difference.
The importance of site quality in diameter growth of both thinned and unthinned stands may also be illustrated by examples from the data. In this case stands of the same age and thinning intensity were selected for comparison; however, in each pair of plots a substantial difference in physiographic site quality had been noted at the time the plots were established. These comparisons are shown in Table 4 .
TABLE 4.-AVERAGE ANNUAL DIAMETER GROWT H I N INCHES, 200 LARGEST TREES PER ACRE, 1 5-YEAR PERIOD 1937-52
Thinned Stand Control Stand Age at Thinning
Good Site Poor Site Good Site Poor Site
5 ·275 ·194 ·064 Breast height
41 ·150 ·107 ·087 ·075
75 ·123 ·088 ·072 ·051
79694-2 7

It will be noted from Table 4 that diameter increment on the good sites has been better than on the poor sites for both thinned and control plots. Also the stimulation of diameter growth by thinning, represented by the difference between paired, thinned and control plots, has been greater on the good sites than on the poorer ones.
The nature of the thinning also exerted considerable influence on the st.imulation of diameter growth, the most striking effect being the variation in response with different intensities of thinning. As might be expected, diameter growth stimulation has been greatest on the heavily thinned plots and least on the lightly thinned. This trend was evident in all the experiments. As an example, the data from 38 sample plots in the 40-50 year age class are shown in Figure 2. In this figure intensity of thinning has been expressed in terms of residual basal area so that 100 per cent residual basal area is equivalent to an unthinned stand.
(\J 10 I
"-r<) � CII ... 0 q:
"--I/) CII 0> ... 0 ...J .c 0 Q 0 oS E 0 0
2.10
1.90
1.70
1.50
1.30
1.10
60 70 80 90 Percent Residual Basal Area After Thinning
Figure 2. Effect of intensity of thinning on diameter growth.
100
The data in Figure 2 show that diameter growth varies inversely with residual basal area after thinning.
As mentioned previously, on the basis of the silvical characteristics of lodgepole pine, low thinnings designed to release crop stems should be the most successful type of treatment. However, in one of the experiments an attempt was made to release codominant stems by removing a selected number of the largest trees. Two variations of this treatment were employed, one removing the 100 largest trees, and the other removing the 200 largest trees. The diameter growth data from this study are presented in Table 5 together with data from a crop tree release thinning of similar intensity which are shown for purposes of comparison.
A comparison of the figures in Table 5 indicates that release in diameter growth, represented by the difference between the growth of a treated plot and its paired control plot, has been nearly twice as great when thinnings were carried out from below by crop tree release as when thinning by removal of dominant stems was employed.
8

Plot No.
1 2 3
4 5 6
TABLE 5.-AVERAGE ANNUAL DIAMETER GROWTH, 200 LARGEST TREES PER ACRE
Treatment Annual Growth
(inches)
ControL ....... .......... . ·060 100 dominants removed ........................................ . · 069 200 dominants removed ... . ·082
Control. ........................................................ . ·072 Light crop tree release .......................................... . ·092 Heavy crop tree release .. . ·123
Apparent Release
(inches)
· 009 ·022
·020 · 051
It is also important to determine approximately how much time elapses before stimulation of growth due to thinning takes place, and what is the duration of such stimulation. Very approximate figures to illustrate these points, based on stem analysis of selected stems removed 1 5 years after thinning, are shown in Figure 3 .
u ..s E ,� 0 0 ::l c: c: <i
. 20
• IS
.10
Heavy Thinning "-----K
Light N
------�- -------------
.05
o 10 5
Before
Projected Average Growth Before Thinning
01 .S c .S
f3-
Yeor from Thinning
5 10 After
Figure 3. Comparative stimulation of diameter growth from different intensities of thinning and its duration.
IS
This stand of pure, even-aged lodgepole pine was thinned from below to various densities at an age of 75 years. The diameter growth of the sample trees removed (Figure 3) shows that a relatively uniform rate of growth pre-
79694-2! 9

vailed during the 10 years preceding treatment. Response following thinning occurred within two years. While the maximum release was shown during the first 10 years following thinning, there is some suggestion that the diameter growth in this thinned stand is still better than that of the 10 years prior to treatment.
In order to obtain a better perspective on the diameter growth of lodgepole pine after thinning, comparisons of the growth of other species may be made. As mentioned previously, the majority of lodgepole pine stands contain various amounts of white spruce which are usually present in the form of an understory. However, individual spruce often occupy a codominant or even a dominant position in the crown canopy. Age counts usually indicate that the spruce content of the stand has resulted from the same fire which regenerated the pine and early slow growth has resulted in the spruce forming an understory. Table 6 shows a comparison of annual diameter growth between spruce which were in a codominant or dominant position in the stand, and pine of a similar position and size. The growth under various intensities and types of thinning has been illustrated.
TABLE 6.-AVERAGE ANNUAL DIAMETER GROWTH IN INCHES, 1937-52
Lodgepole Pine White Spruce
Type of Thinning Diam. Diam.
Diam. Increment
Diam. Increment
Crop Tree Thinning Control. . . . . . . . . . . . .. 7·48 ·072 7·49 · 1 1 8 Light . . 7·23 ·092 7·55 ·135 Medium .. 7 ·93 ·096 7·79 ·138 Heavy .. ... . . . ... . 7·07 ·123 7·15 ·164
Low Thinning Contro!. ........ .. 7 ·69 ·05 1 7 ·34 · 1 1 0 Heavy ........... 7· 18 ·088 7·1 1 · 155
High Thinning Control. 9·01 ·060 8·58 ·077 Light .. 8 ·05 ·069 8·09 ·155 Heavy .. . . . . . . . . . . .... ...... .. 6·55 ·082 6· 61 ·145
The more rapid growth of the spruce is clearly evident in Table 6 regardless of intensity or type of thinning. These experiments were on medium to good sites and it is quite possible that on the drier and poorer sites this difference in the growth of the two species would not be so evident. However, the data do suggest that on the better sites dominant spruce may well be favoured in selecting future crop trees.
An interesting comparison may also be made between the growth of lodgepole pine in Alberta and red and white pine (Pinus resinosa Ait., Pinus strobus L.) in Ontario (Smithers 1 954) under various intensities of thinning. Comparable data for these species are presented in Table 7.
These figures represent averages of a large number of plots; in the case of red and white pine, 24 plots were available while for lodgepole pine, data from 66 plots were employed. These figures cover a wide range of site, age and thinning intensity values. However, in general these conditions were similar
1 0

TABLE 7.-AVERAGE ANNUAL DIAMETER GROWT H IN INC HES , 100 LARGEST TREES PER ACRE
Treatment
Control Plots ..... .......................... .
Thinned P lots ....................................................... .
Red and White Pine
·086
· 122
Lodgepole Pine
·083 · 128
for both species and it is felt that the average figures represent a valid comparison. As may be seen from the figures in Table 7, the growth under both thinned and unthinned conditions has been remarkably similar for both species. Data on the growth of ponderosa pine (Pinus ponderosa Laws. ) after thinning (Gaines and Kotok, 1954) show that for comparable age classes and site conditions, thinned lodgepole pine stands have shown equal and sometimes superior diameter growth.
Crown size and shape are significant factors in the study of thinning. Unfortunately no quantitative data were available for these experiments; however, general observations provide some information on the problem. Lodgepole pine crowns are characteristically longer and narrower with finer branches than those of other intolerant pines such as jack pine (Pinus banksiana Lamb. ) and red pine. In pole-sized stands of lodgepole pine, serious overcrowding of crown space apparently takes place while there is considerable clear space between the crowns of individual trees; this results in the death of the lower branches of the crown. It is suggested that trees reserved for the final crop in thinned stands should have between one-half and one-third of their total length in green crown. It was noted that while light thinnings provide some space between individual crowns, mortality of the lower branches continued at a rapid rate. However, in the heaviest thinnings removing 50-60 per cent of the basal area, mortality of live branches was reduced to a very low level.
In general the response in diameter growth of lodgepole pine to thinning has been satisfactory and indicates that thinning in this species may be expected to produce larger final crop stems in a given rotation period.
Height Growth
In addition to producing crop trees of large diameter it is desirable to grow the tallest possible trees consistent with the site quality. The data on height growth provided by these experiments has been much less conclusive than that on diameter growth. However, it is felt that the instrument limitations, combined with the relatively short period of measurement, may have somewhat obscured the true trends of these data.
Stands of lodgepole pine thinned at 5 years of age (Table 1, Experiment No. 1) have shown a very definite response in height growth. Table 8 presents the height growth data from these stands 11 years after thinning.
Table 8 indicates the excellent response in height growth which has resulted from the early thinnings of t.hese young stands. Further information on the development of this stand is presented in Figure 4 which shows the current annual height growth of the three densities. It is quite apparent from this graph that the response to treatment was effective within two years and has continued up until the last measurements in 1953.
In contrast to these data, studies in release by controlled burning in 14-year-old dense pine have shown no response up to early 1955 in either height
11

TABLE 8. -HEIGHT GROWT H IN FEET
Good Site Poor Site - Year
3-foot 6-foot Control 6-foot 3-foot Control
spacing spacing spacing spacing
100 tallest trees per acre ........ 1939 2 ·9 3 3 2·6 1·4 1 ·4 1 ·0
1950 17·8 18·0 8·2 13·9 10 ·4 4·0
A verage all trees . . . . . . _ 1939 2-0 2-0 1·6 I-I 1·0 0-6
1950 14·4 13·3 6-5 1 1 ·0 7-0 2·8
or diameter growth. Whether the failure to respond has been caused by method of treatment or whether previous stagnation has limited the growing capacity of the trees is not known. However, the direct opposition of the results of these two studies indicates that further investigation of the problem is required.
Generally, the thinning data from 40- and 70-year-old lodgepole pine stands has provided no positive indications that height growth has been stimulated by thinning. However, studies on the effect of stocking on average and dominant heights (Smithers 1955) show that the large numbers of stems per acre reduce both average and dominant heights in lodgepole pine. It might therefore be inferred that over a long period, thinnings which tend to reduce the number of stems per acre would in turn bring about taller trees both in the dominant and other tree classes.
Information gathered in natural lightly stocked stands of lodgepole pine show that height growth on medium to good physiographic site conditions has been relatively rapid in comparison to that of red and ponderosa pine. In 85-year-old stands containing 400 stems per acre and 100 to 160 square feet basal area per acre, dominant heights of 70 to 80 feet were recorded on fair to good sites. Consequently it appears that height growth of lodgepole pine in thinned stands should not be subnormal in comparison with other intolerant pines.
Basal Area per Acre
In addition to producing individual trees of good diameter height and quality, a thinning must attempt to maintain or increase the per acre productivity of the stand. Basal area in square feet presents one of the most useful criteria on which the success of a thinning may be judged.
In normal fully stocked stands of lodgepole pine the curve of basal area on age exhibits a well-defined trend. Studies of basal area on heavily stocked permanent sample plots indicated that basal area rises rapidly in young stands and culmination of this curve occurs at ages 40 to 50 years. At age of 60 years and more the basal area curve becomes noticeably flat with minor fluctuations of up to 10 square feet. It is also quite evident that the basal area level reached at these ages bears a strong relationship to the physiographic site conditions (Smithers 1955). This shape of curve appears to be quite characteristic of the intolerant pines. It has been reproduced for ponderosa pine by Meyer (1938), for loblolly pine by Chapman and Meyer (1949) , and for red and white pine by Smithers (1954). The basal area development of fully stocked control plots in lodgepole pine in Alberta is shown in Figure 5. In this graph each of the solid lines represents the 15-year development of a fully stocked control plot. The somewhat narrower spread of data in the 40- to 60-year age classes indicates that only the lower portion of complete range of site conditions was
12

2.0
1.8
1.6
q; 1.4 � .5 C 1.2 <II E
I-' <II C>J "- /.0 0
� -� .2' .8 <II :t:
"0 :::0 .6 c: c: q:
.4
.2
.\/ / .................
<II / 8 I • 3'
I 3x
/ V"" /, / .......... ,.
I
01 c: 'co c: :<: I- II /
' / ' / ........ , I '
'/ '........ I
',/ . ..........,._-_.
'---.--- �/ ._--_. \
'.
I // \ / / \ Control ".".".
. j -0' .......... ,..... .... ................ \
b �//
\
.... ,
/-
---.----.----.". ....
j/ \ "./ , /
-
.
--
-
.
\
---
---
-
-......
'
// ............ ... / . , / : ......... =_:...... '.
2 3 4 5 6 7 8 9 10 " 12 13 14 Age in Years
Figure 4. Stimulation of height growth in young stands resulting from thinning.
15 16 17 18 19

sampled in this age class. The dotted line curve shows the expected development of a fully stocked plot of average site quality, and consequently this curve passes above the mean of the available 40- to 60-year age class data. Figure 6 shows a comparison between basal area development of ponderosa pine (reproduced from Meyer, 1938) and the expected development of lodgepole pine based on the data from Figure 5. Only the solid line position of these curves is supported by data. It is of interest to note the similarity both in shape of curve and spread of basal area associated with site quality shown by the two species.
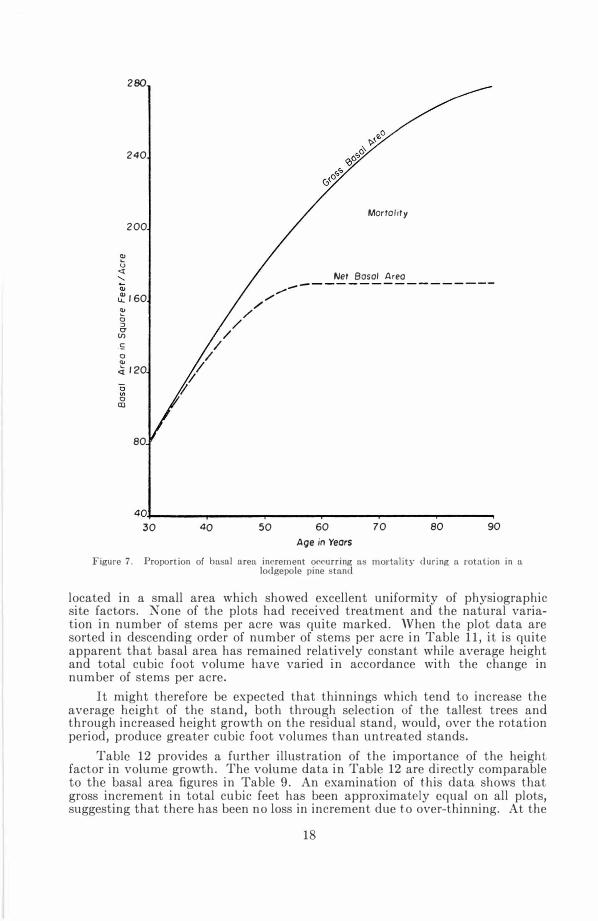
In Figure 7 the estimated net basal area curve for an average site condition from Figure 5 has been reproduced. Mortality data from the unthinned permanent sample plots had been accumulated for the period from 40 to 90 years of age and a gross basal area per acre curve has been reproduced. The losses due to mortality between the ages of 30 to 90 years have amounted to 110 square feet per acre or approximately 39 per cent of the gross yield. This figure is directly comparable to data for red pine (Smithers 1954) showing 40 per cent mortality, and for Scots pine (Schlich 1925) showing expected mortality of 35 per cent. Mortality in these lodgepole pine stands in terms of basal area per acre has constituted roughly the same proportion of the yield as for other intolerant pine species and therefore cannot be regarded as subnormal. It is this material which would normally constitute mortality that may be salvaged by thinnings and thereby increase the yield of usable wood.
Thinning treatment designed to increase the growth of individual trees will reduce the net basal area of the stand according to the intensity of the thinning. Provided that sufficient trees remain after the thinning to fully occupy the area, gross basal area increment will continue at about the same level as if the stand had not been treated. However, the proportions of net increment and mortality will be changed; net increment will increase and mortality will decrease. The problem therefore is to determine how heavy a thinning may be made without sacrificing gross increment. Thinnings in lodgepole pine in Alberta have covered a range of intensity from 20 per cent to 90 per cent in terms of residual basal area, and in no case was there evidence that intensity of thinning has materially reduced the gross increment. As an example, Table 9 shows the results of basal area increment following three intensities of thinning. The basal area figures for all plots in 1938 before treatment are similar; gross increment during the 15-year period from 1938-53 has been approximately the same on all plots, indicating that there has been no loss of growth on any of the plots. The main difference is the variation in the proportion of net increment to mortality. Net increment has increased while mortality has decreased with an increase in the intensity of thinning. It would appear that even under the heaviest thinning in which only 50 per cent of the basal area remained after treatment, no growth has been lost due to overthinning, and mortality has been reduced to an almost negligible amount. After 15 years growth the basal area of the heavily thinned area has returned to 87 per cent of the 1938 level, and it is estimated that at the end of 25 years the stand will have completely replaced its basal area growing stock. It is also important to note that after the light thinning, basal area has returned to its pre-thinning value and mortality has been quite substantial. It is unlikely that there will be much further increase in net basal area on this plot and mortality will rise probably to the same level as on the control plot.
14

...... CJl
200 ./._ .. ---...... Individual P S P data . --- .
/?-Curve of overage site - - --- �;�: ----------��� �160 0
<t � cu Q.
... cu cu lL cul20 � 0 :) 0' (J)
.S 0 CII � <t
0 en 0 III
80
401 //
10 20
// //
///:�����-- ===:======:: /
./ /
// / /
30 40 50 60 70 80 Age in Years
Figure 5. Effects oC age on the basal area development DC Cull-density stands.
90

TABLE 9.-BASAL AREA PER ACRE IN SQUARE FEET
Date Control" Light" Medium" Heavy" Plot Thinning Thinning Thinning
1938 BT ........ . ........... .... ... . . ..... . . . . . . . . . . 195·6 183·6 187·6 180·5 Thinnings ....... ... .......... 23·6 59·0 85·6 1938 AT .............. . ..... . ............. 195·6 160 ·0 128·6 94·9
Alive 1953 ........... 201 ·5 183 ·8 161 ·7 157 ·1 Net increment 1938-53 ... 5·9 23·8 33 ·1 62·2 Net annual increment .... . .. . . .. .. . . . . 0 ·39 1 ·59 2·21 4 ·15
Mortality 1938-53 ........ 45·6 30·6 16·4 5 ·,5 Gross increment 1938-53. 5 1 ·5 54·4 49·5 67·7 Gross annual increment .... ...... . ....... . . . ......... 3 ·43 3·63 3 ·30 4·51
" Per cent residual basal area: control 100%. light thinning 87%. medium thinning 69%. heavy thinning 53%.
BT - before thinning
AT - after thinning
A further illustration of the effects of a very heavy thinning on a 70-yearold lodgepole pine stand is presented in Table 10. As can be seen from the data, the thinning was extremely heavy, leaving a residual basal area of only 20 per cent.
TABLE 1O.-BASAL AREA PER ACRE IN SQUARE FEET
Date Control Plot Thinned Plot
1939 BT .... . 161 ·3 168·6 Thinning .. . 134· 6 1939 AT .. . 161 · 3 34·0
1950 . ..... . 159·8 72 · 1 Net increment 1939-50 ............ . - 1 ·5 38·1 Net annual increment .. -0 ·14 3 ·46
Total mortality .......... . 37·6 0·9 Gross increment 1939-50 .. . 36 · 1 39·0 Gross annual increment ... . 3·28 3 ·54
A comparison of the gross increments on these two plots shows a strong similarity, indicating that there has been no loss in growth caused by the heavy thinning which in this case removed 80 per cent of the basal area.
In this example the success of the extremely heavy thinning was due to the excessive numbers of stems which consisted of 9,000 trees per acre at an age of 73 years. It is doubtful if such heavy thinnings could be made in stands of more normal stem distribution without causing some loss in increment. The general picture from all the data does however suggest that well-distributed thinnings removing up to 50 per cent of the basal area may be made in middleaged stands without fear of reducing growth.
Cubic Foot Volume
Cubic foot volume figures show much the same trends of behaviour as do the basal area data. However, the influence of total number of stems per acre on the cubic foot yields is quite marked. As an illustration of this point, the data from nine sample plots has been presented in Table 11. The plots are all
16

300
250
Q) .... 0 <X "--Q) � 200
Q) .... 0 :> 0-(f) .S 150 0 Q) ...... '-
--l <X "0 <II 0 CD 100
50.
/ /
/ /
/ I
/ /
/ I
/ I
/ I
I
Ponderosa Pine Site Index 140
Lodgepole Pine Best Site �---------- -------------------
Ponderosa Pine Site Index 40
Lodgepole Pine Poor Site �--------------------------------
/
/ /
/ /
I / /
I
20 40 60 80 100 1 20 Age in Years
Figure 6. Comparative development of basal area for pondorosa pine and lodgepole pine.
140 160
� u <:[ "QJ
280
240
200
�160 � o " 0-(J)
.S o QJ q 120 5: o ID
80
'/ 'I
�
/ /
/ /
,/ /
/
Mortality
Net 80501 Area /�-----------------
40� ____ � ______ � ______ � ______ � ____________ � 30 40 50 60 70 80 90
Age in Years Figure 7. Proportion of basal area increment occurring as mortality during a rotation in a
lodgepole pine stand
located in a small area which showed excellent uniformity of physiographic site factors. None of the plots had received treatment and the natural variation in number of stems per acre was quite marked. vVhen the plot data are sorted in descending order of number of stems per acre in Table 11, it is quite apparent that basal area has remained relatively constant while average height and total cubic foot volume have varied in accordance with the change in number of stems per acre.
It might therefore be expected that thinnings which tend to increase the average height of the stand, both through selection of the tallest trees and through increased height growth on the residual stand, would, over the rotation period, produce greater cubic foot volumes than untreated stands.
Table 12 provides a further illustration of the importance of the height factor in volume growth. The volume data in Table 12 are directly comparable to the basal area figures in Table 9. An examination of this data shows that gross increment in total cubic feet has been approximately equal on all plots, suggesting that there has been no loss in increment due to over-thinning. At the
18

TABLE 11.-LODGEPOLE PINE PER ACRE
Plot No. Number of Stems Basal Area Average Height Cubic Volume
1 3,102 183 40 3,260 2 2,266 201 42 3,988 3 1,950 206 45 4,524 4 1,848 205 48 4,629 5 1,770 194 52 4,868 6 1,480 205 52 4,914 7 1,120 188 54 5,268 8 980 204 58 5,613 9 783 194 61 5,487
TABLE 12.-TOTAL CUBIC FOOT VOLUME
Date Control Light Medium Heavy Thinning Thinning Thinning
1938 BT. ......... . .. . ..... . . . .... . 3,905 3,675 4,149 3,216 Thinnings. .... . .... . .... . .. . ... 583 1,239 1,338 1938 AT .. .. . . . ................ ....... . ..... 3,905 3,092 2,910 1,878
1953 volume .... . ... . ... . .......... . ........ . ...... . 4,69 1 4,355 4,295 3,448 Net increment 1938-53 ............. ...... . . . . . . . . . . . . 786 1,263 1,385 1,570 Net annual increment 1938-53 ... ................ 52 84 92 105
Mortality 1938-53 .. ... . . . . .... ..... . ........ 794 522 324 109 Gross increment 1938-53 . 1,580 1,785 1,709 1,679 Gross annual increment 1938-53.
' ........... : : : : : : : : : : .
105 1 19 114 112
same time a comparison of net periodic increment in basal area and volume (Tables 9 and 12) shows that the control plot increment was 57 per cent of that of the treated plots in terms of volume and only 15 per cent in terms of basal area, suggesting that roughly 40 per cent of the volume increment has resulted from increase in average height of stand.
Mortality
The volume of natural mortality which has taken place during the life of an untreated stand provides a most useful indication of the minimum amounts of material which can safely be removed by thinning. Data from permanent sample plots in fully stocked lodgepole pine stands ranging in age from 40 to 90 years have been extended to indicate mortality during a 100-year rotation. These figures are shown in comparison with yield table data for ponderosa pine (Meyer 1938) and for red and white pine (Smithers 1954) in Table 13. In all cases data have been selected from stands producing approximately the same basal area yield at 100 years of age.
TABLE l3.-CUMULATIVE MORTALITY IN TOTAL CUBIC FEET PER ACRE
Age
20-40 .... .. ............ . 20-60 .............. .................... . 20-80 .. ................................ . 20-100 .................................. .
Lodgepole Pine
100 478
1,467 2,450
Ponderosa Pine Red Pine
101 100 653 500
1,258 1,310 1,723 2,460
Figure 8 illustrates the comparative mortality based on number of stems per acre of lodgepole and ponderosa pine. The ponderosa figures selected were those for site index 80 shown by Meyer (1938). The figures at various ages were expressed in per cent of number of stems present at 20 years of age. These
19

100
II> '- 80 u
<t ..... CIt E !!! (I) ... 0 60 '-II> .0 E :J 2:
t-.:) ... 0 0
'0 40 ::-.:; '-:J (I)
� II> U ... II> Q. 2 0
/0
" ,
, ,
,
20
, ,
,
30
" " "
40
Ponderosa Pine -----lodgepole Pine -----
� �
� '"
..............
............. )(� ............. -�
50 60 70 80 90 Age In Years
Figure 8. Comparable per cent survival of number of stems per acre for ponderosa pine and lodgepole pine.

data are shown by the dotted curve in Figure 8. In comparing lodgepole pine data, average figures for permanent control plots with 15-year remeasurements were employed. The number of lodgepole pine alive at the beginning of the remeasurement period was equated percentage-wise to the figure for ponderosa pine ; and on this basis the percentage change in number of trees for the remeasurement was calculated. The figures for lodgepole pine are shown by the solid lines for the periods 41-56 years, 5 1-65 years, and 75-90 years. This percentage method of comparison was necessary because of the differences in actual numbers of stems per acre. However, other comparisons indicate that the use of percentages has not seriously biased the results.
Table 13 and Figure 8 indicate in terms of both volume and number of stems per acre that mortality of lodgepole pine between the ages of 40 and 90 years has behaved in a similar manner to that of ponderosa pine. It might therefore be expected that if lodgepole pine stands were to originate at similar densities they would show a parallel development to those of ponderosa pine during the first 100 years of growth. It would also seem that the so-called stagnation of lodgepole pine is purely a function of the initial stocking which may be controlled by j udicious harvest cuttings or by thinning in young stands, or by both.
DISCUSSION
The information on thinning of lodgepole pine stands gathered from current experiments in Alberta provides some basis for developing a thinning practice for the species. However, such methods must be further tested in the field and additional refinements included as the circumstances warrant.
European practice has shown that where a demand exists for thinnings, a series of light treatments repeated at frequent intervals salvages the maximum amount of material and at the same time provides the greatest benefit to the residual stand. Such a practice would of course be completely unpractical at the present time or in the immediate future in Alberta. At the best, one can only see possibilities for the most rudimentary of silvicultural treatments involving at the most only a few thinnings during a rotation.
Before any attempt is made to advocate thinning treatments, some consideration must be given to the economic aspects of thinning in Alberta at the present time. The products to which lodgepole pine is particularly suited include pulpwood, ties, poles, piling, pit-props and fence-posts. Thinning practices for the moment must therefore be designed to meet the present and immediate future requirements for these products.
In the past the pulpwood demand in Alberta has been low but current developments indicate a greatly increased requirement for this product and, in the future, it is possible the demand may exceed the production of the unmanaged accessible forests. Thinning is generally regarded as one of the most satisfactory methods of increasing productivity, by salvaging mortality which would otherwise be lost. In the production of pulpwood, tree size is a secondary factor, provided it is above an acceptable minimum of roughly 6 inches d.b .h. This size is readily reached in the maj ority of the unmanaged accessible stands in a 125-year rotation. Therefore thinning practice in pulpwood stands should be aimed primarily at increasing the production per acre by salvaging mortality.
In order to carry out such a thinning at a maximum profit, it is essential that a high percentage of the thinnings should be classed as merchantable pulpwood. It is unlikely that such a condition will occur in lodgepole pine stands suitable for thinning at an age earlier than 50 years. At the same time the thinning must be made at least 25 years prior to the harvest cut to permit
2 1

the stands to replace their growing stock. Since these stands will probably be operated on a 1 00- to 1 20-year rotation, these limitations place the age of thinning at between 50 and 80 years. Provided that this recovery period of approximately 25 years is left between the last thinning and the final cropping of the stand, the harvest cut will yield a volume of wood equal to that of an untreated stand of a similar age. The amount of material to be removed is also of importance. From a standpoint of logging costs the volume of wood removed per acre should be at a maximum, consistent with maintaining the per acre increment during the balance of the rotation. The data presented have shown that up to 50 per cent of the per acre volume may be removed without reducing the wood-producing capacity. A heavy thinning of this type should result in a per acre cut of approximately 1 5 cords.
In order to carry out such a treatment effectively, it will be necessary to exercise great care in choosing the thinning method. The demand for a maximum amount of larger sized trees suggests thinning from above ; however, the experiments outlined above indicated that heavy thinnings of this type would cause a decline in the production rate. It will be necessary therefore to retain in the stand a proportion of the thriftiest dominant trees oapable of rapid response to increased availability of light and moisture. In order to make the best use of these residual dominants it is suggested that a crop tree release type of thinning would be most effective. Trees to be removed should include wolf trees as well as larger trees which have been inj ured or show evidence of decay. The bulk of the thinnings however will consist of intermediate and codominant trees which are actively competing with the thriftiest dominants.
Under highly favourable conditions of accessibility and superior site conditions, it may be possible to carry out two pulpwood salvage thinnings within a single rotation. Such a treatment would be feasible only in stands which have produced merchantable thinnings for pulpwood at an age of 50 years. Under such circumstances the basal area could be reduced to 50 per cent of full stocking at ages 50 and 75 years. The expected total yield of thinnings from such treatments would be approximately 25 cords per acre.
The problem of producing poles, piling, and ties is distinctly different from that for pulpwood. Here the emphasis is on the production of individual trees of large size and the salvaging of mortality is a secondary factor. In order that the stand may contain a high proportion of material suitable for such round wood products, an average diameter of approximately 1 1 inches is required at rotation age. This would mean that suitable stands should contain between 200 and 300 trees per acre at rotation age depending on the site conditions. Some stands of this type occur naturally and Table 14 shows the approximate stocking of these low-density stands at various ages. Such stands can produce adequate crops of poles, piling and ties without thinning. Should the demand for this class of product remain relatively limited, requirements probably can be filled from the existing low-density stands; otherwise thinnings to produce large dimension material through low-density management will be required.
There exist in Alberta large areas of lodgepole pine ranging in age from 40 to 90 years which are more heavily stocked and which will require 1 50 years or more to produce a crop of 200 poles or tie trees to the acre. In the past these higher density stands have been high-graded to produce a limited number of poles. However, current studies (Blyth 1954) of partial cutting from above show that this form of treatment does not produce diameter growth stimulation on the residual trees and it appears that volume increment is less than that of undisturbed stands. Regeneration of lodgepole pine is not accomplished
22

TABLE 14.-DESIRABLE STOC KING IN UNTREATED STANDS, NU MBER OF STEMS PER ACRE
Age Site Condition (years)
Good Medium Poor
20 . 2 , 500 2 , 000 1 , 300 30 . 2 , 000 1 , 500 1 , 000 40 . . . . . . . . . . . . . . . . . . . . . . 1 , 500 1 , 100 800 50. . . . . . . . . . .. 1 , 100 800 600 60. o • • • • • • • • • • 800 600 450 70 . . . . . . . . . . . ... . . . . . . . 600 460 360 80 .. . . . . . . . . . . . . . . . . . . . . 450 375 290 90. 375 300 240
100. . . . . . . . .. . . . . . . . 300 250 200
by such cutting methods and it appears that a prolonged cycle of such highgrading methods will result in the eventual elimination of lodgepole pine from these stands. Provided that a market exists for smaller-sized trees in the form of corral rails, posts, pitprops, and pulpwood, these stands may be managed by crop tree release methods or low thinnings. Since the feasibility of such treatments rests largely on the margin of profit to be derived from the sale of smaller trees, it is essential that the first treatment be delayed until the thinnings produce merchantable material. In most cases this will not occur earlier than an age of 50 years. At this time the stand can be reduced to between 50 and 60 per cent residual basal area, yielding approximately 1,000 cubic feet per acre. Successive thinnings at ages 75, 100, and 125 years may be employed to keep the basal area at 50 to 60 per cent of full density, producing a total yield of roughly 3,500 cubic feet of thinnings during the rotation. The harvest cut of poles, ties, and piling will take place at approximately 150 years of age. Since the rotation required to produce the large-sized trees has been only slightly reduced, it is apparent that the benefits of such treatments will rest entirely on the marginal profits from the thinning and the increased quality and quantity of poles, etc., produced at rotation age. This suggests that the greatest of care must be exercised in the selection of future crop stems in the earliest thinnings.
There also exist in Alberta, particularly in the subalpine and high foothills regions, limited areas of seriously overstocked stands which may contain 20,000 or more stems per acre at an age of 20 years. Such stands will never produce a merchantable crop of trees suitable for poles, ties, or other products, where large-sized trees are required. Should it be found necessary to bring such areas into merchantable production, it will be necessary to drastically reduce the stocking of these stands at a very early age. Since no direct return can be expected from such an early thinning, the treatment should take place as early as the mechanics of the thinning treatment will permit. There has been a suggestion (Crossley 1956) that aircraft spraying with herbicides may prove to be an effective method of thinning such stands. However, in order to be practical, more effective lethal sprays, involving a smaller volume of herbicide, must be developed. If aerial spraying does not prove satisfactory, manual methods will be necessary. Thinnings in such stands should aim at reduction of stocking to approximately 1,500 stems per acre with uniform spacing being provided for the residual stands. A single treatment of this intensity should produce a mature stand of poles and ties in 100 years.
23

Specifications of the various types of thinning which may be useful In lodgepole pine stands are as follows :
Type I Purpose-Increase yield in pulpwood stands. Site conditions-Medium and better sites in areas close to mills. Age when thinned-50 to 80 years. Thinning intensity-Remove up to 50 per cent of basal area depending
on density. Thinning method-Crop tree release. Additional notes-Two thinnings may be feasible in selected stands at
ages 50 and 75 years. Basal area not to be reduced below 50 per cent of full stocking at any time. Yield of two thinnings up to 25 cords per acre .
Type II Purpose-Hydro poles and tie production. Site conditions-Better sites only. Age when thinned-50 to 1 25 years depending on earliest age when
merchantable thinnings can be produced. Thinning intensity-Reduce basal area to 50-60 per cent of full stock
ing at 25-year intervals. Thinning method-Crop tree release of low thinning. Additional notes-The feasibility of this method depends on the pres
ence of a market for small-sized trees as posts, props, corral rails , and pulpwood. Total yield of thinnings during a 1 50-year rotation, 3,500 cubic feet per acre.
Type III Purpose-Hydro poles and tie production. Site conditions-Best sites only, when stocking conditions are excessive. Age when thinned-5 to 20 years. Thinning intensity-Reduce stocking to 1 ,500 stems per acre. Thinning method-Uniform spacing manual thinning, or aerial spray-
ing of herbicides. Additional notes-Such thinnings are not economically feasible at this
time but may be required in the future.
GENERAL CONCLUS IONS
As a result of the experiments and observations conducted to date on the behaviour of lodgepole pine under various thinning treatments, it is possible to arrive at some generalizations on the growth of this species.
The most important factor in the development of stands of this species is the initial high stocking of seedlings which can occur in lodgepole pine stands following disturbance by fire. In some cases up to half a million stems per acre can be found. Proportionately high stocking can persist through the life of the stand with the effect that merchantable crops may not be yielded during the entire rotation.
In spite of such excessive stocking in lodgepole pine stands, mortality in terms of basal area and cubic foot volume per acre appears normal in comparison with data for other intolerant pine species. Basal area increment and yield are also consistent with the physiographic site conditions on which lodge-
24

pole pine occurs. Consequently it is reasonable to expect that if such excessive stocking can be reduced by intermediate cuttings or by controlled harvest cutting methods, the per acre yields of lodgepole pine stands in terms of merchantable volume will be increased, and the rotation ages required to produce large-sized round wood products will be reduced.
It is of even greater interest to note that response in diameter growth to thinning from below has been almost immediate, even in dense semi-mature stands, and the rate of growth following thinning has been j ust as high as for comparable red pine or ponderosa pine stands. Although some stimulation in diameter growth was evident in all lodgepole pine stands which were thinned, by far the greatest response was produced when dense stands were treated at a very young age.
Although the evidence is limited and somewhat inconclusive, it does appear that over the period of a rotation a heavily thinned young stand will produce a greater average height in the crop stems.
In the light of the information available to date it may be concluded that there are no inherent limitations peculiar to this species which prevent it from producing merchantable poles in a 100-year rotation provided the necessary steps are taken to thin dense stands at a young age. The economic factors in force at the present time limit thinning to only the most rudimentary of treatments on the most highly productive sites. However, even such crude treatments can undoubtedly increase the supplies of merchantable lodgepole pine available for future use. As economic conditions become more favourable, these simple silvicultural measures may be intensified and additional information which will be available at that time can be used to refine the treatments.
Perhaps the most significant conclusion which may be drawn from these studies is the necessity for research into methods of harvest cutting which will produce low-density regeneration stands yielding merchantable products without the necessity for intermediate cutting; and of equal importance is the prevention of fires in the lodgepole pine areas.
SUMMARY
In order to develop methods of thinning for dense lodgepole pine stands in Alberta, the Forestry Branch undertook in 1937 a program of research into the growth and development of this species in both treated and untreated stands. A total of 73 permanent sample plots was established during the period 1937-1940. Approximately 15 years of remeasurement data are available from these plots covering a range of stand ages from 5 to 90 years. An analysis of these data has shown that diameter growth responds to thinning at all ages and densities of stands, with the best results occurring in very young stands. Natural mortality is not subnormal and if dense reproduction stands can be reduced to an approximate stocking of 1,500 stems per acre the subsequent development of merchantable material will be adequate. The studies also show that often the stand may be reduced to 50 per cent of full density by low thinnings without any sacrifice of current growth.
Brief recommendations of thinning methods most likely to prove successful under prevailing economic conditions in Alberta have been made. The studies will be continued, and as economic circumstances warrant, the suggested thinning practice will be improved.
25

REFERENCES
BLYTH, A. W. 1954. The effect of partial cutting in even-aged lodgepole pine , tands. Canada, Dept. Northern Affairs and National Resources. Forestry Branch, Forest Research Division, Unpublished MS.
CHAPM.\N, H. H. and W. H. MEYER. 1 949. Forest mensuration. xiii + 522 pp. 1st Ed. McGraw-Hill Book Co. Inc. Toronto.
CROSSLEY, D. I. 1 955. Mechanical scarification and strip clearcutting to induce lodgepole pine regeneration. Canada, Dept. Northern Affairs and N ational Resources. Forestry Branch, For. Res. Div. Tech. Note No. 34.
CROSSLEY, D. I. 1 956. The chemical control of density in young stagnating stands of lodgepole pine. Canada, Dept. Northern Affairs and Kational Resources. Forest.ry Branch, For. Res. Div. Tech. Note No. 39.
GAINES, E. M. and E. S. KOTOK. 1954. Thinning ponderosa pine in the southwest. United States Dept. Agriculture, Rocky Mountain Forest and Range Experiment Station, Fort Collins, Colorado. Station Paper No. 17.
MEYER, W. H. 1 938. Yield of selectively cut stands of ponderosa pine. United States Dept. Agriculture, Washington, D.C. , Tech. Bull. No. 630.
ROBERTSON, vV. M. and A. M ULLOY. 1 946. Permanent sample plot methods. Canada, Dept. Mines and Resources, Dom. For. Servo
SMITHERS, L. A. 1 954. Thinning in red and white pine stands at Petawawa Forest Experiment Station. Canada, Dept. Northern Affairs and National Resources, Forestry Branch, For. Res; Div., Silv. Res. Note No. 105.
SMITHERS, L. A. 1 955. Assessment of site productivity in dense lodgepole pine stands· Canada, Dept. Northern Affairs and National Resources, Forestry Branch, For. Res. Div. Tech. Note No. 30.
26