Embed Size (px)
Citation preview
University of San Diego University of San Diego
Digital USD Digital USD
Dissertations Theses and Dissertations
2005-04-01
Think First for Kids (TFFK): A Longitudinal Analysis of a School-Think First for Kids (TFFK): A Longitudinal Analysis of a School-
Based Injury Prevention Curriculum Based Injury Prevention Curriculum
Dorothy L. Zirkle PhD University of San Diego
Follow this and additional works at: https://digital.sandiego.edu/dissertations
Part of the Nursing Commons
Digital USD Citation Digital USD Citation Zirkle, Dorothy L. PhD, "Think First for Kids (TFFK): A Longitudinal Analysis of a School-Based Injury Prevention Curriculum" (2005). Dissertations. 330. https://digital.sandiego.edu/dissertations/330
This Dissertation: Open Access is brought to you for free and open access by the Theses and Dissertations at Digital USD. It has been accepted for inclusion in Dissertations by an authorized administrator of Digital USD. For more information, please contact [email protected].

UNIVERSITY OF SAN DIEGO Hahn School of Nursing and Health Science DOCTOR OF PHILOSOPHY IN NURSING
THINK FIRST FOR KIDS (TFFK): A LONGITUDINAL ANALYSIS
OF A SCHOOL-BASED INJURY PREVENTION CURRICULUM
by
Dorothy L. Zirkle
A Dissertation presented to the
FACULTY OF THE HAHN SCHOOL OF NURSING AND HEALTH SCIENCE
UNIVERSITY OF SAN DIEGO
In partial fulfillment of the
requirements for the degree
DOCTOR OF PHILOSOPHY IN NURSING
April/2005
Dissertation Committee
Cynthia D. Connelly, PhD., RN, Chair
Anita Hunter, PhD, RN, CPNP
Edward A. Neuwelt, MD
Reproduced with permission of the copyright owner. Further reproduction prohibited without permission.

Copyright © 2005
by
Dorothy L. Zirkle
Reproduced with permission of the copyright owner. Further reproduction prohibited without permission.
Abstract of the Dissertation
THINK FIRST FOR KIDS (TFFK): A LONGITUDINAL ANALYSIS
OF A SCHOOL-BASED INJURY PREVENTION CURRICULUM
by
Dorothy L. Zirkle
UNIVERSITY OF SAN DIEGO Hahn School of Nursing and Health Science DOCTOR OF PHILOSOPHY IN NURSING
Despite years of legislative and public health efforts, unintentional injury
continues to be a serious public health problem and is identified as a major priority on the
national health care agenda. The high incidence of unintentional injury in the middle
childhood age group is of particular interest due to immaturity of the cognitive, psycho
social, and neurophysical dimensions of the child. The purpose of this study was to
examine the effectiveness of a school-based curriculum on improving knowledge and
self-reported safety behaviors over time among ethnically and socioeconomically diverse
elementary school aged children.
The social, cultural, cognitive, and behavioral learning theory of Constructivism
informed the study. The learning theories of Vygotsky, Bruner, and Piaget served as the
theoretical frameworks for the constructivism theory and helped professionals understand
how, why, and when children are cognitively, psychologically, socially, and
developmentally at greatest risk for injury and most receptive to learning.
Reproduced with permission of the copyright owner. Further reproduction prohibited without permission.

A three-year longitudinal, matched comparative, with repeated measures, cohort
design was used to evaluate the effectiveness of TFFK intervention. The data to be
analyzed were from a quasi-experimental research design. Culturally diverse elementary
schools in high injury-risk areas from San Diego Unified and Cajon Valley during the
1999-2002 academic school years were recruited for the study. Ten schools participated,
five schools were identified as intervention schools to receive TFFK and five schools that
most closely matched the intervention schools on SES, school defined and grade specific
reading scores, race/ethnicity composition, and school district were the controls, thus
creating five pairs of matched schools. The original cohort of 1,762 students participating
in the paired intervention/control study were followed over the three-year longitudinal
study.
To determine the effectiveness of the TFFK program, a pre-/post-measure design
was employed. The primary outcome was a change in total test score from the pre-test to
the post-measure, with the post- measure being administered after the intervention. The
analysis of the pre-existing data was conducted using the Statistical Package for the
Social Sciences (SPSS) (Version 12.0) and included descriptive, univariate and General
Linear Model (GLM), multivariate analysis of variance methods, to assess injury-related
knowledge and safety behavior change among elementary school subjects receiving the
Think First for Kids (TFFK) curriculum compared to control subjects. The overall effect
of the curriculum was tested using a GLM repeated measures, analysis of variance
procedure for each Cohort A, B, and C.
Data analysis of the posttest measure scores demonstrated that the TFFK
curriculum led to a statistically significant increase in knowledge and self-reported safety
Reproduced with permission of the copyright owner. Further reproduction prohibited without permission.

behaviors. The overall trend was for greater improvement in intervention school students
when compared to control school students.
It is important to recognize that schools not only have direct access to young
children, but also have the unique capacity to affect the lives of staff, parents, and the
entire community. This study provides empirical evidence that early school-based theory-
driven injury prevention education has a positive effect on young children.
Reproduced with permission of the copyright owner. Further reproduction prohibited without permission.
DEDICATION
In memory of my ThinkFirst colleagues Molly and Tara.
This study is dedicated to the Voices for Injury Prevention.
You make a difference every day
and inspire others to follow.
You are heroes of a special kind.
ii
Reproduced with permission of the copyright owner. Further reproduction prohibited without permission.

ACKNOWLEDGMENTS
I would like to express my appreciation to my dissertation chair, Cynthia D.
Connelly, PhD, RN. I am sincerely grateful for her guidance throughout the dissertation
process. Her encouragement and support have helped me establish my research focus and
appreciate the role of the nurse scientist. Professor Connelly exemplifies nursing scholar
ship.
I wish to thank Anita Hunter, PhD, RN, CPNP not only for her contribution to this
dissertation, but for her support and guidance throughout various stages of my doctoral
studies. She has played a major role in my scholarly growth and development. Professor
Hunter serves as a wonderful role model for a nursing educator. I would also like to thank
Edward E. Neuwelt, MD for the generosity of time and knowledge regarding this
research. His understanding and value of the arena of injury prevention were greatly
appreciated.
The contribution of my friend and colleague Azamoush Maroufi, MPH epidemiol
ogist to this effort was extremely valuable. Her understanding of statistical analysis and
computer wizardry were greatly appreciated. Even more valuable were her personal
attributes of patience, warmth, and inner strength.
To Shelly Atkinson, Tim Boice, and Marianne Branson my deep gratitude for
your devotion to injury prevention and energy provided to this study. Thank you for your
encouragement and tolerance. Their support during this time has been unconditional. A
iii
Reproduced with permission of the copyright owner. Further reproduction prohibited without permission.

heartfelt thank you to all the principals, teachers, and school nurses who contributed to
this study. A special thanks is extended to the participants, whose enthusiasm and interest
made this study worthwhile.
My love and gratitude are expressed to my family for their support, understanding,
and encouragement they gave me throughout this endeavor. To my sister Margie, thank
you for your creative design on the cover of this manuscript. To my daughters Jennifer
and Megan, thank you for your love, patience, sacrifice, and faith in me. The two of
you assisted with endless editing, sleepless nights, homework deadlines, and were
instrumental in my successful completion of this degree.
Finally, my deepest appreciation is to Louise, who provided the love, guidance,
advice, and never ending encouragement needed to accomplish this task. Thank you for
loving me.
iv
Reproduced with permission of the copyright owner. Further reproduction prohibited without permission.
TABLE OF CONTENTS
Page
DEDICATION........................................................................................................... ii
ACKNOWLEDGMENTS................................................................................................. iii
LIST OF TABLES......................................................................................................... x
LIST OF FIG U RES....................................................................................................... xii
LIST OF APPENDICES .................................................................................... xiv
Chapter
I. INTRODUCTION................................................................................................ 1
Overview of the Problem: Unintentional Injury ............................. 3
Overview of the Problem: Middle Childhood orPrimary Years (Ages 6-12)..................................... 5
Think First National Injury Prevention Foundation...................................... 7
Think First for Kids ......................................................................................... 8
Theoretical Framework............................................................................. 9
Significance of the Study ................................................................. 11
Purpose of the Study......................................................................................... 12
H ypotheses....................................................................................................... 12
Implications for Nursing.................................................................................. 12
H. LITERATURE REV IEW ................................................................................... 14
v
Reproduced with permission of the copyright owner. Further reproduction prohibited without permission.

Chapter Page
EL (continued)
Learning and Social, Cognitive, and BehavioralMaturation ....................................................................................................... 14
Jean Piaget’s Child Development Theory .............................................. 15
Vygotsky’s Sociocultural Theory........................................................ 17
Erikson’s Psychoanalytic Theory ............................................................. 18
Kohlberg’s Moral Development Theory ................................................. 21
Literature Review of the Problem ................................................................. 23
Childhood Injuries .................................................................................... 25
Injury Prevention for Low Income and/orMinority Populations ........................................................................... 27
Injury Prevention and School Health Education .......................................... 29
Nonschool-Based Childhood Injury PreventionPrograms........................................................................................................... 36
Synthesis of Literature .................................................................................... 37
ID. METHODOLOGY .................................................................................. 42
Hypotheses....................................................................................................... 42
Study Design..................................................................................................... 42
Sample and Sampling...................................................................................... 43
Think First for Kids Curriculum Intervention .............................................. 45
Operational Definitions .................................................................................. 50
M easures........................................................................................................... 51
Data Collection Procedures ............................................................................ 53
Data A nalysis................................................................................................... 55
vi
Reproduced with permission of the copyright owner. Further reproduction prohibited without permission.

Chapter Page
El. (continued)
Descriptive Statistics ................................................................................ 55
Pre-/Post-Measures........................................................................... 56
C ohorts.......................................... 56
Univariate................................................................................................... 57
Multivariate ............................................................................................... 57
Protection of Human Subjects ....................................................................... 58
IV. RESULTS......................................................................................................... 59
Characteristics of the Sam ple.......................................................................... 59
Findings Related to Hypotheses...................................................................... 60
Racial/Ethnic F indings........................................................................... 67
Fourth G rade..................................................................................................... 67
General Linear Model Repeated Measures A nalysis.................................... 68
Retrospective Power Analysis ........................................................................ 69
Cohort A ........................................................................................................... 69
The Within-Subjects Factors ................................................................. 69
The Between-Subjects Factors ............................... 70
Covariates................................................................................................... 70
Descriptive Statistics ................................................................................ 71
Multivariate T ests...................................................................................... 71
Tests of Within-Subjects Effects ............................................................. 71
Tests of Between-Subjects E ffects........................................................... 74
vii
Reproduced with permission of the copyright owner. Further reproduction prohibited without permission.

Chapter Page
IV. (continued)
Profile Plots .................................................................................... 74
Cohort B .................................................................................................. 80
The Within-Subjects Factors .................................................................... 80
The Between-Subjects Factors................................................................. 81
Covariates.......................................................................................... 81
Descriptive Statistics ......................................................................... 81
Multivariate T ests...................................................................................... 83
Tests of Within-Subjects Effects ............................................................. 83
Tests of Between-Subjects E ffects........................................................... 84
Profile Plots ............................................................................................... 84
Cohort C ........................................................................................................... 90
The Within-Subjects Factors ................................................................... 90
The Between-Subjects Factors .............. 91
Covariates.................................................... 91
Descriptive Statistics ............................................................. 91
Multivariate T ests...................................................................................... 92
Tests of Within-Subjects Effects ............................................................. 92
Profile Plots ............................................................................................... 94
B ehavior........................................................................................................... 100
Summary Behavioral Mean Scores by C ohort........................................ 100
Behavior Cohort A .................................................................................... 101
viii
Reproduced with permission of the copyright owner. Further reproduction prohibited without permission.

Chapter Page
IV. (continued)
Behavior Cohort B ................................................................. 103
Behavior Cohort C .................................................................................... 107
Summary..................................................................................................... 110
V. CONCLUSIONS, IMPLICATIONS, ANDRECOMMENDATIONS .................................................................................... 112
Conclusions ..................................................................................................... 113
Limitations of the S tudy .................................................................................. 118
Implications ...................................................................................... 118
Implications to Nurses .................................................................................... 119
Recommendations ............................................................................. 120
REFERENCES .............................................................................................................. 123
ix
Reproduced with permission of the copyright owner. Further reproduction prohibited without permission.

LIST OF TABLES
Table Page
1. Participating Paired Intervention and Control Schools ................................. 44
2. Think First for Kids Objectives and Delivery Timeline ............................... 47
3. Matrix of Longitudinal Student Cohort Progression(Intervention/Control) .................................................... 54
4. Students by Grade Level, Group, and Y e a r .................................................... 60
5. Mean Scores by Cohort and 95% Confidence IntervalsGroup, and Year: TFFK Survey, 2000-2002 .................................................. 62
6. Mean Scores for White Students: Cohorts A, B, and Cby Group: TFFK Survey, 2000-2002 .......................................... 64
7. Mean Scores for Black Students: Cohorts A, B, and Cby Intervention: TFFK Survey, 2000-2002 .................................................. 65
8. Mean Scores for Hispanic Students: Cohorts A, B, and Cby Group: TFFK Survey, 2000-2002 ...................................................... 66
9. Between-Subjects Factors for Cohort A ........................................................ 71
10. Descriptive Statistics for Cohort A ............................................................. 72
11. Tests of Within-Subjects Effects for Cohort A ............................................... 73
12. Tests of Within-Subjects Effects for Cohort A:Measure and Score............................................................................................. 73
13. Group * Year * Prepost for Cohort A: Measureand S c o re ........................................................................................................... 75
14. Between-Subject Factors for Cohort A ............................................................ 81
15. Descriptive Statistics for Cohort B .................................................................. 82
x
Reproduced with permission of the copyright owner. Further reproduction prohibited without permission.

Table Page
16. Tests of Within-Subjects for Cohort B:Measure and Score.................................................................................... 83
17. Tests of Between-Subjects for Cohort B:Measure and Score............................................................................................. 84
18. Between-Subject Factors for Cohort C .......................................................... 91
19. Descriptive Statistics for Cohort C ............................................................ 92
20. Tests of Within-Subjects Effects for Cohort C:Measure and Score............................................................................................. 93
21. Group * Year * Prepost for Cohort C:Measure and Score............................................................................................. 94
22. Tests of Within-Subjects Effects for BehaviorCohort A: Measure and Score .......................................................................... 101
23. Tests of Within-Subj ects Effects for BehaviorCohort B: Measure and Score ............................................................. 104
24. Tests of Within-Subjects Effects for BehaviorCohort C: Measure and Score .......................................................................... 108
25. Cohort A by Grade Level, Group, and Year............ 197
26. Cohort B by Grade Level, Group, and Year ............... 200
27. Cohort C by Grade Level, Group, and Year..................................................... 203
xi
Reproduced with permission of the copyright owner. Further reproduction prohibited without permission.

LIST OF FIGURES
Figure Page
1. Cohort A’s profile plots of the year by prepost bygroup interaction m eans.................................................................................... 76
2. Cohort A’s profile plots of the year by group byprepost interaction means .................................................... 77
3. Cohort A’s profile plots of prepost by group byyear interaction m eans..................................................................................... 78
4. Cohort A’s overall group by year interaction p lo t ......................................... 80
5. Cohort B ’ s profile plots of the year by prepost bygroup interaction m eans............................................................................... 86
6. Cohort B’s profile plots of the year by group byprepost interaction means ................................................................................ 87
7. Cohort B’s profile plots of the prepost by groupby year interaction m eans.................................................................................. 88
8. Cohort B ’ s overall group by year interactionprofile plot ................................................................. 90
9. Cohort C’s profile plots of the year by prepost bygroup interaction m eans.................................................................................... 95
10. Cohort C’s profile plots of the year by group byprepost interaction means ................................................................................ 96
11. Cohort C ’ s profile plots of the prepost by groupby year interaction m eans.................................................................................. 97
12. Cohort C’s overall group by year interactionprofile p l o t ......................................................................................................... 99
Reproduced with permission of the copyright owner. Further reproduction prohibited without permission.
Figure Page
13. Cohort A’s behavioral scores — profile plots ofthe prepost by group by year interaction m eans............................................ .. 102
14. Cohort B ’s behavioral scores — profile plots ofthe prepost by group by year interaction m eans.............................................. 105
15. Cohort C ’ s behavioral scores — profile plots ofthe prepost by group by year interaction m eans.............................................. 109
16. Cohort A gender by group: TFFK Survey, 2000-2002 ................................... 198
17. Cohort A race/ethnicity by group: TFFK Survey,2000-2002 ......................................................................................................... 198
18. Cohort B gender by group: TFFK Survey, 2000-2002 ................................... 201
19. Cohort B race/ethnicity by group: TFFK Survey,2000-2002 201
20. Cohort C gender by group: TFFK Survey, 2000-2002 ................................... 204
21. Cohort C race/ethnicity by group: TFFK Survey,2000-2002 204
xiii
Reproduced with permission of the copyright owner. Further reproduction prohibited without permission.

LIST OF APPENDICES
Appendix Page
A. Leading Causes of Injury Death by Age Group —Unintentional, 2001 ..................................... 132
B. Leading Causes of Death by Age Group, 2001 .............................................. 134
C. National Estimates of the 10 Leading Causes of Nonfatal Injuries Treated in Hospital EmergencyDepartments, United States, 2002 ............................................................. 136
D. Think First for Kids: Directors/Educators Training Guide .................... 138
E. Think First for Kids: Pre- and Posttest, Grades 1Through 3 ............................................................................................................ 159
F. Think First for Kids: Fourth Grade S u rvey .................................................... 185
G. Permission Letter from Sharp Rehabilitation Services .................................. 190
H. University of San Diego Institutional Review Board ................ 192
I. Characteristics of Cohort A ........................... ........... 196
J. Characteristics of Cohort B ............................................................................... 199
K. Characteristics of Cohort C ............................................................................... 202
xiv
Reproduced with permission of the copyright owner. Further reproduction prohibited without permission.

CHAPTER I
INTRODUCTION
Despite years of legislative and public health efforts, unintentional injury
continues to be a serious public health problem and is identified as a major priority on the
national health care agenda (National Center for Injury Prevention and Control [NCIPC],
2000). Among children aged 1 to 14, unintentional injuries account for more deaths than
the next five leading causes of cancer, congenital abnormalities, pneumonia, heart
disease, or homicide. In addition, more than 1 million children seek medical care and
between 40,000 to 50,000 children are permanently injured due to unintentional injury
each year (National Safety Council, 2004a). It is widely recognized that injuries are
responsible for more deaths and disability among young people than any other cause of
death for children ages 1 to 14 (California Department of Health Services, 2000). Despite
this knowledge, childhood injuries continue to occur. The question must be asked, why?
Is it the lack of parental and child injury prevention education, peer group influence,
normal developmental limitations regarding risk perceptions and decision-making, or
other explanations?
Several interventions have been developed and implemented with school-based
programs considered to be an ideal method, yet few of these programs have been
rigorously evaluated over time (Faelker, Pickett, & Brison, 2000). One such program is
1
Reproduced with permission of the copyright owner. Further reproduction prohibited without permission.

2
Think First for Kids (TFFK) an interactive, literacy based injury prevention curriculum,
based upon the principles that exposure to similar messages repeated over time during the
early years of education enhances learning and behavioral changes. Systematic evaluation
of the effectiveness of interventions over time is required to make the public policy and
resource allocation decisions needed to reduce injuries (Greene et al., 2001).
Prior research has found significant health disparities in the field of injury
prevention for low income and minority populations (Faelker et ah, 2000; Kennedy &
Rodriguez, 1999). Although unintentional injury effects all populations, there is consider
able variation in injury rates among children from different racial/ethnic groups and
socioeconomic (SES) factors. For example, low-income neighborhoods have been found
to be associated with an increased risk of injury (Durkin, Olsen, Barlow, Virella, &
Connolly, 1998), and childhood mortality has been found to be higher among minority
and low income children (Wise, Koyelchuck, Wilson, & Mills, 1985). Therefore, in order
to develop culturally appropriate prevention strategies, it is imperative to examine these
differences by including diverse populations. This TFFK study was conducted in a high
injury-risk, culturally, and economically diverse population and provides an opportunity
to examine these associations.
The purpose of this study was to examine the effectiveness of a school-based
curriculum on improving knowledge and self-reported safety behaviors over time among
ethnically and socioeconomically diverse elementary school aged children.
Reproduced with permission of the copyright owner. Further reproduction prohibited without permission.

3
Overview of the Problem: Unintentional Injury
Unintentional injury is the leading cause of death in children from 1-21 years of
age in the United States (NCIPC, 2003) (see Appendix A). In adolescents, ages 10-19,
unintentional injury accounts for 60% of deaths whereas violence (homicide and suicide)
accounts for 40% (NCIPC, 1999). Approximately 22 million children are injured in the
United States each year (Synovitz, Mickalide, Bryn, & Gallagher, 2000), and according to
the National Safety Council (2004), in 2001 the odds of dying from an unintentional
injury were 1 in 2,808. In addition, millions of children are incapacitated by unintentional
injuries, with many suffering lifelong disabilities.
For every childhood death caused by injury, there are approximately 34 hospital
izations, 1,000 emergency department visits, and many more visits to private clinics and
injuries treated at home (National Safety Council, 2004a). The total number of emergency
department visits in the United States in 2000-2001 was 110.2 million, of those 39.2
million were injury related.
The San Diego County Report Card (SDCRC) (2003) documented for the year
2001 arate of 314.7/100,000 children 18 years old and younger hospitalized as aresult of
unintentional injuries, a decrease from the rate of 355.6 per 100,000 in 2000 (National
Safety Council, 2004a). In the age group of 15 and under, there were 40 fatal uninten
tional injuries in 2000 and 36 in 1999; again stable numbers over the past 6 years. Indeed,
injuries to children in this age group constitute a major public health concern, accounting
for more deaths among children aged 1 to 14 than the next five most common causes of
deaths. Each year, between 40,000 and 50,000 early and middle childhood children are
permanently injured and more than 1 million seek medical care because of unintentional
Reproduced with permission of the copyright owner. Further reproduction prohibited without permission.

4
injury (Greensher, 2001). In comparison to general statistics for the state of California
during 1998, San Diego County had a higher rate of unintentional injury. San Diego
County data on injury and injury-related deaths by race/ethnicity reveal a higher rate
among black youth compared to other races/ethnicities (Black - 471.2/100,000, White -
346.2/ 100,000, Hispanic - 340.4/100,000, and Asian/Other - 327.5/100,000) (SDCRC,
2003).
Coupled with the magnitude of human suffering and loss of life is the astronomi
cal financial burden. Direct medical care, rehabilitation, and lost income are the major
costs associated with injuries. By the late 1990s, injury costs were estimated at more than
$224 billion annually, an increase of 42% over the 1980s (Watts & Eyster, 1992). It is
estimated that 40% of the health care dollar spent is consumed by the direct or indirect
medical cost of injury, amounting to $100 billion per year (Watts & Eyster). Similar to
most health problems, the cost of prevention is far less than the cost of treatment.
Benjamin (2004) states that “in the year 2000 alone, injury was responsible for 10% of
health care expenditures — more that $117 billion, and it is the leading cause of death for
Americans younger than 35 years” (p. 512) (see Appendix B). Yet, many American
policymakers do not perceive injury as a public health problem. Benjamin goes on to state
that policymakers still believe in the accident paradigm, in that injuries are an act of fate,
and while it makes sense to be more careful, injuries will occur despite a person’s best
effort. However, injuries should not be considered “accidents,” as this term implies
randomness and lack of predictability. From an epidemiological perspective, injuries are
similar to all diseases such that they have a specific causal model, which contains an
interaction between a host, an agent or vector, and the environment (Gordis, 2000). In
Reproduced with permission of the copyright owner. Further reproduction prohibited without permission.

5
addition, economists are predicting a double-digit incline in health care expenditures, and
people are looking for ways to address disparities in health care. Benjamin (2004)
suggests, “that the solution is injury prevention” (p. 512).
Overview of the Problem: Middle Childhood or Primary Years (Ages 6-12)
The high incidence of unintentional injury in this middle childhood age group is
of particular interest due to immaturity of the cognitive, psychosocial, and neurophysical
dimensions of the child. Harris and Liebert (1984) define the years from 6 to 12 the years
of middle childhood. According to Dixon and Stein (1992), middle childhood is charac
terized by “a time set aside, in all cultures for children to leam those skills that are
necessary for survival and productive living” (p. 317). It is during the stages of middle
childhood in which children of developing countries and primitive societies become
competent in obtaining food, shelter, and clothing. Middle childhood could just as well be
referred to as the elementary school years, because the years from 6 to 12 correspond
fairly closely to the school grades first through sixth in the United States. In our complex
society in the United States, children develop competence in reading, writing, and
arithmetic. They acquire the basic knowledge necessary to master the demands of adult
life, both within the home and in the community. The cognitive, social, and emotional
growth seen during this period follows the near completing of central nervous system
growth by the age of 7 years and precedes the rapid growth of the reproductive organs in
early adolescence.
Although these are important years in a child’s life, they are relatively calm ones.
Behind is the period of rapid physical growth of infancy and toddlerhood; the period of
Reproduced with permission of the copyright owner. Further reproduction prohibited without permission.

6
rapid physical growth of early adolescence is still to come. The dramatic improvements in
motor abilities and in language use and understanding are also in the past. But some very
crucial changes occur during middle childhood. There is a striking increase in intellectual
competence in the child’s ability to make use of his/her brain. There is a similar increase
in the fund or knowledge that the brain holds. And there is a significant change in the
child’s relationships with others. When a child enters middle childhood, he/she is
dependent on his/her parents and on other adults, not just for nutrition and shelter, but
also for emotional support and companionship. By the end of middle childhood, adults
have become much less central in his/her lives. Social and emotional needs are filled to a
large extent by friends and peer groups (Harris & Liebert, 1984).
Children enter middle childhood looking and acting much more similar to one
another then they do when they leave it. Differences in size, shape, facial features,
intellectual ability, talents, and inclinations are not as evident in the early school years as
in the later ones. It is really in middle childhood, more than at any time since birth, that
the child becomes a unique individual (Harris & Liebert, 1984). Due to the child’s
physical, social, and psychological changes and the development of independent decision
making, it is necessary to implement school based injury prevention education programs.
Injury prevention has become a major public health goal in the United States
(Department of Health & Human Services, 2000), and school-based programs are
considered to be an ideal method for the prevention of injuries, few programs are
rigorously evaluated (Davidson et al., 1994). Techniques to evaluate community health
improvement methods need to be refined and disseminated so that other communities can
leam from and duplicate successful strategies (Schall, 1994). In addressing this need, this
Reproduced with permission of the copyright owner. Further reproduction prohibited without permission.
7
study employed rigorous evaluation techniques to assess the TFFK injury prevention
program. This rigorous evaluation yielded evidence to support recommendations for
changes in policy regarding injury prevention, with the intent of decreasing injury
occurrence and thus decreasing the financial burden of injuries.
This investigation addressed the primary prevention of injury through participa
tion in the TFFK injury prevention program. Think First for Kids promotes injury-related
knowledge and behavior change among elementary school-aged children in San Diego,
CA, and follows the CDC and Committee on Comprehensive School Health recommen
dation that students receive sequential, comprehensive, and evaluated school health
programs (Gielen, 1992; National Commission on the Role of the School, 1990).
Think First National Injury Prevention Foundation
Think First has its roots in two regional injury prevention programs developed by
neurosurgeons in Missouri and Florida in 1979. The programs, called Heads Up Missouri
(1979) and Feet First First Time (1986), promoted brain and spinal cord injury prevention
for high school students. By 1986, a national effort to expand these programs was
underway, sponsored by the American Association of Neurological Surgeons (AANS)
and the Congress of Neurological Surgeons (CNS). Between 1986 and 1990, 100
programs became active under the auspices the National Head and Spinal Cord Injury
Prevention Program working in partnership with neurosurgeons throughout the country in
response to the high incidence of traumatic brain and spinal cord injuries and subsequent
disabilities among ages 10-24. In 1990, the name “Think First National Injury Prevention
Reproduced with permission of the copyright owner. Further reproduction prohibited without permission.

8
Foundation” was adopted and a separate charitable foundation was formed (Think First
National Injury Prevention Foundation, 2005).
The mission of the Think First National Injury Prevention Foundation is to
prevent brain, spinal cord, and other traumatic injuries through the education of individu
als, community leaders, and creators of public policy. The foundation provides leadership
for approximately 260 Think First Chapters across the country and 40 chapters abroad
that work with schools and community groups in their local areas to educate youth about
injury prevention. One of its programs, Think First for Teens, comprises a peer-led
presentation that has been found to increase knowledge of the risks of brain and spinal
cord injury and safety measures that can reduce the occurrence of injury (Avolio, Ramsey,
& Neuwelt, 1973; Eyster & Watts 1992; Neuwelt, Coe, Wilkinson, & Avolio, 1989).
Think First for Kids
It has been shown that adolescents rarely change their behavioral practices, such
as seat belt use, without long-term education and/or enforceable legislation (Gielen, 1992;
Nichols, 1994). With this in mind, in 1994 the Think First Foundation created a task force
to search nationwide for early intervention injury prevention programs targeting elemen
tary school students. After an exhaustive literature review and program search, the
foundation contracted with a curriculum specialist to assist in the development of a
teacher-taught, parent-involved, integrated injury prevention program to educate children
in grades 1-3 about the risks of traumatic brain and spinal cord injuries and the
importance of good safety habits.
Reproduced with permission of the copyright owner. Further reproduction prohibited without permission.

Think First for Kids (TFFK), developed in 1996, is an interactive, literacy-based
injury prevention curriculum. Think First for Kids is based on the principles that early
education helps increase understanding and awareness, repetition over time leads to
behavior change, and involvement of student-teacher-parents increases success. The
curriculum is grounded in applied learning and behavioral theories, which suggest that
varied messages delivered over time increase understanding, knowledge retention, and
sustained behavior. The TFFK curriculum integrates math, literacy, science, and health
objectives. In addition, safety components were developed to enhance interest, learning,
and acceptance of safety measures. Accordingly, the TFFK curriculum has been orga
nized into six safety behavior units taught in one lesson a week over a 6-week span.
Learning strategies include role-playing, hands-on activities, reading, math, visual
reinforcement, and discussion (Think First National Injury Prevention Foundation, 2005).
Theoretical Framework
To understand the relationship between the literature related to childhood injuries
and prevention, the relationship between child development and injury incidence, and to
develop appropriate interventions to address one of the major gaps in the literature, the
theory of child development was used. Theories of child development have traditionally
provided a foundation for pedagogy in early childhood education and early intervention
and are known to be extremely practical (Peltzman, 1998) because knowledge and
cognitive processing are critical to healthy development (Bruner, 1960). Child develop
ment theory is an integrated collection of beliefs about the maturation process of
children’s perception, thinking, decision-making, and actions. There are several distinct
Reproduced with permission of the copyright owner. Further reproduction prohibited without permission.

10
sets of beliefs, or theories, about how children grow and develop. One theory holds that
children simply mature as they grow older (Gesell, 1933), another posits the environment
shapes what children become (Bandura, 1989); while others put forth genetics and
environment interact to influence learning and behavior (Peltzman, 1998). Trawick-Smith
(2000) points out that no single, universally accepted theory of child development exists.
For the purpose of this study, the social, cultural, cognitive, and behavioral
learning theory of constructivism served as the framework (Piaget, 1952). The learning
theories of Vygotsky (1965), Bruner (1960), and Piaget (1952) were the guiding princi
ples of this theory to assist professionals in understanding how, why, and when children
are at greatest risk for injury and most receptive to learning. Constructivism has been
selected for this analysis because it is an epistemology, a philosophical explanation about
the nature of knowledge, describing how one attains, develops, and uses cognitive
processes. It offers a bridge between cognition, learning, and behavior. Constructivist
theory is a general framework for instruction based upon the study of cognition. Much of
the theory is linked to child development research, especially that of Piaget. Many regard
constructivism as a metatheory, in that it encompasses a number of cognitive and other
theories of learning. Multiple theories, such as those of Piaget and Vygotsky, have been
proposed to explain the cognitive processes that are involved in constructing knowledge.
Constructivism is based on the fundamental assumption that people create knowledge
from the interaction between their existing knowledge or beliefs and the new ideas or
situation they encounter (Bruner, 1960). In this sense, most constructivists support the
need to foster interactions between students' existing knowledge and new experiences.
Reproduced with permission of the copyright owner. Further reproduction prohibited without permission.
11
Constructivist educational approaches are primarily used within the middle childhood
years (Bruner, 1960).
In summary, although the child becomes more independent of parental influence
in middle childhood, critical thinking skills are in an early stage of development (Crain,
1980). It is possible that this paucity of critical thinking skills coupled with increased
independence from parents results in a higher frequency and severity of unintentional
injury than among younger children.
Significance of the Study
Although injury prevention has become a major public health goal in the United
States (U.S. Department of Health & Human Services, 2000) and school-based programs
are considered to be an ideal method for the prevention of injuries, few programs have
been rigorously evaluated (Davidson et al., 1994). Techniques to evaluate community
health improvement methods need to be refined and disseminated so that other communi
ties can leam from and duplicate successful strategies (Schall, 1994). In addition,
epidemiologic studies have reported a greater risk of both fatal and nonfatal injuries
observed in children and have been associated with lower socioeconomic factors, young
age, and minority status (Faelker et ah, 2000; Kennedy & Rodriguez, 1999).
There is limited research on examining program effectiveness by SES, age, and
race/ethnicity. In this study, in an attempt to fill this gap, the relationship of the program,
effectiveness by SES, age, and race/ethnicity was examined.
Reproduced with permission of the copyright owner. Further reproduction prohibited without permission.

12
Purpose of the Study
The overall purpose of this study was to evaluate the effectiveness of the elemen
tary school injury prevention curriculum called Think First for Kids (TFFK) in San Diego
County on improving knowledge and self-reported safety behaviors over time among
ethnically and economically diverse elementary school-aged children. This study
employed rigorous evaluation techniques to assess the TFFK injury prevention program
over time which yielded evidence to support recommendations for changes in policy
regarding injury prevention, with the intent of decreasing injury occurrence and thus
decreasing the financial burden of injuries.
Hypotheses
The null hypotheses of this study were: (a) students participating in the TFFK
curriculum do not show a significant increase in self-reported knowledge and safety
behaviors compared to students who do not receive the curriculum; and (b) students who
receive the curriculum repeatedly do not show a significant difference in retention of
knowledge over time with repeated curriculum interventions in the time period of years
2000- 2002 .
Implications for Nursing
It is important to recognize that schools not only have direct access to young
children, but also have the unique capacity to affect the lives of staff, parents, and the
entire community. The increasing awareness of childhood injuries as an important public
health problem in the U.S. and around the world has important implications for nurses in
community, clinical practice, and research settings. In clinical practice, injury prevention
Reproduced with permission of the copyright owner. Further reproduction prohibited without permission.

13
strategies focus on sociocultural issues and behavioral change in counseling with children
and families. School-based education of children may help to broaden and reinforce
counseling of children.
The collaborative research in this study provides avenues for nurses, community
educators, and practitioners who may have unrecognized opportunities to join in a
community effort to reduce morbidity and mortality. These opportunities include
developing nursing interventions, conducting evaluative research, and creating injury
surveillance systems.
The focus of Healthy People 2010 on the prevention of injury and targeting health
promotion is central to nursing practice. Linkages with community hospitals, nurse
researchers, clinical acute care nurses, community nurses, trauma nurses and physicians,
neurosurgeons, school nurses and health educators can be used to mount a unified
approach to injury prevention strategies and research, including legislation, leading to
declines in injury related morbidity and mortality (U.S. Department of Health & Human
Services, 2000).
Results from this study will contribute to the science of nursing and injury
prevention by providing support for the effectiveness of the TFFK curriculum in
improving injury prevention knowledge among school-aged children. Furthermore, this
study will advance nursing science by identifying a platform for nursing participation in
com m unity based injury prevention research, thereby providing additional insight into
early prevention education and nurse centered community intervention strategies.
Reproduced with permission of the copyright owner. Further reproduction prohibited without permission.

CHAPTER n
LITERATURE REVIEW
Although unintentional injury has been documented as a serious and pervasive
health and social problem, scholarly inquiry regarding the phenomenon of injury preven
tion is relatively new. The Educational Resources Information Center (ERIC), Education
Full Text, and Cumulative Index to Nursing and Allied Health Literature (CINAHL)
computer searches were performed using the descriptors: injury, injury prevention,
school-based learning, learning theory, teaching methods, middle childhood learning,
school health education and growth and development. Numerous articles and studies were
found addressing growth and development of the middle childhood learner. However,
empirical evidence directly related to elementary school based injury prevention in grades
1, 2 and 3 was limited. This literature review includes six sections: learning and social,
cognitive, and behavioral maturation theories, review of the problem, childhood injuries,
injury prevention for low income and/or minority populations, injury prevention and
school health education, and nonschool based childhood injury prevention programs from
such disciplines as nursing, pediatrics, psychology, epidemiology, and education.
Learning and Social, Cognitive, and Behavioral Maturation
School-based injury prevention programs are built upon the framework of
constructivism theory. A major theme in Bruner’s (1966) theoretical framework is
14
Reproduced with permission of the copyright owner. Further reproduction prohibited without permission.

15
that learning is an active process in which learners construct new ideas or concepts based
upon their current/past knowledge. The learner selects and transforms information,
constructs hypotheses, and makes decisions, relying on a cognitive structure. Cognitive
structure (i.e., schema, mental models) provides meaning and organization to experiences
and allows the individual to go beyond the information given. As far as instruction is
concerned, the teacher should try to encourage students to discover principles by
themselves. Bruner believed that teachers and students should engage in an active dialog.
He viewed the primary position of the teacher was to present information to be learned to
match the learner’s current state of understanding. Bruner’s theory has its foundation in
Piaget’s cognitive development theory (1952), Vygotsky’s sociocultural theory, and
Erikson’s developmental theory (1968).
Jean Piaget’s Child Development Theory
Swiss biologist and psychologist Jean Piaget (1896-1980) is renowned for
theorizing a highly influential model of child development and learning. Piaget’s (1952)
theory is based on the idea that the developing child builds cognitive structures or
networked concepts for understanding and responding to physical experiences within his
or her environment. Piaget further asserts that a child’s cognitive structure increases in
sophistication with development, moving from a few innate reflexes to highly complex
mental activities (Furth & Wachs, 1975).
Piaget’s theory identifies four developmental stages and the processes by which
children progress through them. The four stages are: (a) sensorimotor stage (birth to
2 years old); the child, through physical interaction with his or her environment, builds a
Reproduced with permission of the copyright owner. Further reproduction prohibited without permission.
16
set of concepts about reality and how it works; (b) preoperational stage (ages 2-7); the
child is not yet able to conceptualize abstractly and needs concrete physical situations;
(c) concrete operations (ages 7-11); as physical experience accumulates, the child starts
to conceptualize, creating logical structures that explain his or her physical experiences;
and (d) formal operations (beginning at ages 11-15); by this point, the child’s cognitive
structures are like those of an adult and include conceptual reasoning (Maier, 1969).
The term constructivism most probably is derived from Piaget’s reference to his
views as “constructivist” (Gruber & Voneche, 1977), as well as from Bruner’s (1966)
description of discovery learning as “constructivist.” Other terms are also used to refer to
constructivist views of learning, including: generative learning; situated learning and
authentic instruction (Brown, Collins, & Duguid, 1989), postmodern curricula (Hlynka,
1991); and education semiotic (Cunningham & Cunningham, 1992). Even though con
structivists cannot be adequately represented by a single voice or an entirely universal
point of view, there is a conception of learner and learning that is unmistakable in its
central tenets and in its divergence from an objective tradition of learning theory based on
either behaviorism (associated models of learning) or cognitivism (the cognitive science
of information processing representations of learning). Waite-Stupiansky (1977) points
out Piaget’s constructivism theory synthesizes cognitive, behavioral, and environmental
explanations for learning and behavioral changes.
Middle childhood, from 6 to 12 years of age, is a crucial stage in development
when children begin to have continuous encounters with different institutions and
contexts outside of their families and to navigate their own way through societal
structures. It is during this period that children develop a sense of competence, forming
Reproduced with permission of the copyright owner. Further reproduction prohibited without permission.

17
ideas about their abilities, accomplishments they value, and the likelihood that they will
do well in differing situations. In particular, a child’s academic self-perceptions emerge
and consolidate in middle childhood, contributing to academic attainment in middle
school and beyond. Thus, during middle childhood the development of positive attitudes
toward safety, injury prevention, at risk activities, school, academic achievement, and
aspirations for the future can have major implications for children’s success as adults.
Vygotsky’s Sociocultural Theory
Vygotsky is best known for being an educational psychologist with a sociocultural
theory. This theory suggests that social interaction leads to continuous step-by-step
changes in children’s thought and behavior that can vary greatly from culture to culture
(Woolfolk, 1998). Basically Vygotsky’s theory suggests that development depends on
interaction with people and the tools that the culture provides to help form their own view
for the world. A cultural tool can be passed from one individual to another in three ways.
First is imitative learning, where one person tries to imitate or copy another. The second
way is by instructed learning, which involves remembering the instructions of the teacher
and then using these instructions to self-regulate. The final way that cultural tools are
passed to others is through collaborative learning, which involves a group of peers who
strive to understand each other and work together to leam a specific skill (Tomasello,
Savage-Rumbaugh, & Krueger, 1993). His theory combines the social environment and
cognition. More specifically, children will acquire the ways of thinking and behaving that
make up a culture by interacting with a more knowledgeable person. Vygotsky (1962)
believed that social interaction would lead to ongoing changes in a child’s thought and
Reproduced with permission of the copyright owner. Further reproduction prohibited without permission.

18
behavior. These thoughts and behaviors would vary between cultures (Berk, 1994). Given
this theoretical perspective, one could deduce that the middle school-aged child would be
at an increased risk of unintentional injury.
Vygotsky’s ideas and theories are often compared to Jean Piaget, especially
Vygotsky’s cognitive-developmental theory. They both put forth that development
concepts should not be taught until children are in the appropriate developmental stage.
However, Piaget posited the most important source of cognition is the children them
selves in contrast to Vygotsky who argued that the social environment could help the
child’s cognitive development. The social environment is an important factor that helps
the child culturally adapt to new situations when needed (Berk, 1994).
Both Vygotsky and Piaget had the common goal of finding out how children
master ideas and then translate them into speech. Piaget found that children act
independently on the physical world to discover what it has to offer. Vygotsky, on the
other hand, wrote that human mental activity in thought and language is the result of
social learning. Piaget emphasized universal cognitive change in contrast to Vygotsky’s
theory which leads us to expect highly variable development, depending on the child’s
cultural experiences to the environment. Lastly, Piaget’s theory emphasized the natural
line, while Vygotsky favored the cultural line of development (Woolfolk, 1998).
Erikson’s Psychoanalytic Theory
The psychoanalytic theory varies from other child development perspectives in
that it focuses exclusively on the formation of personality (Erikson, 1968).
Psychoanalysts contend that children’s emotional health stems from an ability to resolve
Reproduced with permission of the copyright owner. Further reproduction prohibited without permission.

19
key conflicts between their internal desires and impulses and pressures from the outside
world (Trawick-Smith, 2000). From a psychoanalytic perspective, a healthy child is one
who learns to walk a fine line between immediate need fulfillment and the control of
urges. Tarwick-Smith goes on to assert that parents and teachers play a critical role in the
process. They must provide the right amount of nurturance. If they allow too little or too
much gratification, according to the psychoanalytic theory, a child may fail too mature
emotionally.
Erik Erikson was a psychoanalyst who elaborated on and extended Freud’s theory.
He proposed eight ages through which humans must pass from birth to adulthood if they
are to feel competent and self-fulfilled (Erikson, 1968). The middle childhood age group
is identified by Erikson as children ages 6 to 12 years and is entitled, industry vs.
inferiority. Erikson suggests that children in this age group must come to feel competent
in skills valued by society. They need to feel successful in relation to peers and in the eyes
of significant adults. If they experience failure too often, they will come to feel inferior
(Trawick-Smith, 2000).
Erikson proposed that healthy personality growth is characterized by a resolution
of inner conflicts. Each stage of emotional development, from Erikson’s view, involves
a struggle between two opposing emotional states — one positive, the other negative.
These polar states push and pull at the individual, creating tension and posing unique
interpersonal problems (Harris & Liebert, 1984). For Erikson, the individual’s primary
psychological work at a particular stage is to resolve this emotional conflict in a positive
direction. The role of the teachers and parents in this process is to assist children in
striving toward positive emotional states, which are critical to their particular stage of
Reproduced with permission of the copyright owner. Further reproduction prohibited without permission.

20
development (Harris & Liebert, 1984). Based upon Erickson’s psychoanalytic theory, a
child’s emotional health and their ability in middle childhood to make good decisions
between their internal desires and impulses and outside pressures can play a major role in
the child’s ability to navigate environmental obstacles that put them at high risk for
injury.
According to Freud, not much is happening in middle childhood; the important
aspects of personality development have already occurred. But Erikson (1968) regards
this period as a socially decisive stage, because middle childhood children have accepted
the fact that their future lies in the world outside their home. In his view, industry versus
inferiority is the central issue of this stage (Maier, 1969). The danger in this stage,
according to Erikson, is that the child may feel himself/herself to be less able than his/her
peers to carry out the work society assigns him/her, or less able to win their respect and
friendship. Consequently, he/she may develop a sense of inferiority that interferes with
his/her ability to apply himself/herself to his/her work. Inferiority versus industry is the
central issue of Erikson’s fourth stage. Therefore, personality development and school
achievement are closely related (Thomas, 1985). Erikson’s view, unlike Freud’s,
recognizes that the parents are not the only ones involved in the child’s adaptation to
society. By middle childhood, a variety of socializing forces have started to exert an
influence. Aside from parents, many other people, siblings, other children, teachers, and
other adults all have major influences on a child’s social development (Harris & Liebert,
1984).
A growing number of concerns have been raised about the psychoanalytic theory
and its usefulness in teaching and parenting. The most commonly cited weakness is that it
Reproduced with permission of the copyright owner. Further reproduction prohibited without permission.

21
does not explain development of the child, but only a narrow range of emotional stages
(Thomas, 1992). How can a psychoanalytic perspective inform the teaching of early
literacy or mathematics in the classroom? What implications does it hold for enhancing
motor development and its relationship to injury? The theory does not seem to appreciate
the interrelatedness of intellectual, physical, social, and emotional growth.
Kohlberg’s Moral Development Theory
Piaget (1952) believed that young children become less egocentric; they acquire
an early sense of morality. In other words, they begin to understand and adhere to rules
and develop a concern for justice. Piaget argued that, in the primary years, many children
exhibit a sense of moral realism. At this stage, moral decisions and games are based on
fixed rules. In fact, children of this age are quite rule-bound (Trawick-Smith, 2000).
One of the outstanding examples of research in the Piagetian tradition is the work
of Lawrence Kohlberg. Kohlberg (1984) focused on moral development and proposed a
stage theory of moral thinking, which goes well beyond Piaget’s initial formulations
(Crain, 1980). Elaborating on Piaget’s stages, Kohlberg (1984) identified three levels
of moral development; preconventional, conventional, and postconventional, each
containing two stages. Kohlberg believed and was able to demonstrate through his studies
that people progress in their moral reasoning through this series of stages (Dixon & Stein,
1992). The first level of moral thinking is evidenced in elementary school. At this level,
people behave according to socially acceptable norms because they are told to do so by
some authority figure (e.g., parent, teacher, school nurse, doctor). This obedience is
compelled by the threat or application of punishment. The second stage of this level is
Reproduced with permission of the copyright owner. Further reproduction prohibited without permission.

22
characterized by a view that right behavior means acting in one’s own best interests
(Thomas, 1985). The middle school-aged child progresses greatly in their level of
independence from first to third grade. Applying Kohlberg’s theory would put a child at
greater risk to injury as they progress through the grades. As the child increases his/her
level of independence, his/her obedience to authority will decrease, therefore raising the
risk of injury.
Although Kohlberg’s theory has been supported by an extensive body of research
(Walker, 1984), a number of criticisms have been raised about his work. Some believe
that Kohlberg’s theory does not adequately emphasize the connections between moral
thinking and moral behavior (Eisenberg et al., 1996). Multicultural and feminist
scholars have argued that Kohlberg’s work reflects the values, social relationships, and
interpersonal characteristics of Euro-American males. Gilligan (1982) has suggested that
a high rating on Kohlberg’s moral dilemma scale requires a male-oriented approach to
solving problems. Others argue that Kohlberg’s stages of moral development reflect
primarily Western values (Reid, 1984). Kohlberg’s theory of moral development traces
the steps by which children grow toward making truly moral judgments. Kohlberg (1984)
believes that all children start at level 1; most children below the age of 9 are at this level.
Kohlberg also believes that the levels are always reached in the same order; no skipping,
and no backward steps are allowed.
As one looks for relationships between these developmental theorists’
perspectives, and the incidence of unintentional injuries and/or the success of educational
intervention programs, the following conclusions can be drawn: (a) the prevalence of
unintentional injury in middle childhood can be explained by the child’s developmental
Reproduced with permission of the copyright owner. Further reproduction prohibited without permission.

23
stage, that is, s/he is only beginning to conceptualize and understand cause/effect
relationships, including those related to safety; (b) the higher frequency of unintentional
injury among lower income and ethnic minority populations may be explained by a
difference in world view based on their sociocultural background; (c) likewise,
differences in responsiveness to injury prevention programs among ethnic and SES lines
may also be explained by sociocultural background; (d) the overall success of injury
prevention programs in increasing knowledge and changing behaviors among middle
childhood populations can be explained developmentally by the internal desire of the
child to be obedient (embracing the concepts taught or advocated in the lessons), and the
child’s desire for competence within their peer group; and (e) the success of injury
prevention programs can further be explained socially as they acquire knowledge and
change behavior by interacting with a more knowledgeable person, the teacher.
Literature Review of the Problem
More persons aged 1 to 34 die as a result of unintentional injuries than any other
cause of death (U.S. Dept, of Health & Human Services, 2000). In 1996, more than
13,000 children and adolescents under age 20 died from unintentional injuries nationwide
(Grossman, 2000). These deaths are primarily a result of motor vehicle crashes, falls, and
bums, but specifically exclude suicide and homicide (Grossman). Death from injury is the
most traumatic outcome, but not the most common. Between 1987 and 1994,
approximately 21 million nonfatal injuries occurred annually among youths 21 years of
age and younger (Grossman). Millions of persons suffer lifelong disabilities from
unintentional injuries. In 1995,29 million persons visited emergency departments as a
Reproduced with permission of the copyright owner. Further reproduction prohibited without permission.

24
result of unintentional injuries. The majority of these events occurred among the young
and elderly, hr 1992, children 15 years of age and younger in the United States made an
estimated 8.7 million emergency department (ED) visits for injuries, accounting for 39%
of all ED visits for this age group (Grossman).
Over the past several decades, rates of unintentional injury deaths among children
have gradually declined for most mechanisms. This reduction has primarily been a result
of a concerted public health effort to educate the public on risk factors and prevention
strategies. Even with the decline of injury deaths, the current rates of injuries are startling.
An additional concern is the considerable variation in injury rates among children of
different racial/ethnic groups, family incomes, and/or other socioeconomic classifications.
Childhood mortality from respiratory disease, fire, and homicide was higher among Black
children compared to White children and had a strong inverse relationship to income
(Wise et al., 1985). A retrospective analysis of fatal childhood pedestrian injury in South
Ameria demonstrated that low-income neighborhoods were associated with an increased
risk of injury (Durkin et al., 1998). Thus, to develop culturally appropriate prevention
strategies, it is imperative to investigate these differences by targeting these populations.
Injury is the leading cause of death among middle childhood or primary-grade
children. Each year, 30,000 children are permanently disabled due to injuries. Further,
600,000 children are hospitalized annually with injuries; many more visit an emergency
room or urgent appointment clinics (Trawick-Smith, 2000). In the United States, children
in poverty, particularly those who live in dangerous urban neighborhoods suffer more
injuries (Rivara & Barber, 1985). Injuries are also more prevalent among children of
Reproduced with permission of the copyright owner. Further reproduction prohibited without permission.

25
some historically underrepresented groups. Hispanic children, for example, are more
likely to be injured on the playground or in the street (Olson et al., 1990).
Vigilant parents and teachers can safeguard children. Poor supervision has been
identified as a major reason for preventable incidents involving children (Garbarino,
Dubrow, Kostelny, & Pardo, 1992). Risk of injury is highest in single-parent homes, in
those in which parents are very young, and in those in which drugs or alcohol are abused
(Rivera & Mueller, 1987).
How much supervision is required to keep children safe from injury? Peterson,
Farmer, and Mori (1987) posed this question to mothers, child protection service workers,
and health care providers. The consensus among these groups was that preschool age
children should receive constant supervision; that is, they should never be out of the sight
of an adult. Early elementary age children should receive near constant supervision, no
more than 5 minutes without supervision. However, study participants agreed that when
children were playing in “high risk” areas, where busy roads or urban hazards are a threat,
even primary age children should have constant supervision.
Childhood Injuries
Prevalence and descriptive studies provided the most common empirical research
related to childhood injuries. Grossman (2000) reported children 15 years of age and
younger in the United States made an estimated 8.7 million emergency department (ED)
visits for injuries, accounting for 39% of all ED visits for this age group in 1992.
According to the CDC (2005a), unintentional injuries accounted for the top five leading
causes of nonfatal injuries treated in hospital emergency departments in the United States
Reproduced with permission of the copyright owner. Further reproduction prohibited without permission.

26
in 2003 (see Appendix C). Other prevalence studies focused on the discrepancy in injury
rates among children of different racial/ethnic groups, family incomes, and/or other
socioeconomic classifications. For example, childhood mortality has been found to be
higher among Black children and low-income children when compared to Caucasian
children in the mid to high income bracket (Chen, Matthews, & Boyce, 2002; Durkin
et al., 1998; Marcin, Schembri, He, & Romano, 2003). Injuries were also more prevalent
among children of some historically underrepresented groups. Hispanic children, for
example, are more likely than Caucasian children to be injured on the playground or in
the street based upon an analysis of 35,277 children and adolescents hospitalized and
1,934 deaths (Agran, Winn, Anderson, & Del Valle, 1996; Baker, Braver, Chen, Pantula,
& Massie, 1998).
Adult supervision by vigilant parents and teachers has been investigated as a
means to prevent injury among children. Conversely, poor supervision has been identified
as a major reason for preventable incidents involving children (Garbarino et al., 1992).
Risk of injury is highest in single-parent homes, in those in which parents are very young,
and in those in which drugs or alcohol are abused (Macgregor, 2003).
How much supervision is required to keep children safe from injury? Only one
study was found that addressed this phenomenon where this question was asked of
mothers, child protection service workers, and health care providers (Peterson et al.,
1987). The consensus among these groups was that preschool age children should receive
constant supervision; that is, they should never be out of the sight of an adult. Early
elementary age children should receive near constant supervision or no more than
5 minutes without supervision. However, study participants agreed that when children
Reproduced with permission of the copyright owner. Further reproduction prohibited without permission.

27
were playing in “high risk” areas, where busy roads or urban hazards are a threat, even
primary age children should have constant supervision.
While the literature has described prevalence, outcome, and cause of unintentional
injury among a middle childhood population, there have been few empirical studies that
go beyond description to determine risk factors for differences in injury rates among same
age populations.
Injury Prevention for Low Income and/or Minority Populations
Davidson et al. (1994) assessed the impact of a neighborhood injury prevention
program in Harlem over a 3-year time period. Reviewing pediatric injury deaths and
hospital admissions demonstrated an incidence of 60.0/100,000/year. The intervention
included playground renovations, supervised activities for children, injury and violence
education, and the provision of safety equipment (bicycle helmets). Study findings
revealed a statistically significant reduction in targeted injury rates in the intervention
group. However, in the comparison group, a reduction in all injuries was found. Further
analysis revealed that this reduction was largely due to the reduction in non-targeted
injuries. The authors concluded that although a decline was observed in both groups, the
substantial decrease of targeted injuries in the intervention group supports the notion that
the intervention was effective.
O’Campo, Rao, Gielen, Royalty, and Wilson (2000) sought to determine whether
and how selected neighborhood economic and physical characteristics within low-income
communities are related to differences in risk of events with injury-producing potential
among infants and young children. The sample was composed of 288 parents and
Reproduced with permission of the copyright owner. Further reproduction prohibited without permission.

28
guardians of infants and young children from three low-income communities in Baltimore
City, Maryland, who responded to a random household survey. Information on
respondent (age, employment, and length of residence in the neighborhood) and neighbor
hood characteristics (average per capita income, rate of housing violations, and crime
rate) characteristics were collected. Although all three communities were considered low
income, considerable variation in neighborhood characteristics such as average per capita
income, rate of housing violations, and crime rate, and 1-month prevalence rates of events
with injury-producing potential were observed. Younger age of respondent and higher
rates of housing violations were significantly associated with increased risk of a child
under 5 years old in the household experiencing an event with injury-producing potential.
In conclusion, information on community characteristics is an important component in
understanding the risks for injuries and could be used to develop community-based
prevention interventions.
Agran et al. (1996) conducted a study to examine the effect of family, social, and
cultural factors on the rate of pedestrian injury in a population of Hispanic children in the
southwestern U.S. The study design was a case-control study of pedestrian injuries among
Hispanic children. The sample consisted of 98 children 0-14 years of age hospitalized as a
result of a pedestrian injury, and 144 randomly selected neighborhood controls matched
to the case by city, age, gender, and ethnicity. The following family and cultural variables
were associated with an increased risk of injury: household crowding (Odds Ratio [OR] =
2.8), one or more family moves within the past year (OR = 2.2), poverty (OR = 1.9), and
inability of mother (OR = 3.6) or father (OR = 5.6) to read well. However, children in
single parent households and children whose parents did not drive a car, had less
Reproduced with permission of the copyright owner. Further reproduction prohibited without permission.
29
education, or were of rural origin, did not have an increased rate of injury based upon a
case control study of pedestrian injuries among Hispanic children. These results have
implications for childhood pedestrian prevention efforts for low income, non-English
speaking Hispanic populations, and perhaps for other immigrant and high risk groups.
The authors conclude that prevention programs and materials need to be not only
culturally sensitive but also designed for those with limited reading skills.
It is critical to obtain more injury-related information on minority populations in
order to develop culturally appropriate injury prevention strategies. Further investigation
of socioeconomic factors in relation to injury occurrence must be conducted in order to
prevent injuries and the overwhelming emotional and financial burden associated with
injuries.
Injury Prevention and School Health Education
Leaders in health and education have identified the school as the setting to teach
children how to manage their health and risky behavior, including injury prevention
(Schall, 1994). The American Medical Association and the National Association of State
Boards of Education believe that risks children face each day, such as risk of injury, are
interconnected with other risks and decision-making skills (National Commission on the
Role of the School and the Community, 1990). The Centers for Disease Control and
Prevention (CDC), Healthy People 2010, and the Institute of Medicine Committee on
Comprehensive School Health Programs K-12 recommend school-based programs that:
(a) are sequential during all grade levels of elementary school, (b) are evaluated,
(c) include activities that help young persons develop skills to avoid risky behaviors, and
Reproduced with permission of the copyright owner. Further reproduction prohibited without permission.

30
(d) are taught by trained professionals (Gielen, 1992; Institute of Medicine, 1997; U.S.
Dept, of Health and Human Services, 1995). In 1990, the school health education system
was encouraged by the CDC to establish documented, planned, and sequential programs
of health education for students in kindergarten through grade 12. Since this call to
action, several programs have been developed and outcome research has been conducted.
Morrongiello, Miron, and Reutz (1998) conducted an interactive activity-based
elementary-school program titled Gearing Everyone To Act Healthy Each Day (GET
AHEAD) to prevent pediatric acquired brain injury by improving children’s knowledge,
attitudes, and behaviors regarding injury prevention. This teacher-facilitated program
involved children 8 to 10 years of age from four schools. Although the study sample
included children of lower and middle socioeconomic status (SES) families, the control
group was selected from the same schools as the intervention group. Because children
interact with children from other classrooms within schools, the program may have
indirectly affected the control group. Evaluation consisted of a pre-/posttest design.
However, due to financial restraints, the control group was only posttested. These
limitations hindered the study from achieving external validity and proving significant
conclusions. With these limitations in mind, the intervention group showed increases in
knowledge, self-reported changes in behavior, and favorable shifts in attitudes about
vulnerability to injury. The control group responded similarly to the intervention group’s
pretest responses, indicating a lack of injury-related knowledge and positive safety
behaviors. Unfortunately, there was no analysis that adjusted for SES factors. The study
disregarded the opportunity to evaluate their data rigorously and contribute to research on
SES as it relates to injury prevention.
Reproduced with permission of the copyright owner. Further reproduction prohibited without permission.

31
Cross et al. (2000) evaluated the efficacy of a comprehensive school, home, and
community education program titled Child Pedestrian Injury Prevention Project (CPIPP)
to improve 6-year-old children’s road safety behaviors and improve the road environment
in Australia. This 3-year quasi experimental trial involved three metropolitan communi
ties, resulting in a cohort of 1,603 children followed from age 6 to 9 years. Two commu
nities received an intervention of either high or moderate levels, and a third acted as a
comparison receiving the usual road safety education. Children in the high and moderate
intervention groups were significantly more likely to cross the road with adult supervision
(p - 0.013) and play away from the road (p < 0.001) than the comparison group. No
differences were detected in children’s pedestrian safety knowledge between the
intervention and comparison groups. However, the three study communities could not he
randomly assigned to conditions and loss to follow-up yielded an attrition rate of 32%.
Students lost to follow-up were more likely to walk and/or cross the road unaccompanied
by an adult than were cohort students. Also, those lost to follow-up had significantly
lower pedestrian safety knowledge. The lack of rigorous research design and significant
attrition rate compromise the results of this study.
Other studies have shown positive results from school-based intervention
programs aimed at those in middle childhood. Frederick, Bixby, Orzel, Stewart-Brown,
and Willett (2000) evaluated the effectiveness of the Injury Minimization Programme for
Schools (IMPS) in Oxford, UK. The program targeted 12,000 children ages 10 and 11
with the injury prevention program taught in the school and hospital environments.
Students were educated on risks, skills, and knowledge in relation to road safety, injuries
in the home, fire, electricity, poisons, and waterways. Intervention students were
Reproduced with permission of the copyright owner. Further reproduction prohibited without permission.

32
compared to control students (who attended schools without the IMPS) on quizzes given
prior to intervention and 5 months after the intervention. The IMPS students demon
strated statistically significant increases in knowledge and behaviors compared to the
control students. This study was a simple comparative pre-/posttest design that did not
conduct subanalyses by race/ethnicity or SES.
Embry, Flannery, Vazsonyi, Powell, and Atha (1996) established an elementary
school-based violence prevention program, PeaceBuilders, to promote prosocial behavior.
The program was multi-faceted such that it involved teachers, community volunteers,
parents, and students. The theoretical motivation for the program was based on two
concepts: (a) early intervention can alter future violent behavior, and (b) the effectiveness
of the program will result from weaving the components into the student’s everyday
routine to establish a PeaceBuilding “way of life.” Although the study has not published
the evaluation results, the comparative design was based upon intervention schools that
were matched to control schools on geographical location. Surveys were completed on
2,736 children over a 2-year period.
Grossman and associates (1997) implemented a randomized controlled trial of a
violence prevention curriculum among 790 second and third grade elementary school
children. Main outcome measures included aggressive and prosocial behavior changes
measured 2 weeks and 6 months after participation in the curriculum by parent and
teacher reports and by observation of a random subsample. Schools were chosen as the
unit of randomization to minimize the possibility that control classrooms and teachers
might be exposed to the curriculum. Schools were paired according to school district, the
proportion of students receiving free or reduced-cost school lunch, and the proportion of
Reproduced with permission of the copyright owner. Further reproduction prohibited without permission.

33
minority student enrollment. After matching, schools in each pair were randomly
assigned to intervention or control groups. The generalized estimation equation (GEE)
regression method was used to adjust for individual level co-variates under cluster
randomization. The results of the observational component of the study found a signifi
cant decrease in aggressive behavior and increase in prosocial behavior among interven
tion schools. This study exemplifies an ideal methodology for conducting a school-based
injury prevention study.
Wesner (2003) conducted a study to identify youth behavior with regards to injury
prevention, to assess the awareness of severity and susceptibility to brain and spinal cord
injury, and to evaluate the impact of the Think First Saskatchewan school visit program in
Canada (participants, 1,257 6th and 7th grade students, self-administered a questionnaire,
pre- and postintervention). Descriptive statistics and chi-square analysis was used. Study
results suggested Saskatchewan youth participated in activities that put them at risk for
brain and spinal cord injury. The Think First Saskatchewan school visit program
statistically improved self-reported knowledge of the students receiving the Think First
message. This evaluation of Think First Saskatchewan demonstrated statistically signifi
cant alterations in self-reported knowledge of the students receiving the Think First
message. Although changes in knowledge do not always effect changes in behavior, it is
an important first step in primary prevention of educating youth and working towards
improved attitudes and behavior that will prevent injury. A limitation of this study is the
need for further evaluation of the Think First program over time. This would enable a
better perspective of the true alteration of knowledge and behavior long term.
Reproduced with permission of the copyright owner. Further reproduction prohibited without permission.

34
Hall-Long, Schell, and Corrigan (2001) conducted a pilot injury prevention case
study design in the spring of 1999 of age appropriate developmental and education
concepts, using the TFFK curriculum as the primary educational guide. Partners for the
program included an urban elementary school, a school of nursing, a SafeKids Coalition,
a regional trauma center, and pediatric, community, and critical care nurses. A conve
nience sample consisted of 140 second grade students from an urban public elementary
school in the mid-Atlantic region. The students participated in a 1 hour a week injury
prevention class, once a week for the course of 6 weeks. At the conclusion of the study,
knowledge test scores increased an average of 35% over pretest measures. Faculty, staff
nurses, student nurses, children, and parents suggested a sense of positive overall value
of the program and verbalized their support for continuing the use of the curriculum.
Limitations of this study would include, but are not limited to, the use of one school, a
convenience sample, and the small sample size.
Gatheridge, Miltenberger, Huneke, and Satterlund (2004) compared two programs
teaching firearm injury prevention skill to 45 children that were 6 and 7 years in age. A
posttest only, control group design with two treatment groups were used to evaluate the
efficacy of the Eddie Eagle GunSafe Program. The children were randomly assigned to
one of the two treatment groups or a control group. The efficacy of the Eddie Eagle
GunSafe Program was evaluated. The criterion firearm safety behaviors included both
motor and verbal responses assessed in a naturalistic setting and then assigned a
numerical value based on a 0 to 3 scale. Both programs were effective in teaching
children to verbalize the safety skills message. However, children who received
behavioral skills training were significantly more likely to demonstrate the desired safety
Reproduced with permission of the copyright owner. Further reproduction prohibited without permission.

35
skills in role-playing assessments. The results of this study support the need for injury
prevention education to incorporate active learning approaches to enhance the program
efficacy.
Greene et al. (2002) examined the efficacy of the TFFK curriculum using a three-
phase, nonrandom, controlled study design from years 1995 to 1997. The objectives of
the study were: (a) to design an appropriate testing instrument for measuring student
comprehension of the concepts presented in the Think First for Kids curriculum (grades
1-3), in Year one — 1995; (b) year two conduct a pilot study in order to assess the
instrument’s reliability and validity; Year two — 1996; and (c) conduct a large-scale
evaluation to measure the effectiveness of the Think First for Kids curriculum, Year three
— 1997. A valid and reliable pretest posttest instrument was developed by the conclusion
of Year two. The results from the study of 870 students, completed in Year three of the
three phase evaluation, indicated that the 6-week TFFK curriculum significantly
increased (p < 0.01) student knowledge of injury prevention in all three grades (1, 2, and
3) at the treatment school in comparison to the control schools, after the implementation
of the curriculum. Treatment and control schools were matched by SES. A limitation of
this study was that the pre- and posttest data was collected at one point in time; therefore,
a longitudinal effect could not be determined.
Although many injury prevention programs are beginning to see positive
behavioral changes among younger children, many lack formal evaluations. Because
middle childhood-age children learn from a combination of existing knowledge combined
with new ideas or situations presented, research must assess improvements in injury-
related knowledge and behavior, as well as statistically adjust for confounding factors
Reproduced with permission of the copyright owner. Further reproduction prohibited without permission.

36
such as race/ethnicity, SES, and reading levels. Unfortunately, few research studies
targeting the outcomes of injury prevention education for a middle childhood population
utilize rigorous scientific investigation methodology, and few analyze differences within
populations. School-based injury prevention programs that are scientifically based and
employ rigorous evaluation techniques generate the most success.
Nonschool-Based Childhood Injury Prevention Programs
It is important to examine nonschool based childhood injury prevention programs
to determine if settings other than schools are successful at modifying injury-related
knowledge and behavior. Rivara et al. (1994) investigated helmet use and the incidence
of bicycle-related head injury during a community bicycle helmet campaign. The
researchers sought to increase parental awareness of bicycle safety, as well as increase the
use of helmets. This campaign resulted in an increase in the use of helmets and a decrease
in bicycling related head injury in the target population of children — 1,718 individuals
who were helmeted riders in a crash were queried on helmet fit and position. A sample of
28 children 2 to 14 years of age who sustained head injury while wearing a bicycle helmet
were compared to 98 individuals who were helmeted of the same age and were treated in
the same hospital for injuries other than to the head. This success can be attributed to the
coordinated community-wide effort to address a specific injury problem.
Durkin et al. (1998) evaluated the impact of a nonspecific injury prevention
program on urban pediatric neurological trauma. The goal of the program was to describe
the incidence and causes of pediatric head, spinal cord, and peripheral nerve injuries in
an urban setting. Rates before the implementation of a nonspecific injury prevention
Reproduced with permission of the copyright owner. Further reproduction prohibited without permission.

37
program were compared with rates after the implementation, and rates for the target
population were compared to rates for the control population. Rates were analyzed on the
basis of the cause of injury, as well as the age, gender, and neighborhood income level of
the injured. Among children admitted to surveillance system hospitals, pedestrian motor-
vehicle incidents/collisions were most common in late childhood. Residence in a low-
income neighborhood was associated with an increased risk of injury based upon review
of pediatric deaths and hospital admissions. Although injury incidence rates fell in both
the control and intervention cohorts during implementation of the nonspecific injury
prevention program, targeted age and population groups demonstrated greater relative
reductions in injuries than nontargeted ones, suggesting a positive effect.
Although many nonschool-based childhood injury prevention programs are
effective, it is not as easy to establish comprehensive and continuous programs outside of
the school system. These programs are advantageous to the cause, but lack some of the
criteria for injury prevention programs as requested by the CDC.
Synthesis of Literature
The field of education has undergone a significant shift in thinking about the
nature of human learning and conditions that best promote the varied dimensions of
human learning. As in psychology, there has been a paradigm shift in designed
instruction; from behaviorism to cognitivism and now to constructivism (Cooper, 1993).
Certainly, one of the most influential views of learning during the last two
decades of the 20th century is the perspective known as constructivism. Although by no
means an entirely new conceptualization of learner and the process of learner (roots can
Reproduced with permission of the copyright owner. Further reproduction prohibited without permission.

38
be traced to John Dewey and other progressive educators, to Piaget and Vygotsky and to
Jerome Bruner and discovery learning), constructivist perspectives on learning have
become increasingly influential in the past 20 years and can be said to represent a
paradigm shift in the epistemology of knowledge and theory of learning for children.
Based upon this review, there is strong evidence that constructivism is an
appropriate and accepted framework for curriculum design. School health education may
be one of the most important ways to address enduring public health problems, such as
injury (Institute of Medicine, 1997; Polivka & Ryan-Wenger, 1999). Therefore, designing
health education curricula rooted in learning and social, cognitive, and behavioral
maturation theory has the potential to enhance learning as well as change behaviors of our
children.
Of the 22 million children injured in the United States annually, 10 to 25% of
injuries to children, or between 2 and 5 million per year, occur on school property during
middle childhood school age groups (Synovitz et al., 2000). Playground incidents are the
leading cause of injury among children ages 5-14 (Synovitz et al.). School bus pedestrian
incidents, however, account for the highest number of fatalities each year (Synovitz et
al.). Because of the number of school-related injuries, schools should be an important site
for the study of injury prevention. The American School Health Association National
Injury and Violence Prevention Task Force recommends that schools be a primary source
for injury prevention education, resource information, policy making, and data collection
(Synovitz et al.).
Several curricular interventions have been successful in influencing behaviors,
such as reducing rates of tobacco and alcohol use among youth and decreasing
Reproduced with permission of the copyright owner. Further reproduction prohibited without permission.

39
unintentional pregnancies (Vincent, Clearie, & Schluchter, 1987). Schall (1994) suggests
that school-based education that starts early and continues through several grades
provides considerable and sustained effects on overall health knowledge, attitudes, and
practices. Targeting young children and including curriculum activities beyond the
classroom has also been effective in decreasing sexual risk-taking behaviors in
adolescents (Krug, Brener, Dahlberg, Ryan, & Powell, 1997: Main et al., 1994).
Several studies have targeted young children and behavior change. Walter (1989)
initiated the Know Your Baby project in New York in 1975 that was developed in
response to the empirically validated suggestion that the primary prevention of chronic
disease should begin in childhood. The program was classroom-based and teacher
delivered and after 6 years appeared to be associated with favorable changes in levels of
knowledge, as well as rate of initiation of cigarette smoking.
Potts, Martinez, and Dedmon (1994) examined several measure of physical
risk-taking and sensation-seeking among children aged 6 to 9. These variables were
targeted as potential predictors of unintentional injury. Among the important findings,
risk taking, whether measured by self-report or knowledgeable informants, was indicative
of physical injury.
Rivara et al. (1994) described the impact of a community bicycle helmet cam
paign on helmet use and the incidence of bicycle-related head injury. The community-
wide bicycle helmet campaign sought to promote use of helmets and increase parental
awareness of the need for helmets. An increased use of helmets and a decrease in
bicycle-related head injury in the target population of children suggest that a concerted
Reproduced with permission of the copyright owner. Further reproduction prohibited without permission.

40
and coordinated community-wide effort encountering a specific injury problem with an
identified intervention can be effective.
Gresham et al. (2001) conducted a randomized pretest and posttest comparative
design to evaluate the outcome of implementing TFFK, an injury prevention program for
children grades 1, 2, and 3, among intervention and control schools. The study showed
that children often lack basic knowledge regarding safety and do not recognize behaviors
considered high risk for injury. By using multivariate analysis, the intervention children
had a significantly greater increase in safety knowledge retention and self-reported safety
behaviors to prevent traumatic injury. Gresham goes on to identify the lack of literature
review pertaining to the implementation and evaluation of grade-specific injury
prevention curricula.
The rigorous scientific randomized pre-/posttest comparative design of the
Gresham et al. (2001) study is rare in the annals of injury prevention research. Almost
without exception, studies are either descriptive or limited to a simple comparison design.
The lack of scientific published research in the field is a hindrance to the advancement
of public health. It is also limiting the identification and recognition of evaluated
evidence-based programs that could be used in the classroom right now. Secondly, the
lack of research on this phenomenon by U.S. researchers was surprising. Most of the
salient research has been conducted in Australia and the United Kingdom.
Through a complete review of the literature, it is overwhelmingly evident that
school nurses, nurse researchers, trauma nurses, and rehabilitation nurses are absent on
the front of combating the leading cause of death to our children. The increasing
awareness of childhood injuries as an important public health problem in the U.S. and
Reproduced with permission of the copyright owner. Further reproduction prohibited without permission.
41
around the world has important implications for nurses in clinical practice, community
settings, and nursing research. In clinical practice, injury prevention strategies focus on
sociocultural issues and behavioral change in counseling with children and families.
School-based education of children may help to broaden and reinforce counseling efforts
(Lavin, Shapiro, & Weill, 1992).
A review of the literature on childhood injury and middle childhood development
reveals a significant body of knowledge about causes and outcomes of childhood injury as
well as theory on middle childhood development and how children learn. However, there
is limited scientific research linking injury prevention school-based curricula and what is
known about middle childhood learning to increase injury prevention knowledge. The
purpose of this study was to evaluate the effectiveness of the elementary school injury
prevention curriculum called Think First for Kids (TFFK) on improving knowledge and
self-reported safety behaviors over time among ethnically and economically diverse
elementary school-aged children. This study employed rigorous evaluation techniques to
assess the TFFK injury prevention program which yielded evidence to support
recommendations for changes in school approved curricula policy regarding injury
prevention, with the intent of decreasing injury occurrence and thus decreasing the
financial burden of injuries.
Reproduced with permission of the copyright owner. Further reproduction prohibited without permission.

CHAPTER m
METHODOLOGY
The purpose of this study was to examine the effectiveness of an elementary
school injury prevention curriculum, Think First For Kids (TFFK), on self-reported
knowledge and safety behaviors among a sample of ethnically diverse youth ages 6 to 9.
This chapter provides a detailed description of the research design, sample and sampling,
instrumentation, data collection, and management. Data analytic techniques are also
included. Lastly, issues related to protection of human subjects are presented.
Hypotheses
The null hypotheses were that (a) there is no significant difference in self-reported
knowledge and safety behaviors between students participating in the TFFK curriculum
and those who do not receive the curriculum; (b) there is no significant difference in
retention of knowledge over time with repeated curriculum interventions in the time
period of years 2000-2002 between students who receive the curriculum and those who
do not.
Study Design
A longitudinal, matched comparative, with repeated measures, cohort design was
used to evaluate the effectiveness of TFFK intervention. The data to be analyzed is from a
42
Reproduced with permission of the copyright owner. Further reproduction prohibited without permission.

43
quasi-experimental research design used because in real world settings it was not possible
to randomize students to intervention (treatment) conditions (Creswell, 2003; DePoy &
Gitlin, 1998). Students attending schools where the TFFK curriculum was implemented
could not be randomly assigned to different treatment groups because the curriculum
would affect everyone in the school. Therefore, to ensure that those students in the
control group were not exposed to the TFFK curriculum, schools with similar student
profiles (reading levels, race/ethnicity, SES) and not receiving the curriculum were
selected as the control. While quasi-experimental designs lack the rigor inherent in
true experiments, Creswell (2003) argues the use of a matched comparison cohort
compensates for the absence of randomization.
Sample and Sampling
Culturally diverse elementary schools in high injury-risk areas from San Diego
Unified and Cajon Valley during the 1999-2002 academic school years were recruited for
the study. Ten schools participated, five schools were identified as intervention schools to
receive TFFK and five schools that most closely matched the intervention schools on
SES, school defined and grade specific reading scores, race/ethnicity composition, and
school district were the controls, thus creating five pairs of matched schools. Two pairs
of schools were from the San Diego Unified School District, one pair from Lakeside, and
one pair from the Cajon Valley School District. The sample size was dependent upon
classroom size at each of the participating schools. The original cohort of 1,762 students
participated in the paired intervention/control study were followed over the 3-year
longitudinal study (as shown in Table 1).
Reproduced with permission of the copyright owner. Further reproduction prohibited without permission.

44
Table 1
Participating Paired Intervention and Control Schools
Intervention school Control school
Cajon Valley District (participated 2000-2002)
CV1A CV1B(A= 1,001) (A = 1,007)API = 635 API = 646May 2000-June 2002 May 2000-June 2002
Lakeside Union District (participated 2001-2002)
LUD1A LUD1B(A =224) (A =203)API = 702 API = 688May 2001-June 2002 May 2001-June 2002
San Diego Unified District (participated 2000-2002)
SD1A SD1B(A= 587) (A= 521)API = 615 API = 602May 2000-May 2002 June 2000-May 2002
SD2A SD2B(A= 251) (A =398)API = 524 API = 476May 2000-July 2002 June 2000-July 2002
Note. School names were coded to maintain confidentiality.
There are a number of basic assumptions that must be recognized, including:
(a) students who participate in the TFFK intervention are representative of the general
population of students; (b) students who serve as controls are representative of the general
population as well as the intervention students; (c) participants will accurately report
injury-related behaviors; (d) instruction of the TFFK curriculum will be conducted in a
similar manner for all intervention schools; (e) absenteeism rates are low, thus children
Reproduced with permission of the copyright owner. Further reproduction prohibited without permission.

45
who complete a pre-measure also complete a post-measure; (f) children remain in the
same elementary school for the duration of first through fourth grade; and (g) attrition
does not seriously bias the estimated effect of the intervention; and (h) the data are
accurately and completely entered into the database.
Sample attrition is a potential source of bias in experimental, as well as
nonexperimental program evaluation. Attrition could lead to loss of information, thus
affecting the analysis of study results (Grasdal, 2001). This study relied on the teachers’
willingness to co-operate and comply with the protocol as either a control or an
intervention school. Strategies used to minimize attrition and noncompliance of schools
and classes over the 3 years included: Periodic phone calls to the teachers to remind them
of the pre-post measure timelines, offer to pick up the completed pre-post measures from
each teacher and school, pre-paid postage for the return of pre-post measures, offer of
incentives, offer of assistance from health educators to answer any questions on content
or longitudinal study protocol, and annual discussions with principles of the schools to
reinforce importance of the study.
Think First for Kids Curriculum Intervention
Think First for Kids is a comprehensive brain and spinal cord injury prevention
curriculum developed by the American Association of Neurological Surgeons and the
Congress of Neurological Surgeons (1996). Think First for Kids was developed to
increase knowledge about the risks of brain and spinal cord injury and modify safety
habits among 6-8 year-old (grades 1-3) children (Think First National Injury Prevention
Foundation, 1996a, 1996b). This program has been constructed to fulfill the CDC criteria
Reproduced with permission of the copyright owner. Further reproduction prohibited without permission.

46
of planned, sequential, and evaluated comprehensive school-based health programs to
promote childhood injury prevention. The curriculum was based on the principles of
applied learning and behavioral theories which state that messages delivered over time
increase understanding, knowledge retention, and sustained behavior (Bandura, 1977).
Think First for Kids integrates math, science, reading, and language skills into an
injury prevention curriculum. There are three curricula were developed from the
constructivist perspective incorporating the theories of maturation and learning of Piaget,
Erikson, Kohlberg, and Vygotsky. All six modules of the three curricula have a similar
construct which includes the following: (a) anatomy and function of the brain and spinal
cord; (b) vehicular safety; (c) bicycle safety; (d) safety around weapons and creative
problem solving; (e) playground, recreation, and sports safety; and (f) water safety. The
objectives and delivery timeline for each module are shown in Table 2.
The six modules were taught sequentially, one lesson plan per week. Each
module required approximately 35 to 40 minutes. Learning strategies include role-
playing, hands-on activities, reading, math, visual reinforcement, and discussion. The
TFFK comic strips and Streetsmart video were provided to each intervention school. The
comic strips made visual references to six lessons that incorporated critical thinking
ability as the child worked his/her way through the storyline dealing with injury
prevention behavior. The Streetsmart video is an entertaining presentation that models
injury prevention behavior. Multiethnic elementary school-aged animated characters were
depicted in real-life situation and demonstrated critical thinking requirements to avoid
common and everyday injuries faced by young children.
Reproduced with permission of the copyright owner. Further reproduction prohibited without permission.

Table 2
Think First for Kids Objectives and Delivery Timeline
47
Week Content objectives Activities
Week 0 Teacher/school nurse Administer pretest
Week 1 Introduction to preventing brain and Play “Simon Says” point out need forSafety/Anatomy spinal cord injury. brain and spinal cord to play this game.and Physiology Assess the student’s knowledge of safety Show TFFK video. “Street Smart a
and safety habits to prevent injury. Think First Adventure”.Introduce simple facts related to the Read story and assist students withanatomy and functions of the brain, decisions re: injury prevention.spinal cord, and related structures. Meet with a young injury survivor.Increase the student’s ability to Voice for Injury Prevention (VIP) -incorporate the concepts of brain and Provided by San Diego Think Firstspinal cord injury prevention and Chapter.protection into their daily activities. Increase parents’ knowledge of awareness of brain and spinal cord injuries and prevention measures.
Homework assignment
Week 2 Assess the student’s knowledge of the Ask youth to demonstrate proper seatdangers of cars and other vehicles, and belt use.
Vehicular Safety good vehicle safety habits. Practice looking left, right, left beforeIntroduce the importance of safety belts crossing the street.in protecting people from injury. Use pencil and yam to demonstrate “10Enhance the concept of safety and foot rale The safety zone around thecorrect safety belt use as everyone’s bus”.responsibility. Review vehicular safety worksheet as aIncrease the student’s knowledge about group.safety belts. Safety belt word find and pictureIncrease the student’s knowledge and assignmentawareness of vehicle and pedestrian Safety belt math problemssafety and injury prevention measures. Homework assignment
Week 3 Increase the student’s knowledge of Survey class on their bike and helmetbicycle safety and the importance of use.
Bicycle Safety bicycle helmets in protecting the brain Provide a “hands-on” helmet session.from injury. Demonstrate proper helmet fit.Increase the student’s knowledge and Reinforce need for helmet throughskills in collecting and reporting demonstration - egg drop or melon dropinformation. exercise.Provide visual reinforcement and hands- on experience with bicycle helmets.
Homework assignment
{table continues)
Reproduced with permission of the copyright owner. Further reproduction prohibited without permission.
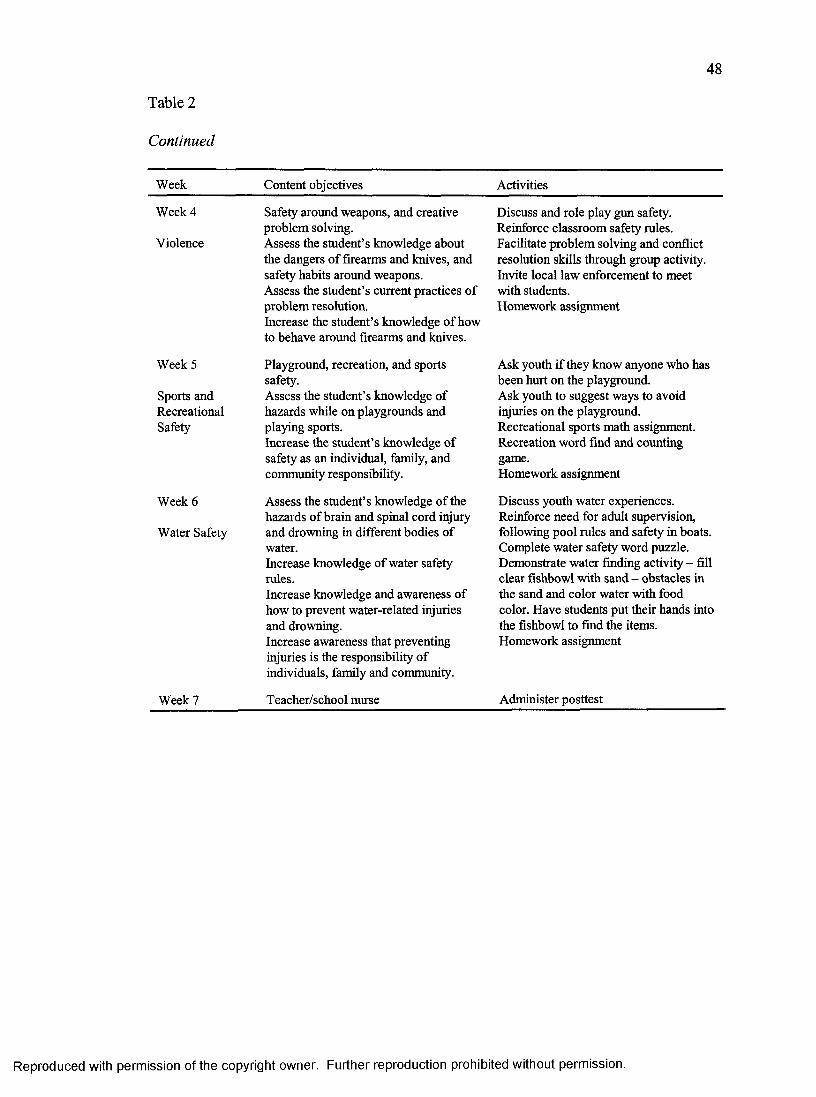
48
Table 2
Continued
Week Content objectives Activities
Week 4
Violence
Safety around weapons, and creative problem solving.Assess the student’s knowledge about the dangers of firearms and knives, and safety habits around weapons.Assess the student’s current practices of problem resolution.Increase the student’s knowledge of how to behave around firearms and knives.
Discuss and role play gun safety. Reinforce classroom safety rules. Facilitate problem solving and conflict resolution skills through group activity. Invite local law enforcement to meet with students.Homework assignment
Week 5
Sports andRecreationalSafety
Playground, recreation, and sports safety.Assess the student’s knowledge of hazards while on playgrounds and playing sports.Increase the student’s knowledge of safety as an individual, family, and community responsibility.
Ask youth if they know anyone who has been hmt on the playground.Ask youth to suggest ways to avoid injuries on the playground.Recreational sports math assignment. Recreation word find and counting game.Homework assignment
Week 6
Water Safety
Assess the student’s knowledge of the hazards of brain and spinal cord injury and drowning in different bodies of water.Increase knowledge of water safety rules.Increase knowledge and awareness of how to prevent water-related injuries and drowning.Increase awareness that preventing injuries is the responsibility of individuals, family and community.
Discuss youth water experiences. Reinforce need for adult supervision, following pool rules and safety in boats. Complete water safety word puzzle. Demonstrate water finding activity - fill clear fishbowl with sand - obstacles in the sand and color water with food color. Have students put their hands into the fishbowl to find the items. Homework assignment
Week 7 Teacher/school nurse Administer posttest
Reproduced with permission of the copyright owner. Further reproduction prohibited without permission.

49
Classroom activities and homework assignments include songs, poems,
mathematics, and problem solving. Additional materials such as videos, posters, and
progressive comic strips were supplemental to the classroom instruction. These materials
portrayed multiethnic elementary school-aged animated characters in common high
injury-risk situations which paralleled the six modules. Upon viewing these materials,
students were required to use high-order critical thinking skills in order to solve problems
and follow storylines. During the intervention, a spinal cord injured speaker, VIP (Voices
for Injury Prevention), presented information on injury prevention and disability
awareness.
A typical module, such as water safety, would have three objectives taught by the
classroom educator (school nurse/teacher). These objectives would emphasize water
safety rules, knowledge of water-related injury prevention, and safety as an individual,
family, and community responsibility. Materials such as posters and videos would
reinforce the module objectives. During class, students would discuss scenarios of water-
related injuries and would comment on solutions for safer actions. Homework
assignments relating to water safety would consist of counting the number of life jackets
in each illustrated boat, finding hidden safety words in a puzzle, and fill-in-the-blank
questions.
The modules were taught by trained personnel that included school nurses,
schoolteachers, and life-skills educators. Each teacher attended an hour training session at
their school conducted by the Think First San Diego Chapter Director. The Think First
National Directors/Teacher Training Guide (Appendix D) was used to facilitate the
training session. All teachers were advised during the training of the theoretical
Reproduced with permission of the copyright owner. Further reproduction prohibited without permission.

50
framework used in the development of the three curricula. Each teacher received a
curriculum manual, one set of classroom posters, one set of comic strips per student, and
one StreetSmart video (Think First National Injury Prevention Foundation, 1996a), and
copies of the pre and posttests. Twenty bicycle helmets and one bicycle were donated to
each school to be raffled upon completion of the TFFK program. During the training
session, TFFK staff was available to assist with questions and concerns. The teachers
were instructed to return the pre-/posttests without scoring them. The control school
teachers received copies of the pre- and posttests along with a schedule of dates in which
the pre- and posttests were to be given.
Operational Definitions
Absenteeism Rate: The number of excused and unexcused absences per school
year compared to the total number of students enrolled in the school.
Behavior: The way a person acts or behaves in relationship to his/her physical,
mental, or social well-being with consideration for the individual’s psychosocial,
development, and cultural background.
Elementary School Children: A student, 6 through 8 years of age, enrolled in
grades 1, 2, 3, or 4, and in the early-school age developmental stage.
High Injury-Risk Behavior: To expose oneself to the chance of injury.
Activities or behaviors which increase the likelihood of unfavorable physical,
psychological, social, or other health outcomes.
Injury-Related Knowledge: Retention of information attained through
educational health programs that promote the prevention of fatal or nonfatal events.
Reproduced with permission of the copyright owner. Further reproduction prohibited without permission.

51
Safety-Behavior: Activities or behaviors which decrease the likelihood of
unfavorable physical, psychological, social, or other health outcomes.
Think First for Kids Curriculum: A sequential and ordered educational
program, designed to provide a positive influence on the early school aged child’s health
knowledge and practices in relationship to injury-related activities and behaviors.
Measures
The TFFK Injury Prevention measure (Greene et al., 2001) was used to assess
knowledge and behaviors related to regarding brain and spinal cord injury. This
grade-specific measure consists of questions of a forced choice format, multiple-choice,
and sequencing questions relating to knowledge or concepts presented in the TFFK
curriculum. Each grade has a unique measure, consisting of multiple choice, matching
and yes/no questions appropriate to the developmental stage and grade-specific reading
level. The first grade measure includes 22 questions, second grade 24 questions, and third
grade 26 questions (Appendices E and F).
The TFFK Injury Prevention measure was developed by a multi-disciplinary team
of Think First staff, a clinical psychologist, a health curriculum specialist, and an
elementary school teacher. Questions were designed to measure the effectiveness of the
curriculum and were knowledge-based and self-reported behavior questions. The team
defined inclusion/exclusion criteria for these items as follows: The inclusion criteria for
items were: (a) forced-choice format (true/false, multiple choice, and sequencing);
(b) direct relationship of item content to knowledge or concepts presented in the Think
First for Kids curriculum (content validity); (c) developmentally appropriate for age and
Reproduced with permission of the copyright owner. Further reproduction prohibited without permission.

52
grade level (separate questions were written for each grade level); (e) response rates
between 20% and 85% (questions that were answered correctly by at least 20% of
students and not by more than 85% of students, since questions below 20% accuracy
were considered problematic, and questions above 85% were considered too easy and
within the students’ general, pre-intervention knowledge-base); and (f) demonstrated
improvement in accurate response-rate from pre- to posttest (i.e., the questions needed to
be sensitive to changes in student knowledge related to curriculum exposure). Because
the correct response rate for many items was greater than 85%, more difficult and
challenging questions, such as matching and sequencing types, were created to augment
the true/false and multiple choice items (Greene et al., 2001).
Two drafts of the measure were developed, tested, modified, and re-administered
with students in grades 1-3 in rural, suburban, and urban schools. The final draft was
administered to 870 students in five schools, in both the experimental and control
schools. To control for literacy, the pencil-and-paper measure was read aloud to the
students and took approximately 15 minutes to complete. Grade-specific measures
developmentally appropriate to each grade were finalized to assess knowledge and
behaviors regarding brain and spinal cord injury. The measure is presented in a pre/post
measure format. Reliability and validity testing of these measures were conducted by the
Oregon Health Science University and the Oregon State Health Division (Greene et al.,
2001). The Cronbach alpha test was not performed on this instrument.
The fourth grade test assessed basic injury prevention knowledge and self-report
safety behaviors in students who had no intervention at the 4th grade level. The test was
exactly the same as the third grade posttest (Appendix F).
Reproduced with permission of the copyright owner. Further reproduction prohibited without permission.

53
Data Collection Procedures
This researcher was given permission to use the Access database by Sharp Health
care (Appendix G). The researcher analyzed precollected data that contain no subject
identifiers, and subjects cannot be identified, directly or through identifiers linked to the
subjects. The data were collected within the classroom setting for both the intervention
and control schools.
Data collection occurred between 2000-2002 within the classroom setting for both
the intervention and control schools at three points in time using a student self-report
pre-/posttest as previously discussed. A measure consisting of questions of a forced
choice format, multiple- choice, and sequencing questions relating to knowledge or
concepts presented in the TFFK curriculum was administered by the classroom teachers.
The TFFK program was taught each Spring for 3 years and classroom teachers
administered pre- and posttests within 10 days of implementation and within 10 days of
completion of the TFFK 6-week curriculum. Control group participants completed the
pre- and postquestionnaire during the same time frame. The fourth grade students, who
received no intervention, were given the 4th grade questionnaire during the same time
period as the pretest for grades 1-3. Community Health Educators (CHE) and school
nurses helped to arrange the scheduling of the pre-/posttests with the classroom teachers.
The Intervention and Control students participating in this study were followed through
time as Cohorts (Table 3) as they progressed from one grade to another during academic
years 1999-2002.
Reproduced with permission of the copyright owner. Further reproduction prohibited without permission.
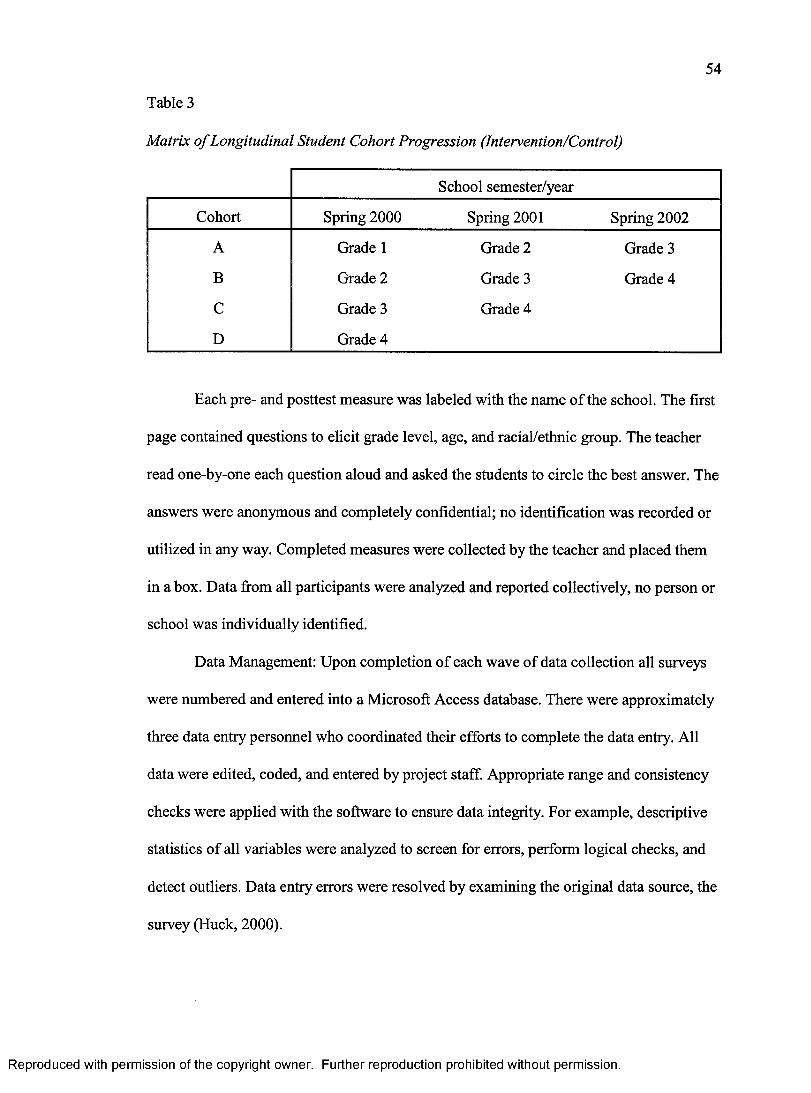
54
Table 3
Matrix o f Longitudinal Student Cohort Progression (Intervention/Control)
School semester/year
Cohort Spring 2000 Spring 2001 Spring 2002
A Grade 1 Grade 2 Grade 3
B Grade 2 Grade 3 Grade 4
C Grade 3 Grade 4
D Grade 4
Each pre- and posttest measure was labeled with the name of the school. The first
page contained questions to elicit grade level, age, and racial/ethnic group. The teacher
read one-by-one each question aloud and asked the students to circle the best answer. The
answers were anonymous and completely confidential; no identification was recorded or
utilized in any way. Completed measures were collected by the teacher and placed them
in a box. Data from all participants were analyzed and reported collectively, no person or
school was individually identified.
Data Management: Upon completion of each wave of data collection all surveys
were numbered and entered into a Microsoft Access database. There were approximately
three data entry personnel who coordinated their efforts to complete the data entry. All
data were edited, coded, and entered by project staff. Appropriate range and consistency
checks were applied with the software to ensure data integrity. For example, descriptive
statistics of all variables were analyzed to screen for errors, perform logical checks, and
detect outliers. Data entry errors were resolved by examining the original data source, the
survey (Huck, 2000).
Reproduced with permission of the copyright owner. Further reproduction prohibited without permission.
55
Data Analysis
To determine the effectiveness of the TFFK program, a pre-/post-measure design
was employed. The primary outcome was a change in total test score from the pretest to
the post-measure, with the postmeasure being administered after the intervention. The
analysis of the preexisting data was conducted using the Statistical Package for the Social
Sciences (SPSS) (Version 12.0) and included descriptive, univariate, and General Linear
Model (GLM), multivariate analysis of variance methods, to assess injury-related
knowledge and safety behavior change among elementary school subjects receiving the
TFFK curriculum compared to control subjects (George & Mallery, 2004).
Descriptive Statistics
Demographic data were analyzed using frequencies by year of participation, grade
level, and district, as well as the general demographics of the student participants by
gender and racial/ethnic group (Flinkle et al., 2003). For grades 1 through 3, it was
assumed that the students in the pretest group were also in the posttest group. To verify
this assumption, general frequencies of gender and race/ethnicity for the posttest group
were examined. Since few differences were observed, the final descriptive analysis was
conducted and reported on the pretest group. Pre- and post-questionnaires were not
matched per student. There were two datasets for each grade: pre-measure data and post
measure data. On both the pre-measure and the post-measure, students were asked to
report their gender and race/ethnicity. Since students in grade 4 were only tested once,
there was only one group of students per grade from which to obtain descriptive data.
Reproduced with permission of the copyright owner. Further reproduction prohibited without permission.

56
Pre-/Post-Measures
The primary outcome was a change in total test score from the pre-test to the post
measure. In order to obtain a change in score, separate scores for pre-measure and post
measure were calculated. Each question was assigned a single point value for the correct
answer and a total score was assigned for each test. Since each school was designated as a
control or intervention school, summary score differences of pre- and post-measures were
calculated per grade and school.
In order to examine the mean change in score from pre-measure to post-measure
for each school, gender, and race/ethnic group, it was imperative to match the pre- and
post-measure scores by a character profile which included these factors. Once pre- and
post-measure scores were calculated, post-measure scores were selected for each
character profile and imported into a database with pre-measure scores of the same
character profile. For missing pre- or posttest scores, the mean test score for that character
profile was imputed in order to conserve power with the small sample sizes. To verify
that this process was not affecting the results, an analysis of the data with only pairs of
matched test scores (no imputed pairs) was conducted. Since this analysis revealed
similar mean score differences per school, gender, and race/ethnicity, the imputed pairs
were included in the final analysis to conserve power.
Cohorts
Cohorts A, B, C, and D were followed for 3 years (2000-2002) and given a pre-
and post-measure for grades 1-3. Cohort D, grade 4, completed a pre-measure (no
intervention for grade 4-cohort D). Cohort A was surveyed as they progressed from
Reproduced with permission of the copyright owner. Further reproduction prohibited without permission.

57
Grade 1 to Grade 2 to Grade 3. Cohort B was surveyed as they progressed from Grade 2
to 3 to 4. Cohort C was surveyed as they progressed from Grade 3 to 4. Cohort D was
surveyed one time in Grade 4.
For example, when Cohort A intervention students progressed to grade 2, they
had already had 1 year of the TFFK program. Trends in scores were plotted over time to
measure and describe the overall impact of the TFFK program, as well as measure the
concept of retention of knowledge and behavior over time, from one grade to another.
Univariate
Ninety-five percent confidence intervals were constructed around the changes in
test scores (Hinkle et al., 2003). Stratification of confounding factors allowed for an
examination of gender, grade, district, and race/ethnicity. Due to small sample sizes of
some race/ethnicity categories, the variable race was collapsed into four categories:
Caucasian, Hispanic, African-American, and Other (included all other races). For each
grade, comparisons of 95% confidence intervals around the mean change in score were
used to determine statistical significance in the univariate analyses. Graphs depicting 95%
Confidence Intervals for each of the cohorts by grade and intervention status were
constructed (see Table 5).
Multivariate
In utilizing pre- and posttests, this study is considered to be a repeated measures
design (Creswell, 2003). Multivariate analyses were performed to assess the change in
mean scores while controlling for covariates such as gender, race/ethnicity, and Academic
Performance Index (API). The API is a score on a scale o f200 to 1000 that annually
Reproduced with permission of the copyright owner. Further reproduction prohibited without permission.
58
measures the academic performance and progress of individual schools in California.
Students in the same school tend to have similar characteristics, thereby acting as a
cluster. Therefore, to account for within-cluster correlation, the GLM method was used to
reduce the potential for biased standard errors and conclusions about the statistical
significance (a bias that can occur in either direction, but usually leads to false-positive
treatment effects) (George & Mallery, 2004). This within-cluster correlation was adjusted
by using the GLM.
To estimate the overall effect of the curriculum, a GLM repeated measures of
analysis of variance procedure was used to test the global null hypothesis and determine
the effects of between-subject factors (year and intervention or control); covariates
(gender, race/ethnicity and API); and within subject factors (pre- and posttest scores). The
GLM procedure was used to adjust for the covariates gender, race/ethnicity and API to
determine if the TFFK intervention was a predictor of improved performance. The results
were plotted on graphs to show the progression of the cohorts over time.
Protection of Human Subjects
Approval of the study was obtained from University of San Diego’s Institutional
Review Board (Appendix H). This research falls into the exempt category based upon
federal law 45 CFR 46.010 B specifically, as applies to #4, research involving the
collection or study of existing data. This researcher analyzed precollected data that
contained no subject identifiers, and subjects can not be identified, directly or through
identifiers linked to the subjects. The researcher was given permission to use an Access
database by Sharp Healthcare, San Diego.
Reproduced with permission of the copyright owner. Further reproduction prohibited without permission.
CHAPTER IV
RESULTS
The purpose of this research study was to analyze an existing intervention data set
collected to assess the effectiveness of an elementary school injury prevention curriculum
called Think First for Kids (TFFK). This intervention was delivered in a sequential
manner over a 1 to 3 year period to 1,762 children, ages 6 to 9 to help them improve and
retain knowledge and self-reported safety behaviors. This is an intent to treat analysis
which means all the intervention children were included regardless of whether they
moved or stayed in the school system. The results and interpretation of findings are
provided in this chapter. Descriptive statistics describing the sample population are
presented first, followed by univariate and multivariate analysis of the effect of the
curriculum by individual cohort, A, B, and C.
Characteristics of the Sample
Seventeen hundred sixty-two children participated in the study. One thousand
ninety-nine children were in the intervention group and 663 were in the control group (see
Table 4). The sample was diverse with the following racial/ethnic composition: 32.4%
White, 8.5% Black, 26.2% Hispanic, and 32.8% Other, which includes those that did not
self identify race/ethnicity. See Appendices I, J, and K for characteristics of the sample by
Cohort.
59
Reproduced with permission of the copyright owner. Further reproduction prohibited without permission.

60
Table 4
Students by Grade Level, Group, and Year
Group Grade level 2000
Year
2001 2002 Total
Intervention 1 496 0 0 4962 479 407 0 8863 124 350 350 8244 0 110 320 430
Total 1,099 867 670 2,636
Control 1 226 0 0 2262 208 194 0 4023 229 161 165 5554 0 185 188 373
Total 663 540 353 1,556
Grand total - and control
intervention1,762 1,407 1,023 4,192
Findings Related to Hypotheses
The null hypotheses are that (a) there is no significant difference in self-reported
knowledge and safety behaviors between students participating in the TFFK curriculum
and those who do not receive the curriculum; (b) there is no significant difference in
retention of knowledge over time with repeated curriculum interventions in the time
period of years 2000-2002 between students who receive the curriculum and those who
do not.
The primary outcome was a change in total test score from the pretest to the
posttest, with the posttest being administered after the intervention. In order to obtain a
change in score, separate scores for pretests and posttests were calculated. Each question
Reproduced with permission of the copyright owner. Further reproduction prohibited without permission.

61
was assigned a single point value for the correct answer and a total score was assigned for
each test. For each grade and year, 95% confidence intervals (CIs) were constructed
around the mean change in score, and comparisons were made of the CIs for action and
control schools to detect statistically significant differences. This analysis was then
performed by the self-identified racial/ethnic breakdown of White, Black, and Hispanic
participants.
Hypothesis 1 was tested using summary mean scores and constructing confidence
intervals around those scores by intervention for each grade and cohort. The summary
table (Table 5) provides a side-by-side look at the intervention and control school
performance over the 3-year longitudinal study. The schools receiving the TFFK
intervention consistently scored higher on the posttest than children receiving no
intervention. The intervention schools among all Cohorts at all grade levels had
significantly higher posttest scores when compared to control schools as demonstrated by
nonoverlapping confidence intervals.
In Cohorts A, B, and C the improvement in score (change in score) for the
intervention schools was significantly greater than the control schools for each year of
participation. For example, in Cohort A the confidence intervals around the mean scores
at pretest for Grade 1 intervention schools were (Cl = 17.2-17.3) compared to control
schools (Cl = 17.2-18.2) for controls. The confidence intervals around the mean scores at
posttest for Grade 1 intervention schools were (Cl = 21.7-22.2) compared to control
school (Cl = 18.9-19.6). Among Cohort B, the intervention schools improved by 4.4
points in 2000 and 4.0 in 2001. This increase in score was significantly higher than
Reproduced with permission of the copyright owner. Further reproduction prohibited without permission.

62
Table 5
Mean Scores by Cohort and 95% Confidence Intervals, Group and Year: TFFK Survey, 2000-2002
Intervention Control
2000 2001 2002 2000 2001 2002
CohortMeanscores Grade 1 Grade 2 Grade 3 Grade 1 Grade 2 Grade 3
A
Pretest
Posttest
17.4(17.2-17.3)
21.9(21.7-22.2)
16.3(16.0-16.6)
19.6(19.3-19.9)
15.5 (15.0-16.0)
19.6 (19.2-20.1)
17.7(17.2-18.2)
19.3(18.9-19.6)
15.2(14.7-15.6)
17.0(16.5-17.5)
13.6(13.0-14.2)
14.5(13.9-15.0)
Grade 2 Grade 3 Grade 4 Grade 2 Grade 3 Grade 4
B
Pretest
Posttest
15.2(14.9-15.5)
19.6(19.3-19.9)
16.4 (16.0-16.9)
20.4 (20.0-20.7)
18.9(18.5-19.2)
15.9(15.4-16.4)
16.6(16.2-17.0)
15.1(14.4-15.7)
16.7(16.1-17.2)
14.3(13.6-14.9)
Grade 3 Grade 4 Grade 3 Grade 4
C
Pretest
Posttest
15.3(14.7-15.8)
20.7(20.1-21.4)
19.0(18.4-19.7)
13.7(13.2-14.2)
16.2(15.8-16.6)
15.8(15.2-16.3)
Grade 4 Grade 4
D Posttest 16.1(15.6-16.6)
15.2(14.6-15.6)
Reproduced with permission of the copyright owner. Further reproduction prohibited without permission.

63
among the corresponding control schools that improved by 0.7 points in 2000,1.6 points
in 2001.
In theory, if retention of knowledge and self-reported behavior is occurring, the
cohort of students who have received TFFK should do better on their pretest than a cohort
who has not had the intervention. So Cohort A grade 2 should perform better than Cohort
B grade 2. The data show the pretest score for grade 2 intervention schools with 1 year of
TFFK was significantly higher than for grade 2 control with no prior TFFK intervention
(Cohort A grade 2, 95% Cl 16.0-16.6 compared to Cohort B grade 2, 95% Cl 14.9-15.5).
Cohort B grade 3 should outperform Cohort C grade 3 on the pretest and that was
supported as reflected in the CIs (Cohort B grade 3, 95% Cl 16.0-16.9 compared to
Cohort C grade 3, 95% Cl 14.7-15.8).
Although the pretest baseline scores were similar for Grade 1 for both the
intervention and control schools, when Cohort A progressed to grade 2 the intervention
students that had already had 1 year of the TFFK program scored a higher baseline on
the Grade 2 pretest than the control students who had not been exposed to the TFFK
program. Similarly, when Cohort A progressed to Grade 3 the gap between the pretest
scores for students who had already had 2 years of the TFFK program and the control
students was even larger — the intervention students scoring higher. Observing this trend
addresses the concept of retention of knowledge over time, from one grade to another.
Data were then stratified by racial/ethnic group and is shown in Tables 6, 7 and 8.
Some cells are empty due to no subjects within that stratification. White students in
Cohort A, grades 1 and 3 and Cohorts B and C, grade 1, the improvement in score
(change in score) for the intervention schools was significantly greater than the control
Reproduced with permission of the copyright owner. Further reproduction prohibited without permission.

64
Table 6
Mean Scores fo r White Students, Cohorts, A, B, and C by Group: TFFK Survey, 2000-2002
Intervention Control
2000 2001 2002 2000 2001 2002
Mean Cohort scores Grade 1 Grade 2 Grade 3 Grade 1 Grade 2 Grade 3
Pretest 18.35(17.8-18.9)
17.2(16.8-17.7)
17.7(17.1-18.3)
19.3(18.4-20.2)
15.5(14.4-16.6)
15.8(14.0-17.6)
. Posttest A 22.4(22.0-22.7)
20.3(19.9-20.7)
21.4(20.6-22.1)
20.0(19.3-20.7)
17.0(16.0-18.0)
15.0(13.2-16.8)
Change 4.1 (3.6-4.6)
3.1 (2.5-3.7)
3.8 (3.1-4.4)
.67(-.1-1.4)
1.5(.1-2.9)
-.8(-2.4-.9)
Grade 2 Grade 3 Grade 4 Grade 2 Grade 3 Grade 4
Pretest
BPosttest
15.9(5.4-16.3)
20.3(20.0-20.7)
17.6(16.9-18.2)
20.2(19.7-20.7)
19.3(18.7-19.8)
16.8(16.0-17.6)
16.6(16.2-17.0)
15.7(14.4-17.1)
18.0(16.9-19.0)
17.0(15.1-18.8)
Change 4.5 (4.0-5.1)
2.6 (1.8-3.4)
0.7 (0.2-1.3)
2.2 (0.6-3.8)
Grade 3 Grade 4 Grade 5 Grade 3 Grade 4 Grade 5
Pretest 15.4(14.3-16.6)
15.8(15.1-16.6)
^ Posttest 21.0(20.2-21.9)
19.0(18.2-19.9)
17.1(15.8-18.5)
18.7(18.1-19.2)
18.1(16.8-19.4)
14.3(13.2-15.5)
Change 5.6(4.4-6.8)
2.8 (2.0-3.7)
Reproduced with permission of the copyright owner. Further reproduction prohibited without permission.

65
Table 7
Mean Scores fo r Black Students, Cohorts, A, B, and C by Intervention: TFFK Survey,2000-2002
Intervention Control
2000 2001 2002 2000 2001 2002
Mean Cohort scores Grade 1 Grade 2 Grade 3 Grade 1 Grade 2 Grade 3
Pretest 17.23(16.5-18.0)
15.8(14.8-16.8)
12.3(10.5-14.0)
16.8(15.2-18.3)
14.6(13.7-15.6)
12.0(9.0-15.0)
. Posttest A 21.7(21.1-22.2)
19.2(18.4-20.0)
17.3(15.8-18.9)
20.0(18.8-22.3)
16.2(15.0-17.4)
14.3(12.2-16.4)
Change 4.5 (3.8-5.1)
3.4(2.2-4.5)
5.0 (3.1-7.0)
3.3 (2.0-4.5)
1.5(-.1-3.2)
2.3(-.5-5.1)
Grade 2 Grade 3 Grade 4 Grade 2 Grade 3 Grade 4
Pretest
BPosttest
14.0(13.4-14.5)
19.2(18.5-20.0)
14.9(13.8-16.0)
20.3(19.4-21.2)
19.5(18.3-20.7)
15.4(13.3-17.5)
16.3(14.3-18.2)
14.9(13.0-16.9)
14.8(13.2-16.4)
13.8(12.2-15.5)
Change 5.3 (4.5-6.1)
5.1(4.2-6.7)
0.8(-2.7-4.3)
-.1(-2.5-23)
Grade 3 Grade 4 Grade 5 Grade 3 Grade 4 Grade 5
Pretest 22.8(11.5-14.1)
£ Posttest 17.5(11.1-23.9)
16.7(15.6-17.8)
15.3(14.0-16.6)
15.3(14.1-16.6)
Change 3.9 (2.6-5.1)
Reproduced with permission of the copyright owner. Further reproduction prohibited without permission.
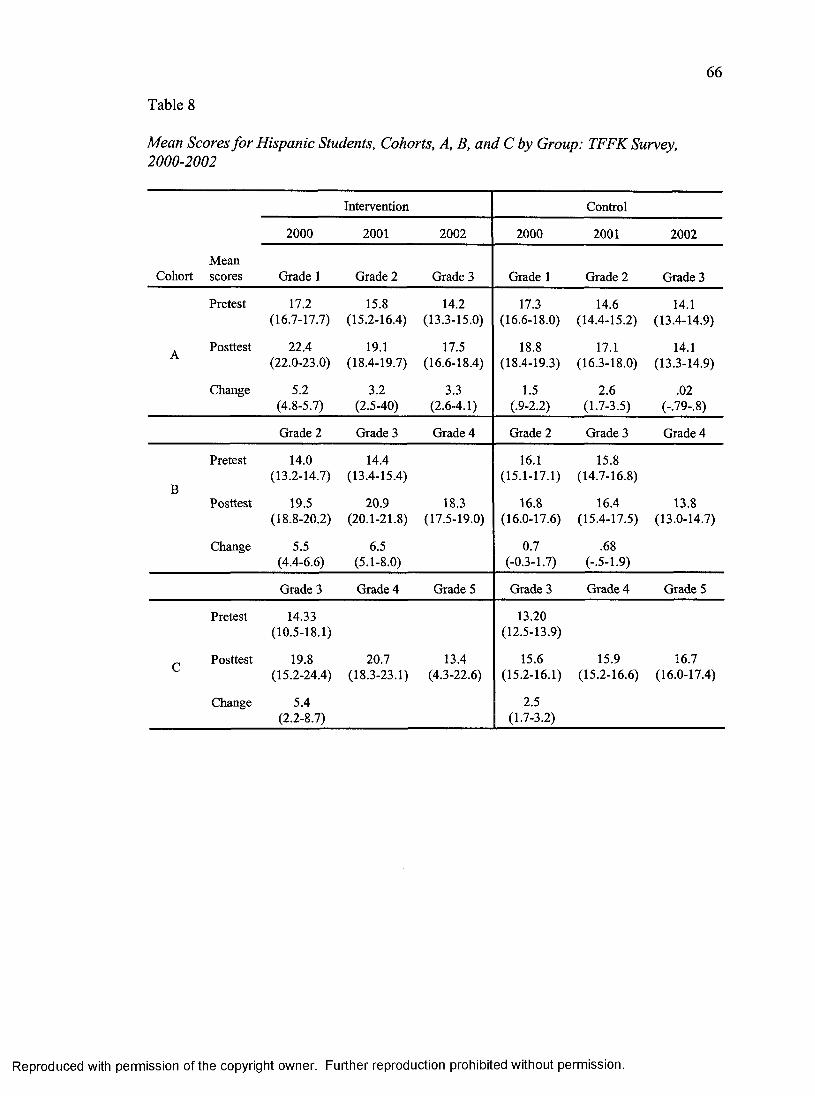
66
Table 8
Mean Scores for Hispanic Students, Cohorts, A, B, and C by Group: TFFK Survey,2000-2002
Intervention Control
2000 2001 2002 2000 2001 2002
Mean Cohort scores Grade 1 Grade 2 Grade 3 Grade 1 Grade 2 Grade 3
Pretest 17.2(16.7-17.7)
15.8(15.2-16.4)
14.2(13.3-15.0)
17.3(16.6-18.0)
14.6(14.4-15.2)
14.1(13.4-14.9)
. Posttest A 22.4(22.0-23.0)
19.1(18.4-19.7)
17.5(16.6-18.4)
18.8(18.4-19.3)
17.1(16.3-18.0)
14.1(13.3-14.9)
Change 5.2(4.8-5.7)
3.2(2.5-40)
3.3 (2.6-4.1)
1.5(.9-2.2)
2.6 (1.7-3.5)
.02(-.79-.8)
Grade 2 Grade 3 Grade 4 Grade 2 Grade 3 Grade 4
Pretest
BPosttest
14.0(13.2-14.7)
19.5(18.8-20.2)
14.4(13.4-15.4)
20.9(20.1-21.8)
18.3(17.5-19.0)
16.1(15.1-17.1)
16.8(16.0-17.6)
15.8(14.7-16.8)
16.4(15.4-17.5)
13.8(13.0-14.7)
Change 5.5 (4.4-6.6)
6.5 (5.1-8.0)
0.7 (-0.3-1.7)
.68(-.5-1.9)
Grade 3 Grade 4 Grade 5 Grade 3 Grade 4 Grade 5
Pretest 14.33(10.5-18.1)
13.20(12.5-13.9)
£ Posttest 19.8(15.2-24.4)
20.7(18.3-23.1)
13.4(4.3-22.6)
15.6(15.2-16.1)
15.9(15.2-16.6)
16.7(16.0-17.4)
Change 5.4(2.2-8.7)
2.5 (1.7-3.2)
Reproduced with permission of the copyright owner. Further reproduction prohibited without permission.

67
schools for each year of participation. Among Black students in Cohort B grades 1 and 2,
the improvement in score (change in score) for the intervention schools was significantly
greater than the control schools for each year of participation. Hispanic students showed
consistently high absolute improvements in score. In Cohort A, grades 1 and 3 and
Cohorts B grades 1 and 2, the improvement in score (change in score) for the intervention
schools was significantly greater than the control schools for each year of participation.
Racial/Ethnic Findings
Overall, several observations can be made when referring to performance by
racial/ethnic group. White students attained the highest scores on the pretests (baseline),
but Hispanics and then Blacks attained the greatest increase from the pre- to posttest
scores. Although Hispanics and Blacks had lower baseline scores, they were able to
achieve high results after the curriculum. The intervention schools outperformed the
control schools. For Cohorts A and B, Hispanics had a significantly higher posttest
score in all grades when compared to the control schools. For Cohort B, Blacks had a
significantly higher posttest score in all grades when compared to the control schools.
Fourth Grade
Overall scores for fourth grade students reflect a lack of injury-related knowledge
and positive safety behaviors. Grade 4 students scored about 60% on the third grade test,
indicating a major need for injury prevention education. In grade 4, the score distributions
were similar for intervention and control schools. This is a logical finding considering
that there was not an intervention for fourth grade students.
Reproduced with permission of the copyright owner. Further reproduction prohibited without permission.

68
The most important conclusion regarding fourth grade students was generated in
the comparison to third grade students. Third and fourth grade students have a similar
baseline level of injury-related knowledge. And, third grade students who participate in
the TFFK curriculum surpass the fourth grade level of injury-related knowledge. These
findings support the view that fourth grade students, although having matured for one full
year past third grade, are still lacking important injury prevention knowledge.
For students in Cohort B who progressed from Grade 2 to Grade 4, the interven
tion schools had a greater increase in posttest scores than control counterparts. Again,
intervention schools that progressed to Grade 3 (and had already had grade 2 of TFFK)
scored higher on their pretests than the control schools. It should be noted that Grade 4
posttest scores were significantly higher among the intervention schools when compared
to the control schools — despite the fact that Grade 4 had no educational intervention.
The only difference being that the intervention schools in Cohort B had 2 years of TFFK
before getting to grade 4, whereas the control schools had no intervention. The Grade 4
test grade was similar to the Grade 3 posttest (again showing retention of information).
For students in Cohort C, recall they progressed from Grade 3 through Grade 4 over the
course of the study. Intervention school posttests were higher than control schools for
Grades 3 and 4. In control schools, the grade 4 posttest was barely higher than the
Grade 3 pretest, and was almost equal that of the Grade 3 posttest.
General Linear Model Repeated Measures Analysis
Hypothesis 2 was tested by estimating the overall effect of the curriculum, using a
GLM repeated measures, analysis of variance procedure for each Cohort and determine
Reproduced with permission of the copyright owner. Further reproduction prohibited without permission.

69
the effects of between-subject factors (year and intervention or control); covariates
(gender, race/ethnicity, and API); and within subject factors (pre- and posttest scores).
The GLM procedure was used to adjust for the covariates to determine if the TFFK
intervention was a predictor of improved performance. The results were plotted on graphs
to show the progression of the cohorts over time.
Retrospective Power Analysis
Power analysis can determine whether there is a sufficient chance of rejecting the
null hypothesis when it is false. In other words, power is the ability to detect an effect if
there is one. The approach to statistical power analysis is based on the F statistic for
testing statistical hypothesis in the GLM (Murphy & Myors, 2004). In this analysis, the
overall question is whether there are significant differences in mean change scores among
the groups (i.e., intervention and control) by cohort and by year adjusting for gender,
race/ethnicity and API. In SPSS, appropriate statistics are accepted as input data and
power computations are produced as part of the GLM repeated measures procedure
output. The power for the multivariate test of the 2-way COHORT * GROUP interaction
effect is 100%. The power for the multivariate test of the 3-way COHORT * GROUP *
YEAR interaction effect is also 100% or more than adequate.
Cohort A
The Within-Subjects Factors
A within-subjects factor is any factor that distinguishes measurements made on
the same subject or case rather than distinguishing different subjects or cases. In this
analysis, the factor “prepost” is a within-subjects factor because it distinguishes the two
Reproduced with permission of the copyright owner. Further reproduction prohibited without permission.

70
measurements of test scores for each of the subjects. There are two levels of the within-
subjects factor called prepost. The dependent variables that make up the two levels of
prepost are the pretest and posttest scores (George & Mallery, 2004).
Of note, the within-subjects effect is analyzed in GLM by first transforming the
original variables into single degree of freedom (df) tests of the null hypothesis. In this
analysis, the prepost within-subjects effect has a single degree of freedom, so there is
only one single degree of freedom estimate of the prepost effect. GLM will create two
transformed scores, one for the average of the repeated measures variables, pretest and
posttest, and one for the prepost main effect. The between-subjects effects will be
analyzed using the transformed score, average (George & Mallery, 2004).
The Between-Subjects Factors
A between-subjects factor is any factor that divides the sample of subjects or cases
into discrete subgroups. In this analysis, the factors Group (1 = intervention, 2 = control)
and year (1 = 2000, 2 = 2001, 3 = 2002) are between-subjects factors. Table 9 shows the
two levels for the between-subjects factor group along with the numbers for the two cells,
and the three levels of the other between-subjects factor year along with the numbers for
the three cells (George & Mallery, 2004).
Covariates
In this analysis, gender, race/ethnicity, and API are included as constant covariates
whose values remain the same at each within-subjects (prepost) level (i.e., their values do
not change from pre- to posttest).
Reproduced with permission of the copyright owner. Further reproduction prohibited without permission.

71
Table 9
Between-Subjects Factors for Cohort A
Group and year Value label N
Group1 Intervention 1,1792 Control 414
Year1 2000 6242 2001 5373 2002 432
The between-subjects effects are adjusted for covariates. Differences between groups
are tested controlling for gender, race/ethnicity, and API.
Descriptive Statistics
Descriptive statistics for the two variables, pretest and posttest, are shown in
Table 10. The means in the rows labeled “Total” are weighted means.
Multivariate Tests
When the within-subjects tests are single degree of freedom tests, as in this
analysis, then the multivariate Fs will be identical to the univariate Fs shown in Table 11.
Tests of Within-Subjects Effects
There are several significant within-subjects effects (Table 12). The results of the
tests of the within-subjects effects indicate significant effects for the prepost main effect
(F=2S.122,p value < 0.0005), the prepost by group interaction (F = 191.376,p value <
0.0005), and the prepost by group by year interaction (F = 10.659, p value < 0.0005).
Reproduced with permission of the copyright owner. Further reproduction prohibited without permission.

Table 10
Descriptive Statistics for Cohort A
72
Test Group Year MeanStandarddeviation N
Intervention 2000 17.46 3.283 4662001 16.34 3.030 3992002 15.55 4.382 314Total 16.57 3.615 1,179
Control 2000 18.78 3.252 1582001 14.92 3.038 138rretest 2002 13.81 3.913 118Total 16.08 4.015 414
Total 2000 17.80 3.322 6242001 15.97 3.092 5372002 15.08 4.325 432Total 16.44 3.728 1,593
Intervention 2000 21.87 2.718 4662001 19.58 2.934 3992002 19.55 4.125 314Total 20.48 3.408 1,179
Control 2000 19.48 2.558 158Tk _ _i.A _ 2001 16.62 3.324 138rosttest 2002 14.60 3.286 118
Total 17.13 3.640 414
Total 2000 21.26 2.871 6242001 18.81 3.300 5372002 18.20 4.492 432Total 19.61 3.766 1,593
Reproduced with permission of the copyright owner. Further reproduction prohibited without permission.

73
Table 11
Tests o f Within-Subjects Effects fo r Cohort A
Effect Test Value FHypothesis
df Error df Significance
Prepost Pillai’s Trace .018 28.722a 1.000 1584.000 .000
Prepost * gender Pillai’s Trace .000 .524a 1.000 1584.000 .469
Prepost * raceeth Pillai’s Trace .001 2.055a 1.000 1584.000 .152
Prepost * api Pillai’s Trace .006 9.875a 1.000 1584.000 .002
Prepost * intrvntn Pillai’s Trace 1.08 191.376a 1.000 1584.000 .000
Prepost * yr Pillai’s Trace .000 .223a 2.000 1584.000 .800
Prepost * intrvntn * yr Pillai’s Trace .013 10.6593 2.000 1584.000 .000
Note. Design: Intercept+gender+race_eth+api+group+yr+group * yr Within Subjects Design: prepost. aExact statistic.
Table 12
Tests o f Within-Subjects Effects for Cohort A: Measure and Score
Source TestType III sum
of squares dfMeansquare F Significance
Prepost Sphericityassumed
184.012 1 184.012 28.722 .000
Prepost * gender Sphericityassumed
3.356 1 3.356 .524 4.69
Prepost * race eth Sphericityassumed
13.167 1 13.167 2.055 .152
Prepost * api Sphericityassumed
63.266 1 63.266 9.875 .002
Prepost * group Sphericityassumed
1226.064 1 1266.046 191.376 .000
Prepost * yr Sphericityassumed
2.857 2 1.429 .223 .800
Prepost * group * yr Sphericityassumed
136.574 2 68.287 10.659 .000
Error (prepost) Sphericityassumed
10148.013 1584 6.407
Reproduced with permission of the copyright owner. Further reproduction prohibited without permission.

74
The general approach to interpreting analysis of variance (ANOVA) effects is to
begin with the highest order interaction. In this analysis, it is the three-way interaction,
prepost by group by year. As noted in Table 12, there is a significant three-way
interaction between group, year, and prepost (see profile plots for interpretation of
significant interactions).
Of note, when there is interaction, there would be less interest in the main effects
but instead one would examine one factor’s effect at each level of the other factor(s). In
other words, when there is significant interaction, main effects are not normally
interpreted.
Tests of Between-Subjects Effects
As explained above, there is a significant three-way interaction between group,
year, and prepost. The estimated marginal means for the three-way interaction are shown
in the Table 13. It is, however, difficult to see what is happening in the three-way
interaction by just looking at Table 16 of means. The profile plots are more helpful.
Profile Plots
Plots provide the clearest visualization of the mean scores of the Cohorts as they
progressed throughout the study, 2000-2002. As noted above, there is a significant
three-way interaction between group, year, and prepost. The essence of a three-way
interaction is that the two-way interaction is not the same at each level of the 3rd factor.
There are several possibilities here but we could examine group by prepost at each level
of year (Figure 1), or year by prepost interaction within each level of group (Figure 2), or
prepost by group interaction within each level of year (Figure 3).
Reproduced with permission of the copyright owner. Further reproduction prohibited without permission.
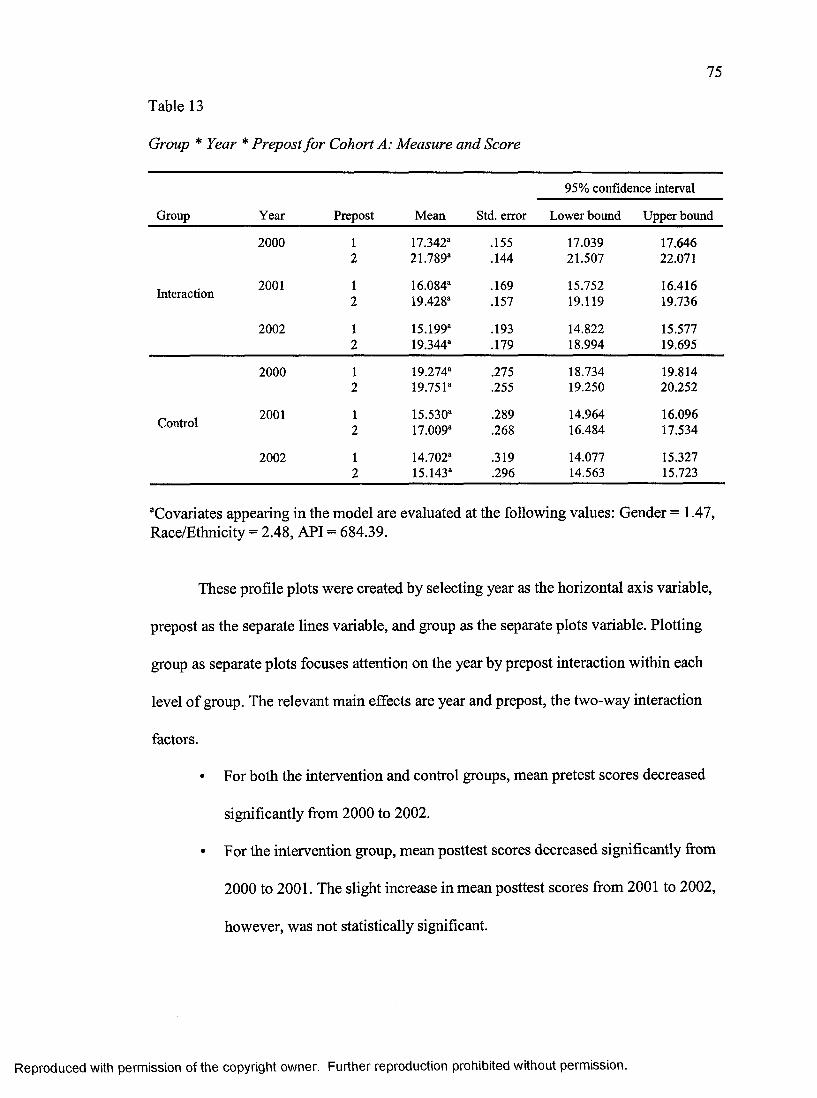
75
Table 13
Group * Year * Prepost for Cohort A: Measure and Score
Group Year Prepost Mean Std. error
95% confidence interval
Lower bound Upper bound
2000 1 17.342“ .155 17.039 17.6462 21.789“ .144 21.507 22.071
Interaction 2001 1 16.084“ .169 15.752 16.4162 19.428“ .157 19.119 19.736
2002 1 15.199“ .193 14.822 15.5772 19.344“ .179 18.994 19.695
2000 1 19.274“ .275 18.734 19.8142 19.751“ .255 19.250 20.252
Control 2001 1 15.530“ .289 14.964 16.0962 17.009“ .268 16.484 17.534
2002 1 14.702“ .319 14.077 15.3272 15.143“ .296 14.563 15.723
aCovariates appearing in the model are evaluated at the following values: Gender = 1.47, Race/Ethnicity = 2.48, API = 684.39.
These profile plots were created by selecting year as the horizontal axis variable,
prepost as the separate lines variable, and group as the separate plots variable. Plotting
group as separate plots focuses attention on the year by prepost interaction within each
level of group. The relevant main effects are year and prepost, the two-way interaction
factors.
• For both the intervention and control groups, mean pretest scores decreased
significantly from 2000 to 2002.
• For the intervention group, mean posttest scores decreased significantly from
2000 to 2001. The slight increase in mean posttest scores from 2001 to 2002,
however, was not statistically significant.
Reproduced with permission of the copyright owner. Further reproduction prohibited without permission.

76
Estimated Marginal Means of score
"at GROUP = intervention"
2 4 -
22 -
20 -
16-
‘■*3 14 -
12-
2000 2001 2002
PREPOST pretest posttest
Year
Estimated Marginal Means of score
"at GROUP = control"
2 4 -
W 2 2 —in ^
S’re 18 -
12-2000 2001 2002
PREPOST pretest posttest
Year
Figure 1. Cohort A’s profile plots of the year by prepost by group interaction means.
Reproduced with permission of the copyright owner. Further reproduction prohibited without permission.

77
Estimated Marginal Means of score
"at PREPOST = pretest"
GROUP Intervention control
2 4 -
22 -
20 -
16-
12-
2001 20022000
Year
Estimated Marginal Means of score
"at PREPOST = posttest"
GROUP Intervention control
2 4 -
8 22-
W 2 0 -
& 16-
12-2001 20022000
Year
Figure 2. Cohort A’s profile plots of the year by group by prepost interaction means.
Reproduced with permission of the copyright owner. Further reproduction prohibited without permission.

Estimated Marginal Means of score
78
"at YEAR = 2000"
2 4 -</>C 3 22 -
s« 20-
E*<9 16-sT>3 1fr- rtE♦3 14-</>UJ
12-
GROUP Intervention— control
pretest posttest
prepost
Estimated Marginal Means of score
"at YEAR = 2001”
GROUP — — Intervention control2 2 -
20 -
W 1 8 -
1 6 -
12-
pretest posttest
prepost
Estimated Marginal Means of score
"at YEAR® 2002"
22 -
20 -
18-
16-
12-
GROUP— Intervention— control
pretest posttest
prepost
Figure 3. Cohort A’s profile plots of the prepost by group by year interaction means.
Reproduced with permission of the copyright owner. Further reproduction prohibited without permission.

79
• For the control group, mean posttest scores decreased significantly from 2000
to 2002.
• For the intervention group, differences between mean pre- and posttests were
statistically significant within each year.
• For the control group, mean scores increased slightly from pre- to posttest by
0.477 and 0.441 points in 2000 and 2002, respectively. In 2001, however,
mean scores increased significantly by 1.479 points from pre- to posttest.
These profile plots use year as the horizontal axis, group as the separate lines
variable, prepost as the separate plots variable. Plotting the pre- and posttest scores as
separate plots focuses attention on the group by year interaction. The relevant simple
main effects are year, and group the two-way interaction factors.
• For both the intervention and control groups, mean pretest scores decreased
significantly from 2000 to 2002.
• In 2000, mean pretest score was significantly higher among the control group
than the intervention group. In 2001 and 2002, however, mean pretest scores
of the two groups were not significantly different.
• For the intervention group, mean posttest scores decreased significantly from
2000 to 2001, but there was very little change in mean posttest scores from
2001 to 2002.
• For the control group, mean posttest scores decreased significantly from 2000
to 2002.
Reproduced with permission of the copyright owner. Further reproduction prohibited without permission.

80
• Within each year, mean posttest scores were significantly higher for the
intervention group than the control group, with the largest difference occurring
in 2002.
Plotting the year as separate plots (Figure 4) focuses attention on the prepost by
group interaction. The relevant simple main effects are prepost, and group the two-way
interaction factors. The interpretation of these three prepost by group interactions within
year is possible but the previous two ways is optimal.
Estimated Marginal Means of score
GROUP intervention— control
2 4 -
C 2 2 —
- S 2 0 -
(0 18 -
12-
200220012000Year
Figure 4. Cohort A’s overall group by year interaction plot.
Cohort B
The Within-Subjects Factors
There are two levels of the within-subjects factor called prepost. The dependent
variables that make up the two levels of prepost are the pretest (pretest_Cohort_B) and
posttest.
Reproduced with permission of the copyright owner. Further reproduction prohibited without permission.

81
The Between-Subjects Factors
Table 14 shows the two levels for the between-subjects factor group along with
the numbers for the two cells, and the three levels of the other between-subjects factor
year along with the numbers for the three cells.
Table 14
Between-Subject Factors for Cohort A
Group and year Value label N
Group1 Intervention 1,0922 Control 528
Year1 2000 6612 2001 5013 2002 458
Covariates
In this analysis, gender, race/ethnicity, and API are included as constant covariates
whose values remain the same at each within-subjects (prepost) level (i.e., their values do
not change from pre- to posttest).
Of note, the between-subjects effects are adjusted for covariates. Differences
between groups are tested controlling for gender, race/ethnicity, and API.
Descriptive Statistics
Descriptive statistics for the two variables, pretest (pretest_Cohort_B) and
posttest, are shown in Table 15. The means in the rows labeled “Total” are weighted
means.
Reproduced with permission of the copyright owner. Further reproduction prohibited without permission.

Table 15
Descriptive Statistics for Cohort B
82
Test Group Year MeanStandarddeviation N
Intervention 2000 15.29 3.150 4532001 16.45 3.941 3422002 18.86 3.258 297Total 16.62 3.735 1,092
Control 2000 15.90 3.394 2082001 15.08 4.069 159Pretest 2002 14.39 4.569 161Total 15.19 4.028 528
Total 2000 15.48 3.239 6612001 16.01 4.029 5012002 17.29 4.329 458Total 16.16 3.890 1,620
Intervention 2000 19.56 3.017 4532001 20.35 3.132 3422002 18.86 3.258 297Total 19.62 3.169 1,092
Control 2000 16.64 3.011 2082001 16.68 3.640 159Posttest 2002 14.39 4.569 161Total 15.96 3.868 528
Total 2000 18.64 3.305 6612001 19.18 3.716 5012002 17.29 4.329 458Total 18.42 3.817 1,620
Reproduced with permission of the copyright owner. Further reproduction prohibited without permission.

83
Multivariate Tests
When the within-subjects tests are single degree of freedom tests, as in this
analysis, then the multivariate Fs will be identical to the univariate Fs shown in Table 16.
Table 16
Tests o f Within-Subjects Effects for Cohort B: Measure and Score
Source TestType III sum
of squares dfMeansquare F Significance
Prepost Sphericityassumed
163.922 1 163.922 24.270 .000
Prepost * gender Sphericityassumed
.598 1 .598 .089 .766
Prepost * race eth Sphericityassumed
7.094 1 7.094 1.050 .306
Prepost * api Sphericityassumed
75.991 1 75.991 11.251 .001
Prepost * group Sphericityassumed
646.438 1 646.438 95.710 .000
Prepost * yr Sphericityassumed
1026.025 2 513.012 75.956 .000
Prepost * group * yr Sphericityassumed
316.080 2 158.040 23.399 .000
Error (prepost) Sphericityassumed
10880.868 1611 6.754
Tests of Within-Subjects Effects
There are several significant within-subjects effects. The results of the tests of the
within-subjects effects indicate significant effects for the prepost main effect (F = 24.270,
p value < 0.0005), the prepost by group interaction (F= 95.710, p value < 0.0005), the
prepost by year interaction (F = 75.956, p value < 0.0005), and the three-way prepost by
group by year interaction (F = 23.399,p value < 0.0005).
Reproduced with permission of the copyright owner. Further reproduction prohibited without permission.

84
In this analysis, it is the three-way interaction, prepost by group by year. As noted
above, there is a significant three-way interaction between group, year, and prepost (see
estimated marginal means and profile plots for interpretation of significant interactions).
Tests of Between-Subjects Effects
Univariate tests of the main effects of group and year (between-subjects factors)
are shown in Table 17. Recall that the between-subjects effects are tested by the
transformed variable called average.
Table 17
Tests o f Between-Subjects Effects for Cohort B: Measure and Score
SourceType III sum
of squares df Mean square F Significance
Intercept 5352.599 1 5352.599 316.762 .000
Gender 68.074 1 68.074 4.029 .045
Race_eth 289.019 1 289.019 17.104 .000
Api 469.797 1 469.797 27.802 .000
Group 1698.875 1 1698.875 100.538 .000
Year 78.504 2 39.252 2.323 .098
Group * year 1056.434 2 528.217 31.259 .000
Error 27222.448 1611 16.898
Note. Covariates appearing in the model are evaluated at the following values: Gender = 1.47, Race/Ethnicity = 2.61, API = 694.60.
Profile Plots
As noted above, there is a significant three-way interaction between, group, year,
and prepost. The essence of a three-way interaction is that the two-way interaction is not
Reproduced with permission of the copyright owner. Further reproduction prohibited without permission.

85
the same at each level of the 3rd factor. There are several possibilities here, but we could
examine group by prepost at each level of year (Figure 5), or year by prepost interaction
within each level of group (Figure 6), or prepost by group interaction within each level of
year (Figure 7).
These profile plots were created by selecting year as the horizontal axis variable,
prepost as the separate lines variable, and group as the separate plots variable. Plotting
group as separate plots focuses attention on the year by prepost interaction within each
level of group. The relevant main effects are year and prepost, the two-way interaction
factors. Note: In 2002, 4th grade students were tested one time using the posttest survey;
therefore, 2002 pretest = 2002 posttest.
• For the intervention group, mean pretest scores increased significantly from
2000 to 2002. Mean posttest scores increased significantly from 2000 to 2001.
From 2001 to 2002, however, mean posttest scores decreased significantly in
this group.
• For the control group, mean pre- and posttest scores decreased significantly
from 2000 to 2002.
• Among the intervention group, differences in mean pre- and posttest scores
were statistically significant in 2000 and 2001.
• Among the control group, differences in mean pre- and posttest scores were
statistically significant in 2001 but not in 2000.
• The changes in mean scores from pre- to posttest were significantly greater in
the intervention group (4.376 and 4.046 points in 2000 and 2001, respectively)
Reproduced with permission of the copyright owner. Further reproduction prohibited without permission.

86
Estimated Marginal Means of score
"at GROUP = intervention"
PREPOST pretest posttest
2 4 -
22 -
20 -
e>W 18-
*3 14-
12-
2000 2001 2002Year
Estimated Marginal Means of score
"at GROUP = control"
PREPOST pretest posttest
2 4 -
(0 22 — Mi “
re 2 0 -
18-
16-
14-
12-
20022000 2001Year
Figure 5. Cohort B’s profile plots of the year by prepost by group interaction means.
Reproduced with permission of the copyright owner. Further reproduction prohibited without permission.

87
Estimated Marginal Means of score
"at PREPOST = pretest"
GROUP intervention control
2 4 -
22 -
20 -
2001 20022000
Year
Estimated Marginal Means of score
"at PREPOST = posttest"
GROUP intervention control
2 4 -
re 2 0 -
G—
■J3 14-
200220012000
Year
Figure 6. Cohort B’s profile plots of the year by group by prepost interaction means.
Reproduced with permission of the copyright owner. Further reproduction prohibited without permission.

Estimated Marginal Means of score
88
"at YEAR = 2000"
2 4 - GROUP — — Intervention controlS > 22-
2 20-
f9 18-
58 n-12-
pretest posttest
prepost
Estimated Marginal Means of score
"at YEAR * 2001"
GROUP Intervention— - control
2 4 -
8 2 2 -
20 -
18-
16-
14-
12-
pretest posttest
prepost
Estimated Marginal Means of score
"at YEAR = 2002"
2 4 - GROUP — Intervention controlm 2 2 -
g 20-
« 1 8-
12-
pretest posttest
prepost
Figure 7. Cohort B’s profile plots of the prepost by group by year interaction means.
Reproduced with permission of the copyright owner. Further reproduction prohibited without permission.

89
than the control group (0.381 and 1.412 points in 2000 and 2001,
respectively).
These profile plots use year as the horizontal axis, group as the separate lines
variable, prepost as the separate plots variable. Plotting the pre- and posttest scores as
separate plots focuses attention on the group by year interaction. The relevant simple,
simple main effects are year and group, the two-way interaction factors. Note: In 2002, 4th
grade students were tested one time using the posttest survey; therefore, 2002 pretest =
2002 posttest.
• Mean pretest scores for the intervention group increased significantly from
2000 to 2002.
• For the control group, mean pretest scores decreased significantly from 2000
to 2001 but there was very little change in mean pretest scores from 2001 to
2002.
• In 2000, mean pretest score for the intervention group was significantly lower
than mean pretest score for the control group. The difference in mean pretest
scores of the two groups was not statistically significant in 2001. In 2002,
however, mean pretest score was significantly higher for the intervention
group than the control group.
• For the intervention group, mean posttest scores increased significantly from
2000 to 2001 but decreased significantly in 2002.
• Among the control group, there was a statistically significant decrease in mean
posttest scores from 2000 to 2002.
Reproduced with permission of the copyright owner. Further reproduction prohibited without permission.

90
• Mean posttest scores were significantly higher for the intervention group than
the control group with the largest difference occurring in 2002.
Plotting the year as separate plots (Figure 8) focuses attention on the prepost by
group interaction. The relevant simple main effects are prepost and group, the two-way
interaction factors. The interpretation of these three prepost by group interactions within
year is possible but the above two ways are optimal.
Estimated Marginal Means of score
GROUPInterventioncontrol
« 18—
Figure 8. Cohort B’s overall group by year interaction profile plot.
Cohort C
The Within-Subjects Factors
As with the prior cohorts, there are two levels of the within-subjects factor called
prepost. The dependent variables that make up the two levels of prepost are pretest
(pretest_Cohort_C) and posttest.
Reproduced with permission of the copyright owner. Further reproduction prohibited without permission.

91
The Between-Subjects Factors
Table 18 shows the two levels for the between-subjects factor group along with
the numbers for the two cells, and the three levels of the other between-subjects factor
year along with the numbers for the three cells.
Table 18
Between-Subject Factors for Cohort C
Group and year Value label N
Group1 Intervention 2322 Control 306
Year1 2000 3102 2001 228
Covariates
In this analysis, gender, race/ethnicity, and API are included as constant covariates
whose values remain the same at each within-subjects (prepost) level (i.e., their values do
not change from pre- to posttest). Of note, the between-subjects effects are adjusted for
covariates. Differences between groups are tested controlling for gender, race/ethnicity
and API.
Descriptive Statistics
Descriptive statistics for the two variables, pretest (pretest_Cohort_C) and
posttest, are shown in Table 19. The means in the rows labeled “Total” are weighted
means.
Reproduced with permission of the copyright owner. Further reproduction prohibited without permission.
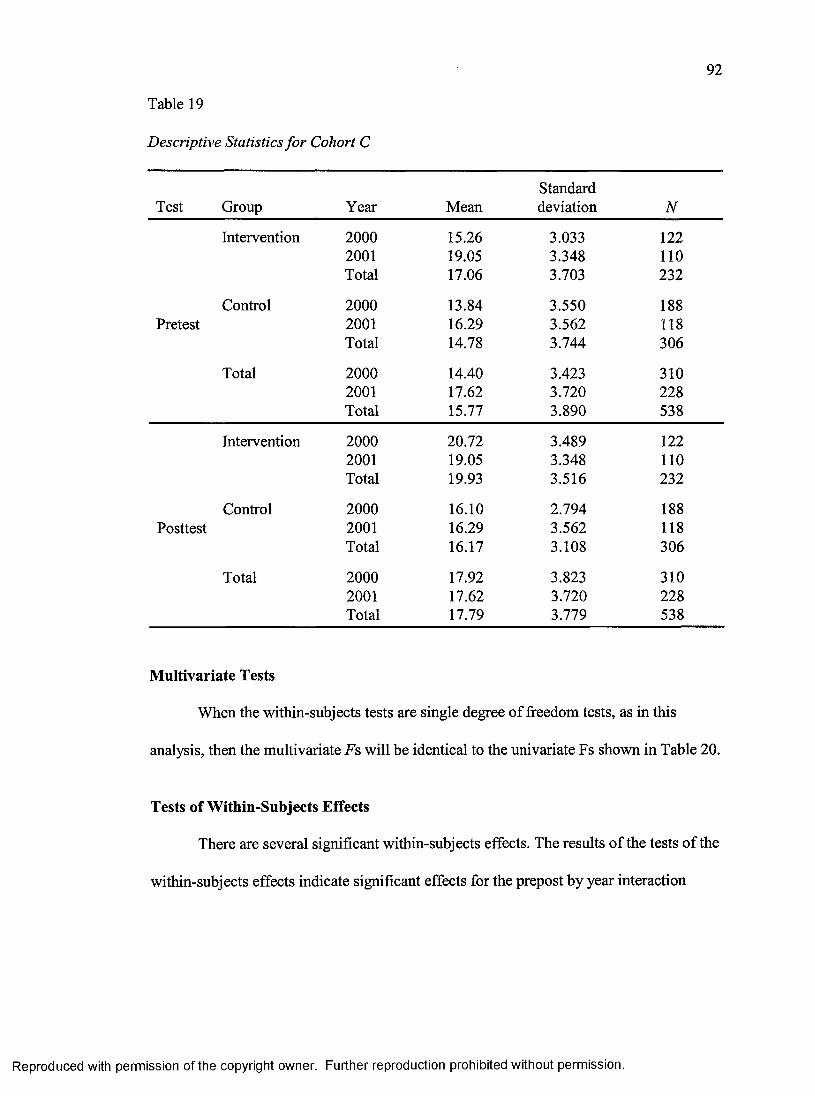
92
Table 19
Descriptive Statistics for Cohort C
Test Group Year MeanStandarddeviation N
Intervention 2000 15.26 3.033 1222001 19.05 3.348 110Total 17.06 3.703 232
Control 2000 13.84 3.550 188Pretest 2001 16.29 3.562 118
Total 14.78 3.744 306
Total 2000 14.40 3.423 3102001 17.62 3.720 228Total 15.77 3.890 538
Intervention 2000 20.72 3.489 1222001 19.05 3.348 110Total 19.93 3.516 232
Control 2000 16.10 2.794 188Posttest 2001 16.29 3.562 118
Total 16.17 3.108 306
Total 2000 17.92 3.823 3102001 17.62 3.720 228Total 17.79 3.779 538
Multivariate Tests
When the within-subjects tests are single degree of freedom tests, as in this
analysis, then the multivariate Fs will be identical to the univariate Fs shown in Table 20.
Tests of Within-Subjects Effects
There are several significant within-subjects effects. The results of the tests of the
within-subjects effects indicate significant effects for the prepost by year interaction
Reproduced with permission of the copyright owner. Further reproduction prohibited without permission.

93
(F = 227.369, p value < 0.0005), and the prepost by group by year interaction (F =
40.793, p value < 0.0005).
In this analysis, it is the three-way interaction, prepost by group by year. As noted
above, there is a significant three-way interaction between group, year and prepost
(Table 21).
Table 20
Tests o f Within-Subjects Effects for Cohort C: Measure and Score
Source TestType III sum
of squares dfMeansquare F Significance
Prepost Sphericityassumed
11.757 1 11.757 2.780 .096
Prepost * gender Sphericityassumed
2.756 1 2.756 .652 .420
Prepost * race_eth Sphericityassumed
2.400 1 2.400 .567 .452
Prepost * api Sphericityassumed
36.540 1 36.540 8.639 .003
Prepost * group Sphericityassumed
5.709 1 5.709 1.350 .246
Prepost * yr Sphericityassumed
961.709 1 961.709 227.369 .000
Prepost * group * yr Sphericityassumed
172.542 1 172.542 40.793 .000
Error (prepost) Sphericityassumed
2245.981 531 4.230
Reproduced with permission of the copyright owner. Further reproduction prohibited without permission.

94
Table 21
Group * Year * Prepost for Cohort C: Measure and Score
95% confidence interval
Group Year Prepost Mean Std. error Lower bound Upper bound
2000 1 14.769“ .388 14.034 15.5572 19.671“ .358 18.968 20.375
Interaction2001 1 18.412“ .398 17.631 19.193
2 17.763“ .367 17.041 18.484
2000 1 14.233“ .302 13.639 14.8272 16.945“ .279 16.396 17.494
Control2001 1 16.743“ .359 16.038 17.448
2 17.227“ .332 16.576 17.879
“Covariates appearing in the model are evaluated at the following values: Gender = 1.50, Race/Ethnicity = 2.55, API = 661.85.
Profile Plots
As noted above, there is a significant three-way interaction between group, year,
and prepost. For this three-way interaction there are three main effects of group, year, and
prepost. The essence of a three-way interaction is that the two-way interaction is not the
same at each level of the 3rd factor. There are several possibilities here but we could
examine intervention by prepost at each level of year (Figure 9), or year by prepost
interaction within each level of group (Figure 10), or prepost by group interaction within
each level of year (Figure 11).
These profile plots were created by selecting year as the horizontal axis variable,
prepost as the separate lines variable, and group as the separate plots variable. Plotting
group as separate plots focuses attention on the year by prepost interaction within each
level of group. The relevant main effects are year and prepost, the two-way interaction
Reproduced with permission of the copyright owner. Further reproduction prohibited without permission.

95
Estimated Marginal Means of score
"at GROUP = intervention"
24 - PREPOST pretest posttest(0 22 -
re ia-
■o0) 16-
12-
2000 2001
Year
Estimated Marginal Means of score
"at GROUP = control"
PREPOST pretest posttest
24 -
re 2 0 -
16-
12-
2000 2001
Year
Figure 9. Cohort C’s profile plots of the year by prepost by group interaction means.
Reproduced with permission of the copyright owner. Further reproduction prohibited without permission.

96
Estimated Marginal Means of score
"at PREPOST - pretest"
GROUP intervention control
24 -
8 22—
« 20-
e>« 18-
« 16-
■43 14-
12 -
20012000Year
Estimated Marginal Means of score
"at PREPOST = posttest"
GROUP intervention control
24-
n 2 0 -
18-
14-
12-
20012000
Year
Figure 10. Cohort C’s profile plots of the year by group by prepost interaction means.
Reproduced with permission of the copyright owner. Further reproduction prohibited without permission.

97
Estimated Marginal Means of score
"at YEAR = 2000"
2 4 -
« 20-
« 18-
£ 16-
12-
pretest postte st
GROUP— intervention— control
prepost
Estimated Marginal Means of score
"at YEAR = 2001"
GROUPinterventioncontrol5 22-
n 2 0 -
W 18-
S? 14 -
t------------------rp retest posttest
prepost
Figure 11. Cohort C’s profile plots of the prepost by group by year interaction means.
Reproduced with permission of the copyright owner. Further reproduction prohibited without permission.

98
factors. Note: In 2001,4th grade students were tested one time using the posttest survey;
therefore, 2001 pretest = 2001 posttest.
• For the intervention group, mean pretest scores increased significantly from
2000 to 2001. Mean posttest scores, however, decreased significantly from
2000 to 2001.
• For the control group, mean pretest scores increased significantly from 2000 to
2001. The decrease in mean posttest scores from 2000 to 2001, however, was
not statistically significant.
• In 2000, changes between mean pre- and posttest scores were statistically
significant for both the intervention and control groups. Changes were,
however, significantly greater for the intervention group (4.876 points) than
the control group (2.712 points).
These profile plots use year as the horizontal axis, group as the separate lines
variable, prepost as the separate plots variable. Plotting the pre- and posttest scores as
separate plots focuses attention on the group by year interaction. The relevant simple
main effects are year and group, the two-way interaction factors. Note: In 2001, 4th grade
students were tested one time using the posttest survey; therefore, 2001 pretest = 2001
posttest.
• For both the intervention and control groups, mean pretest scores increased
significantly from 2000 to 2001. The changes in mean pretest scores, however,
were not significantly greater for the intervention group (3.616 points) than the
control group (2.510 points).
Reproduced with permission of the copyright owner. Further reproduction prohibited without permission.

99
• In 2000, mean pretest score for the intervention group was not significantly
higher than mean pretest score for the control group. In 2001, however, mean
score for the intervention group was significantly higher than mean score for
the control group.
• For the intervention group, the decrease in mean posttest scores from 2000 to
2001 was statistically significant at 0.05 level.
• For the control group, the slight increase in mean posttest scores from 2000 to
2001 was not statistically significant.
• In 2000, mean posttest score for the intervention group was significantly
higher than mean posttest score for the control group. In 2001, however, the
difference in mean scores of the two groups was not statistically significant.
Plotting the year as separate plots (Figure 12) focuses attention on the prepost by
group interaction. The relevant simple main effects are prepost and group, the two-way
interaction factors. The interpretation of these three prepost by group interactions within
year is possible but the previous two ways are better options.
Estimated Marginal Means of score
GROUP Intervention control
24 -
c 2 2 -
■s 2 0 -
re 18 -
16-
14-
12-
20012000Year
Figure 12. Cohort C’s overall group by year interaction profile plot.
Reproduced with permission of the copyright owner. Further reproduction prohibited without permission.

100
Behavior
Summary Behavioral Mean Scores by Cohort
A limited number of questions regarding injury-related behavior were asked on
the pre- and posttests. As examples, first grade students were asked if they “always check
to see that no one is in the way before swinging a baseball bat or a tennis racket”; second
grade students were asked if they ever “dart into the street when playing near the road and
a ball goes into the street”; and second and third grade students were asked if they ever
“did tricks like hanging by the legs or one arm on the monkey bars.” Due to the small
scores (small number of items related to behavior), the overall behavior score was used to
compare cohort performance.
Only in Cohort A (receiving 3 years of TFFK) is a consistent increase in mean
behavior scores from pre- to posttest that were statistically significant within each year
seen. In Cohort B among the intervention and control groups, mean behavior pre- and
posttest scores decreased significantly from 2000 to 2002. In Cohort C among the
intervention and control groups a significant increase in mean behavior scores from
pre- to posttest is seen.
The inability to reach statistical significance may be hampered by a power
problem, due to the small number of questions on behavior as noted in the original TFFK
pilot study. Despite small scores and relative change, many of the control schools scored
lower than the intervention schools, even when comparing control schools at a full grade
level above the intervention schools. Exceptions were noted: in Cohort A the Grade 1
posttest score for intervention schools was very similar to the Grade 2 for control schools,
and in Cohort C, the Grade 4 posttest was significantly lower than the Grade 3 posttest.
Reproduced with permission of the copyright owner. Further reproduction prohibited without permission.

101
Behavior Cohort A
The results of the tests for the within-subjects effects indicate significant effects
for the prepost by group interaction (F = 6.821, p value = 0.009) seen in Table 22. The
three-way interaction, prepost by group by year, however, is not of statistical significance.
• In both groups, mean behavior pre- and posttest scores increased significantly
from 2000 to 2001 (see Figure 13).
• From 2001 to 2002, however, mean behavior pre- and posttest scores
decreased significantly in both groups.
Table 22
Tests o f Within-Subjects Effects for Behavior Cohort A: Measure and Score
Source TestType III sum
of squares d fMeansquare F Significance
Prepost Sphericityassumed
.078 1 .078 .176 675
Prepost * gender Sphericityassumed
.191 1 .191 .434 .510
Prepost * race_eth Sphericityassumed
.049 1 .049 .112 .738
Prepost * api Sphericityassumed
.017 1 .017 .038 .845
Prepost * group Sphericityassumed
3.004 1 3.004 6.821 .009
Prepost * yr Sphericityassumed
.536 2 .268 .608 .544
Prepost * group * yr Sphericityassumed
1.142 2 .571 1.297 .274
Error (prepost) Sphericityassumed
697.463 1584 .440
Reproduced with permission of the copyright owner. Further reproduction prohibited without permission.

102
Estimated Marginal Means of score
"at YEAR = 2000"
GROUP intervention control
2 .5 -
£ 2 .0 “
1 .S -
1.0“
0 .5 -
0 .0“
posttestpretest
prepost
Estim ated Marginal Means of sco re
"at YEAR = 2001"
GROUP Intervention control
2 .5 -
1.0-
0 .0“
pretest
prepost
Estim ated Marginal Means of score
"at YEAR = 2002"
2 .5 - GROUP — — Intervention control£ 2 .0 “
£ 1 . 5 -
"O 1-0-
0 .0-
prepost
Figure 13. Cohort A ’s behavioral scores — profile plots of the prepost by group by year interaction means.
Reproduced with permission of the copyright owner. Further reproduction prohibited without permission.

103
• Among the intervention group, increases in mean behavior scores from pre- to
posttest were statistically significant within each year.
• Among the control group, however, the slight increases in mean behavior
scores from pre- to posttest were not statistically significant within each year.
• For both the intervention and control groups, increases in mean behavior
scores from pre- to posttest were statistically significant at 0.05 level.
• For both groups, mean behavior pre- and posttest scores increased
significantly from 2000 to 2001 and then decreased significantly from 2001 to
2002.
• In 2000 and 2001, mean behavior pretest scores of the intervention group were
not significantly higher than the control group.
• In 2002, however, mean behavior pretest score of the intervention group was
significantly higher than the control group.
• Within each year, mean behavior posttest scores were significantly higher
among the intervention group than the control group.
Behavior Cohort B
There are several significant within-subjects effects seen in Table 23. The results
of the tests of the within-subjects effects indicate significant effects for the prepost main
effect (F = 8.085, p value = 0.005), the prepost by group interaction (F = 21.662, p value
< 0.0005), the prepost by year interaction (F = 19.433,/? value < 0.0005) and the prepost
by group by year interaction (F= 7.159,/? value = 0.001). Recall that in 2002, 4th grade
Reproduced with permission of the copyright owner. Further reproduction prohibited without permission.

104
students were tested one time only using the posttest survey; therefore, 2002 pretest =
2002 posttest.
Table 23
Tests o f Within-Subjects Effects for Behavior Cohort B: Measure and Score
Source TestType III sum
of squares dfMeansquare F Significance
Prepost Sphericityassumed
2.989 1 2.989 8.085 .005
Prepost * gender Sphericityassumed
.144 1 .144 .389 .533
Prepost * race_eth Sphericityassumed
.594 1 .594 1.606 .205
Prepost * api Sphericityassumed
1.288 1 1.288 3.484 .062
Prepost * group Sphericityassumed
8.007 1 8.007 21.662 .000
Prepost * yr Sphericityassumed
14.366 2 7.183 19.433 .000
Prepost * group * yr Sphericityassumed
5.293 2 2.646 7.159 .001
Error (prepost) Sphericityassumed
595.477 1611 .370
• Among the intervention group, mean behavior pre- and post-test scores
decreased significantly from 2000 to 2002. The decrease in mean behavior
posttest scores from 2001 to 2002 was statistically significant. The slight
increase in mean behavior pretest scores from 2001 to 2002, however, was not
of statistical significance. In 2000 and 2001, the increases in mean behavior
scores from pre- to posttest were statistically significant (see Figure 14).
Reproduced with permission of the copyright owner. Further reproduction prohibited without permission.
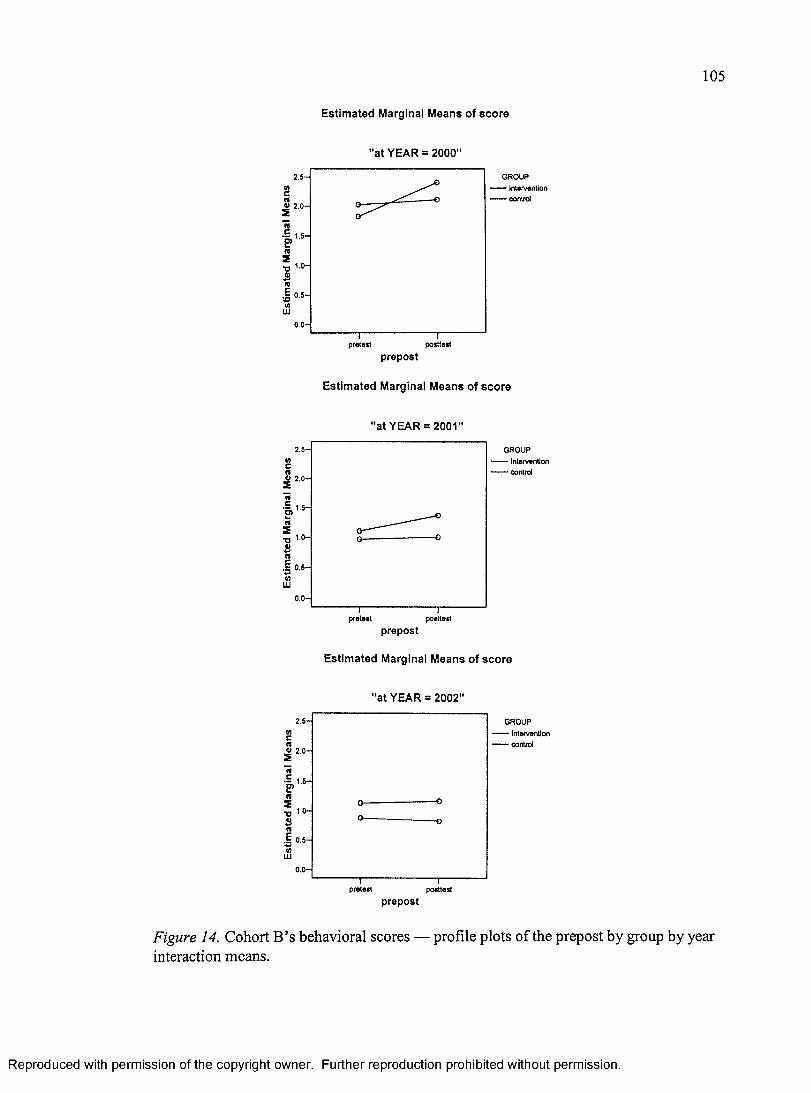
105
Estimated Marginal Means of score
"at YEAR = 2000"
GROUP intervention control
2 .5 -
.2 2.0-
• S . 1.5-
1 .0 -
0 .5 -
0 .0-
posttestpretest
prepost
Estimated Marginal Means of score
"at YEAR = 2001"
2 .5 - GROUP intervention control
O 2 .0 -
1.5-
1.0-
0 .5 -
0 .0 -
pretest
prepost
Estimated Marginal Means of score
"at YEAR = 2002"
GROUPInterventioncontrol
pretest posttest
prepost
Figure 14. Cohort B’s behavioral scores — profile plots of the prepost by group by year interaction means.
Reproduced with permission of the copyright owner. Further reproduction prohibited without permission.

• Among the control group, mean behavior pre- and posttest scores decreased
significantly from 2000 to 2002. The slight decreases in mean behavior pretest
and posttest scores from 2001 to 2002 were not statistically significant. For
this group, differences in mean behavior scores from pre- to posttest were not
statistically significant within each year.
• For both the intervention and control groups, mean behavior pretest scores
decreased significantly from 2000 to 2002. The slight changes in mean
behavior pretest scores from 2001 to 2002 were not statistically significant.
• In 2000, mean behavior pretest score of the control group was significantly
higher than the intervention group. In 2001 and 2002, however, there were no
significant differences between mean behavior pretest scores of the two
groups.
• For both the intervention and control groups, mean behavior posttest scores
decreased significantly from 2000 to 2002.
• For the intervention group, the decrease in mean behavior posttest scores from
2001 to 2002 was statistically significant. For the control group, however, the
slight decrease in mean behavior posttest scores from 2001 to 2002 was not of
statistical significance.
• Within each year, mean behavior posttest scores were significantly higher
among the intervention group than the control group.
• For the control group, changes in mean behavior scores from pre- to posttest
were not statistically significant in 2000 and 2001 (NA in 2002).
Reproduced with permission of the copyright owner. Further reproduction prohibited without permission.
107
• For the intervention group, however, mean behavior scores increased
significantly from pre- to posttest in 2000 and 2001 (NA in 2002).
• In 2000, mean behavior pretest score of the intervention group was
significantly lower than the control group. In 2001, however, there were no
significant differences between mean behavior pretest scores of the two
groups.
• In 2002, mean behavior score of the intervention group was significantly
higher than the control group.
• Within each year, mean behavior posttest scores were significantly higher
among the intervention group than the control group.
Behavior Cohort C
The results of the tests for the within-subjects effects indicate significant effects
for the prepost by year interaction (F = 38.903, p value < 0.0005) as seen in Table 24. The
three-way interaction, prepost by group by year, however, is not of statistical significance.
Recall that in 2001,4th grade students were tested one time only using the posttest survey;
therefore, 2001 pretest = 2001 posttest.
• In 2000, the increase in mean behavior scores from pre- to posttest was
statistically significant. In 2001, however, the slight decrease in mean
behavior scores from pre- to posttest was not of statistical significance (see
Figure 15).
Reproduced with permission of the copyright owner. Further reproduction prohibited without permission.

108
Table 24
Tests ofWithin-Subjects Effects for Behavior Cohort C: Measure and Score
Source TestType III sum
of squares dfMeansquare F Significance
Prepost Sphericityassumed
.127 1 M l .621 .431
Prepost * gender Sphericityassumed
.048 1 .048 .235 .628
Prepost * race eth Sphericityassumed
.083 1 .083 .402 .526
Prepost * api Sphericityassumed
.262 1 .262 1.275 .259
Prepost * group Sphericityassumed
.104 1 .104 .505 M l
Prepost * yr Sphericityassumed
7.988 1 7.988 38.903 .000
Prepost * group * yr Sphericityassumed
.018 1 .018 .086 .769
Error (prepost) Sphericityassumed
109.027 531 .205
• Among the intervention group, the slight decrease in mean behavior pretest
scores from 2000 to 2001 was not of statistical significance. The decrease in
mean behavior posttest scores, however, was statistically significant. In 2000,
the increase in mean behavior scores from pre- to posttest was statistically
significant.
• Among the control group, the increase in mean behavior pretest scores from
2000 to 2001 was statistically significant. The slight increase in mean
behavior posttest scores, however, was not of statistical significance. In 2000,
the increase in mean behavior scores from pre- to posttest was statistically
significant.
Reproduced with permission of the copyright owner. Further reproduction prohibited without permission.

109
Estimated Marginal Means of score
"at YEAR = 2000"
2 .5 -
Wc(0« 2 .0 - s ^re c
re5n 1°- 8re
0 .5—
pretest posttest
GROUP— intervention— control
prepost
Estimated Marginal Means of score
"at YEAR = 2001"
GROUP intervention control
2 .5-
V)cre® 2 .0 -
reE?re2
1.0-
-o
0.0-
pretest posttest
prepost
Figure 15. Cohort C’s behavioral scores — profile plots of the prepost by group by year interaction means.
Reproduced with permission of the copyright owner. Further reproduction prohibited without permission.

110
• For the intervention group, the slight decrease in mean behavior pretest scores
from 2000 to 2001 was not of statistical significance. For the control group,
however, the increase in mean behavior pretest scores from 2000 to 2001 was
statistically significant.
• In 2000, mean behavior pretest score of the intervention group was signifi
cantly higher than mean behavior pretest score of the control group. In 2001,
• however, mean behavior score of the intervention group was significantly
lower than mean behavior score of the control group.
• Among the intervention group, there was a significant decrease in mean
behavior posttest scores from 2000 to 2001. The slight increase in mean
behavior posttest scores of the control group, however, was not of statistical
significance.
• In 2000, mean behavior posttest score of the control group was not signifi
cantly lower than the intervention group. In 2001, however, mean behavior
score of the control group was significantly higher than mean behavior score
of the intervention group.
Summary
The purpose of this study was to evaluate the effectiveness of the elementary
school injury prevention curriculum called Think First for Kids (TFFK) on improving
self-reported safety behaviors and knowledge over time. In order to accomplish this,
hypotheses were derived specifically to test with a sample of ethnically and economically
diverse elementary school children.
Reproduced with permission of the copyright owner. Further reproduction prohibited without permission.

I l l
The null hypotheses of this study were: (a) students participating in the TFFK
curriculum do not show a significant increase in self-reported knowledge and safety
behaviors compared to students who do not receive the curriculum; and (b) students who
receive the curriculum repeatedly do not show a significant difference in retention of
knowledge over time with repeated curriculum interventions in the time period of years
2000- 2002 .
The descriptive statistics indicate this is a cohesive sample in both intervention
and control groups based on gender, age, and race/ethnicity. Hypothesis 1 revealed there
were significant differences in self reported knowledge and safety behaviors between
intervention and control groups. The intervention group consistently showed greater
improvement from pre- to post-measure than did the control group. Hypothesis 2 was also
refuted. Univariate and multivariate analyses revealed a significant difference in retention
of knowledge between intervention and control groups in this longitudinal study. In
following the cohort of students over time, the TFFK curriculum was a significant
predictor of improvement in test scores for grades 1, 2, and 3 controlling for gender, age,
and race/ethnicity.
In conclusion, through testing the study hypotheses, some relationships between
the variables in the explanation of improved learning and retention were shown to exist.
The following chapter presents the conclusions, limitations, implications, and
recommendations for nursing research, practice, and theory.
Reproduced with permission of the copyright owner. Further reproduction prohibited without permission.

CHAPTER V
CONCLUSIONS, IMPLICATIONS, AND
RECOMMENDATIONS
The purpose of this study was to evaluate the effectiveness of an elementary
school injury prevention curriculum Think First for Kids (TFFK). The intervention was
implemented cross a time continuum of 1 to 3 years depending on the cohort to which
the subjects belonged. The curriculum, based on constructivist theory, was designed to
improve the children’s knowledge about risky behaviors and the safety behaviors
supplementary practiced. The subjects were a socioeconomically, ethnically, and geo
graphically diverse student body from San Diego County, CA. The descriptive and
multivariate statistical analysis of the data collected during this intervention was com
pleted to determine whether or not sequential TFFK interventions made a difference in
the immediate and long-term knowledge and safety practices of the children involved in
the intervention. This study expanded on a pilot study conducted of the TFFK program
between 1997-1998 (Gresham et al., 2001).
The social, cultural, cognitive, and behavioral learning theory of constructivism
informed the study. The learning theories of Vygotsky (1962), Bruner (1966), and Piaget
(1952) served as the theoretical frameworks for the constructivism theory and helped
professionals understand how, why, and when children are cognitively, psychologically,
112
Reproduced with permission of the copyright owner. Further reproduction prohibited without permission.

113
socially, and developmentally at greatest risk for injury and most receptive to learning.
From this theoretical framework, hypotheses were derived to test the TFFK curriculum
with elementary school- aged children in San Diego County, California.
Conclusions
The demographic analysis of the study population showed a racially diverse
population with a fairly even distribution of males to females. The sample of students was
32.4% White, 26.2% Hispanic, 8.5% Black, and 33% other which includes students who
did not self-report.
The baseline data (pre-measure) from grades 1 through 4 supports the view that
students lacked sufficient knowledge about risky behaviors to prevent them from being
the victim of unintentional injuries. These data also revealed that all grades were engag
ing in unsafe behaviors (such as not wearing a helmet, not looking left, right, left when
crossing the street). These behaviors are known to be highly correlated with childhood
injuries. Such activities support the developmental perspectives of such theorists as
Piaget (1952), Erikson (1968), Kohlberg (1984), and Freud when they discuss the
physical, neurological, cognitive, moral, and interpersonal developmental processes of
children. Middle school-age is a time in which the child is caught between being the baby
and becoming the adolescent. There is still the need for adult supervision; however, there
is the child’s struggle for independence in a mind and a body that is not ready for such
freedom. Without adequate information about life, about making good choices, and about
protecting one’s self, the middle school-age child does not have the necessary resources
Reproduced with permission of the copyright owner. Further reproduction prohibited without permission.

114
to examine a situation, make the correct decision, or take the necessary actions that can
protect him or her from injury.
The TFFK intervention was a longitudinal repeated measures design that com
pared pre- and post-measures among intervention and control schools over a 3-year
period. To decrease the effect of potential confounding variables between the intervention
and control schools, matching of the schools was done on the variables as SES, Academic
Performance Index (API), and race/ethnicity. These variables have been shown to have a
relationship to knowledge and behavior (Bowman, 2005). Gender, race/ethnicity, and API
were used as covariates in the multivariate analysis of variance (Hinkle et al., 2003).
Multivariate analysis shows that students receiving the TFFK intervention had signifi
cantly greater improvements in posttest scores, controlling for gender, race/ethnicity, and
API.
The TFFK goes beyond previously successful community health education
programs managed by local hospitals and sponsored by community organizations (Liller,
Smorynski, McDermott, Crane, Weilbley, 1995) by directly involving elementary
schools. The Institute of Medicine (1997) has posited school health education could be
one of the most effective avenues to impact the burden of the most serious health
problems in the United States, such as injury, because of the ability to apply sequential
health curricula to a large number of students. Peterson and Roberts (1992) have further
reflected on the general consensus in addition to the focus on children, behavioral
interventions with parents are a promising avenue of childhood injury prevention because
of the ability to reinforce messages taught in the school.
Reproduced with permission of the copyright owner. Further reproduction prohibited without permission.

115
Data analysis of the posttest measure scores demonstrated that the TFFK curricu
lum led to a statistically significant increase in knowledge and self-reported safety
behaviors. Though there were improved scores on the post-measure, in no school or any
grade level was a 100% score achieved. This maybe explained by several factors: (a) lack
of complete understanding of the questions being asked; (b) variations in developmental
maturation of the students within the grade levels; and (c) lack of basic knowledge about
safety and safe behaviors. The intervention improved scores, but further injury-related
education is needed.
Among the intervention schools, the largest absolute increase in test scores were
seen among Hispanics, followed by African American students. Hispanics had the lowest
baseline score, followed by African Americans, and Whites. These findings support the
call for injury prevention specifically targeting minority students, and such an interven
tion can successfully narrow the gap between knowledge and behavior among diverse
groups. Based upon these findings, questions arise regarding why the Hispanic and
African-American children had lower pretest scores but higher posttest scores than
Caucasian kids. For example, could the change in these scores be related to the lack of
parental knowledge on this subject with subsequent lack of parenting instruction to the
kids when they were younger? Could it be that the strong sense of family unit in these
populations made parents and family members more vigilant of their children, thus
interfering with their instructions to the children about making safe choices? Were the
Caucasian kids so inundated with safety information from their parents that they tuned
out further information coming from school? Our data do not allow for such exploration,
thus the need for further research in this area.
Reproduced with permission of the copyright owner. Further reproduction prohibited without permission.

116
The intervention groups, progressing from one grade to the next and continuing to
receive the TFFK safety program across the 3 years, demonstrated retention of knowledge
about safety that was statistically significantly different than the control group. This
finding supports the constructivism theory about the effect of repetition of information
and retention of knowledge. This was evidenced when the children in Cohort A moved
from first to second to third grade, their pretest scores remained consistently higher than
children in the control group. Though the control groups, at each grade level, had
improved pretest scores regarding safety and risky behaviors, the intervention group was
statistically significantly better. Thus, developmental maturation alone is not enough to
help children learn how to protect themselves; educational instruction about making wise
choices and understanding consequences about choices is paramount to protecting
children.
The overall effect of the curriculum was tested using a GLM repeated measures,
analysis of variance procedure for each Cohort. The GLM procedure was used to adjust
for the covariates (gender, race/ethnicity and API) to determine if the TFFK intervention
was a predictor of improved performance. The results were plotted on graphs to show the
progression of the cohorts over time. The overall trend was for greater improvement in
intervention school students when compared to control school students. For Cohort A,
students receiving TFFK in grades 1,2, and 3 within each year, mean posttest scores were
significantly higher for the intervention group than the control group with the largest
difference occurring in grade 3. This may be due to the sequential application of TFFK in
grades 1 and 2.
Reproduced with permission of the copyright owner. Further reproduction prohibited without permission.

117
For Cohort B, students receiving TFFK in grades 2 and 3, the changes in mean
scores from pre- to postsurvey were significantly greater in the intervention group (4.376
and 4.046 points in grades 2 and 3, respectively) than the control group. For the interven
tion group, mean post-measure scores increased significantly for grades 2 and 3 but
decreased significantly for grade 4 which received not intervention. Among the control
group, there was a statistically significant decrease in mean posttest scores for grades 2, 3,
and 4.
For Cohort C, students receiving TFFK in grade 3, changes between mean pre-
and post-measure scores were statistically significant for both the intervention and control
groups. Changes were, however, significantly greater for the intervention group than the
control group. For the intervention group, the decrease in mean post-measure scores from
grades 3 to 4 was statistically significantly. This variability may be due to cognitive
maturity, increased reading comprehension levels, increased test taking skills, an increase
in environmental exposures, and experience.
Intervention research often confronts the methodological issue of having to
account for correlation among subjects clustered within sampling units (in this case,
schools) to reduce the potential of biased standard errors. The standard errors will be
biased usually in a direction that exaggerates the significance of the intervention effect
(Norton, Bieler, Ennett, & Zarkin, 1996). This study used the GLM procedure to address
intracluster correlation since students clustered within schools may be more similar to
each other in experiences, neighborhood, and social environment. The potential for
confounding of effects was reduced by controlling for variables likely to impact
knowledge and behavior (gender, race/ethnicity and API).
Reproduced with permission of the copyright owner. Further reproduction prohibited without permission.

118
Limitations of the Study
Limitations of the study design include the self-report nature of the survey, the
age of the children, and the inability to control all causes of internal or external validity.
Community activities, media coverage, or family events may have occurred during the
implementation period but are not thought to have occurred differentially among schools.
Many surveys were missing self-identified racial/ethnic group so that interpretation of
this variable should be made with caution.
Another limitation of this type of study was that a post-measure was delivered at
the end of the six-module intervention, thereby potentially giving rise to higher scores for
more recently completed material; however, the data did not support this supposition.
There may have been variability among teachers in their instructional styles and time of
day in which the curriculum was taught.
Interpretation of the data on self-reported safety behaviors should be cautiously
interpreted due to the limited number of questions asked on each pre- and post-measure,
averaging only two behavioral questions per measure.
Based upon limited financial resources, this study did not capture data from
3rd grade students, who had received the curriculum for 3 full years entering 4th grade.
Such data would have been important to obtain in lieu of the fact that a control group of
4th graders was surveyed.
Implications
It is important to recognize that schools not only have direct access to young
children, but also have the unique capacity to affect the lives of staff, parents, and the
Reproduced with permission of the copyright owner. Further reproduction prohibited without permission.

119
entire community (Lavin et al., 1992). This study provides empirical evidence that early
school-based theory-driven injury prevention education has a positive effect on young
children. This study also shows that sustained and sequential curriculum-based education
among culturally diverse populations leads to increased retention of knowledge about
injury and safety behaviors across culturally diverse populations.
The TFFK program complements the national goal of conducting and evaluating
comprehensive school health programs. There is clearly a need for robust and ecological
approaches to injury prevention that include a school-based curriculum approach with
parental involvement, and the need to supplement it with other environmental modifica
tions and legislation if communities are to achieve a significant sustainable injury
reduction. Raising a generation of children “schooled” in injury prevention can only help
achieve that goal.
Implications to Nurses
The increasing awareness of childhood injuries as an important public health
problem in the U.S. and around the world has important implications for nurses in clinical
practice and research settings. In clinical practice, injury prevention strategies focus on
sociocultural issues and behavioral change in counseling with children and families.
School-based education of children may help to broaden and reinforce counseling of
children. Nurses can serve as advocates for the initiation of such programs in their
schools and communities.
The collaborative research in this study provides avenues for nurses, community
educators, and practitioners who may have unrecognized opportunities to join in a
Reproduced with permission of the copyright owner. Further reproduction prohibited without permission.

120
community effort to reduce morbidity and mortality. These opportunities include
developing nursing interventions, conducting evaluative research, and creating injury
surveillance systems.
The focus of HP2010 on the prevention of injury and targeting health promotion
is central to nursing practice. Linkages with community hospitals, nurse researchers,
neurosurgeons, and health educators can be used to pose a unified approach to injury
prevention strategies, including legislation, leading to declines in injury related morbidity
and mortality. Hospital nurses can begin dialogue with school nurse and school
administrators to get permission to conduct the TFFK intervention and evaluation in
neighborhood elementary schools (U.S. Department of Health & Human Services, 2000).
Recommendations
The complex public health problem of injury prevention will require a collabora
tive response involving the efforts of clinicians, educators, engineers, and society at large.
Think First for Kids studies, including this one, have found that the TFFK program
significantly increases injury-related knowledge and behaviors among elementary school
children. Importantly, this study adds to the literature by showing the ability of children to
retain knowledge and behavior over time. This type of research will aid in the future
refinement of the TFFK curriculum, as well as acting as a potential model that combines
literacy-based curriculum with important health-related subject matter impacting this age
group. Leading causes of death and disability among children of various races and
socioeconomic backgrounds especially surrounding issues such as obesity and violence
could benefit from this model of prevention. Teachers should be aware of the unique
Reproduced with permission of the copyright owner. Further reproduction prohibited without permission.

121
combination of constructivism learning theory and literacy-based health education when
choosing curriculum across the nation to help children lead a healthy lifestyle.
This study demonstrated that children in grades 1,2, and 3 often lack basic
knowledge about safety and do not recognize behaviors considered high risk for injury.
Defining baseline profiles of knowledge and recognition, which varied by race/ethnic
group, will help programs to become efficient in the use of prevention resources.
The epidemic of childhood injuries affects the entire nation, and thus requires a
national response. Think First for Kids serves as an example of a viable childhood injury
prevention solution which has the potential to be implemented throughout all elementary
school systems in California. Think First For Kids was specifically designed to meet the
CDC criteria for injury prevention programs. Through multiple year exposure to the
TFFK elementary school curriculum, children will enter into adolescence with a deeper
understanding of injury risks and the safety behaviors to avoid those risks. Future
research is needed to examine the sustainability of knowledge over time into adolescence.
Schools are pressured to focus on literacy and standardized testing preparation,
and are often reluctant to support new health programs. Think First for Kids serves as an
example of how to successfully integrate public health efforts into the school system. The
TFFK curriculum provides teachers with a curriculum that promotes literacy and teaches
basic math, spelling, reading, and problem-solving skills. This program has the potential
to be used as a national example of a successful school-based health-related program.
The results of this study indicate that elementary school students improve
knowledge and increase self-reported safety behavior after having exposure to a compre
hensive, sequential TFFK intervention. The results also indicate that students retain
Reproduced with permission of the copyright owner. Further reproduction prohibited without permission.

122
knowledge and, with repetition of the intervention of the 3-year study, behaviors. Data
collection on behavior should be enhanced to include more inquiries and expansion
beyond self-report where feasible. School districts nationwide must make a coordinated
effort to integrate injury prevention curricula into the elementary schools. These programs
must also incorporate a rigorous evaluation of the program’s effectiveness, using analyses
to adjust for possible confounders. As with any injury prevention program, diverse
student populations should have the opportunity to participate. Think First for Kids has
been a leader in providing injury education to diverse populations, and should continue to
do so.
There are complimentary components that may be helpful to the current TFFK
curriculum. There may be a need for parent participation in a survey to assess their child’s
behavior. In addition, a need for a parent/guardian educational component in the TFFK
program may be useful. Families are extremely influential on children’s lives, and should
have the opportunity to formulate injury prevention lifestyles. There may be environmen
tal or engineering considerations regarding safety that would compliment a child’s
knowledge and skills. This is particularly relevant to San Diego with a high
pedestrian/pedalcycle injury rate.
The TFFK program has proven to be an effective injury prevention curriculum
(Gresham et al., 2001). These recommendations would purely serve as additions to a
well-established and successful program that already addresses the key elements of
successful community-based approaches.
Reproduced with permission of the copyright owner. Further reproduction prohibited without permission.
REFERENCES
Agran, P. F., Winn, D., Anderson, C. L., Del Valle, C. P. (1996, April). Pediatric injury hospitalization in Hispanic children and non-Hispanic white children in southern California. Archives o f Pediatrics & Adolescent Medicine, 150(4), 400-406.
Avolio, A. E. C., Ramsey, F. L., & Neuwelt, E. A. (1973). Evaluation of a program to prevent head and spinal cord injuries: A comparison between middle school and high school. Neurosurgery, 31, 557-562.
Baker, S. P., Braver, E., Chen, L., Pantula, J. F., & Massie, D. (1998). Motor vehicle occupant deaths among Hispanic and black children and teenagers. Archives of Pediatrics & Adolescent Medicine, 152(12), 1209-1212.
Bandura, A. (1977). Social learning theory. Englewood Cliffs, NJ: Prentice-Hall.
Bandura, A. (1989). Social cognitive theory. In R. Vasta (Ed.), Annals o f child development (Vol. 6, pp. 1-60). Greenwich, CT: Jai Press.
Benjamin, G. C. (2004). The solution is injury prevention. American Journal of Public Health, 94(4), 521.
Berk, L. E. (1994). Vygotsky’s theory: The importance of make believe play. Young Children, 50(1), 30-39.
Bowman, B. T. (2005). Cultural diversity and academic achievement. Retrieved April 4, 2005, from www.ncrel.org/sdrs/areas/issues/educatrs/leadrshp/leObow.htm
Brown, J., Collins A., & Duguid, P. (1989). Situated cognition and the culture of learning. Educational Researcher, 75(1), 32-42.
Bruner, J. (1960). The process o f education. Cambridge, MA: Harvard UniversityPress.
Bruner, J. (1966). Toward a theory of instruction. Cambridge, MA: Harvard University Press.
123
Reproduced with permission of the copyright owner. Further reproduction prohibited without permission.

124
California Department of Health Service. (2000). EPIC — Epidemiology and prevention for injury control branch. Retrieved February 26, 2004, from http ://www. dhs .ca.gov/epic/
Centers for Disease Control and Prevention. National Center for Injury Prevention and Control. (1999). Unintentional injury prevention fact sheet on childhood injury. Retrieved February 14, 2004, from http://www.cdc.gov/ncipc/duip/childh.htm
Centers for Disease Control and Prevention. National Center for Injury Prevention and Control. (2000). Unintentional injury prevention fact sheet on childhood injury. Retrieved February 20, 2004, from http://www.cdc.gov/ncipc/duip/childh.htm
Centers for Disease Control and Prevention. National Center for Injury Prevention and Control. (2003). Unintentional injury prevention fact sheet on childhood injury. Retrieved February 20, 2004, from http://www.cdc.gov/ncipc/duip/childh.htm
Centers for Disease Control and Prevention. National Center for Injury Prevention and Control. (2005a). National estimates o f the 10 leading causes o f nonfatal injuries treated in hospital emergency departments, United States, 2003. Retrieved February 26, 2005, from http://www.cdc.gov/ncipc
Centers for Disease Control and Prevention. National Center for Injury Prevention and Control. (2005b). 10 leading causes of death by age group, 2001. Retrieved February 26,2005, from http://www.cdc.gov/ncipc
Centers for Disease Control and Prevention. National Center for Injury Prevention and Control. (2005c). 10 leading causes o f injury death by age group, 2001 highlighting unintentional injury deaths. Retrieved February 26, 2005, from http://www.cdc.gov/ncipc
Chen, E., Matthews, K. A., & Boyce, W. T. (2002, March). Socioeconomic differences in children’s health: How and why do these relationships change with age? Psychological Bulletin, 128(2), 295-329.
Cooper, P. A. (1993). Paradigm shifts in designed instruction: From behaviorism to cognitivism to constructivism. Educational Technology, 30, 12-18.
Crain, W. C. (1980). Theories o f development: Concepts and applications. Englewood Cliffs, NJ: Prentice-Hall.
Cresswell, J. W. (2003). Research design: Qualitative, quantitative, and mixed methods approaches (2nd ed). Thousand Oaks, CA: Sage.
Cross, D., Stevenson, M., Hall, M., Bums, S., Laughlin, D., Officer, J., et al.(2000). Child pedestrian injury prevention project: Student results. Preventive Medicine, 30, 179-187.
Reproduced with permission of the copyright owner. Further reproduction prohibited without permission.

125
Cunningham, P., & Cunningham, J. (1992). Making words: Enhancing the invented spelling-decoding connection. The Reading Teacher, 46(2), 106-116
Davidson, L., Durkin, M. S., Kuhn, L., O’Connor, P., Barlow, B., & Heagarty,M. C. (1994). The impact of the Safe/Kids Healthy Neighborhoods Injury Prevention Program in Harlem, 1998 through 1991. American Journal o f Public Health, 84, 580-586.
DePoy, E., & Gitlin, L. N. (1998). Introduction to research: Understanding and applying multiple strategies (2nd ed.). St. Louis, MO: Mosby.
Dixon, S. D., & Stein, M. T. (1992). Encounters with children: Pediatric behavior and development (2nd ed.). St. Louis, MO: Mosby.
Durkin, M. S., Olsen, S., Barlow, B., Virella, A., & Connolly, E. S., Jr. (1998). The epidemiology of urban pediatric neurological trauma: Evaluation of, and implications for, injury-prevention programs. Neurosurgery, 42(2), 300-310.
Eisenberg, N., Fabes, R. A., Murphy, B., Karbon, M., Smith, M., & Maszk, P. (1996). The relations of children’s dispositional empathy-related responding to their emotionality, regulation, and social functioning. Developmental Psychology, 32, 195-209.
Embry, D. D., Flannery, D. J., Vazsonyi, A. T., Powell, K. E., & Atha, H. A. (1996). PeaceBuilders: A theoretical driven, school-based model for early violence prevention. American Journal of Preventive Medicine, 12(5), 91-100.
Erikson, E. (1968). Identity: Youth and crisis. New York: W. W. Norton.
Eyster, E. F., & Watts, C. (1992). An update of the National Head and Spinal Cord Injury Prevention Program of the American Association of Neurological Surgeons and the Congress of Neurological Surgeons. Clinical Neurosurgery, 38, 252-260.
Faelker, T., Pickett, W., & Brison, R. J. (2000). Socioeconomic differences in childhood injury: A population based epidemiologic study in Ontario, Canada. Injury Prevention, 6, 203-208.
Frederick, K., Bixby, E., Orzel, M. N., Stewart-Brown, S., & Willett, K. (2000). An evaluation of the effectiveness of the injury minimization programme for schools (IMPS). Injury Prevention, 6, 92-95.
Furth, H. G., & Wachs, H. (1975). Thinking goes to school: Piaget’s theory in practice. New York: Oxford University Press.
Garbarino, J., Dubrow, N., Kostelny, K., & Pardo, C. (1992). Children in danger: Coping with the consequences o f community violence. Retrieved February 24, 2004, from http ://www. futureofchildren.org/information
Reproduced with permission of the copyright owner. Further reproduction prohibited without permission.
126
Gatheridge, B. J., Miltenberger, R. G., Huneke, D., & Satterlund, M. J. (2004). Comparison of two programs to teach firearm injury prevention skills to 6 and 7 year old children. Pediatrics, 114(3), 844.
George, D., & Mallery, P. (2004). SPSS for windows step-by-step: A simple guide and reference: 12.0 update (5th ed.). Needham Heights: Allyn & Bacon.
Gessell, A. (1933). The maturation and patterning of behavior. In C. Murchison (Ed.), Handbook of child psychology. Worcester, MA: Clark University Press.
Gielen, A.C. (1992). Health education and injury control: Integrating approaches. Health Education Quarterly, 19(2), 203-218.
Gilligan, C. (1982). In a different voice: Sex differences in the expression of moral judgment. Cambridge, MA: Harvard University Press.
Gordis, L. (2000). Epidemiology (2nd ed). New York: W.B. Saunders.
Grasdal A. (2001). The performance of sample selection estimators to control for attrition bias. Health Economics, 10(5), 385-398.
Greene, A., Barnett, P., Crossen, J., Sexton, G., Ruzicka, P., & Neuwelt, E.(2001). Evaluation of the Think First for Kids injury prevention curriculum for primary students. Oregon Health Sciences University. Unpublished study.
Greene, A., Barnett, P., Crossen, J., Sexton, G., Ruzicka, P., & Neuwelt, E.(2002). Evaluation of the Think First for Kids injury prevention curriculum for primary students. Research Letter Injury Prevention, 8, 257-258.
Greensher, J. (2001). Prevention of childhood injuries. Pediatric Patient Education (Suppl.), 970-975.
Gresham, L. S., Zirkle, D. L., Tolchin, S., Jones, C., Maroufi, A., & Miranda, J.(2001). Partnering for injury prevention: Evaluation of a curriculum-based intervention program among elementary school children. Journal of Pediatric Nursing, 16(2), 79-87.
Grossman, D. C. (2000). The history of injury control and the epidemiology of child and adolescent injury. The Future o f Children, 10(1), 23-52.
Grossman, D. C., Neckerman, H. J., Koepsell, T. D., Ping-Yu, L., Asher, K., Beland, K., et al. (1997). Effectiveness of a violence prevention curriculum among children in elementary school. Journal o f the American Medical Association, 277(20), 1605-1611.
Reproduced with permission of the copyright owner. Further reproduction prohibited without permission.

127
Gruber, H. E., & Voneche, J. J. (1977). The essential Piaget. New York: BasicBooks.
Hall-Long, B. A., Schell, K., & Corrigan, V. (2001, April). Youth safety education and injury prevention program. Pediatric Nursing, 27(2), 141-146.
Harris, J. R., & Liebert, R. M. (1984). The child development: From birth through adolescence. Englewood Cliffs, NJ: Prentice-Hall.
Hinkle, D. E., Wiersma, W., & Jurs, S. G. (2003). Applied statistics for the behavioral sciences (5th ed.). New York: Houghton Mifflin.
Hlynka, D. (1991). Applying semiotic theory to educational technology. In D. Hlynka & J. C. Belland (Eds.), Paradigms regained: The uses o f illuminative, semiotic and post modern criticism as modes on inquiry in educational technology: A book of readings. Englewood Cliffs, NJ: Educational Technology.
Huck, S. W. (2000). Reading statistics and research (3rd ed.). New York: Longman.
Institute of Medicine. (1997). Schools and health: Our nation’s investment. Washington, DC: National Academy Press.
Institute of Medicine of the National Academies. (1997). Child health report. Retrieved March 7,2004 from http://www.iom.edu/
Kennedy, C., & Rodriguez, D. (1999). Risk taking in young Hispanic children. Journal o f Pediatric Health Care, 13, 126-135.
Kohlberg, L. (1984). Essays on moral development: Vol 2. The psychology of moral development. San Francisco: Harper & Row.
Krug, E. G., Brener, N. D., Dahlberg, L. L., Ryan, G. W., & Powell, K. E. (1997). The impact of an elementary school-based violence prevention program on visits to the school nurse. American Journal o f Preventive Medicine, 13(6), 459-463.
Lavin, A. T., Shapiro, G. R., & Weill, K. S. (1992). Creating an agenda for school-based health promotion: A review of selected reports. Boston, MA: Harvard University School of Public Health.
Levine, M. D., Carey, W. B., Crocker, A. C., & Gross, R. T. (1983). Developmental-behavioral pediatrics. Philadelphia, PA: W. B. Saunders.
Liller, K. D., Smorynski, A., McDermott, R., Crane, N. B., & Weilbley, R. E. (1995). The More Health Bicycle Safety Project. Journal o f School Health, 65(3), 87-90.
Reproduced with permission of the copyright owner. Further reproduction prohibited without permission.

128
Macgregor, D. M. (2003). Accident and emergency attendances by children under the age of 1 year as a result of injury. Emergency Medicine Journal, 20(1), 21-24.
Maier, H. W. (1969). Three theories of child development. New York: Harper &Row.
Main, D. S., Iverson, D. C., McGloin, J., Banspach, S. W., Collins, J. L., Rugg,D. L., et al. (1994). Preventing HIV infection among adolescents: Evaluation of a school- based education program. Preventive Medicine, 23, 409-417.
Marcin, J. P., Schembri, M. S., He, J., & Romano, P. S. (2003). A population- based analysis of socioeconomic status and insurance status and their relationship with pediatric trauma hospitalization and mortality Rates. American Journal o f Public Health, 93(3), 461-466.
Morrongiello, B. A., Miron, J., & Reutz, R. (1998). Prevention of pediatric acquired brain injury: An interactive elementary-school program. Canadian Journal of Public Health, 89(6), 391-396.
Murphy, K. R., & Myors, B. (2004). Statistical power analysis, a simple and general model for traditional and modern hypothesis test (2nd ed.). Philadelphia: Pennsylvania University Press.
National Commission of the Role of the School and the Community in Improving Adolescent Health. (1990). Code blue: Uniting the healthier youth. Alexandria, VA: National Association of State Boards of Education.
National Safety Council. (2004a). National Safety Council Report 1999. Retrieved March 2, 2004, from http://www.nsc.ie/publications/publication_list.cfin
National Safety Council. (2004b). National Safety Council Report 2001.Retrieved March 2,2004, from http://www.nsc.ie/publications/publication_list.cfin
Neuwelt, E. A., Coe, M. F., Wilkinson, A. M., & Avolio, A. A. (1989). Oregon Head and Spinal Cord Injury Prevention Program and evaluation. Neurosurgery, 24, 453-458.
Nichols, J. (1994). Changing public behavior for better health: Is education enough? American Journal o f Prevention Medicine, 10, 19-22.
Norton, E. C., Bieler, G. S., Ennett, S. T., & Zarkin, G. A. (1996). Analysis of prevention program effectiveness with clustered data using generalized estimating equations. Journal of Consulting Clinical Psychology, 65(5), 919-926.
Reproduced with permission of the copyright owner. Further reproduction prohibited without permission.

129
O’Campo, P., Rao, R. P , Gielen, A. C., Royalty, W., & Wilson M. (2000). Injury- producing events among children in low-income communities: The role of community characteristics. Journal o f Urban Health, 77(1), 34-39.
Olson, D. R. (1996). Towards a psychology of literacy: On relations between speech and writing. Cognition, 60(1), 83-104.
Olson, D. R. (1997). Critical thinking: Learning to talk about talk and text. In G. D. Phye (Ed.), Handbook of academic learning: Construction of knowledge (pp. 493- 510). San Diego: Academic Press.
Peltzman, B. R. (1998). Pioneers o f early childhood education a bio- bibliographical guide. Westport, CT: Greenwood Press.
Peterson, L., Farmer, J., & Mori, L. (1987). Process analysis of injury situations:A complement to epidemiological methods. Journal o f Social Issues, 43, 33-44.
Peterson, L., & Roberts, M. C. (1992). Complacency, misdirection, and effective prevention of children’s injuries. American Psychology, 47, 1040-1044.
Piaget, J. (1952). The origins o f intelligence in children. New York: International Universities Press.
Polika, B. J., & Ryan-Wenger, N. (1999). Health promotion and injury prevention behaviours of elementary school children. Pediatric Nursing, 25(2), 127-134.
Potts, R., Martinez, I. G., & Dedmon, A. (1994). Childhood risk-taking and injury: Self-report and informant measures. Journal o f Pediatric Psychology, 20(1), 5-12.
Reid, B. V. (1984). An anthropological reinterpretation of Kohlberg’s stages of moral development. Human Development, 27, 56-74.
Rivara, F. P., & Barber, M. (1985). Demographic analysis of childhood pedestrian injuries .Pediatrics, 76, 375-381.
Rivara, F. P., & Mueller, B. A. (1987). The epidemiology and causes of childhood injuries. Journal o f Social Issues, 43(2), 13-31.
Rivara, F. P., Thompson, D. C., Thompson, R. S., Rogers, L. W., Alexander, B., Felix, D., et al. (1994, April). The Seattle children’s bicycle helmet campaign: Changes in helmet use and head injury admissions. Pediatrics, 93(4), 567-569.
San Diego County Health and Human Services Agency. (2003). Child and family well-being. San Diego, CA.
Reproduced with permission of the copyright owner. Further reproduction prohibited without permission.

130
San Diego County Health and Human Services Report Card. (2003). San Diego,CA.
Schall, E. (1994). School-based health education: What works? American Journal of Preventive Medicine, 10, 30-33.
Statistical Package for Social Sciences. (2004). SPSS advanced statistics software manual 12.0. SPSS Inc.
Synovitz, L. B., Mickalide, A., Bryn, S., & Gallagher, S. (2000). Unintentional injury and violence prevention in schools: A call for action. Journal o f Health Education, 31(3), 67-74.
Think First National Injury Prevention Foundation. (1996a). Street smart: A think first adventure. Videotape. Rolling Meadows, IL: Author.
Think First National Injury Prevention Foundation. (1996b). Think First for Kids: A comprehensive brain and spinal cord injury prevention curriculum. Rolling Meadows, IL: Author
Think First National Injury Prevention Foundation. (2005). About the organization. Retrieved February 20, 2005, from www.thinkfirst.org
Thomas, R. M. (1985). Comparing theories o f child development (2nd ed.). Belmont, CA: Wadsworth.
Thomas, R. M. (1992). Comparing theories o f child development (3 rd ed.) Belmont, CA: Wadsworth.
Tomasello, M., Savage-Rumbaugh, S., & Kruger, A. C. (1993). Imitative learning of actions on objects by children, chimpanzees, and enculturated chimpanzees. Child Development, 64, 1688-1705.
Trawick-Smith, J. (2000). Early childhood development. Upper Saddle River, NJ: Prentice-Hall.
U.S. Department of Health and Human Services. (1995). Healthy people 2000: Midcourse review and 1995 revisions. Washington, DC: U.S. Government Printing Office.
U.S. Department of Health and Human Services. (2000). Healthy people 2010 - Conference Edition, 1(7 & 15). Washington, DC: U.S. Government Printing Office.
Reproduced with permission of the copyright owner. Further reproduction prohibited without permission.

131
Vincent, M. L., Clearie, A. F., & Schluchter, M. D. (1987). Reducing adolescent pregnancy through school and community-based education. Journal of the American Medical Association, 257, 3382-3386.
Vygotsky, L. S. (1962). Thought and language. Cambridge, MA: MIT Press.
Waite-Stupiansky, S. (1997). Building understanding together: A constructivist approach to early childhood education. Pennsylvania: Delmar Publishers.
Walker, L. J. (1984). Sex differences in the development of moral reasoning: a critical review. Child Development, 55, 677-691.
Walter, H. J. (1989). Primary prevention of chronic disease among children: The school-based “Know Your Body” intervention trials. Health Education Quarterly, 16(2), 201-214.
Watts, C., & Eyster, F. (1992). National head and spinal cord injury prevention program of the American Association of Neurological Surgeons and the Congress of Neurological Surgeons. Journal o f Neurotrauma, 9(1), 307-312.
Weber, E. (1984). Ideal influencing early childhood education: A theoretical analysis. New York: Teachers College Press.
Wesner, M. (2003). An evaluation of Think First Saskatchewan. Canadian Journal o f Public Health, 94(2), 115-121.
Wise, P. H., Kotelchuck, M. L., Wilson, M. L., & Mills, M. (1985). Racial and socioeconomic disparities in childhood mortality in Boston. New England Journal of Medicine, 313, 360-366.
Woolfolk, A. E. (1998). Educational psychology (7th ed). Boston: Allyn & Bacon.
Reproduced with permission of the copyright owner. Further reproduction prohibited without permission.

APPENDIX A
LEADING CAUSES OF INJURY DEATH BY
AGE GROUP — UNINTENTIONAL, 2001
132
Reproduced with permission of the copyright owner. Further reproduction prohibited without permission.

Reproduced
with perm
ission of the
copyright owner.
Further reproduction prohibited
without perm
ission.
10 Leading Causes of Injury Death by Age Group - 2001
Age GroupsRank <1 1-4 5-9 10-14 15-24 25-34 35-44 45-54 55-64 65+ Total
mv Traffic 660
tonal Unintentional Unining Drowning Dr<
168
HomicideFirearm
4,200
HomicideFirearm
3,308
SuicideFirearm
2.083
SuicideFirearm16,869
Homicide Other Spec
Class. 117
SuicideFirearm2,130
SuicideFirearm2,564
SuicideFirearm3,030
SuicideFirearm3.023
UnintentionalFall
1,004
UnintentionalFall
15.019Suffocation
163
Homicide Unspecified
107
Hcmlcide Unspecified
146
Homicide Firearm
59
Homicide Firearm
121
UnintentionalPoisoning
1,362
UnintentionalPoisoning
2.507
HomicideFirearm
1,978
SuicidePoisoning
1,439
SuicideFirearm3,943
U nin ten tiona lPoisoning
798
U nin ten tiona lPoisoning
14.078
Unintentional Unintentional UnintentionalDrowning Suffocation O ther Land
68 138 T ransport 48
UnintentionalFall
1,024
UnintentionalSuffocation
3.204
HomicideFirearm11,348
U fltm en
Fire/b50
Unintentional Unintentional U n in tenPedestrian, Suffocation Ftre/b
Other 81 44 HR
UnintentionalDrowning
596
Homicide Transportation
Related 842
Undetermined Suffocation
47
Unintentional Unintentional Fall O ther Land33 T ransport 83
Undetermined Poisoning
1,121
Unintentional Unintentional Pedestrian , Suffocation
Other 26 68
Homicide Transportation Related 1,061
Undetermined Poisoning
549
Undetermined Poisoning
761
Unintentional Unintentional Poisoning Suffocation
722 5,555
Unintentional Unintentional UnintentionalS truck by Firearm Fall
o r A gainst 25 39 256
UnintentionalFall647
Homicide Transportation
Related 644
UnintentionalNatural/Env.
621
SuicidePoisoning
5,191
Unintentional Unintentional Unintentional U nintentional Unintentional Unintentional Unintentional Unintentional Unintentional Unintentional Fall Natural/Env. O ther P edestrian , O ther Land Drowning Drowning Suffocation Suffocation O ther Spec.,23 42 Transport 22 O ther 38 T ransport 250 374 462 461 381 NEC 578
Note: Homicide and suicide counts include terrorism deaths associated with the events of September 11, 2001, that occurred in New York City, Pennsylvania, and Virginia. Atotal of 2,926 U.S. residents lost their lives in these acts of terrorism in 2001, of which 2,922 were classified as (transportation-related) homicides and 4 were classified a s suicides.Source: National Center for Health Statistics, (NCHS) Vital Stetistics Systems.P roduced by: Office of Statistics and Programming, National Center for Injury Prevention and Control, CDC.
APPENDIX B
LEADING CAUSES OF DEATH BY
AGE GROUP — 2001
134
Reproduced with permission of the copyright owner. Further reproduction prohibited without permission.

Reproduced
with perm
ission of the
copyright owner.
Further reproduction prohibited
without perm
ission.
10 Leading Causes of Death by Age Group - 2001Age Groups
Rank <1 1-4 5-9 10-14 15-24 25-34 35-44 45-54 55-64 65+ Total
1Congenital Malignant Malignant Malignant Heart HeartAnomalies Neoplasms Neoplasms Neoplasms Disease D isease
5.513 16,569 49,562 90,223 582,730 700,142
2Short
GestationCongenitalAnomalies
MalignantNeoplasms
MalignantNeoplasms
HeartDisease
HeartD isease
MalignantNeoplasms
MalignantNeoplasms
4,410 557 493 515 36,399 62,486 390,214 553,768
3 SIDS2.234
MalignantNeoplasms
CongenitalAnomalies
HeartD isease
Chronic Low. Respiratory
Cerebrovascular
Cerebrovascular
420 182 13,326 D isease 11,166 144,486 163,538
Maternal Congenital Malignant Malignant Liver Cerebro Chronic Low. Chronic Low.4 Pregnancy Anomalies Neoplasms Neoplasms Disease vascular Respiratory Respiratory
Comp. 1,499 194 1,704 3,994 7,259 9,608 Disease 106,904 Disease 123,013
Placenta Cord Heart Heart Heart HeartHIV
5,867
Diabetes Influenza5 Membranes Disease Disease D isease Disease Mellitus & Pneumonia
1,018 225 98 999 3,160 9,570 55,518
Respiratory Influenza Benign Heart CongenitalHIV
2,101
Cerebro Diabetes Diabetes6 Distress & Pneumonia Neoplasms Disease Anomalies vascular Mellitus Mellltus
1,011 112 52 174 505 5,910 53,707 71,372
Septicemia108
Influenza Chronic Low.HIV225
Cerebro Liver Diabetes Liver Alzheimer's Influenza7 & Pneumonia Respiratory vascular Disease Mellltus Disease Disease & Pneumonia
46 Disease 62 601 3,336 5,343 5,750 53,245 62,034
8Bacterial Perinatal Chronic Low. Benign Cerebro Diabetes Cerebro
HIV4,120
Nephritis33,121
Alzheimer'sSepsis Period Respiratory Neoplasms vascular Mellltus vascular D isease
896 72 Disease 42 53 196 595 2,491 53,852
Circulatory Benign Cerebro Influenza Influenza Congenital Diabetes Chronic Low.Nephritis
3,284Nephritis39,4809 System Neoplasms vascular & Pneumonia & Pneumonia Anomalies Mellitus Respiratory
D isease 622 58 38 46 181 458 1,958 Disease 3,324
10Intrauterine
Hypoxia534
Cerebrovascular
54
Septicemia29
Cerebrovascular
42
Chronic Low. Respiratory D isease 171
LiverDisease
387
Influenza & Pneumonia
983
Septicemia3,111
Septicemia25,418
Septicemia32,238
Note: Homicide and suicide counts include terrorism deaths associated with the events of Septem ber 11, 2001, that occurred in New Vbrk City, Pennsylvania, and Virginia. Atotai of 2,926 U.S. residents lost their lives in these acts of terrorism in 2001, of which 2,922 were classified as (transportation-related) homicides and 4 were classified a s suicides.Source: National Center for Health Statistics, (NCHS) Vital Sfetistics Systems.P roduced by: Office of Statistics and Programming, National Center for Injury Prevention and Control, CDC.
U>

APPENDIX C
NATIONAL ESTIMATES OF THE 10 LEADING CAUSES
OF NONFATAL INJURIES TREATED IN HOSPITAL
EMERGENCY DEPARTMENTS, UNITED STATES, 2002
136
Reproduced with permission of the copyright owner. Further reproduction prohibited without permission.

Reproduced
with perm
ission of the
copyright owner.
Further reproduction prohibited
without perm
ission.
National Estimates of the 10 Leading Causes of Nonfatal Injuries Treated in Hospital Emergency Departments, United States, 2002
Age Groups |Rank <1 1-4 5-9 10-14 15-24 25-34 35-44 45-54 55-64 65+ Total
1Unintentional
Struck by/Against 951,581
2Unintentional
Struck by/Against 33,023
Unintentional Struck by/Against
390,945
Unintentional Struck by/Against
449,222
Unintentional Struck by/Against
622,615
UnintentionalOverexertion
701,783
UnintentionalOverexertion
656,122
UnintentionalOverexertion
393,539
Unintentional Struck by/Against
185,922
Unintentional Struck by/Against
4,490,051
3Unintentional
Cut/Pierce135,098
UnintentionalOverexertion
288,074
Unintentional Struck by/Against
671,811
Unintentional Struck by/Against
609,021
Unintentional Struck by/Against
385,139
Unintentional Struck by/Against
190,501
UnintentionalOverexertion
3,286,856
4Unintentional Foreign Body
106,331
Unintentional Pedal Cyclist
118,046
UnintentionalCut/Pierce
170,062
UnintentionalOverexertion
758,312
UnintentionalOverexertion
175,009
UnintentionalOverexertion
156,231
5Unintentional
Cut/Pierce87,836
Unintentional Pedal Cyclist
142,085
UnintentionalCut/Pierce492,172
UnintentionalCut/Pierce461,058
UnintentionalCut/Pierce
394,133
UnintentionalCut/Pierce
272,953
UnintentionalCut/Pierce
142,911
UnintentionalCut/Pierce
115,708
UnintentionalCut/Pierce2,278,105
6Unintentional
Unk./Unspedfied129,388
Other Assault* Struck by/Against
445,965
Other Assault* Struck by/Against
271,774
Other Assault* Struck by/Against
228,208
Other Assault* Struck by/Agalnst
102,941
Other Assault* Struck by/Against
1,270,224
7Unintentional Foreign Body
8,776
UnintentionalOverexertion
74,530
UnintentionalOverexertion
76,811
UnintentionalUnk./Unspecified
174,572
Unintentional Other Specified
129,831
Unintentional Other Specified
37,399
UnintentionalUnkAlnspecified
47,825
8Unintentional
Unk./Unspecified6,916 u Unintentional
Foreign Body 54,164
Other Assault' Struck by/Against
114,891
Unintentional Other Specified
110,163
Unintentional Other Specified
93,356
Unintentional Other Transport
34,315
Unintentional Other Transport
44,759
UnintentionalUnk./Unspecified
742,188
9Unintentional
Inhalation/Suff.6,452
Unintentional Other Transport
65,375
Unintentional Other Transport
125,085
UnintentionalUnkAlnspecified
109,749
UnintentionalUnk./Unspecified
28,358
Unintentional Other Transport
594,127
10UnintentionalOverexertion
6,336
UnintentionalUnk./Unspecified
48,293
UnintentionalUnk./Unspecified
48,079
Unintentional Other Specified
111,000
Unintentional Other Transport
95,680
UnintentionalUnk./Unspecified
92,403
Unintentional Foreign Body
57,803
Other Assault* Struck by/Against
26,969
Unintentional Foreign Body
28,723
Unintentional Foreign Body
577,622
A The 'Other Assault' category Includes all assaults that a ren o t classified a s sexual assault. It represents the majority of assaults.Data Source: National Electronic Injury Surveillance System All Injury Program operated by the Consumer Product Safety Commission Chart developed by the National Center for Injury Prevention and Control, CDC

APPENDIX D
THINK FIRST FOR KIDS: DIRECTORS/EDUCATORS
TRAINING GUIDE
138
Reproduced with permission of the copyright owner. Further reproduction prohibited without permission.

139
ThinkFirst For Kids
INTRODUCTION
Injury is a major health problem in the United States. The number of deaths, long-term effects, and high costs
to individuals and society, are greater than other leading causes o f death and disability. Traumatic brain and
spinal cord injuries are the most devastating injuries because of their lifetime consequences and associated
costs.
With the control o f infectious disease, injury has now become the major threat to the lives and development of
children. Injury is the leading cause of death among children 15 years and under; a large proportion suffer
traumatic brain and spinal cord injuries. The physical, emotional, psychological, and learning problems that
affect injured children make injuries a high priority for health and safety advocates throughout the nation.
Research and clinical reports emphasize the importance o f primary prevention o f injuries. The most compre
hensive document promoting health is Healthy People 2000: Objectives fo r the Nation, which supports educa
tional and community based programs ko promote health and prevent disease. Several objectives in the docu
ment seek to reduce weapon-related deaths and nonfatal brain and spinal cord injuries for all ages and to in
crease the use of occupant protection systems (safety belts, car seats, etc.) and helmets. Other objectives in
clude violence prevention and conflict resolution skills, and the provision o f academic instruction on injury
prevention and control.
The public and private sectors are working together to reduce the numbers and severity o f injuries, particularly
traumatic brain and spinal cord injuries. The ThinkFirst for Kids program represents a collaborative effort of
educators, the ThinkFirst Foundation, the National Highway Traffic Safety Administration (NHTSA), and the
American Academy o f Pediatrics, the Peace Education Foundation, and professionals from the fields o f psy
chology and psychiatry. The goal o f the program is to increase knowledge o f brain and spinal cord injury, in
jury prevention measures, and the use o f safety habits.
Reproduced with permission of the copyright owner. Further reproduction prohibited without permission.
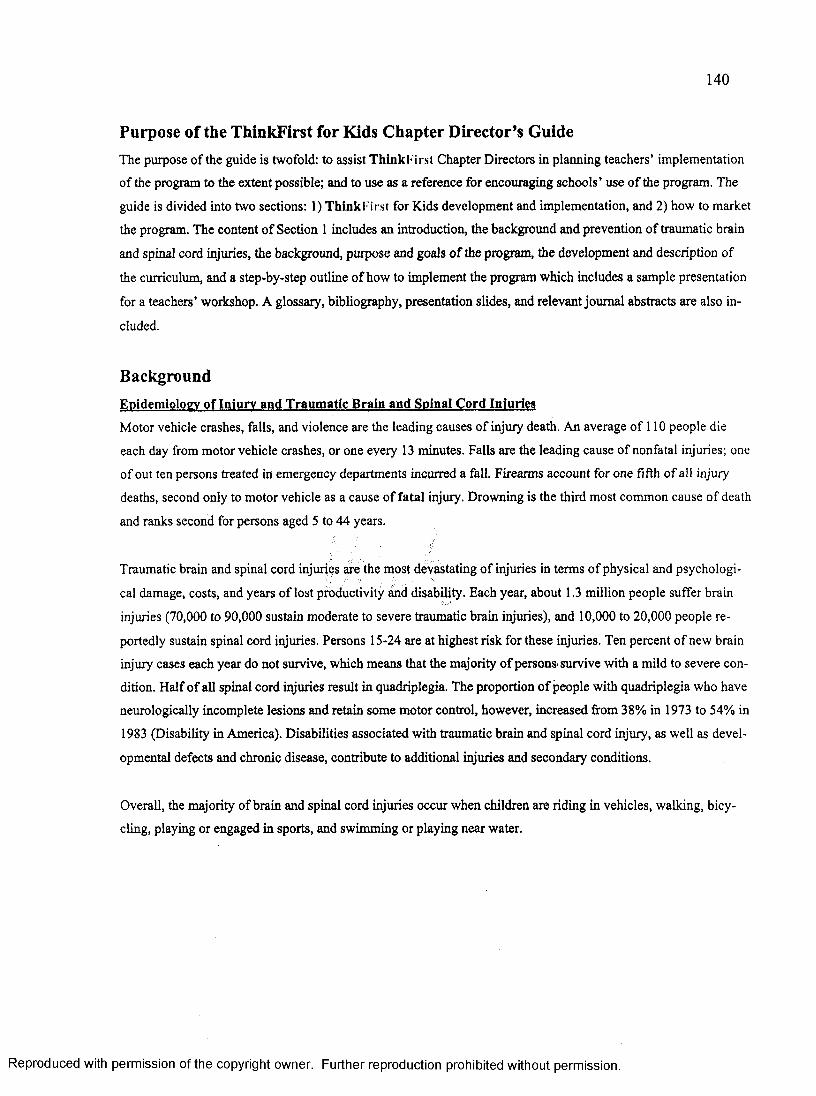
140
Purpose of the ThinkFirst for Kids Chapter Director’s GuideThe purpose of the guide is twofold: to assist ThinkFirst Chapter Directors in planning teachers’ implementation
o f the program to the extent possible; and to use as a reference for encouraging schools’ use o f the program. The
guide is divided into two sections: 1) ThinkFirst for Kids development and implementation, and 2) how to market
the program. The content of Section 1 includes an introduction, the background and prevention of traumatic brain
and spinal cord injuries, the background, purpose and goals o f the program, the development and description of
the curriculum, and a step-by-step outline o f how to implement the program which includes a sample presentation
for a teachers’ workshop. A glossary, bibliography, presentation slides, and relevant journal abstracts are also in
cluded.
BackgroundEpidemiology of Iniurv and Traumatic Brain and Spinal Cord Injuries
Motor vehicle crashes, falls, and violence are the leading causes o f injury death. An average of 110 people die
each day from motor vehicle crashes, or one every 13 minutes. Falls are the leading cause of nonfatal injuries; one
of out ten persons treated in emergency departments incurred a fall. Firearms account for one fifth o f all injury
deaths, second only to motor vehicle as a cause of fatal injury. Drowning is the third most common cause of death
and ranks second for persons aged 5 to 44 years.
Traumatic brain and spinal cord injuries are the most devastating o f injuries in terms o f physical and psychologi
cal damage, costs, and years of lost productivity and disability. Each year, about 1.3 million people suffer brain
injuries (70,000 to 90,000 sustain moderate to severe traumatic brain injuries), and 10,000 to 20,000 people re
portedly sustain spinal cord injuries. Persons 15-24 are at highest risk for these injuries. Ten percent of new brain
injury cases each year do not survive, which means that the majority o f persons survive with a mild to severe con
dition. Half o f all spinal cord injuries result in quadriplegia. The proportion o f people with quadriplegia who have
neurologically incomplete lesions and retain some motor control, however, increased from 38% in 1973 to 54% in
1983 (Disability in America). Disabilities associated with traumatic brain and spinal cord injury, as well as devel
opmental defects and chronic disease, contribute to additional injuries and secondary conditions.
Overall, the majority o f brain and spinal cord injuries occur when children are riding in vehicles, walking, bicy
cling, playing or engaged in sports, and swimming or playing near water.
Reproduced with permission of the copyright owner. Further reproduction prohibited without permission.
141
Each year, about 10,000 children under age 15 years die from injury, 340,000 are hospitalized, and an estimated
10 million are treated in emergency departments. Traumatic brain injuries account for the majority o f injuries:
• Approximately 150,000 children sustain traumatic brain injuries each year
• Nearly 7,000 children die each year from traumatic brain injury
• Approximately 30% of all childhood deaths result from brain injury
• 40% of all brain injuries occur in persons less than 16 years
• Sports and recreation account for more than 40% o f all brain injuries in children
• Nearly one half of all ATV-related brain injuries occur in children 5-14 years
• Unintentional shootings between children are the fifth leading cause of death for persons under 14 years
• The majority o f the annual 21,000 BB gun and other non powder firearm injuries occur in children
Spinal cord injury is less common among children than adults because of flexibility o f their body tissues; they
are at risk, however, in activities such as sliding into base and striking another player when playing baseball or
softball. It has been estimated that 1,200 children under 20 years o f age sustain spinal cord injury with neuro
logical deficits each year. The main causes of injury are jumping or falling, but motor vehicle crashes cause
more permanent impairment. About 1,000 diving-related spinal cord injuries occur each year among all age
groups in the United States. Diving accounts for 10% of all spinal cord injuries, and 60-65% of all recreational
spinal cord injuries.
Persons who incur brain or spinal cord injuries often have multiple injuries which lead to additional long-term
effects. More than 80% of persons with brain injury also incur fractures or abdominal injuries, and 10% have
spinal cord injuries. Also, 10% of persons with spinal cord injuries incur a brain injury. Persons with moderate/
severe brain or spinal cord injuries often require a lifetime of rehabilitation. The estimated annual cost o f acute
care for spinal cord injures is $4 Billion; estimated costs o f acute hospital care for traumatic brain injury is $12.5
Billion.
Prevention of Traumatic Brain and Spinal Cord Injuries
The primary prevention o f traumatic brain and spinal cord involves education, technology, and legislation. In
this guide, the educational methods and strategies to prevent these injuries are categorized by the injury areas
addressed in the curriculum; preventing traumatic brain and spinal cord injury; vehicle safety; bicycle safety;
safety around weapons and creative problem solving; playground, recreation, and sports safety; and water
safety. (For detailed prevention strategies/activities, refer to information in the curriculum lessons).
Reproduced with permission of the copyright owner. Further reproduction prohibited without permission.
142
Susceptibility to traumatic brain and spinal cord injury relates to the total environment. The types and causes of
injuries suffered by people in the United States are related to common hazards of motor vehicles and roadways,
bicycle use, recreation and sports, water, and the availability o f weapons. The goal to increase knowledge and
awareness of the causes, consequences, and prevention o f injuries, as well as behaviors that help reduce the risk
of injury is the basis for prevention strategies and programs. The overall strategies used to prevent injuries for
each are as follows:
Vehicle Safety. Continued progress in designing safer vehicle passenger compartments, establishing agencies
to set standards for vehicles, and legislating traffic control and injury protection measures (safety restraint sys
tems), has helped to decrease the frequency and severity of injuries. Education and behavior change programs
support these strategies and accomplish further reductions through psychosocial and cultural approaches. Estab
lishing rules and laws specific to roadways and individual behavior (pedestrians and vehicle drivers) has in
creased people’s knowledge and awareness of risks.
Bicycle Safety. Bicyclists’ vulnerability to injury requires a set o f strategies focused on the rider, other vehicle
drivers, community roadway/traffic control systems and the interaction of these factors. Ordinances and educa
tion to assure that the bicyclist rides a safe bicycle o f the right size, wears a helmet, and knows and follows rid
ing and traffic safety rules are effective preventive methods. Equally important are the education o f vehicle
drivers to acknowledge they must share the road with bicyclists, roadway maintenance, and the presence of traf
fic signals that help protect the rider.
Playground, recreation, and sports safety. Play area injuries may be prevented by building safe and strong
equipment, having soft surface areas under swings and monkey bars, and supervising children according to
their stage of development. Overall strategies to prevent sport injury focus on the use o f appropriate protective
equipment, adherence to rules and laws governing the sport, and physical examinations to assure a person is
physically and developmentally able to play the sport.
Safety around weapons and creative problem solving. Strategies to prevent weapon injuries center on educa
tion for gun owners to secure the firearms and ammunition so that persons - particularly children - cannot fire
the weapon, the legal control o f gun availability, and education and restrictions o f other weapons such as
knives. Education o f children and adults to make guns and other weapons inaccessible are current strategies to
prevent injury. At the same time, teaching creative problem solving and conflict resolution skills in schools and
communities are measures to reduce intentional injuries.
Reproduced with permission of the copyright owner. Further reproduction prohibited without permission.

143
Water safety. The suddenness and silence o f drowning or near-drowning make prevention a real challenge. Pre
vention strategies for natural bodies o f water focus on using caution in entering the water, wearing lifejackets,
and using seasonal life guards. Latching gates, 4-sided fences, and draining pools when out of season are the
main strategies used for pools. Suggested water safety measures include: adult supervision o f children, availabil
ity of rescue equipment, learning water survival techniques (including swimming), safe diving practices, and
swimming with a buddy.
Thinkl irst for Kids Program Background
The ThinkFirst for Kids Program was developed by the ThinkFirst Foundation to increase awareness and
knowledge among children 6-8 years o f age about the risks o f brain and spinal cord injury, and the use of good
safety habits. The program was designed to enhance students’ interest and learning by using four interactive
components. The four components of the program include: 1) a brain and spinal cord injury prevention curricu
lum with six subject-integrated lessons, 2) an animated cartoon video that provides and overview of brain and
spinal cord injury and safety topics, 3) a set o f five comic sheets (one per safety topic), and 4) a set of five full-
color classroom posters that reinforce key messages presented during classroom instruction. All components
feature Street Smart, the safety messenger who enthusiastically teaches his friends how to have fun and be safe.
Several teaching strategies that inspire creativity and learning (e.g., role-play, stories, visual enforcement,
hands-on, reading, sharing ideas, etc.) were used in developing the curriculum.
ThinkFirst Chapter Directors who participated in the pilot study attended a training workshop in late 1994 to
learn the concepts and content o f the ThinkFirst for Kids program, and the strategies that could be used in in
troducing the program in elementary schools. Note. A description o f the ThinkFirst fo r Kids Chapter Director
Workshop is provided at the end o f this document.
The program was piloted in 21 schools at 11 sites in the United States during January to June, 1995. An assess
ment was made to determine if the program accomplished what was intended, what changes should be made to
help students learn, and to enhance educator acceptance o f the program. Questionnaires completed by teachers
and the Chapter Directors were used in refining the curriculum and program. Preliminary results of pre- and
post-tests of students taking both tests showed a slight increase in some knowledge items.
Reproduced with permission of the copyright owner. Further reproduction prohibited without permission.

144
Purpose and Rationale
The ThinkFirst for Kids program was developed to increase knowledge and awareness among elementary
school children (Grades 1-3) about the causes and consequences of brain and spinal cord injury, injury preven
tion, and safety habits that reduce the risk of injury. The curriculum, augmented by the video, comics, and post
ers was designed to: 1) help students learn safety messages in relation to subjects, 2) help teachers implement
the program without “teaching something extra”, and 3) help students form safety habits for life which will
ultimately reduce the number and/or severity o f traumatic brain and spinal cord injuries.
Elementary school-aged children are at an impressionable stage o f development, enjoy learning new responsi
bilities and decision-making skills, and attempt to influence their family members and peers. Teachings di
rected to this age group will likely increase safety behaviors that are maintained through the high-risk adoles
cent years and become life-long habits. It is anticipated that students, families, teachers, and communities will
benefit from participating in the ThinkFirst for Kids program.
Goals
1. To help elementary school educators teach the curriculum and other program components within the
subject material o f their lesson plans.
2. To use the combined efforts o f elementary school teachers, ThinkFirst for Kids Chapter Directors,
and school staff to increase knowledge an4 awareness o f brain and spinal cord injuries, how these
injuries can be prevented, and the importance of lifelong safety habits to prevent injury.
Development of the CurriculumBasis of Learning and Behavior Theory
The curricula are based on learning and behavioral theories stating that repeated and varied messages, given
over time, will increase students’ understanding, knowledge retention, and safety behavior. Theories o f learn
ing suggest that motivation, attention, and the ability to relate new and existing knowledge will determine what
is learned. Behaviorists place special emphasis on environmental stimuli and observable responses. Observa
tional learning involves four elements: attention, retention, production, and motivation or reinforcement. Ob
servational learning can teach new behaviors, encourage learned behaviors, strengthen or weaken inhibitions,
direct attention, and arouse emotion.
Reproduced with permission of the copyright owner. Further reproduction prohibited without permission.

145
There is common agreement across behavioral theories that an individual’s personality, environment (physical,
socio-cultural, socialization), and heredity help shape development. The development tasks accomplished during
middle childhood (6-12 years) described by Coleman (in Theory and Practice in Health Education) include:
1. Gaining wider knowledge and understanding of the physical and social world;
2. Building wholesome attitudes toward self;
3. Learning appropriate social roles;
4. Developing conscience, morality, and a scale o f values;
5. Learning to read, write, calculate, and other intellectual skills;
6. Learning physical skills; and
7. Learning to give and take and to share responsibility.
Since children this age tend to change their behavior because o f a desire to emulate role models (parents,
teachers), education programs should include parents and other potential models. The elementary school envi
ronment provides the opportunity to teach injury prevention messages over time, in different contexts, and ac
commodates the many teaching strategies: role-play, brain storming, discussion, etc. Programmed instruction
offers a systematic application of behavioral learning principles, allows for self-pacing, and breaks lessons into
small steps.
It is not unusual for people to demonstrate a gain in some knowledge items after a lesson/presentation, but
change in attitude and behavior requires acceptance of the message as meaningful enough to put into operation.
Adolescents are particularly resistant to messages that imply vulnerability and the need for changed behavior.
On the other hand, children aged 6-12 years seek new knowledge and are more amenable to change than adoles
cents. Six lessons spaced over time will aid in knowledge retention and prolonged awareness. In addition, the
visual and auditory messages provided by the video, posters, and comic strips will enhance associative learning.
Experience and Lessons for ThinkFirst for Kids
The experience gained in developing and implementing the Oklahoma Elementary School Injury Prevention
Education Program/Curriculum (OESIPEP), ThinkFirst and other single-presentation programs was used in
crafting the ThinkFirst for Kids program. Many programs have reported minimal change in knowledge, atti
tudes, and behavior o f the targeted population, with one or few exposures to the learning material (presentations,
lessons, etc.).
Reproduced with permission of the copyright owner. Further reproduction prohibited without permission.

146
Oklahoma Elementary School Injury Prevention Education Curriculum/Program
(OESIPE)
The lessons learned in the two-year development, implementation, and evaluation o f the OESIPE were used in
crafting the ThinkFirst for Kids program and Chapter Director’s guide, and planning the pilot program.
Specifically, the experience was useful in: 1) anticipating the needs o f teachers, principals, and schools were
Think) ii si for Kids was piloted; 2) increasing the acceptance o f teachers by incorporating injury prevention
messages within subject material; and 3) finding out how best to work with teachers who have stressful, busy
days dealing with students, parents, testing times, and other events during the school year. Factors unique to the
elementary school environment were recognized during the two-year implementation phase o f the OESIPE.
Teachers used their own set of methods and style in teaching children and maintaining a safe, supportive class
room and school. Overall, the teachers appreciated: 1) having the injury prevention messages integrated into the
subject material, 2) using a curriculum which easily fit into their lesson plan where they do not have to teach
“something extra”, and 3) learning about the injury problem through the information provided in each lesson.
Piloting the ThinkFirst fo r Kids program.Piloting the program in varied metropolitan, rural, and suburban settings provided Chapter Directors the oppor
tunity to experience positive and negative feedback, and note strengths and weaknesses in their methods of in
troducing the program into elementary schools. Preliminary findings were shared with other Chapter Directors
during the annual meeting in April, 1995. An interim report was given to the Task Force. This information was
used as a basis to make final revisions to curriculum content and recommendations for the implementation
process. It was generally agreed that piloting the program was a good experience and indicated how the final
program could be improved. Note: A brief schedule o f the pilot program may be found at the end o f this docu
ment.
The ThinkFirst for Kids Curricula
The curricula were designed to fit easily into teachers’ weekly lesson plans. (Teachers may elect to teach two
lessons in one week but they should be spaced over three to six months). The 30-45 minute lessons were written
for integration into subject material. Each grade-specific curriculum includes:
Reproduced with permission of the copyright owner. Further reproduction prohibited without permission.

147
1. A table o f contents, foreword, introduction, curriculum guide for teachers, and pictures of Street Smart
and his friends to introduce to students;
2. Six lessons including an introduction to traumatic brain and spinal cord injury and five injury preven
tion topic areas;
3. Each lesson includes: a lesson plan/schedule, testing objectives met in the lesson, information related
to the particular injury problem, two to four subject-integrated exercises (mathematics, language, sci
ence, etc.);
4. Suggested resources to augment the program (i.e., videos, monographs, books, and agencies);
5. A glossary of terms used in the curriculum; and an exercise key.
Each curriculum is accompanied by a duplicate set o f camera-ready exercises and parent letters for
photocopying.
The content areas include: traumatic brain and spinal cord injury; vehicle safety; bicycle safety; safety around
weapons and creative problem solving; playground, recreation, and sports safety; and water safety. Numerous
additional activities involving the students, school, and community are described in the lesson plan for
teachers’ consideration. The content describes the injury problem and emphasizes prevention through the rec
ognition of hazards, the use of protective measures, and following safety rules. The lessons encourage student
creativity, decision-making, and responsibility for injury prevention themselves, their friends and family, and
the community.
ThinkFirst for Kids Program
Chapter Director Responsibilities
1. Promote ThinkFirst for Kids to local elementary schools. Each Chapter Director will have one complete
set o f program materials to use for promotional purposes. The set will include three curricula, a set o f five
classroom posters, two sets o f comic strips, one color and one black and white, one copy of the video,
Street Smart: A ThinkFirst Adventure, three PSA’s, and 100 brochures. (A marketing plan is included in
the next section o f this guide)
2. Assist primary school contact person(s) in developing a plan for program implementation. Conduct a
teacher orientation workshop. (A sample presentation is included at the end o f this document)
3. Conduct a teacher orientation workshop. (A sample presentation is included at the end o f this document)
4. Serve as an ongoing resource to schools.
Reproduced with permission of the copyright owner. Further reproduction prohibited without permission.

148
5. Maintain data for process evaluation (refer to ThinkFirst for Kids standards)
6. Conduct outcome evaluations (optional). ThinkFirst will have two types o f evaluations available to Chap
ter Directors who wish to use them.
Program Plan
The Chapter Director can initially approach the school district superintendent, principal, PTA or other commu
nity representative. The understanding and approval o f the school’s principal is required. Principals are usually
careful not to burden the teachers. The final decision about outside programs is usually left to the teacher’s dis
cretion. In order to ensure that lessons will be taught to the students, teachers must understand the program and
agree to teach the lessons.
The methods used to interest educators in implementing the program will vary according to the Chapter Director
and the environment of the schools and community. Selling points may include:
1. The legitimacy and goals of ThinkFirst;
2. The recognition that teachers are called upon to teach many topics not related to the required subjects;
therefore, the curriculum was written to have injury prevention messages integrated into mathematics,
language, science, etc.;
3. All materials (video, comic sheets, posters, and curricula) interrelate and the cost is relatively low;
4. Only 30-45 minutes are required for each lesson. Exercises and activities from the curriculum can be
used during “free-time” periods at the discretion of the teacher;
5. Many hands-on and class activities are included in the lessons.
6. Costs of injuries. The Chapter Director may wish to supplement with data on local injuries and related
costs. May meet required safety education standards (this will vary from state to state).
It is understood that schools will vary considerably in the amount o f assistance that they would like from the
Chapter Director. Once the school has agreed to teach the program, however, the Chapter Director should offer
to:
1. Conduct an orientation workshop with participating teachers and other involved school personnel.
2. Teach the first class - Brain and Spinal Cord Injury.
3. Assist with contacting community educators/organizations and providing information on other com
munity resources. Some examples might include police officers, traffic safety or Red Cross educators
and bicycle clubs.
Reproduced with permission of the copyright owner. Further reproduction prohibited without permission.

149
4. Assist with pre/post testing.
5. Serve as an ongoing injury prevention resource.
Program Preparation
In preparing to facilitate teachers’ implementation o f the program, utilize the information and materials from the
Chapter Director guide. Important points to remember are:
1. Research the community and know key people;
2. Select one teacher to be your contact person;
3. Know the program thoroughly - the objectives, the various components, and the interrelationship of the
components in reinforcing the injury prevention messages;
4. Respect the teachers and their donation, the staff, and the school environment (including mles);
5. Maintain a positive attitude;
6. Communicate as needed; take opportunities to provide additional information and answer teachers’ ques
tions, and listen to comments.
Teacher Program Orientation Workshop
Purpose
The workshop:
1. Establishes the ThinkFirst for Kids program as part of the overall curriculum taught by Grades 1-3
teachers in those schools which agree to implement the program.
2. Provides the time and environment to talk with the group of teachers o f each grade to clarify the respon
sibilities of both sides, and set the stage for mutual respect, cooperation, and collaboration during the
program implementation phase.
3. Initiates/expands teachers’ awareness and knowledge of the magnitude o f traumatic brain and spinal cord
injury, their causes, and the importance o f injury prevention.
4. Provides the opportunity to emphasize the unique features o f the program, review the curriculum to
gether, and relate injury prevention strategies to the lesson content.
5. Allows for setting up a flexible system o f contact and discussing/finalizing school pro jects (PTA meet-
Although the workshop will accomplish all of the above, most time should be spent on going through the cur
riculum with the teachers, answering their questions, getting feedback, and establishing rapport.
Reproduced with permission of the copyright owner. Further reproduction prohibited without permission.

150
The following steps are suggested for the workshop.
1. Work with the principal and teachers involved in scheduling a time for the workshop. (Ask the principal
if he/she will be attending). The time for orientation will be important since the sessions are short and
you will be asking for 50-60 minutes. You may ask if there are parents or interns who could stay in the
classroom. Usually teachers do not want lunch time schedules to be disrupted.
2. Make sure that all teachers have their books, sheets packet, comics, and posters in their hands before the
meeting. (Always send individual notes with materials). You may offer to make copies of the first par
ent letter or exercise. Do bring some o f the exercises on colored paper (light colors) to show how neat
they look,
3. The main “incentive” for the teachers is their willingness to teach the curriculum. If you decide to give
any rewards for students, the rewards MUST be available on the day expected.
4. Arrive about 15 minutes ahead o f time to set up, check AV equipment, etc.
5. When teachers gather, record their names if you haven’t already done so make sure they know who you
are and the organization you represent, and state briefly how the workshop will proceed. Begin on time.
6. Describe the goals, rationale, and key features o f the program.
7. Review the curricula. Go over the schedule of teacher-Chapter Director meetings/special events times
you have established with the school.
Teacher Workshop
The ThinkFirst for Kids program is designed to be implemented by classroom teachers o f elementary grade
levels 1-3. The ideal format would be to have a classroom teacher who is trained by a ThinkFirst Chapter Di
rector, present the material and reinforce the lessons throughout the school year, with ongoing support services
from the ThinkFirst Chapter Director when necessary. In reality, however, it must be understood that each
school district may choose to implement the program differently. In some school districts school health nurses
have expressed an interest in program implementation, while in others this responsibility might be handed off to
physical education/health instructors. In each case, the ThinkFirst Chapter Director must carefully evaluate the
needs of the audience and custom design the training to be o f interest to that particular group. The following
training module is a guide for presenting the components and rationale for ThinkFirst for Kids, and can be
adapted to meeting the needs of the training group to which it is being presented. It is strongly suggested that the
ThinkFirst Chapter Director research the injury statistics for their particular state and county to be of value to
their audience.
Reproduced with permission of the copyright owner. Further reproduction prohibited without permission.
151
I. Introduction and Background of ThinkFirst
Unintentional injury is the leading killer o f young people in America today, with motor vehicle crashes accounting
for approximately 20% o f these deaths. Unintentional injuries can also result in traumatic brain and spinal cord
injuries, which can lead to death or permanent disabilities for a young person. ThinkFirst, a national organization
whose mission is to reduce these injuries through education, reinforcement activities, public policy initiatives, and
community awareness programs, is actively involved in the development and implementation o f educational pro
grams for the prevention of brain and spinal cord injuries.
ThinkFirst was jointly founded by The American Association o f Neurological Surgeons and the Congress of Neu
rological Surgeons. Since 1986, the national ThinkFirst network o f over 200 local chapters has reached 4.1 mil
lion students with brain and spinal cord injury prevention education. Each program is coordinated by a health pro
fessional, many o f whom are injury prevention specialists, registered nurses, occupational and physical therapists
and neurosurgeons. Each ThinkFirst chapter is required to have a sponsoring physician and each program Chapter
Director receives training from the national ThinkFirst program at model site centers.
The original educational presentation was targeted to high school students at highest risk for brain and spinal cord
injuries because o f peer pressure and their inherent belief that they are invincible. The ThinkFirst educational pro
gram presented to middle and high school students includes a presentation by a health care professional regarding
the anatomy and physiology o f the brain and spinal cord; an action-packed video in which young people who have'l- • ;v> ,.
sustained brain or spinal cord injuries talk about how their injuries occurred and the changes in their lifestyle, and
a presentation by a young person who has sustained a brain or spinal cord injury who shares their experience and
answers questions from the group.
Think F irst for Kids was developed in response to needs voiced around the country for injury prevention programs
appropriate for elementary students. A national task force was formed in 1994 to review existing materials regard
ing brain and spinal cord injury prevention appropriate for children between the ages o f 6 and 8 and to develop a
curriculum to meet this need. The task force included elementary education teachers, a child psychologist, a child
psychiatrist, curriculum specialists, local program Chapter Directors and a neurosurgeon. When all o f the elements
of ThinkFirst for Kids were completed, the program was pilot-tested at elementary schools around the country
and received favorable comments from teachers and students alike. Based upon the recommendations from teach
ings participating in the pilot test, ThinkFirst for Kids was revised and the final product is now ready for imple
mentation.
Reproduced with permission of the copyright owner. Further reproduction prohibited without permission.
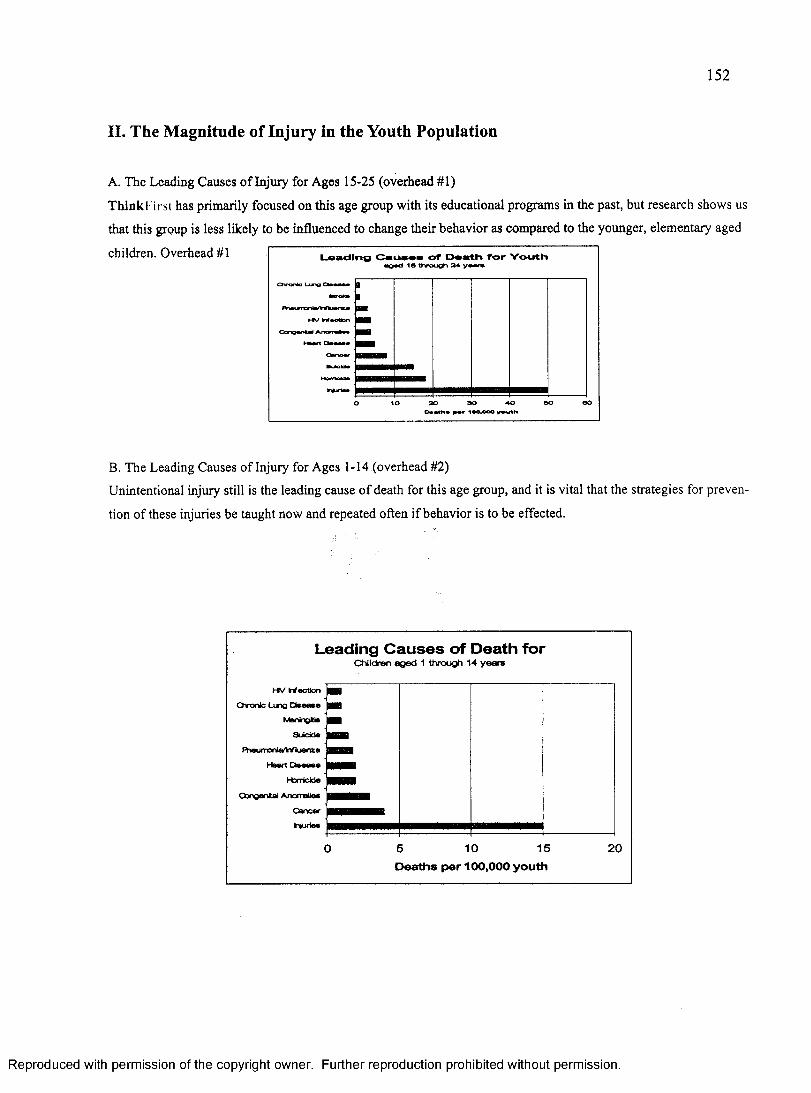
152
II. The M agnitude o f Injury in the Youth Population
A. The Leading Causes o f Injury for Ages 15-25 (overhead #1)
Think I irst has primarily focused on this age group with its educational programs in the past, but research shows us
that this group is less likely to be influenced to change their behavior as compared to the younger, elementary aged
children. Overhead #1 Loading Cauaos of Doath for Youthaged 16 through 24 yw n
C h r o n te
30 90 40Daalh* 100,000 youth
B. The Leading Causes of Injury for Ages 1-14 (overhead #2)
Unintentional injury still is the leading cause o f death for this age group, and it is vital that the strategies for preven
tion of these injuries be taught now and repeated often if behavior is to be effected.
Leading C a u ses o f Death forC h i l d r e n a g e d 1 t h r o u g h 1 4 y e a r s
O ronic Lung
FheurroniaTnfluenzaHeart
Congenital Anomalies
10 15 205Deaths per 100,000 youth
Reproduced with permission of the copyright owner. Further reproduction prohibited without permission.

153
C. The Cost of Injury (overhead #3)
The costs of brain and spinal cord injuries are astronomical and include hospitalizations, rehabilitation care,
home care and in the case o f a young person the “years o f productive life lost” (YPLL).
Annual Lifetime Cost of Injury for Children Birth - Age 14
(in millions of dollars)$13,825 Billion
$ 5 ,836 Direct H ealth C are (42% )
$5,451 Indirect Morbldty (40% )
$2,538 Indirect Mortality (18% )
D. The Frequency o f Brain Injuries (overhead #4)
A traumatic brain injury is certainly the most expensive form o f injury, and it can easily result from a simple
fall o ff a bicycle to an un-helmeted child.
Estimated Annual Brain Injury Frequency for 1990
75,000Deaths*
336,000 Hospitalized**
1,975,000 Medically Attended***
Estimates extrapolated to 1990, based on data sources below:* Based on brain injury mortality rate of 30/100,000/yr for 250 million U.S. Population** Source: National Center for Health Statistics (NCHS) National Hospital Discharge Survey, 1988.*** Source: NCHS National Health Interview Survey, 1988.
Reproduced with permission of the copyright owner. Further reproduction prohibited without permission.

154
E. The Frequency o f Spinal Cord Injuries (overhead #5)
While this figure is not as high as that o f traumatic brain injury, it is still o f grave consequences when one considers
the impact which a spinal cord injury will have upon a young person.____________________________Estimated Annual Traumatic
Spinal Cord Injury
10,000Injuries*
4,830 Deaths
(3,464 fatal at scene)
1.290Quadriplegia complete
1.290Quadriplegia incomplete
1.290 Paraplegia complete
1.290Paraplegia incomplete
♦Based on 10,000 as the lowest estimate o f traumatic spinal cord injuries each year (10,000-20,000).
III. The Rationale for Injury Prevention in an Educational Setting
According to Healthy People 2000: Objectives fo r the Nation, the attainment o f health goals for America will de
pend substantially on educational and community-based programs to promote health and prevent disease. Several
objectives in this document seek to reduce weapon-related deaths and non-fatal brain injuries for all ages. Other
injury-related objectives include increasing the proportion o f elementary and secondary schools which teach non
violent conflict resolution skills and the provision of academic instruction on injury prevention and control.
In developing ThinkFirst for Kids, the task force looked at the leading causes for injuries among children and re
searched methods of presenting strategies which could be taught in a classroom setting to prevent these injuries and
have a positive effect on behavior change. One need which was identified was that of conflict resolution and weap
ons safety. ThinkFirst conferred with experts in these areas such as The Peace Education Foundation who provided
information on introducing conflict resolution to young children. The National Highway Traffic Safety Administra
tion provided state of the art information on safety restraints and their uses and bicycle safety, while the American
Red Cross conferred on water safety materials and safe depths for diving.
Reproduced with permission of the copyright owner. Further reproduction prohibited without permission.
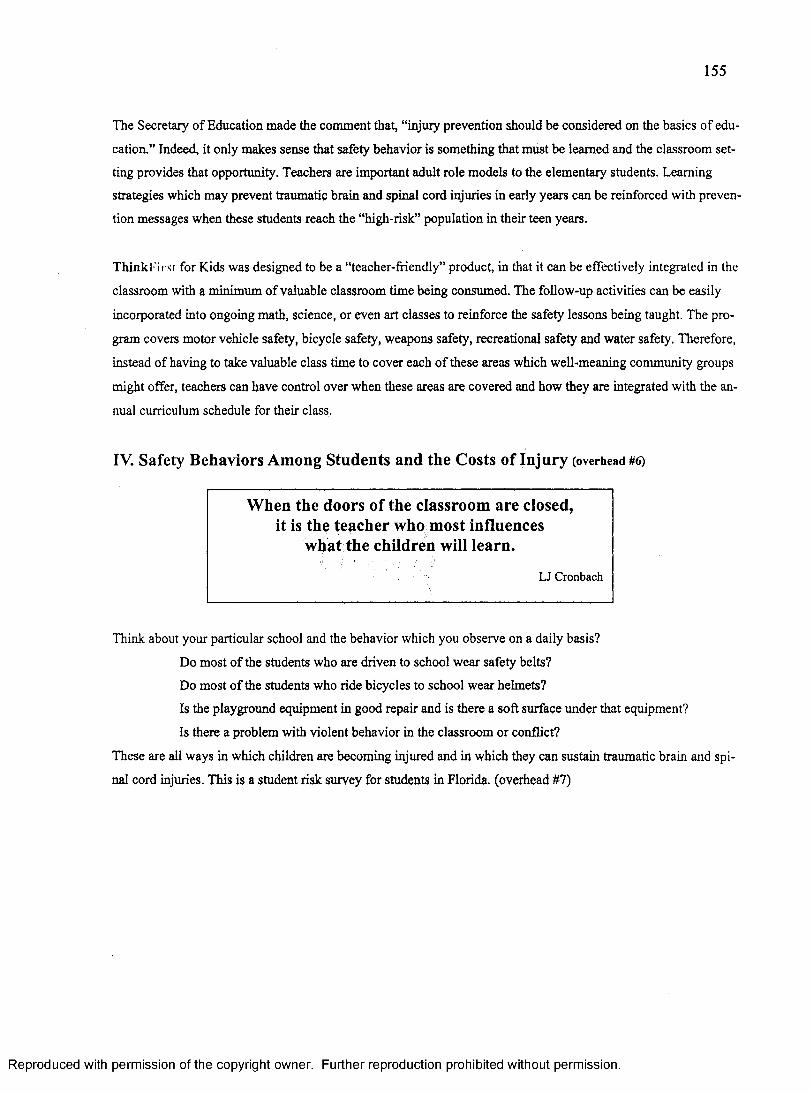
155
The Secretary o f Education made the comment that, “injury prevention should be considered on the basics of edu
cation.” Indeed, it only makes sense that safety behavior is something that must be learned and the classroom set
ting provides that opportunity. Teachers are important adult role models to the elementary students. Learning
strategies which may prevent traumatic brain and spinal cord injuries in early years can be reinforced with preven
tion messages when these students reach the “high-risk” population in their teen years.
ThinkFirst for Kids was designed to be a “teacher-friendly” product, in that it can be effectively integrated in the
classroom with a minimum of valuable classroom time being consumed. The follow-up activities can be easily
incorporated into ongoing math, science, or even art classes to reinforce the safety lessons being taught. The pro
gram covers motor vehicle safety, bicycle safety, weapons safety, recreational safety and water safety. Therefore,
instead of having to take valuable class time to cover each of these areas which well-meaning community groups
might offer, teachers can have control over when these areas are covered and how they are integrated with the an
nual curriculum schedule for their class.
IV. Safety Behaviors Among Students and the Costs of Injury (overhead #6)
When the doors of the classroom are closed, it is the teacher who most influences
what the children will learn.
LJ Cronbach
Think about your particular school and the behavior which you observe on a daily basis?
Do most o f the students who are driven to school wear safety belts?
Do most o f the students who ride bicycles to school wear helmets?
Is the playground equipment in good repair and is there a soft surface under that equipment?
Is there a problem with violent behavior in the classroom or conflict?
These are all ways in which children are becoming injured and in which they can sustain traumatic brain and spi
nal cord injuries. This is a student risk survey for students in Florida, (overhead #7)
Reproduced with permission of the copyright owner. Further reproduction prohibited without permission.

156
Florida Department of Education Youth Risk Behavior Survey
*60% of the students reported swimming without adult or lifeguard supervision.
*29% of ninth graders, 36% of tenth graders, 49% of eleventh graders, 41% of twelfth graders in the survey always wore a seat belt when riding in a car driven by someone else.
*48% of the students in the survey had worn a helmet while riding a motorcycle in the past year.
* 1 % of the surveyed students wore a bicycle helmet while riding a bicycle in the past year.
Many students are sw im m ing without supervision and if they do not understand the rationale of swimming
safety rules or refuse to follow them, serious implications can arise.
As you can see, the numbers for wearing o f safety belts is low. It seems to peak for 11th graders who may be
getting their driver’s licenses, but then fall back some.
Only 1% of the students surveyed wore bicycle helmets. On the average, approximately 15% of adults and chil
dren in the United States wear bicycle helmets regularly.
ThinkFirst for Kids addressed each o f these issues in a specific module designed to influence student’s behav
ior toward taking the necessary precautions to prevent injuries associated with these activities.'jt
As it has already been established, the cost of one brain or spinal cord injury is astronomical. The cost of pre
vention can be nom inal, as in the case o f wearing a bicycle helmet. This comparison was made by SAFE KIDS
to show the direct and indirect health care costs to society versus the cost of a bicycle helmet to prevent this
injury (overhead #8).
INVESTMENT
Every $15 bike helmet saves this country $30 in direct health care costs and an additional $420 in in-direct health costs and costs to society
Reproduced with permission of the copyright owner. Further reproduction prohibited without permission.

157
V. T h in k F irst for Kids Educational Program
A. Goals
The goal of this program is to increase the knowledge and awareness among children in grades
1-3 of:
1. The causes and risk factors involved in sustaining brain and spinal cord injuries
2. Injury prevention and the use o f safety habits for life
B. Strategies
The teaching strategies employed in this curriculum inspire creativity in children as they learn the safety mes
sages by doing and through interaction. The curriculum provides solid strategies that when employed can effec
tively prevent brain and spinal cord injuries. The teaching method is to present the problem. The students prac
tice problem solving skills and taking responsibility for their actions.
C. Learning Theory and the Program Components
The curriculum is based upon the learning theories o f using interrelated themes and specific concepts given over
time will increase the students’ understanding, knowledge retention and sustained behavior. The purpose of cur
riculum design three-fold:
1. To help students learn safety messages in relation to subjects-work in classroom lessons.
2. To help teachers to implement an injury prevention program without having to teach an extra
course.
3. To help students leam safety habits which will ultimately reduce the number and severity of trau
matic brain and spinal cord injuries?
D. Curriculum Design (overhead #9)
Reproduced with permission of the copyright owner. Further reproduction prohibited without permission.

158
ThinkFirst for Kids Program
KEY FEATURES
• Designed to be implemented by teachers in their daily/weekly lesson plans.
• Program for children focusing on brain and spinal cord injury prevention, and safety habits to prevent injury.
• Written to be teacher-friendly-interesting and fun to teach.
• Complete program with Street Smart video, grade specific (1-3) bound curriculum, comic book, and posters.
• Developed by neurosurgeons, traffic safety and public health workers, and education program specialists.
• Six-lessons of 30-45 minute duration.
• Set of duplicates of exercises ready for photocopying.
• Safety messages integrated in subject material (language, mathematics, science, social studies,etc.)
• Teachers can value the contribution to their students.
ThinkFirst for Kids was designed to be presented through the introduction o f six specific modules:
1. Introduction of the brain and spinal cord
2. Motor vehicle safety
3. Bicycle safety
4. Water safety
5. Recreational safety
6. Weapons safety
An animated video, "Street Smart: A ThinkFirst Adventure ", is used to introduce the program. The Street
Smart character was created to serve as sort o f a “super-hero” figure who is a normal kid who engages in all
kinds of recreational activities but never gets hurt because he practices safety strategies. His mission is to share
these strategies with other children to prevent them from sustaining brain and spinal cord injuries and to teach
them to ThinkFirst.
Reproduced with permission of the copyright owner. Further reproduction prohibited without permission.

APPENDIX E
THINK FIRST FOR KIDS: PRE- AND POSTTEST,
GRADES 1 THROUGH 3
159
Reproduced with permission of the copyright owner. Further reproduction prohibited without permission.

• I have gone to this school for grades (check) 1 2 3 4
160
Date o f Post-Test: Grade:'_______ _School District:. School:_______Teacher:____C: A:
• Gender: (circle one)
l*M ale 2* Female
• Race/Ethnicity: (circle one)1 = Caucasian 2s* African American3= Hispanic 4“ Filipino5= American Indian 6* Asian7= Pacific Islander 8* Other
Grade 1: Pre-Test
Teacher Directions: Please read the directions, ask the questions, and assist the students in identifying their choices and marking their answers.
Student Directions: Circle the sag best answer to the following questions.1.1 have a bicycle that I ride.
a. Nob. Yes
2. I have a bicycle helmet to use.a. Nob. Yes
3. When you ride a bicycle, how often do you wear a helmet?a. Alwaysb. Sometimesc. Never
1
Reproduced with permission of the copyright owner. Further reproduction prohibited without permission.
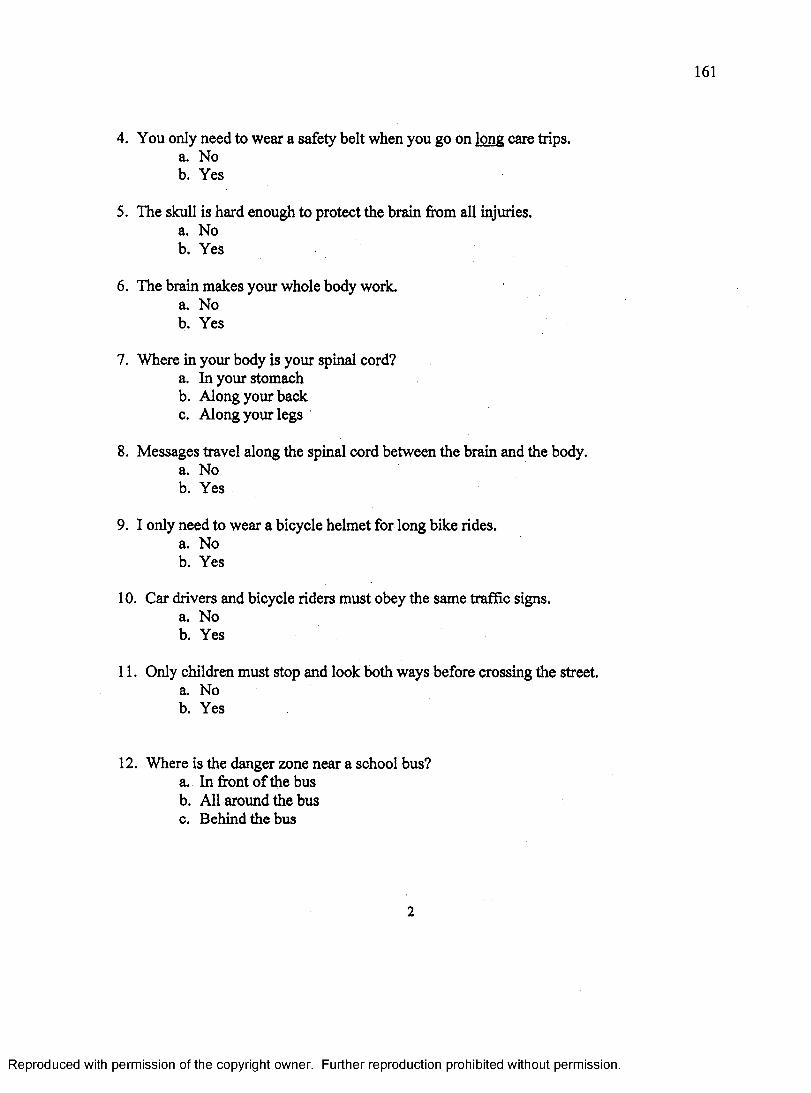
4. You only need to wear a safety belt when you go on long care trips.a. Nob. Yes
5. The skull is hard enough to protect the brain from all injuries.a. Nob. Yes
6. The brain makes your whole body work.a. Nob. Yes
7. Where in your body is your spinal cord?a. In your stomachb. Along your backc. Along your legs
8. Messages travel along the spinal cord between the brain and the body.a. Nob. Yes
9. I only need to wear a bicycle helmet for long bike rides.a. Nob. Yes
10. Car drivers and bicycle riders must obey the same traffic signs.a. Nob. Yes
11. Only children must stop and look both ways before crossing the street.a. Nob. Yes
12. Where is the danger zone near a school bus?a. In front o f the busb. All around the busc. Behind the bus
2
Reproduced with permission of the copyright owner. Further reproduction prohibited without permission.

162
13. On a bicycle, you should ride:a. Facing the cars coming toward youb. Going in the same direction as die carsc. Going in either direction
14. If you know how to swim, you may swim alone as long as you are careful.a. Nob. Yes
15. M atching: Draw a line from each picture o f Street Smart or his friends to the goodwater safety habit they are using.
a. The first time you go into the water, go feet first.
Always swim with a buddy.
C. Hands over your head when diving.
16. Diving into an above ground swimming pool is safe.a. Nob. Yes
3
Reproduced with permission of the copyright owner. Further reproduction prohibited without permission.

163
17. If I see a gun in my home or anywhere else I should:a. Pick up the gun and put it away.b. Not touch and call an adult.c. Pick up the gun and unload it.
18. Before I slide down on a slide on a playground, I should:a. Wave to my friends so they can see meb. Wait until the person ahead o f me is down and offc. Jump up and down on the top of the slide.
19. M atching: Draw a line from each picture o f Street Smart or his friends to the goodsafety habit they are using.
a. Wear a seat belt.
b. Look before crossing the street.
c. Both hands on the handlebars.
Wear a helmet and pads.
Reproduced with permission of the copyright owner. Further reproduction prohibited without permission.
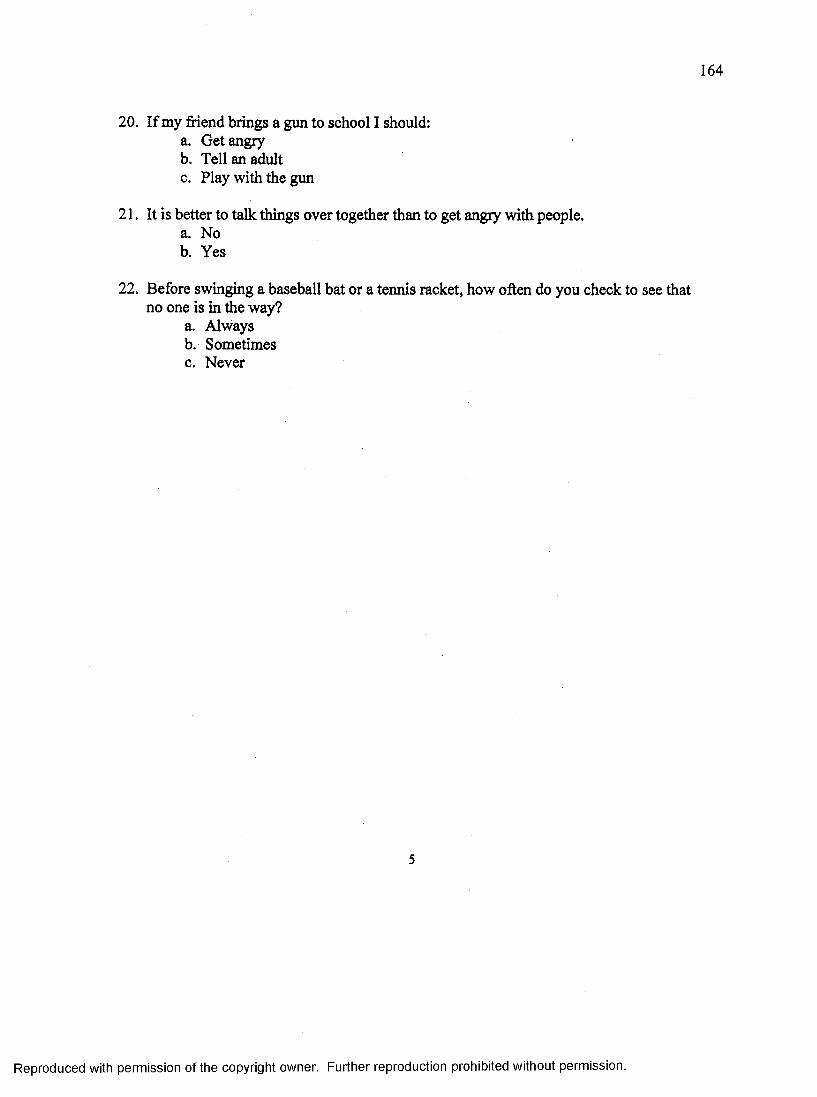
164
20. If my friend brings a gun to school I should:a. Get angryb. Tell an adultc. Play with the gun
21. It is better to talk things over together than to get angry with people.a. Nob. Yes
22. Before swinging a baseball bat or a tennis racket, how often do you check to see that no one is in die way?
a. Alwaysb. Sometimesc. Never
Reproduced with permission of the copyright owner. Further reproduction prohibited without permission.

165
Date o f Post-Test:Grade:_______School District: _School:________Teacher:_______C: A:
• I have gone to this school for grades (check)1 2 3 4
• Gender: (circle one)
1= Male 2* Female
• Race/Ethnicity: (circle one)1 = Caucasian 2*= African American3= Hispanic 4* Filipino5= American Indian 6* Asian7= Pacific Islander 8* Other
Grade 1: Post-Test
Teacher Directions; Please read the directions, ask the questions, and assist the students in identifying their choices and marking their answers.
Student Directions: Circle the one best answer to the following questions.
1 .1 have a bicycle that I ride.a. Nob. Yes
2. I have a bicycle helmet to use.a. Nob. Yes
3. When you ride a bicycle, how often do you wear a helmet?a. Alwaysb. Sometimesc. Never
1
Reproduced with permission of the copyright owner. Further reproduction prohibited without permission.
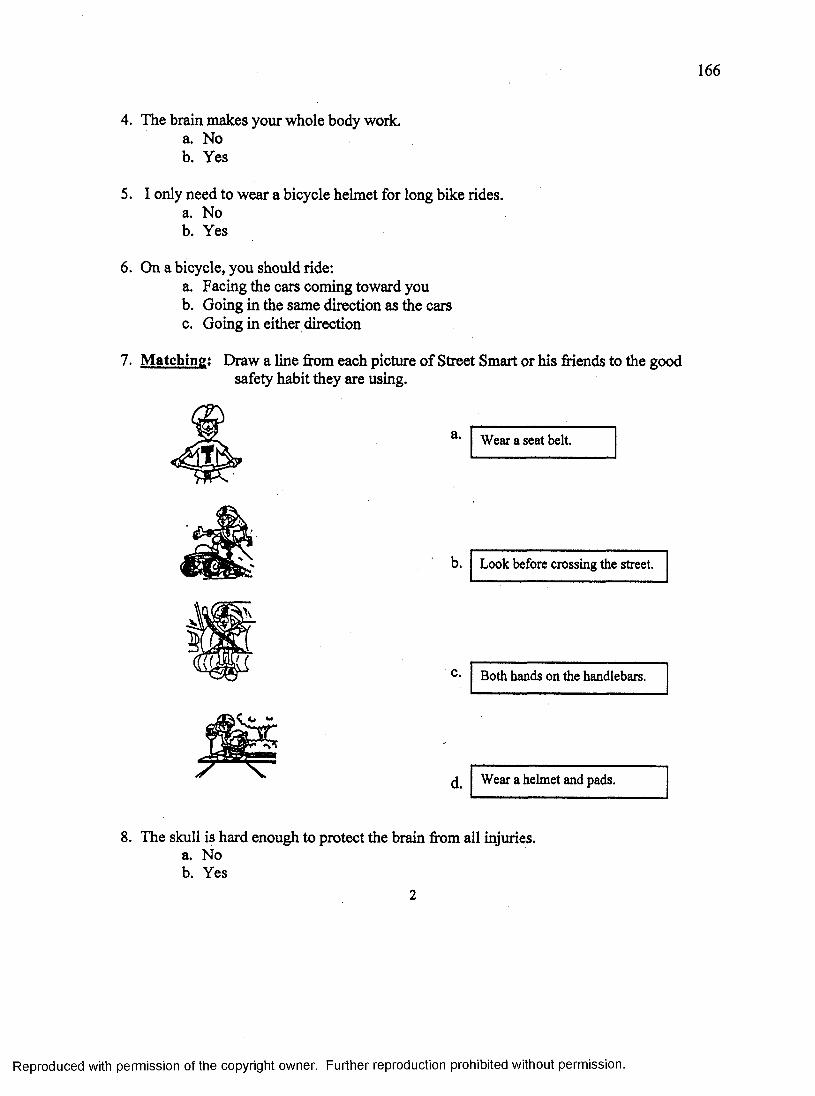
166
4. The brain makes your whole body work.a. Nob. Yes
5. I only need to wear a bicycle helmet for long bike rides.a. Nob. Yes
6. On a bicycle, you should ride:a. Facing the cars coming toward youb. Going in the same direction as die carsc. Going in either direction
7. Matching: Draw a line from each picture o f Street Smart or his friends to the goodsafety habit they are using.
a. Wear a seat belt.
b. Look before crossing the street.
Both hands on the handlebars.
d. Wear a helmet and pads.
8. The skull is hard enough to protect the brain from all injuries.a. Nob. Yes
Reproduced with permission of the copyright owner. Further reproduction prohibited without permission.

167
9. Only children must stop and look both ways before crossing the street.a. Nob. Yes
10. If I see a gun in my home or anywhere else I should:a. Pick up the gun and put it away.b. Not touch and call an adult.c. Pick up the gun and unload it.
11. You only need to wear a safety belt when you go on long car trips.a. Noa. Yes
12. Matching; Draw a line from each picture o f Street Smart or his friends to the goodwater safety habit they are using.
The first time you go into the water, go feet first.
Always swim with a buddy.
C. Hands over your head when diving.
13. Messages travel along the spinal cord between the brain and the body.a. Nob. Yes
3
Reproduced with permission of the copyright owner. Further reproduction prohibited without permission.
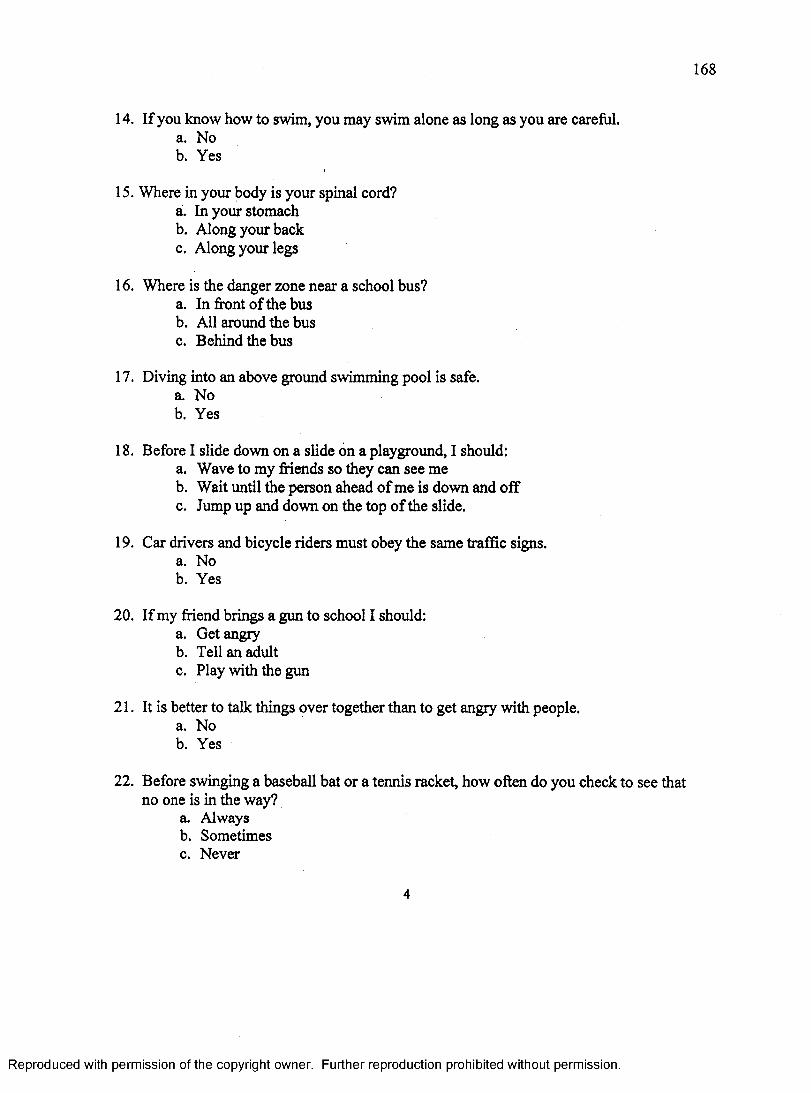
168
14. If you know how to swim, you may swim alone as long as you are careful.a. Nob. Yes
15. Where in your body is your spinal cord?a. In your stomachb. Along your backc. Along your legs
16. Where is the danger zone near a school bus?a. In front of the busb. All around the busc. Behind the bus
17. Diving into an above ground swimming pool is safe.a. Nob. Yes
18. Before I slide down on a slide on a playground, I should:a. Wave to my friends so they can see meb. Wait until die person ahead o f me is down and offc. Jump up and down on the top of the slide.
19. Car drivers and bicycle riders must obey the same traffic signs.a. Nob. Yes
20. If my friend brings a gun to school I should:a. Get angryb. Tell an adultc. Play with the gun
21. It is better to talk things over together than to get angry with people.a. Nob. Yes
22. Before swinging a baseball bat or a tennis racket, how often do you check to see that no one is in the way?
a. Alwaysb. Sometimesc. Never
4
Reproduced with permission of the copyright owner. Further reproduction prohibited without permission.
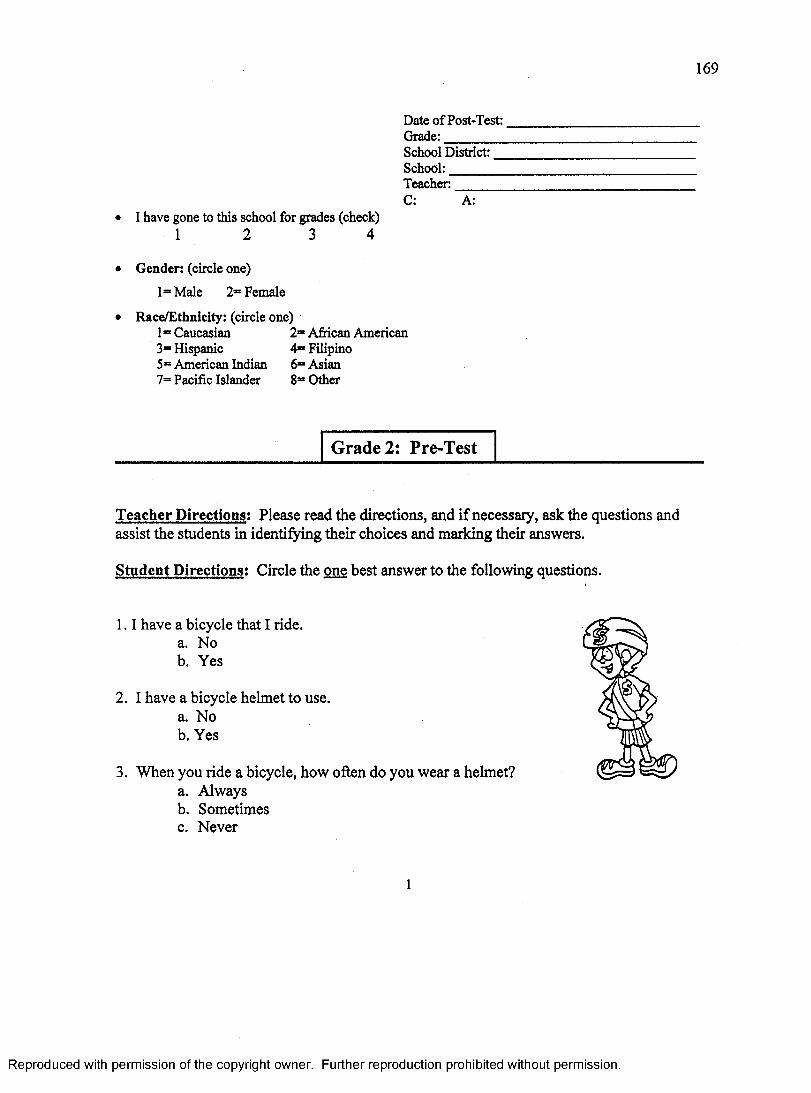
169
I have gone to this school for grades (check) 1 2 3 4
Date of Post-Test: Grade:______School District:, School:______Teacher:___C: A:
• Gender: (circle one)l=Male 2= Female
• Race/Ethnicity: (circle one)1=Caucasian 2= African American3“ Hispanic 4“ Filipino5= American Indian 6= Asian7= Pacific Islander 8= Other
Grade 2: Pre-Test
Teacher Directions: Please read the directions, and if necessary, ask the questions and assist the students in identifying their choices and marking their answers.
Student Directions: Circle the one best answer to the following questions.
1 .1 have a bicycle that I ride.a. Nob. Yes
2. I have a bicycle helmet to use.a. Nob. Yes
3. When you ride a bicycle, how often do you wear a helmet?a. Alwaysb. Sometimesc. Never
Reproduced with permission of the copyright owner. Further reproduction prohibited without permission.
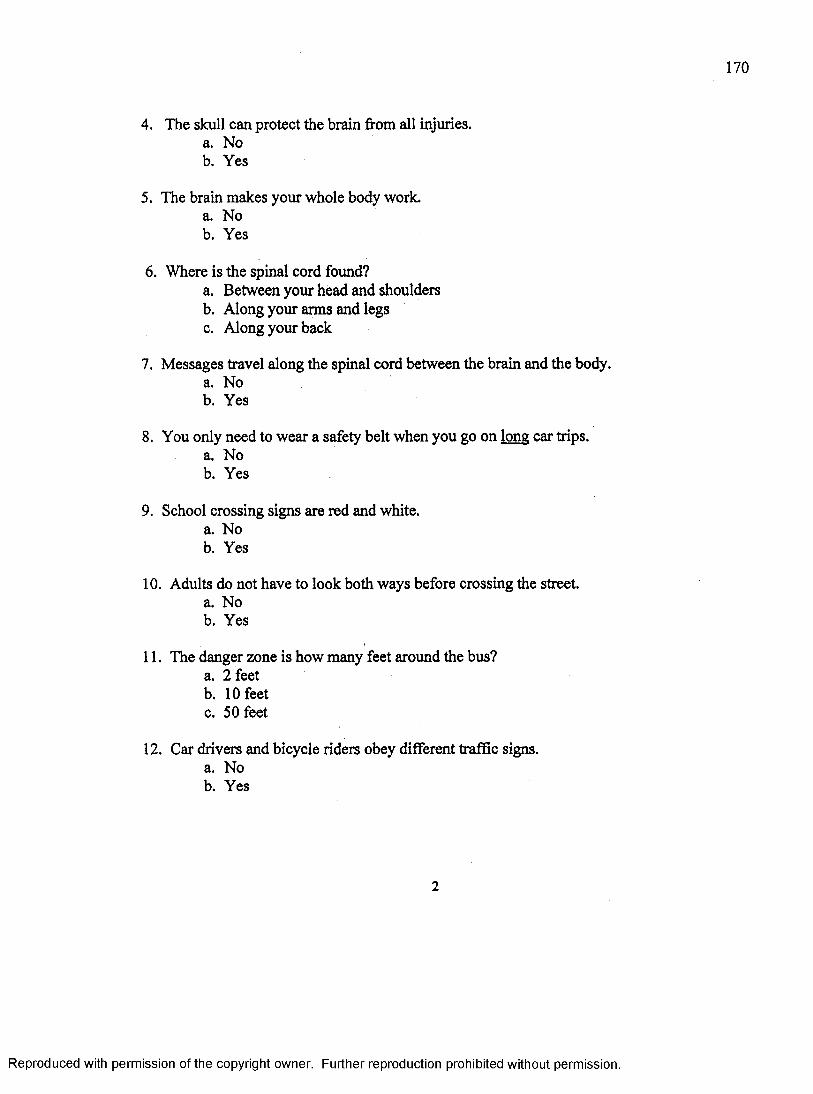
4. The skull can protect the brain from all injuries.a. Nob. Yes
5. The brain makes your whole body work.a. Nob. Yes
6. Where is the spinal cord found?a. Between your head and shouldersb. Along your arms and legsc. Along your back
7. Messages travel along the spinal cord between the brain and the body.a. Nob. Yes
8. You only need to wear a safety belt when you go on long car trips.a. Nob. Yes
9. School crossing signs are red and white.a. Nob. Yes
10. Adults do not have to look both ways before crossing the street.a. Nob. Yes
11. The danger zone is how many feet around the bus?a. 2 feetb. 10 feetc. 50 feet
12. Car drivers and bicycle riders obey different traffic signs.a. Nob. Yes
2
Reproduced with permission of the copyright owner. Further reproduction prohibited without permission.

13. On a bicycle, you should ride:a. Going in either directionb. Going in the same direction as trafficc. Facing the traffic coming toward you
14. When is it best to wear a bicycle helmet?a. When riding on mountain trailsb. When riding on the highwayc. Whenever you ride your biked. When riding in your neighborhood
15. If you know how to swim, you may swim alone as long as you are careful.a. Nob. Yes
16. Diving into an above ground swimming pool is not safe.a. Nob. Yes
17. How deep does the water need to be to dive from the side of a pool?a. Just over your headb. 5 feetc. 9 feet
18. If I see a gun in my home or anywhere else I should:a. Pick up the gun and put it away.b. Not touch the gun and call an adult.c. Pick up the gun and unload it.
19. Ammunition for a gun should be:a. Stored and locked in a separate place from the gunb. Stored close to the gunc. Stored in the gun
Reproduced with permission of the copyright owner. Further reproduction prohibited without permission.

172
20. Circle all of the pictures o f Street Smart or his friends using good safety habits.
21. Talking over differences with other people and solving problems is better than getting angry and acting out.
a. Nob. Yes
22. When I play near the road and a ball goes into the street, I run out into the street to get the ball:
a. Neverb. Sometimesc. Always
23. How often should kids wear pads and helmets when they play baseball?a. Alwaysb. Sometimesc. Never
24. How often do you do tricks, like hanging by your legs or one arm on the monkey bars?
a. Neverb. Sometimesc. Always
4
Reproduced with permission of the copyright owner. Further reproduction prohibited without permission.

173
Date of Post-Test: Grade:School District:.School:______Teacher:_____C: A:
I have gone to this school for grades (check) 1 2 3 4
Gender: (circle one)1= Male 2= Female
Race/Ethnicity: (circle one)1 = Caucasian 2= African American3= Hispanic 4” Filipino5= American Indian 6* Asian7“ Pacific Islander 8“ Other
Grade 2: Post-Test
Teacher Directions: Please read the directions, and if necessary, ask the questions and assist the students in identifying their choices and marking their answers.
Student Directions; Circle the one best answer to the following questions.
1 .1 have a bicycle that I ride.a. Nob. Yes
2. I have a bicycle helmet to use.a. Nob. Yes
3. When you ride a bicycle, how often do you wear a helmet?a. Alwaysb. Sometimesc. Never
1
Reproduced with permission of the copyright owner. Further reproduction prohibited without permission.

4. On a bicycle, you should ride:a. Going in either directionb. Going in the same direction as trafficc. Facing the traffic coming toward you
5. If I see a gun in my home or anywhere else I should:a. Pick up the gun and put it away.b. Not touch the gun and call an adult.c. Pick up the gun and unload
6. Where is the spinal cord found?a. Between your head and shouldersb. Along your arms and legsc. Along your back
7. The skull can protect the brain from all injuries.a. Nob. Yes
8. Ammunition for a gun should be:a. Stored and locked in a separate place from the gunb. Stored close to the gunc. Stored in the gun
9. Diving into an above ground swimming pool is not safe.a. Nob. Yes
10. Circle all of the pictures of Street Smart or his friends using good safety habits
2
Reproduced with permission of the copyright owner. Further reproduction prohibited without permission.

11. When is it best to wear a bicycle helmet?a. When riding on mountain trailsb. When riding on the highwayc. Whenever you ride your biked. When riding in your neighborhood
12. You only need to wear a safety belt when you go on lone car trips.a. Nob. Yes
13. How deep does the water need to be to dive from the side of a pool?a. Just over your headb. 5 feetc. 9 feet
14. School crossing signs are red and white.a. Nob. Yes
15. Messages travel along the spinal cord between the brain and the body.a. Nob. Yes
16. Car drivers and bicycle riders obey different traffic signs.a. Nob. Yes
17. The brain makes your whole body work.a. Nob. Yes
18. If you know how to swim, you may swim alone as long as you are careful.a. Nob. Yes
19. The danger zone is how many feet around the bus?a. 2 feetb. 10 feetc. 50 feet
3
Reproduced with permission of the copyright owner. Further reproduction prohibited without permission.

176
20 . Adults do not have to look both ways before crossing the street.a. Nob. Yes
2 1. Talking over differences with other people and solving problems is better than getting angry and acting out.
a. Nob. Yes
22 . When I play near the road and a ball goes into the street, I run out into the street to get the ball:
a. Neverb. Sometimesc. Always
2 3 . How often should kids wear pads and helmets when they play baseball?a. Alwaysb. Sometimesc. Never
24 . How often do you do tricks, like hanging by your legs or one arm on the monkey bars?
a. Neverb. Sometimesc. Always
4
Reproduced with permission of the copyright owner. Further reproduction prohibited without permission.

177
Date o f Post-Test:Grade:_________School District: _School:________Teacher:_______C: A:
• I have gone to this school for grades (check)1 2 3 4
• Gender: (circle one)
l=M ale 2= Female
• Race/Ethnicity: (circle one)1 = Caucasian 2= African American3= Hispanic 4s* Filipino5“ American Indian 6* Asian7= Pacific Islander 8* Other
Grade 3: Pre-Test
Teacher Directions: Please read the directions for each section, and if necessary, ask the questions and assist the students in identifying their choices and marking their answers.
Student Directions: Circle the one best answer to the following questions.
1 .1 have a bicycle that I ride.a. Nob. Yes
2. I have a bicycle helmet to use.a. Nob. Yes
3. When you ride a bicycle, how often do you wear a helmet?a. Alwaysb. Sometimesc. Never
1
Reproduced with permission of the copyright owner. Further reproduction prohibited without permission.

4. The brain cannot be injured unless the skull is broken.a. Nob. Yes •
5. The cerebrum helps people walk straight and keep their balance.a. Noa. Yes
6. Which part o f the brain helps you think and remember?a. Cerebrumb. Cerebellumc. Brainstem
7. Which part of the brain keeps your lungs breathing while you sleep?a. Cerebrumb. Cerebellumc. Brainstem
8. You only need to wear a safety belt when you go on lone car trips.a. Nob. Yes
9. The danger zone is how many feet around the bus?a. 2 feetb. 10 feetc. 50 feet
10. School crossing signs are red and white.a. Nob. Yes
11. When is it best to wear a bicycle helmet?a. When riding on mountain trailsb. When riding on the highwayc. Whenever you ride your biked. When riding in your neighborhood
Reproduced with permission of the copyright owner. Further reproduction prohibited without permission.

179
12. Car drivers and bicycle riders obey different traffic signs.a. Nob. Yes
13. On a bicycle, you should ride:a. Going in either directionb. Going in the same direction as trafficc. Facing the traffic coming toward you
14. Ammunition for a gun should be:a. Stored and locked in a separate place from the gunb. Stored close to the gunc. Stored in the gun
15. If I see a gun at home or anywhere I should: (number the choices in the order that they should happen)
Leave the area Stop Tell an adult Don’t touch the gun
16. Many children are killed or wounded by guns in their own homes.a. Nob. Yes
17. If you know how to swim, you may swim alone as long as you are careful.a. Nob. Yes
18. Diving into an above ground swimming pool is unsafe.a. Nob. Yes
19. How deep does the water in a pool need to be in order to dive off a diving board?a. Just over your headb. 7 feetc. 12 feet
3
Reproduced with permission of the copyright owner. Further reproduction prohibited without permission.

180
20. Children riding in a boat with an adult do not need to wear a life jacket.a. Nob. Yes
21. If a person is having trouble in the water, I should:a. Call to an adult and throw a line or a preserverb. Jump in and swim to the person
22. The brain and spinal cord are connected.a. Nob. Yes
23. If I see a knife in the kitchen or anywhere, I should pick it up and put it away.a. Nob. Yes
24. When playing at the playground, kids should always be courteous and wait their turn.a. Nob. Yes
25. When someone you are playing with wants to dp something different than you do, you should try to listen to each others ideas.
a. Nob. Yes
26. How often do you do tricks, like hanging by your legs or one arm on the monkey bars?
a. Neverb. Sometimesc. Always
4
Reproduced with permission of the copyright owner. Further reproduction prohibited without permission.

181
Date o f Post-Test:Grade:_________School District: _School: _______Teacher:_______C: A:
• I have gone to this school for grades (check)1 2 3 4
• Gender: (circle one)
1= Male 2= Female
• Race/Ethnicity: (circle one)1 = Caucasian 2= African American3= Hispanic 4“ Filipino5* American Indian 6* Asian7= Pacific Islander 8= Other
Grade 3: Post-Test
Teacher Directions: Please read the directions for each section, and if necessary, ask the questions and assist the students in identifying their choices and marking their answers.
Student Directions: Circle the one best answer to the following questions.
1 .1 have a bicycle that I ride.a. Nob. Yes
2. I have a bicycle helmet to use.a. Nob. Yes
3. When you ride a bicycle, how often do you wear a helmet?a. Alwaysb. Sometimesc. Never
1
Reproduced with permission of the copyright owner. Further reproduction prohibited without permission.
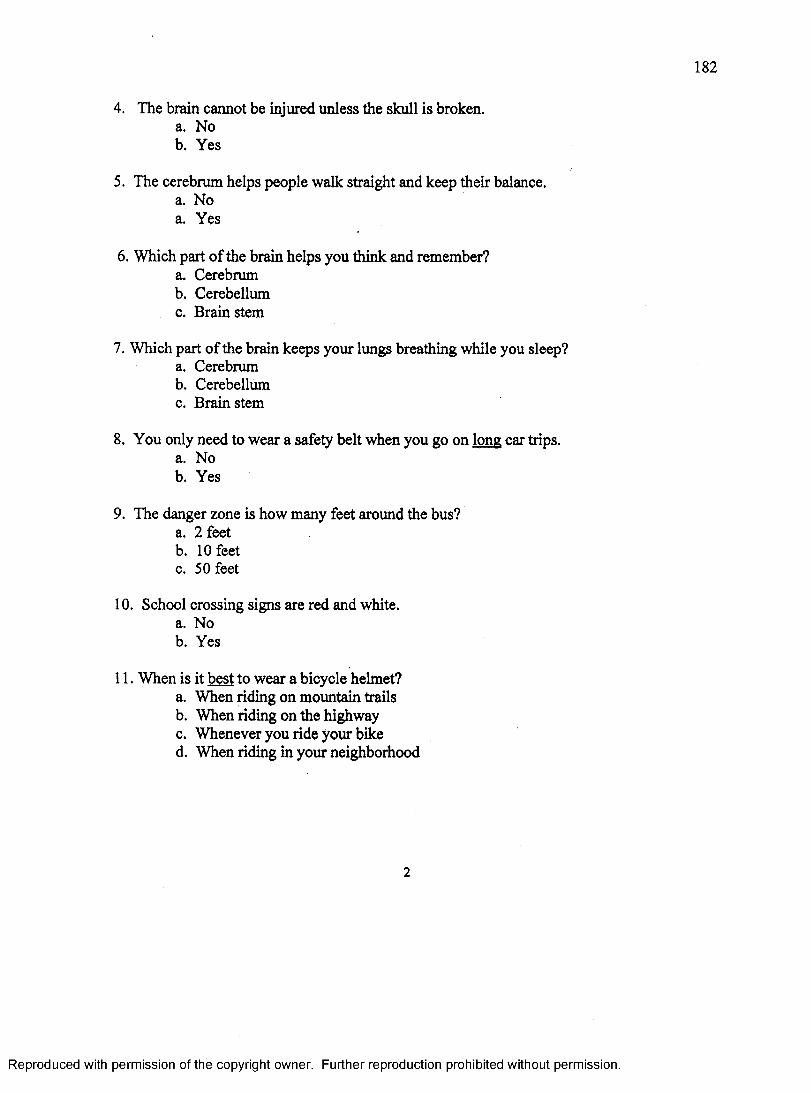
4. The brain cannot be injured unless the skull is broken.a. Nob. Yes
5. The cerebrum helps people walk straight and keep their balance.a. Noa. Yes
6. Which part of the brain helps you think and remember?a. Cerebrumb. Cerebellumc. Brainstem
7. Which part of the brain keeps your lungs breathing while you sleep?a. Cerebrumb. Cerebellumc. Brain stem
8. You only need to wear a safety belt when you go on long car trips.a. Nob. Yes
9. The danger zone is how many feet around the bus?a. 2 feetb. 10 feetc. 50 feet
10. School crossing signs are red and white.a. Nob. Yes
11. When is it best to wear a bicycle helmet?a. When riding on mountain trailsb. When riding on the highwayc. Whenever you ride your biked. When riding in your neighborhood
Reproduced with permission of the copyright owner. Further reproduction prohibited without permission.

183
12. Car drivers and bicycle riders obey different traffic signs.a. Nob. Yes
13. On a bicycle, you should ride:a. Going in either directionb. Going in the same direction as trafficc. Facing the traffic coming toward you
14. Ammunition for a gun should be:a. Stored and locked in a separate place from the gunb. Stored close to the gunc. Stored in the gun
15. If I see a gun at home or anywhere I should: (number the choices in the order that they should happen)
Leave the area Stop Tell an adult Don’t touch the gun
16. Many children are killed or wounded by guns in their own homes.a. Nob. Yes
17. If you know how to swim, you may swim alone as long as you are careful.a. Nob. Yes
18. Diving into an above ground swimming pool is unsafe.a. Nob. Yes
19. How deep does the water in a pool need to be in order to dive off a diving board?a. Just over your headb. 7 feetc. 12 feet
3
Reproduced with permission of the copyright owner. Further reproduction prohibited without permission.

184
20. Children riding in a boat with an adult do not need to wear a life jacket.a. Nob. Yes
21. If a person is having trouble in the water, I should:a. Call to an adult and throw a line or a preserverb. Jump in and swim to the person
22. The brain and spinal cord are connected.a. Nob. Yes
23. If I see a knife in the kitchen or anywhere, I should pick it up and put it away.a. Nob. Yes
24. When playing at the playground, kids should always be courteous and wait their turn.a. Nob. Yes
25. When someone you are playing with wants to do something different than you do, you should hy to listen to each others ideas.
a. Nob. Yes
26. How often do you do tricks, like hanging by your legs or one arm on the monkey bars?
a. Neverb. Sometimesc. Always
4
Reproduced with permission of the copyright owner. Further reproduction prohibited without permission.

APPENDIX F
THINK FIRST FOR KIDS:
FOURTH GRADE SURVEY
185
Reproduced with permission of the copyright owner. Further reproduction prohibited without permission.

186
Date o f Post-Test: Grade:_________School District:,School:_______Teacher:______C: A:
• I have gone to this school for grades (check)1 2 3 4
• Gender: (circle one)
1= Male 2“ Female
• Race/Ethnicity: (circle one)1= Caucasian 2* African American3= Hispanic 4“ Filipino5= American Indian 6” Asian7= Pacific Islander 8“ Other
Grade 4: Survey
Teacher Directions: Please read the directions for each section, and if necessary, ask the questions and assist the students in identifying their choices and marking their answers.
Student Directions: Circle the one best answer to the following questions.
1 .1 have a bicycle that I ride.a. Nob. Yes
2. I have a bicycle helmet to use.a. Nob. Yes
3. When you ride a bicycle, how often do you wear a helmet?a. Alwaysb. Sometimesc. Never
Reproduced with permission of the copyright owner. Further reproduction prohibited without permission.

187
4. The brain cannot be injured unless the skull is broken.a. Nob. Yes
5. The cerebrum helps people walk straight and keep their balance.a. Noa. Yes
6. Which part of the brain helps you think and remember?a. Cerebrumb. Cerebellumc. Brainstem
7. Which part of the brain keeps your lungs breathing while you sleep?a. Cerebrumb. Cerebellumc. Brainstem
8. You only need to wear a safety belt when you go on long car trips.a. Nob. Yes
9. The danger zone is how many feet around the bus?a. 2 feetb. 10 feetc. 50 feet
10. School crossing signs are red and white.a. Nob. Yes
11. When is it best to wear a bicycle helmet?a. When riding on mountain trailsb. When riding on the highwayc. Whenever you ride your biked. When riding in your neighborhood
Reproduced with permission of the copyright owner. Further reproduction prohibited without permission.

188
12. Car drivers and bicycle riders obey different traffic signs.a. Nob. Yes
13. On a bicycle, you should ride:a. Going in either directionb. Going in the same direction as trafficc. Facing the traffic coming toward you
14. Ammunition for a gun should be:a. Stored and locked in a separate place from the gunb. Stored close to the gunc. Stored in the gun
15. If I see a gun at home or anywhere I should: (number the choices in the order that they should happen)
Leave the area Stop Tell an adult Don’t touch the gun
16. Many children are killed or wounded by guns in their own homes.a. Nob. Yes
17. If you know how to swim, you may swim alone as long as you are careful.a. Nob. Yes
18. Diving into an above ground swimming pool is unsafe.a. Nob. Yes
19. How deep does the water in a pool need to be in order to dive off a diving board?a. Just over your headb. 7 feetc. 12 feet
3
Reproduced with permission of the copyright owner. Further reproduction prohibited without permission.

189
20. Children riding in a boat with an adult do not need to wear a life jacket.a. Nob. Yes
21. If a person is having trouble in the water, I should:a. Call to an adult and throw a line or a preserverb. Jump in and swim to the person
22. The brain and spinal cord are connected.a. Nob. Yes
23. If I see a knife in the kitchen or anywhere, I should pick it up and put it away.a. Nob. Yes
24. When playing at the playground, kids should always be courteous and wait their turn.a. Nob. Yes
25. When someone you are playing with wants to do something different than you do, you should try to listen to each others ideas.
a. Nob. Yes
26. How often do you do tricks, like hanging by your legs or one arm on the monkey bars?
a. Neverb. Sometimesc. Always
4
Reproduced with permission of the copyright owner. Further reproduction prohibited without permission.

APPENDIX G
PERMISSION LETTER FROM
SHARP REHABILITATION SERVICES
190
Reproduced with permission of the copyright owner. Further reproduction prohibited without permission.

191
SHARP R E H A B I L I T A T I O N S E R V I C E S
February 21, 2005
Dear IRB Representative:
On behalf-of'Sharp Rehabilitation Services, I give my permission forDdrothy Zirkle to use the existing Think First for Kids Longitudinal database for analysis'pqrposes toward her doctoral dissertation,'
The data was collected in 2000-2002 , and\the information is recorded in such a manner that subjects cannot be identified directly or through Identifiers linked to the subjects.
Sincerely,
Clair Jones System Director
L e a d i n g t h e W a y - F r o m P o s s i b i l i t y T o A b i l i t y
S h a r p C a b r l l l o C a m p u s • S h a r p C h u l a V l a t a M s d l c a l C s n t s r • S h a r p C o r o n a d o H o s p i t a l a n d M o t i o n C a n t a r
Q r o s a m o n t H o s p i t a l a n d B r i a r P a t c h C a m p u s • S h a r p M a m o r l a l H o s p i t a l
Reproduced with permission of the copyright owner. Further reproduction prohibited without permission.
APPENDIX I
CHARACTERISTICS OF COHORT A
196
Reproduced with permission of the copyright owner. Further reproduction prohibited without permission.
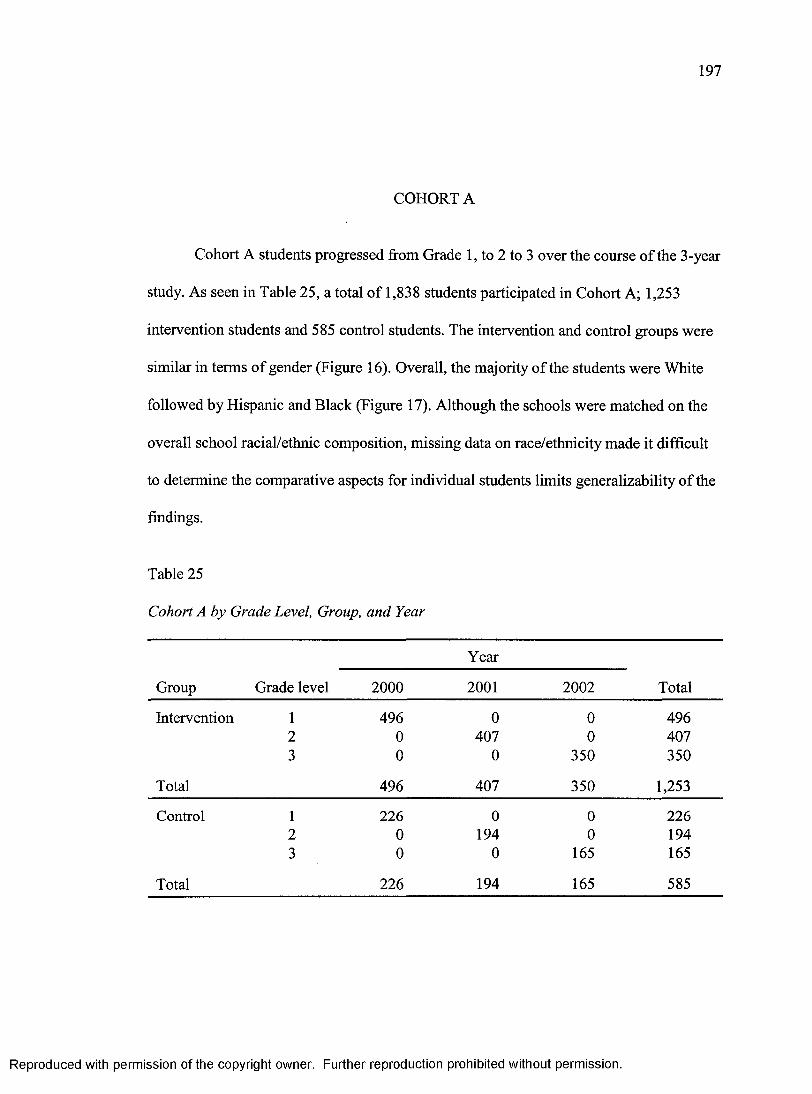
197
COHORT A
Cohort A students progressed from Grade 1, to 2 to 3 over the course of the 3-year
study. As seen in Table 25, a total of 1,838 students participated in Cohort A; 1,253
intervention students and 585 control students. The intervention and control groups were
similar in terms of gender (Figure 16). Overall, the majority of the students were White
followed by Hispanic and Black (Figure 17). Although the schools were matched on the
overall school racial/ethnic composition, missing data on race/ethnicity made it difficult
to determine the comparative aspects for individual students limits generalizability of the
findings.
Table 25
Cohort A by Grade Level, Group, and Year
Group
Year
TotalGrade level 2000 2001 2002
Intervention 1 496 0 0 4962 0 407 0 4073 0 0 350 350
Total 496 407 350 1,253
Control 1 226 0 0 2262 0 194 0 1943 0 0 165 165
Total 226 194 165 585
Reproduced with permission of the copyright owner. Further reproduction prohibited without permission.

198
Cohort A Gender by Group TFFK Survey, 2000-2002
Unknown3%
Unknown2%
Intervention Control
Figure 16. Cohort A gender by group: TFFK Survey, 2000-2002.
Cohort A Race/Ethnicity by Group TFFK Survey, 2000-2002
11 White H Black B Hispanic □ Asian/Other
456
</>o5 200 -
100 -
14i
_______Intervention
283
119106
Control
Group
Figure 17. Cohort A race/ethnicity by group: TFFK Survey, 2000-2002.
Reproduced with permission of the copyright owner. Further reproduction prohibited without permission.

APPENDIX J
CHARACTERISTICS OF COHORT B
199
Reproduced with permission of the copyright owner. Further reproduction prohibited without permission.

200
COHORT B
Cohort B students progressed from Grade 2 to 3 to 4 over the course of the 3-year
study. As seen in Table 26 and Figure 18, a total of 1,706 students participated in Cohort
B; 1,149 intervention students and 557 control students. The intervention and control
school students were similar in terms of gender; about 44% female and 51% male, and
4% unknown (Figure 18). The majority of students were White, followed by Hispanic and
Black (Figure 19). Although the schools were matched on the overall school racial/ethnic
composition, missing data on race/ethnicity made it difficult to determine the comparative
aspects for individual students.
Table 26
Cohort B by Grade Level, Group, and Year
Group
Year
TotalGrade level 2000 2001 2002
Intervention 2 479 0 0 4793 0 350 0 3504 0 0 320 320
Total 479 350 320 1,149
Control 2 208 0 0 2083 0 161 0 1614 0 0 188 188
Total 208 161 188 557
Reproduced with permission of the copyright owner. Further reproduction prohibited without permission.

Cohort B Gender by GroupTFFK Survey, 2000-2002
Unknown Unknown
Intervention Control
Figure 18. Cohort B gender by group: TFFK Survey, 2000-2002.
Cohort B Race/Ethnicity by Group TFFK Survey, 2000-2002
□ W hite SlBiack S Hispanic II Asian/Other500
400 -
*ca>■§ 300 ■
<0tfr-o
Jg 200 •
106
raMi1111111
Intervention
241
111
43
Control
Group
Figure 19. Cohort B race/ethnicity by group: TFFK Survey, 2000-2002.
Reproduced with permission of the copyright owner. Further reproduction prohibited without permission.

APPENDIX K
CHARACTERISTICS OF COHORT C
202
Reproduced with permission of the copyright owner. Further reproduction prohibited without permission.

203
COHORT C
Cohort C students progressed from Grade 3 to 4 over the course of the 3-year
study. As seen in Table 27, a total of 648 students participated in Cohort C; 234 action
students and 414 control students. The intervention and control school students were
similar in terms of gender; about half male and female (Figure 20). The students were
mainly White and Hispanic, followed by Black (Figure 21). Although the schools were
matched on the overall school racial/ethnic composition, missing data on race/ethnicity
made it difficult to determine the comparative aspects for individual students.
Table 27
Cohort C by Grade Level, Group, and Year
Group Grade level 2000
Year
2001 Total
Intervention 3 124 0 1244 0 110 110
Total 124 110 234
Control 3 229 0 2294 0 185 185
Total 229 185 414
Reproduced with permission of the copyright owner. Further reproduction prohibited without permission.

Cohort C Gender by GroupTFFK Survey, 2000-2002
Intervention Control
Figure 20. Cohort C gender by group: TFFK Survey, 2000-2002.
Cohort C Race/Ethnicity by Group TFFK Survey, 2000-2002
500 ■□ White ■ Black ■ Hispanic CO Asian/Other
400 ■
£c0*5 300 -
oO 200
197
100 -112 103
3 16 !I----------- 1
75 66 76
Intervention
GroupControl
Figure 21. Cohort C race/ethnicity by group: TFFK Survey, 2000-2002.
Reproduced with permission of the copyright owner. Further reproduction prohibited without permission.


![Untitled 2 [] · 8/21/2014 · Wthen most Americans think of Cancun, they think spring break, Señor Frog's, bikini-clad girls and board short- wearing college kids with strings](https://img.dokumen.tips/doc/110x75/5fa0459e6ecb671b2b76a99e/untitled-2-8212014-wthen-most-americans-think-of-cancun-they-think-spring.jpg)