Embed Size (px)
Citation preview
Things I’ve Tried to MeasureThings I’ve Tried to Measure
Remo OstiniRemo OstiniHealthy Communities Research Centre
University of QueenslandAustralia
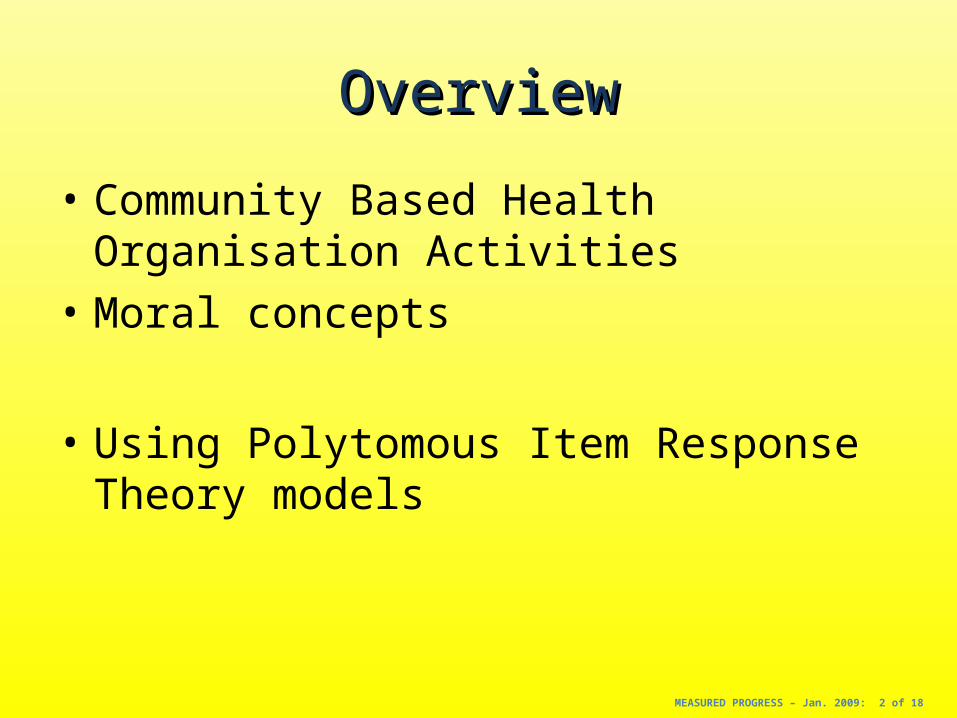
OverviewOverview
• Community Based Health Organisation Activities
• Moral concepts
• Using Polytomous Item Response Theory models
MEASURED PROGRESS – Jan. 2009: 2 of 18
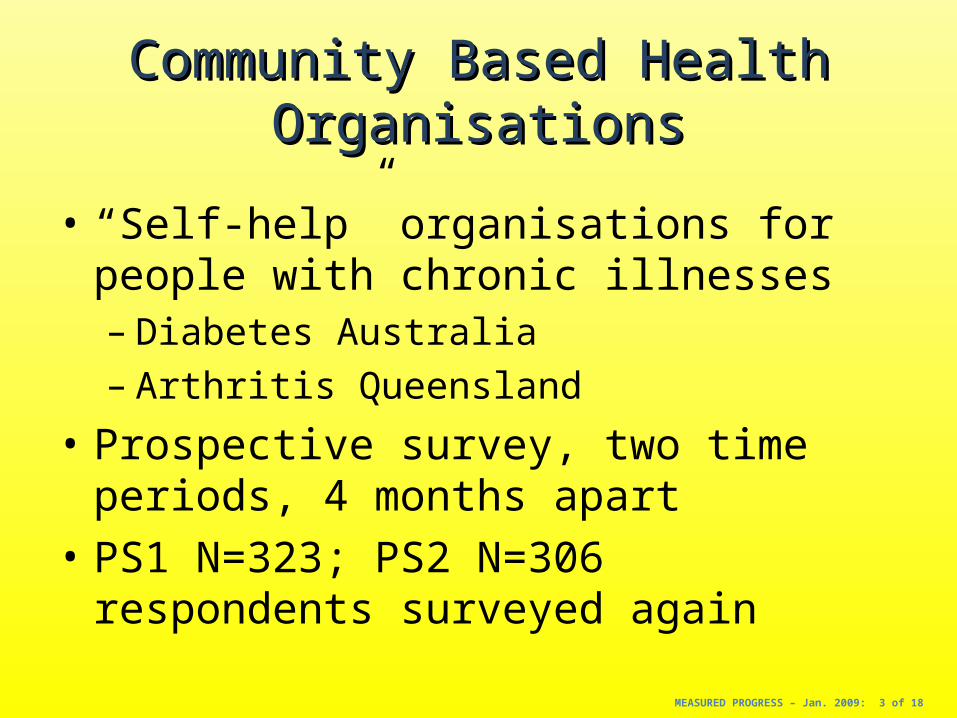
Community Based Health Community Based Health OrganisationsOrganisations
• “Self-help” organisations for people with chronic illnesses– Diabetes Australia– Arthritis Queensland
• Prospective survey, two time periods, 4 months apart
• PS1 N=323; PS2 N=306 respondents surveyed again
MEASURED PROGRESS – Jan. 2009: 3 of 18
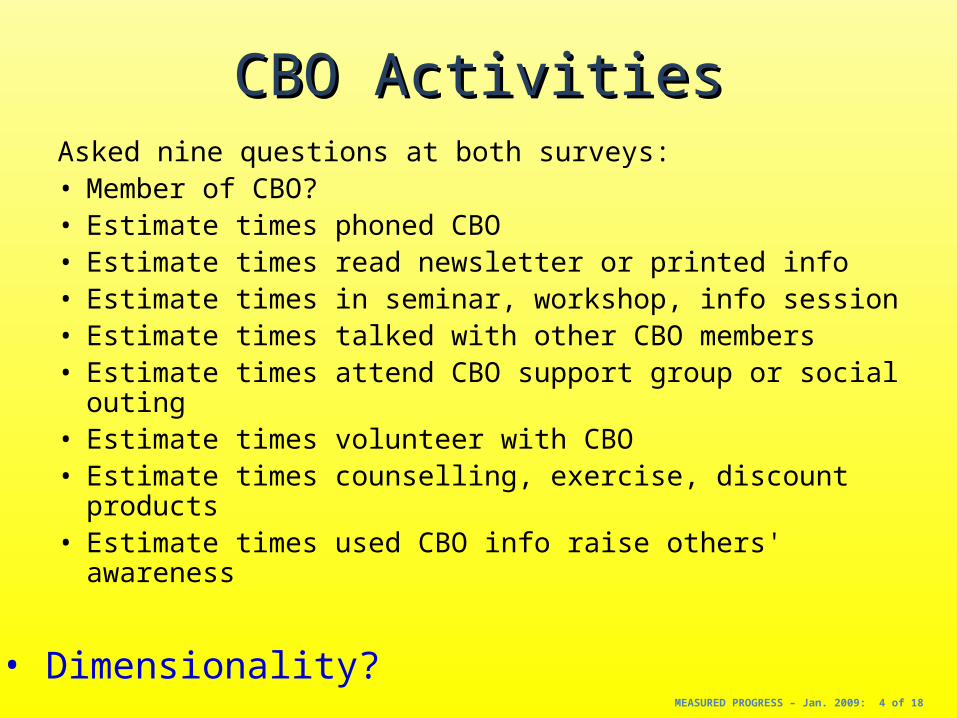
Asked nine questions at both surveys:• Member of CBO?• Estimate times phoned CBO• Estimate times read newsletter or printed info• Estimate times in seminar, workshop, info session• Estimate times talked with other CBO members• Estimate times attend CBO support group or social
outing• Estimate times volunteer with CBO• Estimate times counselling, exercise, discount products• Estimate times used CBO info raise others' awareness
CBO ActivitiesCBO Activities
MEASURED PROGRESS – Jan. 2009: 4 of 18
• Dimensionality?
CBO ActivitiesCBO Activities
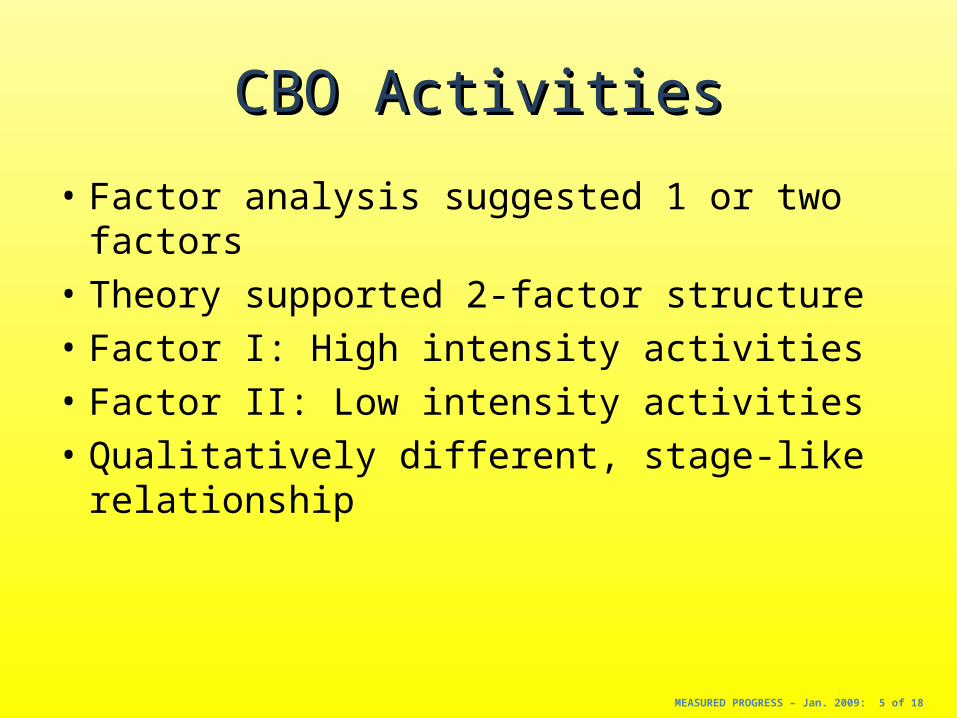
• Factor analysis suggested 1 or two factors• Theory supported 2-factor structure• Factor I: High intensity activities• Factor II: Low intensity activities• Qualitatively different, stage-like relationship
MEASURED PROGRESS – Jan. 2009: 5 of 18
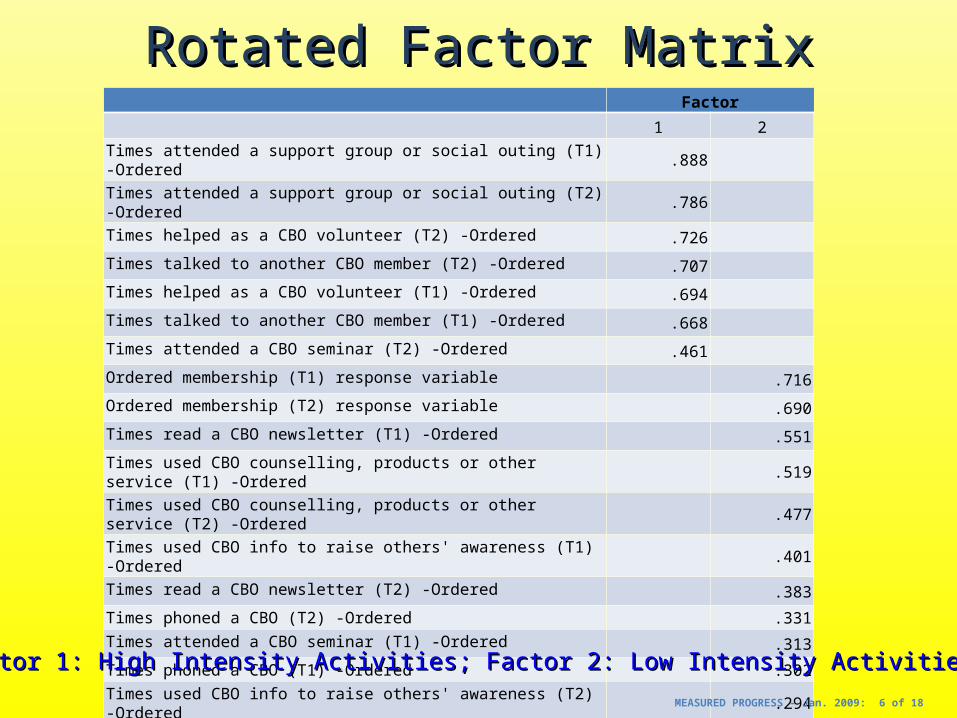
Rotated Factor MatrixRotated Factor MatrixFactor
1 2
Times attended a support group or social outing (T1) -Ordered .888
Times attended a support group or social outing (T2) -Ordered .786
Times helped as a CBO volunteer (T2) -Ordered .726
Times talked to another CBO member (T2) -Ordered .707
Times helped as a CBO volunteer (T1) -Ordered .694
Times talked to another CBO member (T1) -Ordered .668
Times attended a CBO seminar (T2) -Ordered .461
Ordered membership (T1) response variable .716
Ordered membership (T2) response variable .690
Times read a CBO newsletter (T1) -Ordered .551
Times used CBO counselling, products or other service (T1) -Ordered .519
Times used CBO counselling, products or other service (T2) -Ordered .477
Times used CBO info to raise others' awareness (T1) -Ordered .401
Times read a CBO newsletter (T2) -Ordered .383
Times phoned a CBO (T2) -Ordered .331
Times attended a CBO seminar (T1) -Ordered .313
Times phoned a CBO (T1) -Ordered .302
Times used CBO info to raise others' awareness (T2) -Ordered .294
Factor 1: High Intensity Activities; Factor 2: Low Intensity ActivitiesFactor 1: High Intensity Activities; Factor 2: Low Intensity Activities
MEASURED PROGRESS – Jan. 2009: 6 of 18
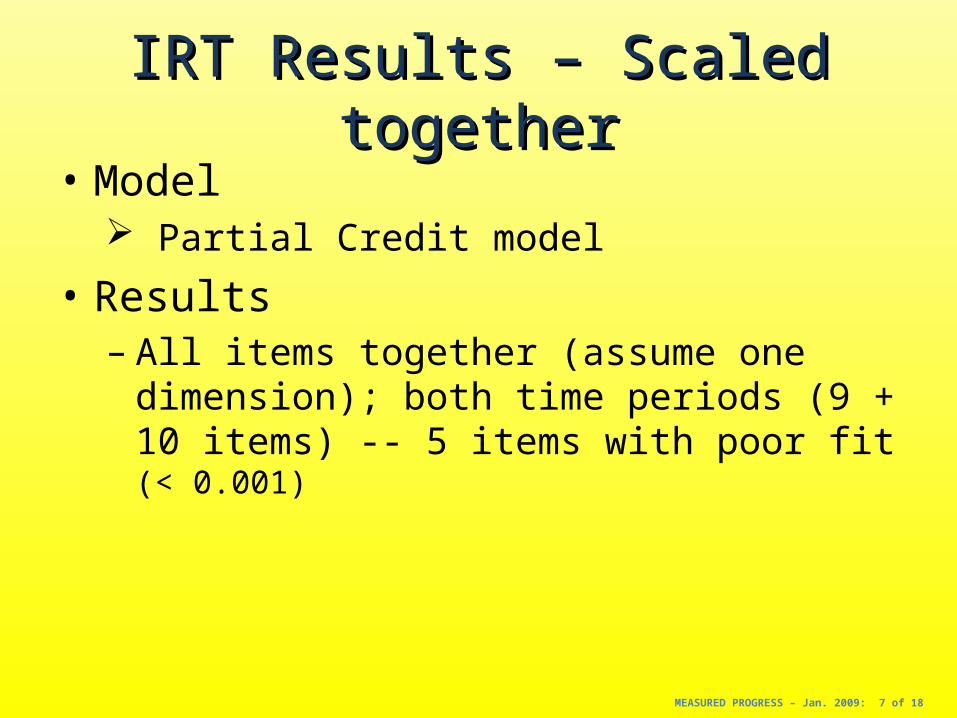
• Model Partial Credit model
• Results– All items together (assume one dimension); both
time periods (9 + 10 items) -- 5 items with poor fit (< 0.001)
IRT Results – Scaled togetherIRT Results – Scaled together
MEASURED PROGRESS – Jan. 2009: 7 of 18
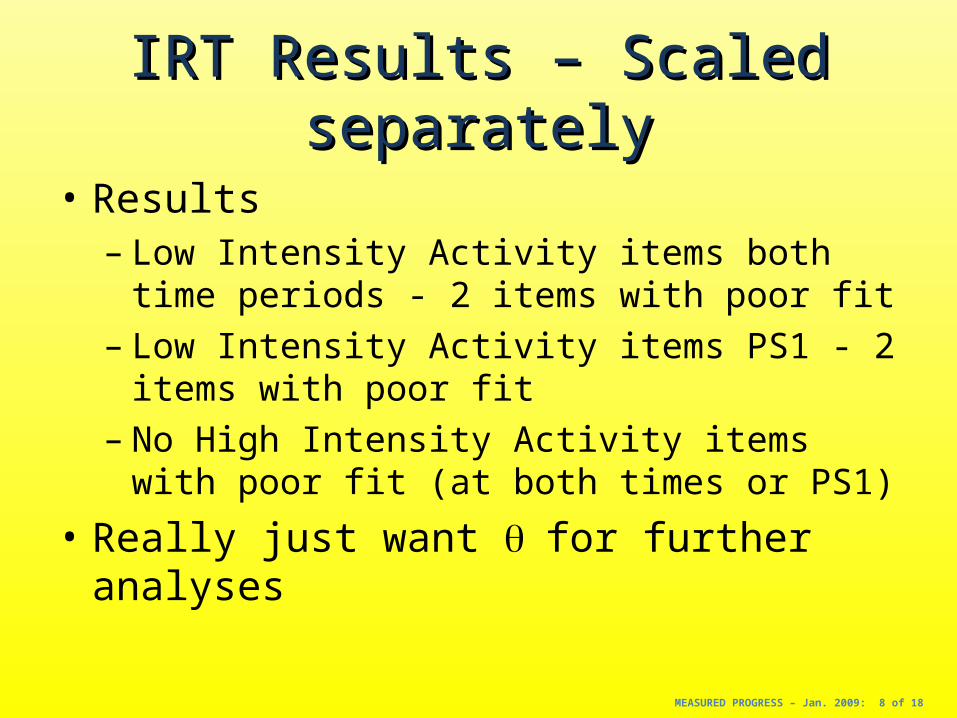
• Results– Low Intensity Activity items both time periods - 2
items with poor fit– Low Intensity Activity items PS1 - 2 items with
poor fit– No High Intensity Activity items with poor fit (at
both times or PS1)
• Really just want for further analyses
IRT Results – Scaled separatelyIRT Results – Scaled separately
MEASURED PROGRESS – Jan. 2009: 8 of 18
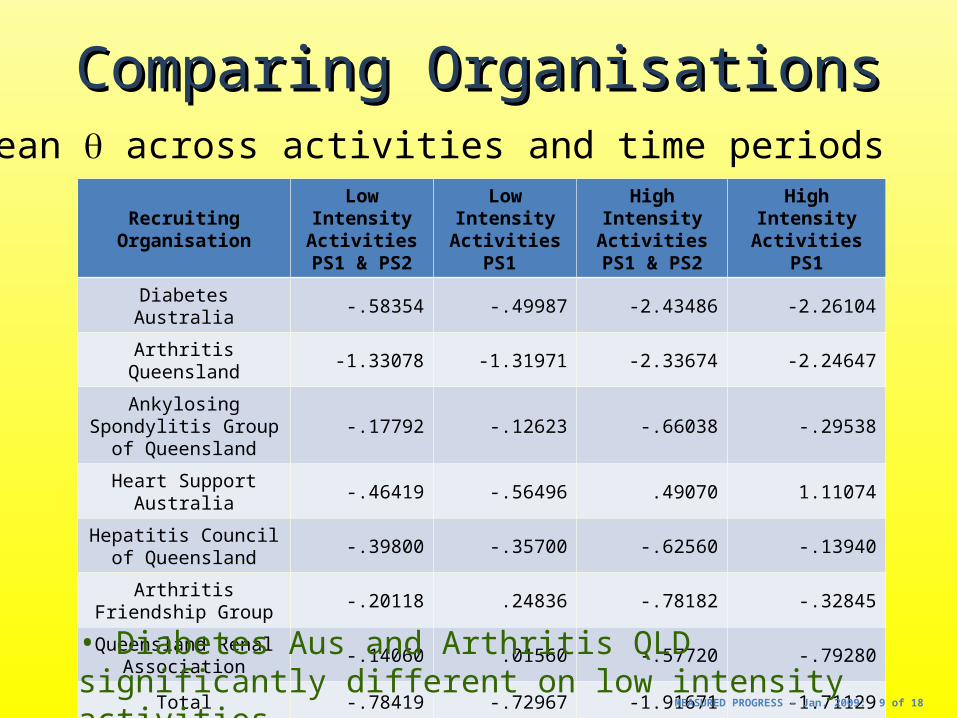
Comparing OrganisationsComparing Organisations
Recruiting Organisation
Low Intensity Activities PS1
& PS2
Low Intensity Activities PS1
High Intensity Activities PS1
& PS2
High Intensity Activities PS1
Diabetes Australia -.58354 -.49987 -2.43486 -2.26104
Arthritis Queensland -1.33078 -1.31971 -2.33674 -2.24647
Ankylosing Spondylitis Group of Queensland
-.17792 -.12623 -.66038 -.29538
Heart Support Australia
-.46419 -.56496 .49070 1.11074
Hepatitis Council of Queensland
-.39800 -.35700 -.62560 -.13940
Arthritis Friendship Group
-.20118 .24836 -.78182 -.32845
Queensland Renal Association
-.14060 .01560 -.57720 -.79280
Total -.78419 -.72967 -1.91671 -1.71129
• Diabetes Aus and Arthritis QLD significantly different on low intensity activities
MEASURED PROGRESS – Jan. 2009: 9 of 18
• Mean across activities and time periods
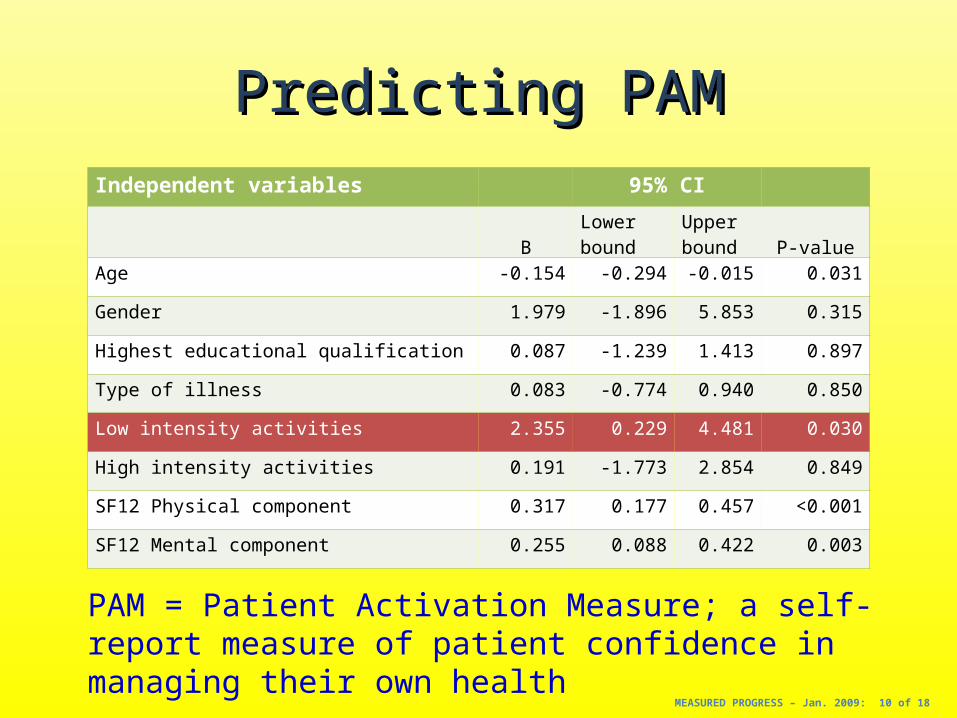
Predicting PAMPredicting PAMIndependent variables 95% CI
BLower bound
Upper bound P-value
Age -0.154 -0.294 -0.015 0.031
Gender 1.979 -1.896 5.853 0.315
Highest educational qualification 0.087 -1.239 1.413 0.897
Type of illness 0.083 -0.774 0.940 0.850
Low intensity activities 2.355 0.229 4.481 0.030
High intensity activities 0.191 -1.773 2.854 0.849
SF12 Physical component 0.317 0.177 0.457 <0.001
SF12 Mental component 0.255 0.088 0.422 0.003
PAM = Patient Activation Measure; a self-report measure of patient confidence in managing their own health
MEASURED PROGRESS – Jan. 2009: 10 of 18
Moral ConceptualizationMoral Conceptualization
• Initial question: What is morality?
• Lots of answers. Who knows? Everyone!
• So ask them…
MEASURED PROGRESS – Jan. 2009: 11 of 18
Moral Conceptualization - BackgroundMoral Conceptualization - Background
• 20 Interviews – talkative people• 1269 statements – some (~ half) redundant• 4 × 150 item questionnaires - MCS
5-point Likert scale (1 – Nothing like what you think; 5 – Exactly what you think)
MEASURED PROGRESS – Jan. 2009: 12 of 18
Moral Conceptualization - BackgroundMoral Conceptualization - Background
• Example statements:– Caring about others is the dominant feature of a
good person– Everyone is born good– Evil does exist and people can do it– The boundaries between right and wrong are
defined by social custom• What aspects of morality does the
questionnaires cover?
MEASURED PROGRESS – Jan. 2009: 13 of 18
Moral Conceptualization Moral Conceptualization Structural AnalysisStructural Analysis
• Data Screening – bound to be noise• Four linear analyses:
– Principal Components Analysis– Factor Analysis– Multidimensional Scaling– Cluster Analysis
• One non-linear analysis• Mokken scaling analysis – nonparametric IRT with h test for dimensionality assessment
• 10-14 factors MEASURED PROGRESS – Jan. 2009: 14 of 18
Moral Conceptualization Moral Conceptualization Structural AnalysisStructural Analysis
• Types of Factors– Life definition– Relativism– Responsibility– Socially defined morality– Conscience– Tolerance
MEASURED PROGRESS – Jan. 2009: 15 of 18
Moral Conceptualization Moral Conceptualization Item AnalysisItem Analysis
• Item-total correlations < 0.20• Serious skew (some items still useful?)
IRT for Item analysis• Partial Credit Model• Reversed boundaries
Evidence of a problem?• Item model fit
p <0.001• Too soon for information?
MEASURED PROGRESS – Jan. 2009: 16 of 18
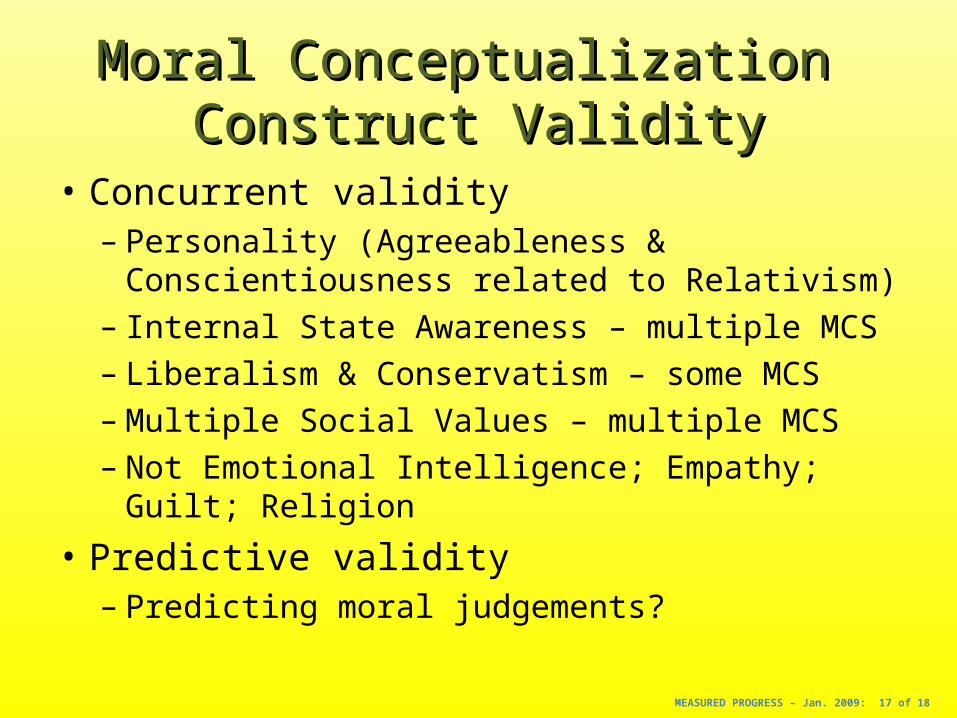
Moral Conceptualization Moral Conceptualization Construct ValidityConstruct Validity
• Concurrent validity– Personality (Agreeableness & Conscientiousness
related to Relativism)– Internal State Awareness – multiple MCS– Liberalism & Conservatism – some MCS– Multiple Social Values – multiple MCS– Not Emotional Intelligence; Empathy; Guilt; Religion
• Predictive validity– Predicting moral judgements?
MEASURED PROGRESS – Jan. 2009: 17 of 18
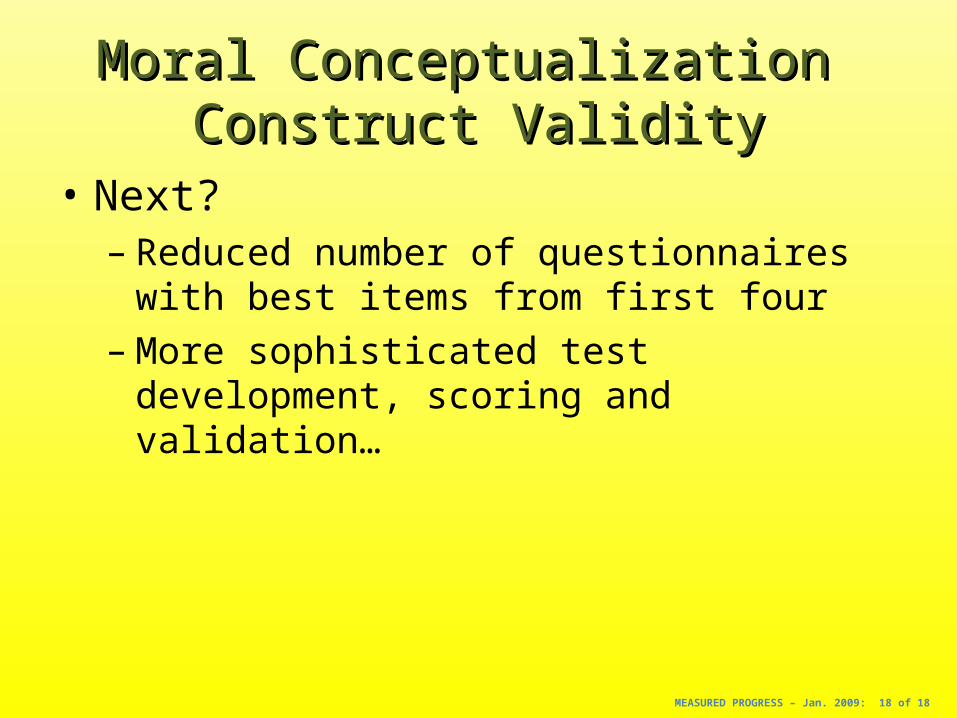
Moral Conceptualization Moral Conceptualization Construct ValidityConstruct Validity
• Next?– Reduced number of questionnaires with best
items from first four– More sophisticated test development, scoring and
validation…
MEASURED PROGRESS – Jan. 2009: 18 of 18