Embed Size (px)
Citation preview
Title: Thin-layer chromatographic quantification of magnolol and honokiol in dietary supplements and selected biological properties of these preparations
Author: Eliza Łata, Agnieszka Fulczyk, Péter G. Ott, Teresa Kowalska, Mieczysław Sajewicz, Ágnes M. Móricz
Citation style: Łata Eliza, Fulczyk Agnieszka, Ott Péter G., Kowalska Teresa, Sajewicz Mieczysław, Móricz Ágnes M. (2020). Thin-layer chromatographic quantification of magnolol and honokiol in dietary supplements and selected biological properties of these preparations. “Journal of Chromatography A” (Vol. 1625 (2020), Art. No. 461230), doi 10.1016/j.chroma.2020.461230
brought to you by COREView metadata, citation and similar papers at core.ac.uk
Journal of Chromatography A 1625 (2020) 461230
Contents lists available at ScienceDirect
Journal of Chromatography A
journal homepage: www.elsevier.com/locate/chroma
Thin-layer chromatographic quantification of magnolol and honokiol
in dietary supplements and selected biological properties of these
preparations
Eliza Łata
a , Agnieszka Fulczyk
a , Péter G. Ott b , Teresa Kowalska
a , Mieczysław Sajewicz
a , Ágnes M. Móricz
b , ∗
a Institute of Chemistry, University of Silesia, 9 Szkolna Street, 40-006 Katowice, Poland b Department of Pathophysiology, Plant Protection Institute, Centre for Agricultural Research, Herman O. Str. 15, 1022 Budapest, Hungary
a r t i c l e i n f o
Article history:
Received 31 March 2020
Revised 8 May 2020
Accepted 9 May 2020
Available online 30 May 2020
Keywords:
Quantitative thin-layer
chromatography-densitometry
High-performance thin-layer
chromatography–effect-directed analysis
Two-dimensional-high-performance
thin-layer chromatography-mass
spectrometry
Stability assessment
Neolignans of magnolia bark
Dietary supplements
a b s t r a c t
Two isomeric biphenyl neolignans, magnolol and honokiol, are considered as constituents responsible for
the healing effect of magnolia bark, a traditional Oriental medicine. To survey the increasing number
of dietary supplements that contain magnolia bark or its extract, an affordable quantitative thin-layer
chromatography (TLC) – densitometry method was developed. The methanol extracts were analyzed on
the silica gel plates after manual sample application using n -hexane – ethyl acetate – ethanol (16:3:1,
v/v/v) as a mobile phase. For quantitation, the chromatograms were scanned in the absorbance mode
at the wavelength λ = 290 nm. The limits of detection and quantitation were 90 and 280 ng/zone for
magnolol and 70 and 200 ng/zone for honokiol, respectively. None of the two targeted neolignans were
detected in two of the six analyzed supplements. In the other four samples, the measured amounts were
between 0.95-114.69 mg g −1 for magnolol and 4.88-84.86 mg g −1 for honokiol. Moreover, separations of
these two neolignans on the TLC and high-performance TLC (HPTLC) layers were compared and HPTLC
was combined with antioxidant (DPPH) and antibacterial ( Bacillus subtilis and Aliivibrio fischeri ) assays
and mass spectrometry (MS), using the elution-based interface. Both magnolol and honokiol exhibited
effects in all bioactivity assays. The HPTLC-MS tests confirmed purity of neolignan zones in the extracts
of dietary supplements and supported tentative identification of the alkaloid piperine and the isoflavone
daidzein as additional bioactive components of the investigated dietary supplements. Using the same
mobile phase in the orthogonal directions 2D-HPTLC-MS experiments proved degradation, i.e., instability
of magnolol and honokiol on the silica gel adsorbent.
© 2020 The Author(s). Published by Elsevier B.V.
This is an open access article under the CC BY license. ( http://creativecommons.org/licenses/by/4.0/ )
1
a
(
v
a
g
L
s
g
t
S
t
p
e
r
m
a
s
i
m
m
h
0
. Introduction
Concentrated sources of nutrients (i.e., vitamins and minerals)
nd other compounds with a nutritional or physiological effect
e.g., different amino acids, fatty acids, fibers of herbal origin, and
arious plant and herbal extracts) marketed in a “dose” form (e.g.,
s pills, tablets, capsules, or liquids in measured doses) are re-
arded as dietary supplements. According to the EU General Food
aw Regulation (EC) No 178/2002 [1] , dietary supplements are con-
idered as foodstuffs and therefore they are regulated as foods. The
uidelines for handling and control of dietary supplements (other
han vitamins and minerals) are provided by the European Food
∗ Corresponding author.
E-mail address: [email protected] (Á.M. Móricz).
i
c
f
ttps://doi.org/10.1016/j.chroma.2020.461230
021-9673/© 2020 The Author(s). Published by Elsevier B.V. This is an open access article
afety Authority (EFSA) in the form of regulations. Special impor-
ance is attributed to the safety of ingredients used in dietary sup-
lements of botanical origin [2] and to defining the highest lev-
ls of chronic daily intake of a nutrient that is not likely to pose a
isk of adverse health effects to humans. Observations of the global
arket of dietary supplements prove that it expands vigorously,
nd at the same time, that respective legal regulations are less
trict than those regarding pharmaceuticals. Consequently, there
s an acute need for accurate, robust and cost-friendly analytical
ethods to control individual components of the dietary supple-
ent formulations.
With growing awareness in the West of the considerable heal-
ng potential of the traditional medicines of the Far East Asian
ountries, herbal preparations and individual compounds isolated
rom Oriental plant material are introduced into various different
under the CC BY license. ( http://creativecommons.org/licenses/by/4.0/ )
2 E. Łata, A. Fulczyk and P.G. Ott et al. / Journal of Chromatography A 1625 (2020) 461230
3
r
d
r
s
t
c
t
h
t
[
p
c
f
a
p
o
i
b
t
o
n
n
w
t
(
p
2
2
i
s
s
v
l
p
d
S
c
a
w
p
p
1
i
H
r
w
t
t
k
B
2
s
p
i
s
dietary supplements (and also into cosmetics) as active compo-
nents. Two isomeric biphenyl neolignans, magnolol and honokiol,
obtained from the bark of different magnolia species, are gaining
popularity as active components of dietary supplements, with two
representatives of the Magnoliaceae family, i.e., Magnolia officinalis
Rehder & E.H. Wilson (in Chinese Hou-po) and Magnolia obovata
Thunb, being most often used for this purpose [3] . Bark and flow-
ers of the magnolia species, either alone, or in combination with
other herbal preparations, have been present in traditional Chinese,
Japanese and Korean medicines for thousands of years, basically as
remedies for gastrointestinal disorders, anxiety and allergies [ 4 , 5 ],
but also for their sedative, antioxidant, anti-inflammatory, antibi-
otic, and antispastic effects [6] . It is generally accepted that mag-
nolol and honokiol are the most active compounds of the magnolia
bark extracts (often referred to as MBE), and for this reason, bio-
logical and pharmacological investigations of MBE most often focus
on these two neolignans [ 5 , 7-9 ]. Toxicological studies performed
for different quantitative compositions of MBE using different an-
imal models confirmed its safety for oral consumption. Moreover,
a no-observable-effect level (NOEL) for the concentrated MBE was
established at > 240 mg MBE per kg body weight per day, as an
oral dose [10] .
Magnolol and honokiol exert a well documented antioxidant ac-
tivity. The most complex physicochemical study focusing on the ki-
netics and mechanism of the reaction of magnolol and honokiol
with peroxyl radicals has been presented in a paper [11] . Antiox-
idant activity of these two neolignans was compared with that of
the other structurally related phenolics and the analyses suggested
the role of allyl groups in the effect due to the ability to scavenge
O 2 − or the hydroxyl radical [12] . Antidiabetic and antioxidant ac-
tivity of honokiol was proven in vivo on rats with diabetes induced
by the high-fat diet and streptozotocin [13] . Magnolol and hon-
okiol additionally displayed significant antifungal activity against
various human pathogenic fungi, e.g. Aspergillus niger, Cryptococ-
cus neoformans , and Candida albicans [14] , and antibacterial effect
against e.g. Staphylococcus aureus , MRSA [15] , Propionibacterium ac-
nes and P. granulosum [16] , Actinobacillus actinomycetemcomitans,
Porphyromonas gingivalis, Prevotella intermedia, Micrococcus luteus ,
and Bacillus subtilis [17] . In a review paper [18] , providing 84 refer-
ences to the original research publications, an abundant overview
was made of the biological and physiological activities of magnolol.
Initially, thin-layer or column chromatographic separation of
the structurally similar magnolol and honokiol has been quite dif-
ficult [19-21] . The first report on the determination of these two
neolignans, with the aid of high-performance liquid chromatogra-
phy with photodiode array detection (HPLC-DAD), was published
in [22] , and a new HPLC-DAD method to quantify magnolol in
modern pharmaceutical formulations is given in [23] . Separation of
magnolol from its metabolites by means of liquid chromatography-
mass spectrometry (LC-MS) was reported in [24] and separation
and quantification of magnolol and honokiol contained in Mag-
noliae officinalis cortex by means of high-performance thin-layer
chromatography (HPTLC) was presented in [25] . The authors of the
latter study quantified honokiol and magnolol in the cortex sam-
ples, exploiting their antioxidant effects with use of an HPTLC-
DPPH
. (2,2-diphenyl-1-picrylhydrazyl radical) assay followed by
densitometric evaluation. Using of DPPH
. as a visualizing agent is
not recommended though, in view of an easily available direct de-
tection and quantification method by means of densitometry.
In paper [26] , the authors also used TLC to analyze magnolol
and honokiol extracted from the Magnolia officinalis cortex, but
again they did not evaluate their chromatograms by simple den-
sitometry. Instead, they visualized the chromatograms by spraying
them with the vanillin reagent followed by heating. Several reports
on applications of TLC to the analysis of magnolol and honokiol
from the different botanical sources are available in Chinese [27-
3] and for this reason, detailed procedures and discussion of the
esults obtained practically escape Western readers, except for raw
ata regarding stationary and mobile phase, and the retention pa-
ameter values. An additional drawback is that six out of these
even papers originate from the nineties of the past century and
hree of them [30-32] are almost thirty years old. Although in each
ase silica gel was reported as stationary phase, without an access
o full contents of these papers one cannot be sure, if the authors
ave worked with self-precoated chromatographic plates, or with
he commercial ones. In this sense, the results reported in papers
27-33] are practically irreproducible and therefore of lesser im-
ortance. Furthermore, in most of these methods the mobile phase
ontains benzene [ 27-28 , 30-33 ], which is carcinogenic and there-
ore not advised to use.
On the other hand, (HP)TLC is an affordable technique enabling
parallel analysis of a higher number of samples, without an ex-
ensive and complex sample preparation [34] . Moreover, as an
pen system, it is easily combined with bioactivity assays, provid-
ng the non-target screening and bio-profiling of the samples for
ioactive components [ 35 , 36 ].
On account of an increasing availability of commercial prepara-
ions which include magnolol and/or honokiol, and due to the lack
f accurate, robust and cost-friendly methods to quantify these two
eolignans, an effort was undertaken to develop a silica gel-based
ormal phase (NP) thin-layer chromatographic procedure that is
ell suited for the task. Moreover, the TLC method was transferred
o HPTLC that was combined with rapid bioautographic screening
effect-directed analysis, EDA) for the antibacterial and antioxidant
otential of the considered dietary supplements.
. Materials and methods
.1. Materials
All quantification studies were carried out with use of TLC sil-
ca gel 60 F 254 plates (20 cm × 20 cm, #105715; Merck, Darm-
tadt, Germany). Otherwise TLC (#105554) and HPTLC (#105547)
ilica gel 60 F 254 layers (Merck) were applied. Analytical grade sol-
ents for (HP)TLC were from PPH POCh (Gliwice, Poland) or Mo-
ar Chemicals (Budapest, Hungary). Gradient grade methanol was
urchased from Merck or Molar Chemicals. As phytochemical stan-
ards, magnolol and honokiol samples were used ( > 99 % purity;
elleck Chemicals, Houston, TX, USA). Eight samples of commer-
ial products, containing MBE or pure magnolol and/or honokiol
s declared by the manufacturers, were also used. Two samples
ere magnolol and honokiol mixtures in undeclared quantitative
roportions, kindly donated as commercial raw materials for the
reparation of dietary supplements and they were labeled as Mix
and Mix 2, respectively. The remaining six samples (presented
n Table 1 ) were dietary supplements purchased from Polish and
ungarian online shops or pharmacies. The Gram negative, natu-
ally luminescent marine bacterium Aliivibrio fischeri (DSM 7151)
as obtained from the Leibniz Institute DSMZ, German Collec-
ion of Microorganisms and Cell Cultures (Berlin, Germany) and
he Gram positive soil bacterium Bacillus subtilis strain F1276 was
indly provided by József Farkas (Central Food Research Institute,
udapest, Hungary).
.2. Preparation of standard solutions and extracts of dietary
upplements
Solutions of the magnolol and honokiol standards were pre-
ared in methanol at the concentration of 0.1 mg mL −1 , and stored
n a refrigerator at + 6 °C. Samples of Mix 1 and Mix 2 were dis-
olved in methanol at the concentration of 0.1 mg mL −1 . With the
E. Łata, A. Fulczyk and P.G. Ott et al. / Journal of Chromatography A 1625 (2020) 461230 3
Table 1
Basic characteristics of the six magnolol and/or honokiol containing dietary supplements (samples 1-6) (MBE: the magnolol bark extract as the source of the two investigated
neolignans).
Sample
no.
Source of main
component(s)
No. of
tablets/capsules/
liquid volume per
one package
Components of
interest
detected by
normal phase
TLC (SiO 2 )
Average
mass/volume per
one tablet/
capsule/vial (%
RSD) Declared quantity per one tablet/capsule/vial
Components with
undeclared quantities
MBE Magnolol Honokiol Other components
1 Magnolia bark
extract
30 tablets Magnolol,
honokiol
604 mg (0.74) 6 % No data 21 mg Piperine, 5 mg Cellulose, magnesium
salts of fatty acids,
hydroxypropylmethyl-
cellulose,
polyvinyl-
polipyrrolidone, talc,
titanium dioxide, iron
oxides
2 Magnolia bark
extract
30 capsules Magnolol,
honokiol
563 mg (3.26) 40 mg 10 mg 10 mg Extract from the root
of Withania somnifera ,
112 mg (including
12.25% glycoside
vitanolids);
panthotenic acid, 6
mg;
vitamin B6, 1.4 mg;
folic acid, 200 μg;
vitamin D, 50 μg;
vitamin B12, 2.5 μg
Cellulose,
hydroxypropylmethyl-
cellulose, magnesium
salts of fatty acids,
titanium dioxide,
brilliant blue FCF
3 Magnolia bark
extract
60 capsules Magnolol,
honokiol
658 mg (1.36) 400 mg No data No data No data Brown rice flour,
gelatine. Possible
components:
magnesium salts of
fatty acids, silicon
dioxide
4 Magnolia
extract
30 capsules Magnolol,
honokiol
439 mg (1.32) 200 mg No data 180 mg No data Rice flour,
hydroxypropylmethyl-
cellulose, magnesium
salts of fatty acids,
silicon dioxide
5 Magnolia
extract
30 mL Not detected 30 mL No data No data No data No data Herbal extract from
Pueraria montana radix
(kudzu root), water,
cellulose, xanthan,
citric acid, potassium
sorbate
6 Magnolia bark
powder
160 capsules Not detected 344 mg (4.40) No data 2.5 mg 0.5 mg No data Gelatine, titanium
dioxide
r
u
s
i
t
o
c
a
(
5
s
f
a
s
e
v
a
g
d
a
t
o
m
c
n
M
s
w
1
p
p
m
2
m
s
t
(
m
g
o
c
emaining six samples 1-6 (one tablet, four capsules, and one liq-
id), three independent specimens of each sample were processed
eparately in the following manner; sample 1 (tablet) was crushed
n a mortar; samples 2-4 and 6 (capsules) were opened and emp-
ied to the vessels; sample 5 (liquid) was collected in the aliquot
f 1 mL. To each sample, understood as one tablet, content of one
apsule or 1 mL liquid, 5-mL portions of methanol were added
nd the extraction was carried out with use of an ultrasonic bath
10 min ultrasonication at room temperature; 35 kHz; Sonorex RK
2 H, Bandelin Electronic, Berlin, Germany). After the extraction,
amples were left for ca. 5 min for the solid matter to sediment,
ollowed by filtration, first with a paper filter (75 ± 2 g m
−2 )
nd then a syringe filter (Anatop 0.02 μm, � 10 mm). After this
tage, sample 4 was ten-fold diluted with methanol. These single
xtracts were used to calculate the precision of the method and
ariability of the contents of neolignans. For a quantitative assay
nd confirmation of the manufacturers’ declaration, the three sin-
le extracted items of each dietary supplement (samples 1-4) were
ried (in a fume hood and subsequently in a desiccator), pooled
nd underwent further two tandem extractions with methanol in
he above described way. After each extraction step, the contents
f magnolol and honokiol in the supernatant were quantified by
eans of the newly developed TLC method. The results from three
tonsecutive extraction rounds were summed up to 100% of mag-
olol and honokiol, respectively.
For the purpose of the HPTLC-EDA analysis, samples denoted as
ix 1 and Mix 2 were dissolved in methanol (1 mg mL −1 ). Solid
amples 1-4 and 6 (100 mg of the powdered tablet or capsule)
ere vortexed in 1 mL methanol for 1 min and ultrasonicated for
0 min. The same procedure was performed with the liquid sam-
le 5, ten-fold diluted with methanol. The supernatants were ap-
lied for bioactivity tests. Sample 4 had to be ten-fold diluted with
ethanol.
.3. The silica gel-based TLC system to separate and quantify
agnolol and honokiol
Thin-layer chromatographic analyses were carried out with TLC
ilica gel 60 F 254 plates. The chromatograms were developed with
he mobile phase n -hexane – ethyl acetate – ethanol, 16:3:1
v/v/v). Each sample was spotted using a calibrated 5-μL glass
icropipette (CAMAG, Muttenz, Switzerland) onto the chromato-
raphic plate 10 mm above the lower plate edge and each devel-
pment was preceded by pre-saturation of the chromatographic
hamber with the mobile phase for 10 min. The migration dis-
ance of mobile phase from the lower plate edge was 130 mm
4 E. Łata, A. Fulczyk and P.G. Ott et al. / Journal of Chromatography A 1625 (2020) 461230
a
t
a
s
f
g
t
t
w
m
i
o
2
e
m
d
T
a
i
t
3
3
o
6
2
o
p
t
h
w
(
t
m
g
t
i
s
w
N
a
l
s
i
r
c
l
a
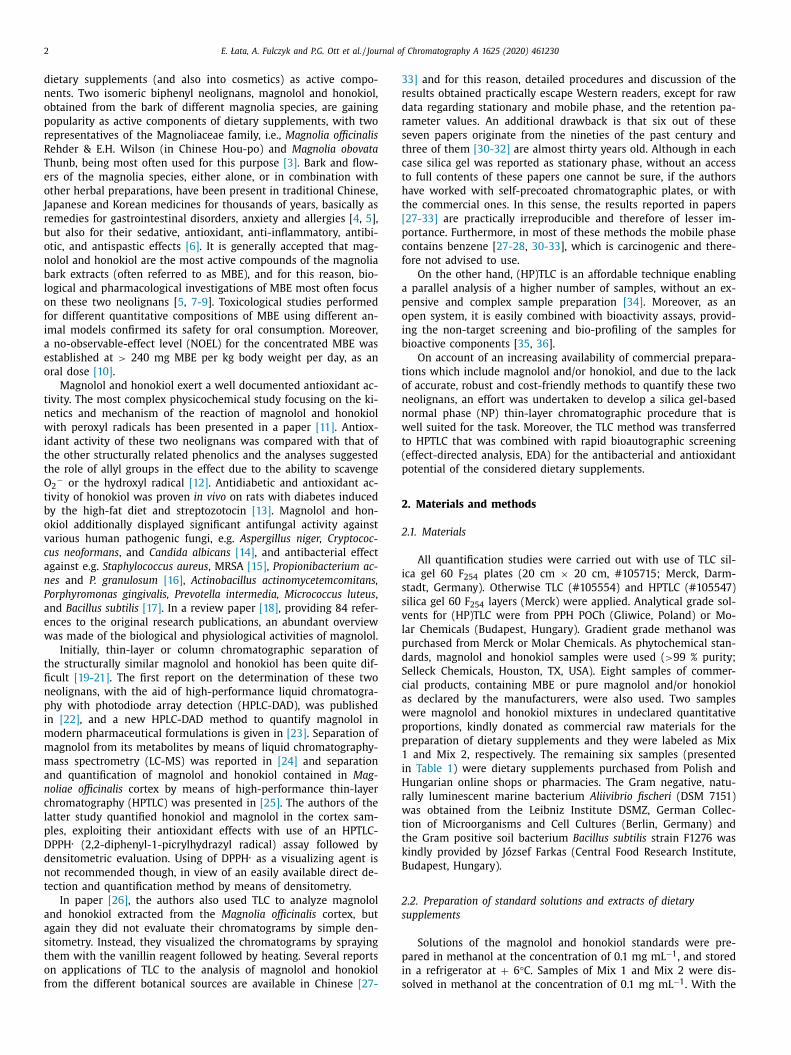
Fig. 1. Chemical structures of magnolol and honokiol.
that took 35 min. The development of the chromatograms was car-
ried out in standard 20 cm x 20 cm flat-bottomed chromatographic
chambers (CAMAG). After development, plates were dried in am-
bient air. In order to produce the calibration curves for magnolol
and honokiol, both standards were spotted onto chromatographic
plates in aliquots from 1 to 6 μL in 1- μL intervals. Each analy-
sis was performed with four replications (n = 4). Linearity range,
limit of detection (LOD) and limit of quantification (LOQ) were
determined for both neolignans. The dietary supplements (sam-
ples 1-6), each analyzed as three different specimens, were spot-
ted onto chromatographic plates in 1- μL aliquots, and these analy-
ses were performed in triplicate (n = 3). Mix 1 and Mix 2 sam-
ples were spotted onto chromatographic plates in 5- μL aliquots
and these analyses were also performed in triplicate (n = 3). Vari-
ability of the neolignans content of the tablets/capsules was also
determined.
2.4. Densitometry
For quantification of magnolol and honokiol, the chro-
matograms were scanned with a densitometer model CD 60
equipped with Pro-Quant software compatible with Microsoft Win-
dows operating system (Desaga, Wiesloch, Germany). Densitomet-
ric scans were performed in the absorbance mode at wavelength
λ = 290 nm. Dimensions of the rectangular light beam were 0.1
mm × 1.0 mm.
2.5. HPTLC-EDA
Samples were applied onto the HPTLC layer by a TLC sampler
(ATS3, CAMAG) as the 5-mm bands with 9-mm track distance and
8-mm distance from the lower plate edge. HPTLC separation was
carried out with n -hexane – ethyl acetate – ethanol (16:3:1, v/v/v)
in a saturated (10 min) 10 cm × 10 cm twin-trough chamber (CA-
MAG) to a migration distance of 70 mm. After development, the
plates were dried in a cold air stream and documented by a digital
camera (Cybershot DSC-HX60, Sony, Neu-Isenburg, Germany) un-
der a UV lamp (CAMAG) and by a TLC Scanner 3 densitometer at
254 nm or 290 nm with slit dimension 5 mm x 0.2 mm (CAMAG).
Thereafter, the plates were subjected to different biological assays.
Antibacterial activity was tested against A. fischeri and B. sub-
tilis strains, applying the previously described HPTLC-direct bioau-
tographic methods [ 37 , 38 ]. Briefly, the freshly prepared and dried
chromatograms were immersed into an appropriate cell suspen-
sion. Inhibitory activity, indicated by dark spots in the lumines-
cent bioautograms ( A. fischeri ), was documented at an exposure
time of 50 s using an iBright TM FL10 0 0 Imaging System (Thermo
Fisher Scientific, Budapest, Hungary), whereby the bioautograms
were kept under a glass cover assuring sufficient humidity. The B.
subtilis bioautograms were visualized after 2 h incubation (at 28
°C in 100% humidity), by immersion into an aqueous MTT solution
(1 mg mL −1 ). The inhibition zones were revealed as bright spots
against a bluish background, which was documented by a Cyber-
shot DSC-HX60 camera. Free radical scavenging activity was de-
tected by immersion of the chromatogram into a methanolic DPPH ̇
solution (0.02%). Bright zones against a purple background indi-
cated antioxidants. Documentation was performed with a Cyber-
shot DSC-HX60 camera using the transmitted white light illumina-
tion.
2.6. HPTLC-MS
For the mass spectrometric experiments, the online combina-
tion of a binary pump (LC-20AB, Shimadzu, Kyoto, Japan), a TLC-
MS Interface (CAMAG) using an oval elution head (4 mm × 2 mm)
nd a single quadrupole electrospray ionization mass spectrome-
er (LCMS-2020, Shimadzu) were utilized. The instrument control
nd data acquisition were performed using the LabSolutions 5.42v
oftware (Shimadzu). The mass spectrometric conditions were as
ollows: the nebulizer gas (N 2 ) flow rate, 1.5 L min
−1 ; the drying
as (N 2 ) flow rate, 10 L min
−1 ; the interface temperature, 350 °C;
he heat block temperature, 400 °C; the desolvation line tempera-
ure, 250 °C; the detector voltage 4.5 kV. The full mass scan spectra
ere recorded in the positive and negative ionization mode, in the
/z range of 150–800, with a scan speed of 682 amu/s. Zones of
nterest were eluted with methanol (gradient grade) at a flow rate
f 0.2 mL min
−1 .
.7. Stability assessment by 2D-HPTLC
Undiluted sample 4 (1 μL) or mixture of standards (1 μg of
ach Mix 1 and Mix 2) was spotted onto the HPTLC layer with a
icrosyringe at a 10-mm distance from the lower plate edge and
eveloped with n -hexane – ethyl acetate – ethanol (16:3:1, v/v/v).
he dried plate was kept for 20 h in a box to protect from the light
nd developed again with a mobile phase of the same composition
n the orthogonal direction. The dried plate was documented and
hen underwent the HPTLC-MS analysis.
. Results and discussion
.1. Quantification of magnolol and honokiol
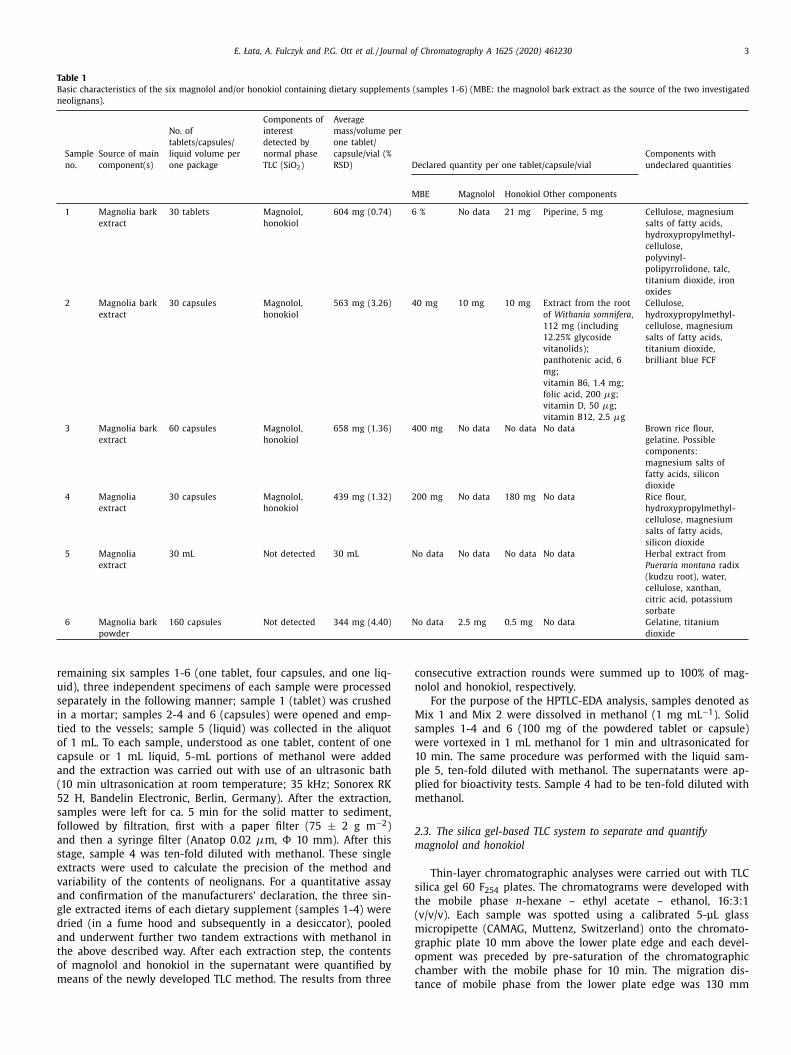
In order to quantify the two neolignans magnolol and hon-
kiol ( Fig. 1 ) in the investigated dietary supplements (samples 1-
) and in the magnolol and honokiol mixtures (Mix 1 and Mix
), first a relatively cheap TLC-densitometry method was devel-
ped. As mobile phase various mixtures of toluene, n-hexane, iso-
ropyl acetate, ethyl acetate, ethanol, and methanol, were tried in
he normal phase TLC (Fig. S-1). The separation of magnolol and
onokiol was achieved on the silica gel plates after manual spot-
ise sample application using n -hexane – ethyl acetate – ethanol
16:3:1, v/v/v) mobile phase and 130 mm as the development dis-
ance ( Fig. 2 ). To elaborate the calibration curves, solutions of the
agnolol and honokiol standards were spotted onto the chromato-
raphic plates in aliquots from 1 to 6 μL, in 1- μL intervals. Af-
er development, chromatograms were densitometrically scanned
n absorbance mode at wavelength λ = 290 nm, the common ab-
orbance maximum of the two neolignans ( Fig. 3 ). Quantification
as performed based on the chromatographic peak height values.
umerical values of the detection and quantification limits (LOD
nd LOQ, respectively) were calculated using the following formu-
as: LOD = 3.3 × SD/ a , and LOQ = 10 × SD/ a , where SD is the
tandard deviation of peak height, and a is the slope of the cal-
bration curve (y = a x + b). Each chromatographic analysis was
epeated four times (n = 4). Respective retardation factors ( hR F ),
alibration curve equations, determination coefficient values (R
2 ),
inearity range, and LOD and LOQ values calculated for magnolol
nd honokiol are given in Table 2 . The obtained numerical results
E. Łata, A. Fulczyk and P.G. Ott et al. / Journal of Chromatography A 1625 (2020) 461230 5
Table 2
Retardation factor ( hR F ) values, linear regressions, determination coefficients (R 2 ), the LOD and LOQ values, and the linearity range obtained for magnolol
and honokiol in the employed chromatographic system (silica gel TLC plates, n -hexane - ethyl acetate - ethanol, 16:3:1 (v/v/v)); n = 4.
Standard
compound hR F ( ±1) Linear regression
Determination
coefficient (R 2 )
LOD [ μg spot −1 ]
(RSD (%))
LOQ [ μg spot −1 ]
(RSD (%))
Linearity range [ μg
spot −1 ]
Magnolol 39 y = 321.3x + 52.6 0.99 0.09 (11.4) 0.28 (11.4) 0.09 – 0.58
Honokiol 34 y = 433.1x + 80.2 0.98 0.07 (8.1) 0.20 (8.1) 0.07 – 0.57
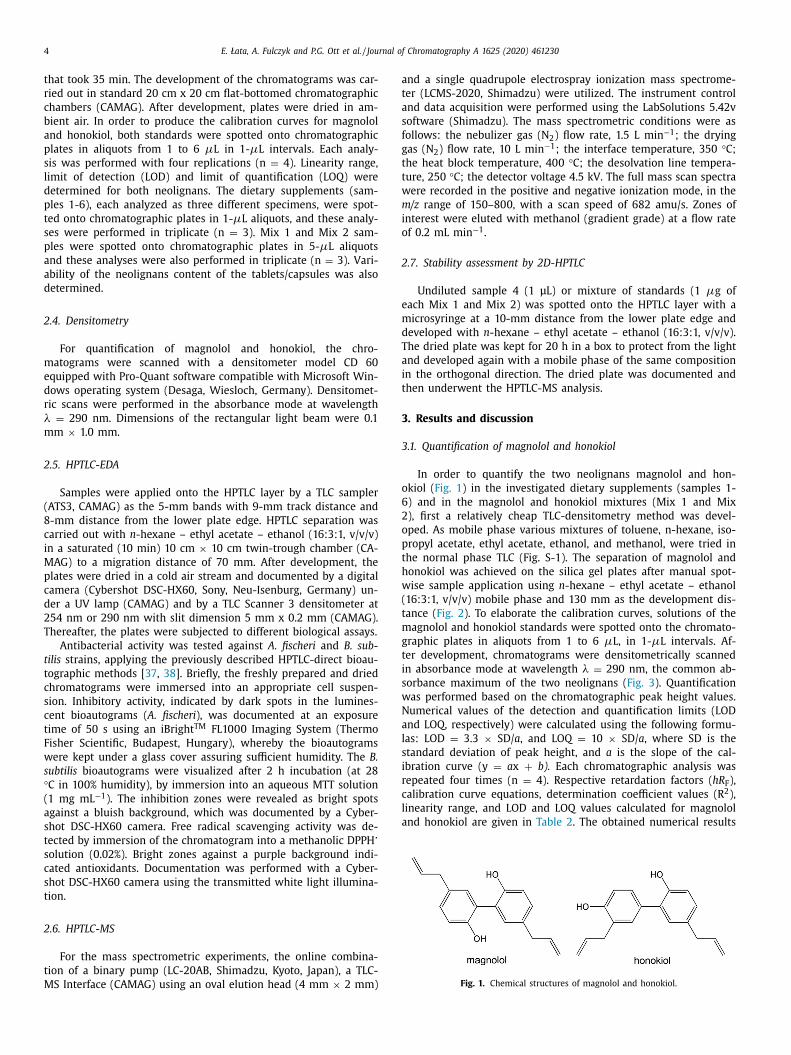
Fig. 2. Normal-phase TLC chromatogram (a) of dietary supplements (1-6: samples
1-6, respectively; 1 μL of each) and mixtures of standards Mix 1 and Mix 2 (5 μL of
each) at UV 254 nm after the development with n -hexane – ethyl acetate – ethanol
(16:3:1, v/v) to the 13 cm distance and densitogram (b) of sample 1 recorded at 290
nm.
Table 3
Precision of the developed method assessed in terms of the relative standard devia-
tion (% RSD) for the contents of magnolol and honokiol in sample 2 expressed in mg
g −1 sample. Six different capsules (a)–(f) of sample 2 were tested and the respec-
tive extracts were chromatographed on two different chromatographic plates, with
each sample being spotted onto the chromatographic plate in triplicate (n = 3).
Sample
2
Magnolol Honokiol
hR F ( ±0.1) mg g −1 RSD [%] hR F ( ±0.1) mg g −1 RSD [%]
(a) 38 12.1 3.1 34 13.1 4.2
(b) 37 11.6 1.8 32 12.5 1.5
(c) 38 11.8 2.6 33 12.8 3.2
(d) 38 12.2 2.1 33 12.7 2.0
(e) 38 13.6 1.2 32 13.8 0.9
(f) 39 11.9 2.6 33 12.1 2.3
d
e
0
0
i
u
f
t
g
t
Fig. 3. Normal-phase TLC (a) and HPTLC (b) chromatograms of dietary supplements (1
mixtures of standards Mix 1 and Mix 2 at UV 254 nm after the development with n -he
(c,d) recorded in the zones of interest (mixtures of standards and samples) and densitogra
development. The applied sample volumes were 0.5 μL and 0.2 μL into TLC and HPTLC la
emonstrated very good detectability and good quantification lev-
ls, with the LOD and LOQ values for magnolol equal to 0.09 and
.28 μg spot −1 , respectively, and for honokiol equal to 0.07 and
.20 μg spot −1 , respectively.
Precision of the developed quantification method was assessed
n terms of the relative standard deviation (% RSD), using individ-
al extracts of sample no. 2 as an example. To this effect, six dif-
erent capsules (a)–(f) of sample 2 were tested and the respec-
ive extracts were chromatographed on two different chromato-
raphic plates, with each sample being spotted onto the plate in
riplicate (n = 3). The results obtained are given in Table 3 . The
-6: samples 1-6, respectively; sample 4 in TLC before the ten-fold dilution) and
xane – ethyl acetate – ethanol (16:3:1, v/v) to the 7 cm distance, and UV spectra
ms (e,f) recorded at 254 nm (e) and 290 nm (f) after the TLC (c,e) and HPTLC (d,f)
yers, respectively.
6 E. Łata, A. Fulczyk and P.G. Ott et al. / Journal of Chromatography A 1625 (2020) 461230
Table 4
The contents of magnolol and honokiol in mg g −1 sample for each investigated di-
etary supplement (samples 1-6) and variability of the contents expressed as the
relative standard deviation (% RSD). The results hold for two different sets of ex-
tracts from samples 1-6, each sample spotted onto the chromatographic plate in
triplicate (n = 3).
Sample
no.
Magnolol Honokiol
hR F ( ±1) mg g −1 RSD [%] hR F ( ±1) mg g −1 RSD [%]
1 39 9.9 14.1 34 8.3 12.4
2 38 15.1 8.4 33 13.0 7.6
3 39 0.9 2.8 33 4.5 5.2
4 39 112.4 0.3 32 82.8 1.0
5 – – – –
6 – – – –
s
b
s
b
f
c
o
o
f
w
m
t
w
t
m
w
h
w
h
t
p
w
5
e
h
w
f
a
r
o
d
t
s
(
g
o
4
(
q
o
i
m
p
obtained quantification data fall within a relatively narrow % RSD
range (equal to 1.2–3.1 % RSD for magnolol and 0.9–4.2 % RSD for
honokiol), showing satisfactory precision of the developed analyti-
cal approach.
Mix 1 and Mix 2 were declared by the donator as mixtures of
magnolol and honokiol alone (without a matrix). From our ana-
lytical results it came out that the content of magnolol in Mix 1
was equal to 910.6 ± 75.7 mg g −1 (n = 3), i.e., to ca. 91.1 weight
% of the sample, and the content of honokiol was below the LOQ
value. As Mix 1 consists of magnolol and honokiol alone, it can be
concluded that the content of honokiol equals to ca. 8.9 weight %
in this sample. With Mix 2, the content of honokiol was found as
equal to 633.2 ± 22.8 mg g −1 (n = 3), i.e., to ca. 63.3 weight % of the
sample, and magnolol was not detected. Hence, a conclusion was
drawn that the content of magnolol in Mix 2 equals to ca. 36.7
weight % of the sample.
Variability of the contents of magnolol and honokiol per each
investigated dietary supplement (samples 1-6) was assessed in
terms of the relative standard deviation (% RSD), based on two
different sets of single extracts obtained from two different spec-
imens of each sample spotted onto the chromatographic plate in
triplicate (n = 3). The results obtained are presented in Table 4 .
The highest variability of the contents was observed with sample
1, which was a coated tablet (14.1 and 12.4% RSD for magnolol and
honokiol, respectively). Lower variability was observed with sam-
ples 2 and 3, which were capsules, and the lowest variability was
observed with sample 4, which was also a capsule (0.3 and 1% RSD
for magnolol and honokiol, respectively). In samples 5 and 6, nei-
ther magnolol nor honokiol was detected, either due to their ab-
Table 5
Quantitative assay of magnolol and honokiol for samples 1
consecutive steps of exhaustive extraction (nd holds for not
Sample no.
Exhaustive
extraction no.
Magnolol
[mg g −1 ]
1 1 10.5 ± 0.2 (n = 3)
2 3.2
3 nd
� 13.7
2 1 15.6 ± 1.5 (n = 3)
2 1.4
3 nd
� 17.1
3 1 1.0 ± 0.1 (n = 3)
2 nd
3 nd
� 1.0
4 1 108.0 ± 7.6 (n = 3)
2 6.7
3 nd
� 114.7
ence in these two samples, or because of their contents falling
elow the established LOD values. All the obtained numerical re-
ults are acceptable and the observed differences seem justified
y different preparation technologies with tablets and capsules. In
act, one can expect the highest variance in amount of the targeted
ompound among coated tablets (e.g., due to an uneven thickness
f the coating layer) and lower variances among the capsules.
To determine the extractable amount of magnolol and hon-
kiol contained in the samples 1-4, a quantitative assay was per-
ormed using repeated exhaustive extraction. Each sample under-
ent three consecutive extraction rounds and after each extraction,
agnolol and honokiol was quantified by means of TLC. The quan-
ification yields obtained from the consecutive extraction rounds
ere summed up to 100% and the results (valid per 1 gram of the
ablet or capsule) are given in Table 5 . Among the dietary supple-
ents considered, the highest contents of magnolol and honokiol
ere found in sample 4 (114.7 mg g −1 magnolol and 84.9 mg g −1
onokiol). The lowest detectable amount of magnolol and honokiol
ere found in sample 3 (0.9 mg g −1 magnolol and 4.9 mg g −1
onokiol). The contents were re-calculated per weight of a single
ablet or capsule (as given in Table 1 ), and our results were com-
ared with the manufacturers’ declarations. The most accurate data
ere provided by the manufacturer of sample 2 (capsule weight,
63 mg; the declared contents of magnolol and honokiol, 10 mg
ach). Our quantification revealed 9.6 mg magnolol and 8.2 mg
onokiol per capsule, which remains in a fairly good agreement
ith the declaration. The weight of sample 1 was 604 mg, no in-
ormation was available regarding the content of magnolol and the
mount of honokiol was declared as 21 mg per tablet. Our assay
evealed 8.2 mg magnolol and 6.7 mg honokiol per tablet (i.e., by
ne third less honokiol than declared). Manufacturer of sample 3
id not provide any quantitative information regarding the con-
ents of magnolol or honokiol in its capsule (658 mg), and our as-
ay revealed 0.9 mg magnolol and 4.9 mg honokiol. For sample 4
capsule, 439 mg), the manufacturer provided no information re-
arding the content of magnolol, but the declared amount of hon-
kiol was 180 mg. From our measurement it came out that sample
contains 50.4 mg magnolol and 37.3 mg honokiol per capsule
i.e., ca. 20 % of the declared honokiol content). Summing up, the
uantitative assay of magnolol and honokiol performed with use
f the proposed thin-layer chromatographic method demonstrates
ts practical usefulness for quantification and quality control of the
agnolol and honokiol containing dietary supplements and similar
reparations from the group of foodstuffs.
-4 measured per one gram of samples 1-4 in three
detected).
Honokiol
[%] [mg g −1 ] [%]
76.7 8.4 ± 0.3 (n = 3) 75.9
23.3 2.7 24.1
nd nd nd
100 11.1 100
91.5 13.1 ± 1.0 (n = 3) 90.6
8.6 1.4 9.4
nd nd nd
100 14.5 100
100 4.9 ± 0.3 (n = 3) 100
nd nd nd
nd nd nd
100 4.9 100
94.13 79.4 ± 5.4 (n = 3) 93.6
5.9 5.5 6.4
nd nd nd
100 84.9 100
E. Łata, A. Fulczyk and P.G. Ott et al. / Journal of Chromatography A 1625 (2020) 461230 7
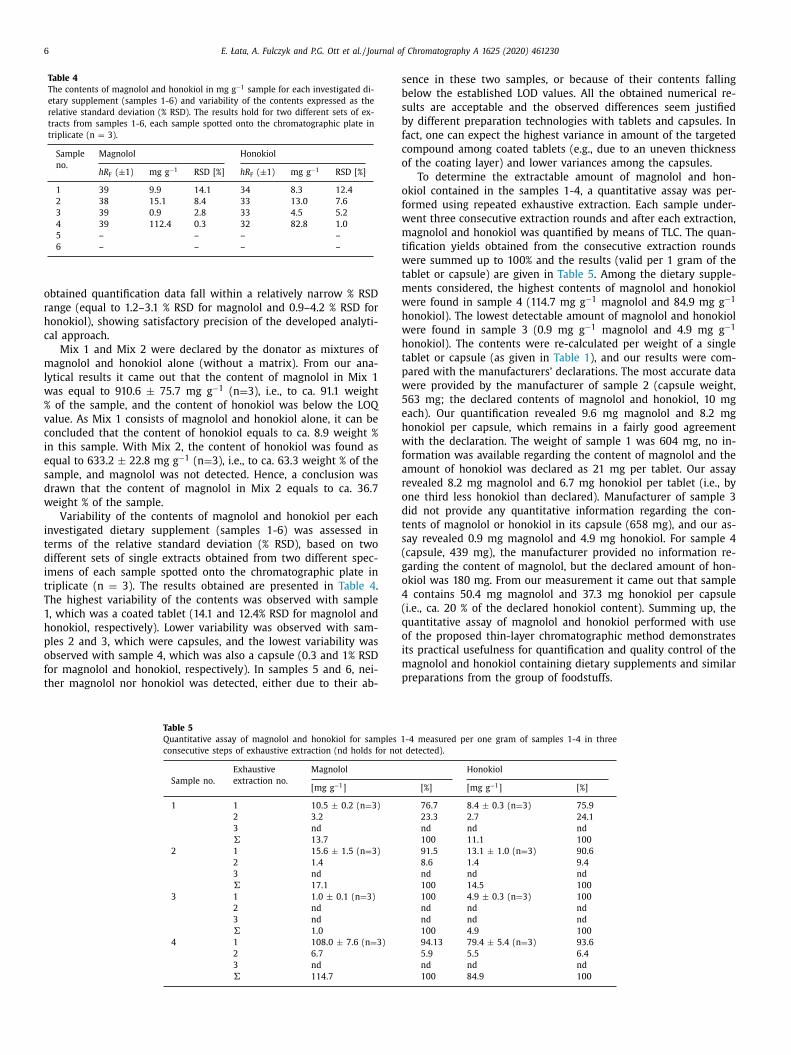
Fig. 4. HPTLC chromatograms of bioactive components in dietary supplements (1-6: samples 1-6, respectively; 0.2 μL of each) and mixtures of standards Mix 1 and Mix 2
(0.5 μL of each) at UV 254 nm (a), and after DPPH
. test (b), and B. subtilis (c) and luminescent A. fischeri (d) bioassays.
Fig. 5. Direct MS analysis of Mix 2 (a) and Mix 1 (c) deposited on the aluminium foil and the HPTLC-ESI −-MS full scan spectra of the honokiol (b), magnolol (d) and their
degradation products (e,f) after the 2D-HPTLC separation of the mixtures of standards (1 μg of each). Chromatogram (g, at UV 254 nm) was developed with n -hexane – ethyl
acetate – ethanol (16:3:1, v/v) in both directions using the 20-h break. Mass spectra were obtained via the elution head-based TLC-MS Interface and background subtraction.
3
s
t
p
a
m
e
m
a
b
h
s
m
t
t
n
(
s
t
6
m
w
p
s
a
f
t
h
t
c
D
p
T
t
t
i
[
t
n
i
o
.2. HPTLC-EDA
The relatively cheap silica gel-based TLC method comprising
pot-wise sample application by a calibrated capillary was in-
ended to be improved by an instrumental band-wise sample ap-
lication. A reduced initial band broadening allowed the TLC sep-
ration of magnolol and honokiol ( R s = 0.9) in a shorter develop-
ent time (12 min) and at a shorter distance (7 cm) ( Fig. 3 a and
). Peak purity was established by recording the UV ( Fig. 3 c) and
ass spectra (not shown) of the zones of interest. Even better sep-
ration was achieved with the HPTLC silica gel adsorbent ( Fig. 3
, d and f), resulting in a higher resolution (R s = 1.2) and slightly
igher hR F values (46.1 and 39.5 for magnolol and honokiol, re-
pectively). Bioprofiles of the dietary supplements were deter-
ined by HPTLC combined with an antioxidant (DPPH
. ) and an-
ibacterial assays. Magnolol and honokiol displayed antioxidant ac-
ivity and inhibited the Gram positive Bacillus subtilis and the Gram
egative naturally luminescent Aliivibrio fischeri bacterial strains
Fig. 4 ). Both compounds could be detected by all bioactivity as-
ays in samples 1, 2 and 4. In sample 3, only honokiol was con-
ained in the minimum effective amount, while in samples 5 and
neither magnolol, nor honokiol was observed. Apart from chro-
atographic zones of the two isomeric biphenyl neolignans, zones
ith antioxidant activity appeared at the application bands of sam-
les 2, 5 and 6. Interestingly, B. subtilis was not sensitive to any
ample component other than magnolol and honokiol. Antioxidant
ctivity of these neolignans [ 12 , 13 , 22 ] and their antibacterial ef-
ect against B. subtilis [17] have been recognized earlier. However,
o the best of our knowledge, antibacterial effect of magnolol and
onokiol against A. fischeri has not yet been reported.
Additional inhibition zones against A. fischeri were detected in
he tracks of samples 1 and 5. In sample 1, two additional and in-
ompletely separated active zones at hR F 29 and 30.3 were found.
ensitometric assessment of the peak shoulder also confirmed the
resence of at least two compounds. The oval elution head of the
LC-MS interface allowed collective elution of these two zones and
he mass spectrometric evaluation resulted in detection of charac-
eristic mass signals at m/z 308, m/z 340 and m/z 593 in the pos-
tive ionization mode, which were assigned as the sodium adduct
M + Na] + , the sodium and methanol adduct [M + CH 3 OH + Na] + and
he sodium adduct of the dimer [2M + Na] + (Fig. S-2a). The proto-
ated molecular ion at m/z 286 was also detected, with a lower
ntensity though. These signals were tentatively ascribed to the ge-
metric isomers of the alkaloid piperine, which appears as a de-
8 E. Łata, A. Fulczyk and P.G. Ott et al. / Journal of Chromatography A 1625 (2020) 461230
R
t
M
v
R
D
D
c
i
A
v
S
f
R
clared component of sample 1. A. fischeri also proved sensitive to
a component of sample 5 at hR F 17.5. The compound present in
this chromatographic zone was characterized by mass spectrom-
etry. In the negative ionization mode the deprotonated molecule
[M-H] − at m/z 253 (Fig. S-2b) and in the positive ionization mode
the sodium adduct [M + Na] + , the sodium and methanol adduct
[M + CH 3 OH + Na] + and the sodium adduct of the dimer [2M + Na] +
were recorded at m/z 277, m/z 309 and m/z 531 (Fig. S-2c), re-
spectively. Based on the data taken from the literature [ 39 , 40 ],
this compound was tentatively identified as the isoflavone daidzein
that could originate from the sample ingredient, kudzu root. An-
tibacterial effect of both piperine and daidzein against Gram pos-
itive and Gram negative strains has previously been reported [ 41 ,
42 ]. In our study though, concentrations of piperine and daidzein
have proved effective in the Gram negative A. fischeri assay only.
3.3. Stability assessment by 2D-HPTLC
Stability of magnolol and honokiol on the silica gel adsorbent
was assessed in the two-dimensional (2D) HPTLC mode using the
20-h break between the two orthogonal development runs with
mobile phase of the same composition. After the 2nd development
run, derivatives of neolignans were detected below and above
their chromatographic zones ( Fig. 5 ). Mass spectra of neolignans
recorded upon their elution from the adsorbent ( Fig. 5 b and d)
were very similar to those obtained by eluting Mix 1 and Mix 2
deposited on an aluminium foil ( Fig. 5 a and c). The only character-
istic difference was a new signal that appeared on silica gel at m/z
529 in the negative ionization mode. It probably was the dimer of
honokiol with monoisotopic mass of 530 (the component of Mag-
nolia officinalis root [43] ), which was formed from honokiol in the
course of the chromatographic process. So far, the dimer of mag-
nolol has not yet been described as a component of the magnolia
bark, but it was synthesized in the laboratory only [44] . Based on
the results originating from the 2D HPTLC experiment, compounds
with the mass signal at m/z 529 might have been formed from
both magnolol and/or honokiol ( Fig. 5 e). Similarly, the respective
degradation products with the hR F values higher than those of the
neolignans gave very similar mass spectra ( Fig. 5 f). Fortunately,
neither magnolol nor honokiol degrades on the silica gel adsorbent
within 4 h storage period (Fig. S-3), so that there is enough time
to document the chromatograms. Based on these observations, the
UV densitometry and the bioactivity assays were performed imme-
diately after the development and drying of the chromatograms.
Conclusions
The TLC-UV method was shown as an efficient and reliable
tool for quantitative determination of the two magnolia neolignans,
magnolol and honokiol, in dietary supplements. The developed
method provided very good detectability, good quantification levels
and satisfactory precision. The obtained quantitative results clearly
confirmed the necessity of stricter quality control of the dietary
supplements to exclude products with doubtful constitution and
doubtful physiological effects from the market. The HPTLC-EDA/MS
approach was found to be useful for the high-throughput biopro-
filing of the dietary supplements to screen and identify bioactive
ingredients. 2D-HPTLC-MS was shown as a suitable and easy-to-
perform approach for stability assessment of the analytes of inter-
est.
Credit authorship contribution statement
Eliza Łata & Agnieszka Fulczyk : Quantitative TLC Experiments,
Data Analysis, Writing - Original Draft. Péter G. Ott : Methodology,
esources, Writing - Review & Editing. Teresa Kowalska : Concep-
ualization, Resources, Writing - Original Draft, Review & Editing.
ieczysław Sajewicz : Conceptualization, Resources, Writing - Re-
iew & Editing. Ágnes M. Móricz : Conceptualization, Methodology,
esources, HPTLC Experiments, Data Analysis, Writing - Original
raft, Review & Editing.
eclaration of Competing Interests
The authors declare that they have no known competing finan-
ial interests or personal relationships that could have appeared to
nfluence the work reported in this paper.
cknowledgment
This work was partially funded by the National Research, De-
elopment and Innovation Office of Hungary ( NKFIH K128921 ).
upplementary materials
Supplementary material associated with this article can be
ound, in the online version, at doi:10.1016/j.chroma.2020.461230 .
eferences
[1] https://eur- lex.europa.eu/legal- content/EN/TXT/?uri=celex:32002R0178
[2] https://www.efsa.europa.eu/en/data/compendium-botanicals [3] A. Sarrica , N. Kirika , M. Romeo , M. Salmona , L. Diomede , Safety of toxicology
of magnolol and honokiol, Planta Med. 84 (2018) 1151–1164 .
[4] T.H. Tsai , C.J. Chou , T.F. Lee , L.C.H. Wang , C.F. Chen , Pharmacokinetic and phar-macodynamic studies of magnolol after oral administration in rats, Pharm. Sci.
2 (1996) 191–193 . [5] Y.J. Lee , Y.M. Lee , C.K. Lee , J.K. Jung , S.B. Han , J.T. Hong , Therapeutic appli-
cations of compounds in the magnolia family, Pharmacol. Ther. 130 (2011)157–176 .
[6] M. Poivre , P. Duez , Biological activity and toxicity of the Chinese herb Magnolia
officinalis Rehder & E. Wilson (Houpo) and its constituents, J. Zhejiang Univ.Sci. B 18 (2017) 191–214 .
[7] M.T. Hsieh , F.Y. Chueh , M.T. Lin , Magnolol decreases body temperature by re-ducing 5-hydroxytryptamine release in the rat hypothalamus, Clin. Exp. Phar-
macol. Physiol. 25 (1998) 813–817 . [8] L. Wu , H. Zou , W. Xia , Q. Dong , L. Wang , Role of magnolol in the proliferation
of vascular smooth muscle cells, Herz 40 (2015) 542–548 .
[9] D. Herrmann , A. Schreiber , A. Ciotkowska , F. Strittmatter , R. Weidelich ,G.C. Stief , C. Gratzke , M. Hennenberg , Honokiol, a constituent of Magnolia
species, inhibits adrenergic contraction of human prostate strips and inducesstromal cell death, Prostate Int. 2 (2014) 140–146 .
[10] Z. Liu , X. Zhang , W. Cui , X. Zhang , N. Li , J. Chen , A.W. Wong , A. Roberts , Eval-uation of short-term and subchronic toxicity of magnolia bark extracts in rats,
Regul. Toxicol. Pharmacol. 49 (2007) 160–171 .
[11] R. Amorati , J. Zotova , A. Baschieri , L. Valgimigli , Antioxidant activity of mag-nolol and honokiol: kinetic and mechanistic investigations of their reaction
with peroxyl radicals, J. Org. Chem. 80 (2015) 10651–10659 . [12] M. Ogata , M. Hoshi , K. Shimotohno , S. Urano , T. Mendo , Antioxidant activity of
magnolol, honokiol, and related phenolic compounds, J. Am. Oil Chem. Soc. 74(1997) 557–562 .
[13] J.J. Wang , R. Zhao , J.C. Liang , Y. Chen , Antidiabetic and anti-oxidative effects
of honokiol on diabetic rats induced by high-fat diet and streptozotocin, Chin.Herb. Med. 6 (2014) 42–46 .
[14] K.H. Bang , Y.K. Kim , B.S. Min , M.K. Na , Y.H. Rhee , J.P. Lee , Antifungal activity ofmagnolol and honokiol, Arch. Pharm. Res. 23 (20 0 0) 46–49 .
[15] S.Y. Kim, J. Kim, S.-I. Jeong, K.Y. Jahng, K.-Y. Yu, Antimicrobial effects and resis-tant regulation of magnolol and honokiol on methicillin-resistant Staphylococ-
cus aureus , BioMed Res. Int. (2015) 283630 (2015), doi: 10.1155/2015/283630 .
[16] J. Park , J. Lee , E. Jung , Y. Park , K. Kim , B. Park , K. Jung , E. Park , J. Kim , D. Park ,In vitro antibacterial and anti-inflammatory effects of honokiol and magnolol
against Propionibacterium sp, Eur. J. Pharmacol. 496 (2004) 189–195 . [17] K.-Y. Ho , C.-C. Tsai , C.-P. Chen , J.-S. Huang , C.-C. Lin , Antimicrobial activity of
honokiol and magnolol isolated from Magnolia officinalis , Phytother. Res. 15(2001) 139–141 .
[18] Y.H. Chen , P.H. Huang , F.Y. Lin , W.C. Chen , Y.L. Chen , W.H. Yin , K.M. Man ,P.L. Liu , Magnolol: a multifunctional compound isolated from the Chinese
medicinal plant Magnolia officinalis , Eur. J. Integr. Med. 3 (2011) e317–e324 .
[19] F. Amblard , D. Delinsky , J.L. Arbiser , R.F. Schinazi , Facile purification of honokioland its antiviral and cytotoxic properties, J. Med. Chem. 49 (2006) 3426–3427 .
[20] X. Wang , Y. Wang , Y. Geng , F. Li , C. Zheng , Isolation and purification of hon-okiol and magnolol from cortex Magnoliae officinalis by high-speed coun-
ter-current chromatography, J. Chromatogr. A 1036 (2004) 171–175 .
E. Łata, A. Fulczyk and P.G. Ott et al. / Journal of Chromatography A 1625 (2020) 461230 9
[
[
[
[
[
[
[
[
[
[
[
[
[
[
[
[
[21] J. Slanina , Z. Glatz , Separation procedures applicable to lignan analysis, J. Chro-matogr. B 812 (2004) 215–229 .
22] T.H. Tsai , C.F. Chen , Identification and determination of honokiol and mag-nolol from Magnolia officinalis by high-performance liquid chromatography
with photodiode-array UV detection, J. Chromatogr. A 598 (1992) 143–146 . 23] A. Stefanache , L. Ochiuz , M. Ignat , A. Creteanu , G. Tantaru , Development and
validation of a new method by high performance liquid chromatography forthe quantitative analysis of magnolol loaded in silica particulate systems, Far-
macia 64 (2016) 268–273 .
[24] M. Hattori , T. Sakamoto , Y. Endo , N. Kakiuchi , K. Kobashi , T. Mizuno , T. Namba ,Metabolism of magnolol from magnoliae cortex. I. Application of liquid chro-
matography-mass spectrometry to the analysis of metabolites of magnolol inrats, Chem. Pharm. Bull. (Tokyo) 32 (1984) 5010–5017 .
25] L. Gu , S. Zheng , T. Wu , G. Chou , Z. Wang , High-performance thin-layer chro-matographic-bioautographic method for the simultaneous determination of
magnolol and honokiol in Magnoliae officinalis cortex, J. Planar Chromatogr. –
Modern TLC 27 (2014) 5–10 . 26] A. Nachtergael , M. Poivre , A. Belayew , P. Duez , In vitro genotoxicity tests point
to an unexpected and harmful effect of a Magnolia and Aristolochia associa-tion, J. Ethnopharmacol. 174 (2015) 178–186 .
[27] J. Shi , X. Niw , An improved method for identification of Weizhangshu com-pound oral liquid by thin-layer chromatography, J. Qilu Med. Pharm. 29 (2010)
658–659 (in Chinese) .
28] J. Lu , X. Pei , X. Lu , Determination of magnolol and honokiol in Muxi-angshunqi pills by thin-layer chromatography, Chinese Trad. Patent Med.
(Zhongchengyao) 20 (1998) 8–9 (in Chinese) . 29] Q. Zeng , X. Song , Q. Zhang , W. Tu , L. Zhang , Assay of magnolol and honokiol in
Magnolia officinalis Rehd et Wils, and its processed products, J. Chinese HerbMed. (Zhongcaoyao) 27 (1996) 11–13 (in Chinese) .
30] Sh. Liang , G. Zhang , Determination of four active ingredients in Qinggan Li-
dan injection by TLC scanning, Chinese J. Pharm. Anal. (Yaowu Fenxi Zazhi) 15(1995) 24–26 (in Chinese) .
[31] W. Liu) , B. Wang , Zh. Pang , J. Cheng , Determination of magnolol by thin-layerchromatography and fluorometry, J. Chinese Trad. Med. (Zhongguo Zhongyao
Zazhi) 16 (1991) 101–102 (in Chinese) . 32] C. Ye , Zh. Feng , J. Teng , Analysis of ß-eudesmol, magnolol and honokiol in Mag-
nolia officinalis by thin-layer chromatography, Chinese J. Pharm. Anal. (Yaowu
Fenxi Zazhi) 12 (1992) 159–162 (in Chinese) . [33] M. Yao, L. Chen, Y. Dai, W. Liu, Zh.. Xiang, Determination of phenolic con-
stituents in cortex and leaves of officinal magnolia, Magnolia officinallis, bythin-layer chromatography, PLA No. 163 Hospital, Hunan, 410 0 03 P.R. China
(in Chinese)
34] M. Waksmundzka-Hajnos , J. Sherma , T. Kowalska , Thin Layer Chromatographyin Phytochemistry, CRC Press, Boca Raton, 2008 .
[35] G. Morlock, W. Schwack, Hyphenations in planar chromatography, J. Chro-matogr. A 1217 (2010) 6600–6609, doi: 10.1016/j.chroma.2010.04.058 .
36] Á.M. Móricz, P.G. Ott, T.T. Häbe, A. Darcsi, A. Böszörményi, Á. Alberti,D. Krüzselyi, P. Csontos, S. Béni, G.E. Morlock, Effect-directed discovery of
bioactive compounds followed by highly targeted characterization, isolationand identification, exemplarily shown for Solidago virgaurea , Anal. Chem. 88
(2016) 8202–8209, doi: 10.1021/acs.analchem.6b02007 .
[37] Á.M. Móricz , T.T. Häbe , P.G. Ott , G. Morlock , Comparison of high-performancethin-layer with overpressured layer chromatography combined with direct
bioautography and direct analysis in real time mass spectrometry for tansyroot, J. Chromatogr. A 1603 (2019) 355–360 .
38] Á.M. Móricz , T.T. Häbe , A. Böszörményi , P.G. Ott , G. Morlock , Tracking and iden-tification of antibacterial components in the essential oil of Tanacetum vulgare
L. by the combination of high-performance thin-layer chromatography with
direct bioautography and mass spectrometry, J. Chromatogr. A 1422 (2015)310–317 .
39] H. Rong , J.F. Stevens , M.L. Deinzer , L. De Cooman , D. De Keukeleire , Identi-fication of isoflavones in the roots of Pueraria lobata , Planta Med 64 (1998)
620–627 . 40] T. Cui , S. Tang , C. Liu , Z. Li , Q. Zhu , J. You , X. Si , F. Zhang , P. He , Z. Liu , M. Miao ,
G. Yang , Q. Shen , L. Jiang , Three new isoflavones from the Pueraria montana
var. lobata (Willd.) and their bioactivities, Nat. Prod. Res. 32 (2018) 2817–2824 .[41] E.E. Mgbeahuruike, M. Stålnacke, H. Vuorela, Y. Holm, Antimicrobial and
synergistic effects of commercial piperine and piperlongumine in combina-tion with conventional antimicrobials, Antibiotics 8 (2019) 55, doi: 10.3390/
antibiotics8020055 . 42] R. Barbieri , E. Coppo , A. Marchese , M. Daglia , E. Sobarzo-Sánchez , S.F. Nabavi ,
S.M. Nabavi , Phytochemicals for human disease: an update on plant-derived
compounds antibacterial activity, Microbiol. Res. 196 (2017) 44–68 . 43] H.C. Shih, T.L. Hwang, H.C. Chen, P.C. Kuo, E.J. Lee, K.H. Lee, T.S. Wu, Honokiol
dimers and magnolol derivatives with new carbon skeletons from the roots ofMagnolia officinalis and their inhibitory effects on superoxide anion generation
and elastase release, PloS One 8 (2013) e59502 Print 2013, doi: 10.1371/journal.pone.0059502 .
44] D. Dreier, S. Latkolik, L. Rycek, M. Schnürch, A. Dymáková, A.G. Atanasov,
A. Ladurner, E.H. Heiss, H. Stuppner, D. Schuster, M.D. Mihovilovic, V.M. Dirsch,Linked magnolol dimer as a selective PPAR γ agonist – structure-based ratio-
nal design, synthesis, and bioactivity, Sci. Rep. 7 (2017) 13002, doi: 10.1038/s41598- 017- 12628- 5 .


![RESEARCH ARTICLE Open Access Effects of magnolol on ......radecanoyl phorbol-13-acetate (TPA) [21]. For the first time, in this study, we reported the effects of magnolol on UVB-induced](https://img.dokumen.tips/doc/110x75/6093af7657fb0723042e89e5/research-article-open-access-effects-of-magnolol-on-radecanoyl-phorbol-13-acetate.jpg)