Embed Size (px)
Citation preview
1
Electronic Supplementary Information
DNA gated photochromism and fluorescent switch in a
thiazole orange modified diarylethene
Keyin Liu,† Ying Wen,† Ting Shi,§ Yi Li,† Fuyou Li,† Yi-lei Zhao,§ Chunhui Huang,† Tao Yi†*
† Department of Chemistry, and Concerted Innovation Center of Chemistry for Energy Materials, Fudan University, 220 Handan Road, Shanghai, 200433, P.R. China§ State Kay Laboratory of Microbial Metabolism, School of Life Sciences and Biotechnology, Shanghai Jiao Tong University, Shanghai 200240, P.R. China
Contents
1. Materials and general procedures
2. Synthesis
3. Techniques
4. DNA titration
5. Cell culture and confocal laser scanning microscope
6. Cytotoxicity experiments
7. Photophysical and photochemical properties of 1
8. Photochromic process, 1H NMR and NOESY spectra of 1
9. Photophysical properties of 1 binding with DNA
10. Photochromic process of 1 with DNA
11. CLSM images for Hela cells incubated with 1
12. Characteristics of 1 and the intermediate products
13. References
Electronic Supplementary Material (ESI) for ChemComm.This journal is © The Royal Society of Chemistry 2014
2
1. Materials and general proceduresAll starting materials were obtained from commercial suppliers and were used as received. Solvents were dried and distilled under nitrogen before used. Glutaric acid, anhydrous aluminium chloride, titanium tetrachloride, 2-methyl thiophene and methyl iodide were supplied from Sinopharm Chemical Reagent Co. Ltd., Shanghai. Tetrakis(triphenylphosphine) palladium, n-butyl lithium, 4-bromopyridine hydrochloride were purchased from Sigma-Aldrich. 2-Methyl benzothiazole and 4-cholorquinoline were obtained from TCI. Oligo-DNA with 10 basepairs per chain, in 5-20 OD package was obtained from Sangon Biotech (Shanghai) Co. Ltd.
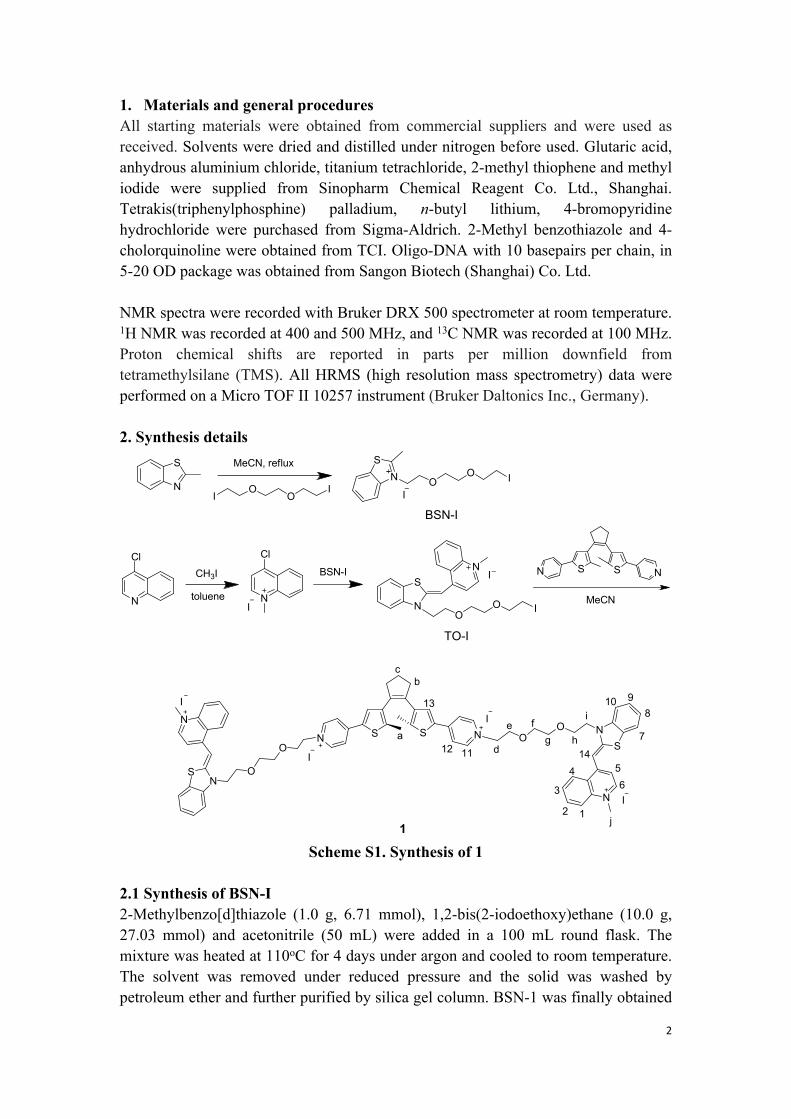
NMR spectra were recorded with Bruker DRX 500 spectrometer at room temperature. 1H NMR was recorded at 400 and 500 MHz, and 13C NMR was recorded at 100 MHz. Proton chemical shifts are reported in parts per million downfield from tetramethylsilane (TMS). All HRMS (high resolution mass spectrometry) data were performed on a Micro TOF II 10257 instrument (Bruker Daltonics Inc., Germany). 2. Synthesis details
NS
OO I
IN
S
IO
OI
N
ClCH3I
N
Cl
I
BSN-I
N
S
OO I
IN
TO-I
S SN NBSN-I
MeCN, reflux
toluene MeCN
1
S SN N
NS O
O
N
I
NS
OO
N I
I
I
12
3
4 56
7
8910
141112a
bc
13
d
e fg h
i
j
Scheme S1. Synthesis of 1
2.1 Synthesis of BSN-I2-Methylbenzo[d]thiazole (1.0 g, 6.71 mmol), 1,2-bis(2-iodoethoxy)ethane (10.0 g, 27.03 mmol) and acetonitrile (50 mL) were added in a 100 mL round flask. The mixture was heated at 110oC for 4 days under argon and cooled to room temperature. The solvent was removed under reduced pressure and the solid was washed by petroleum ether and further purified by silica gel column. BSN-1 was finally obtained
3
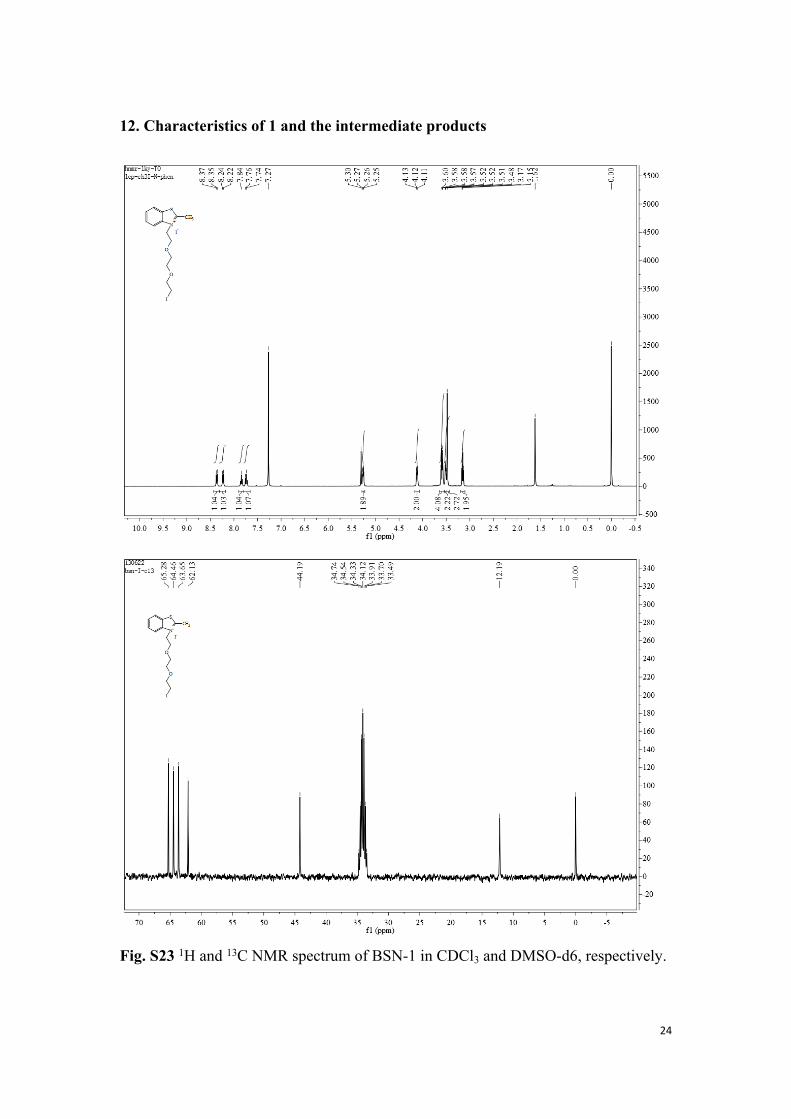
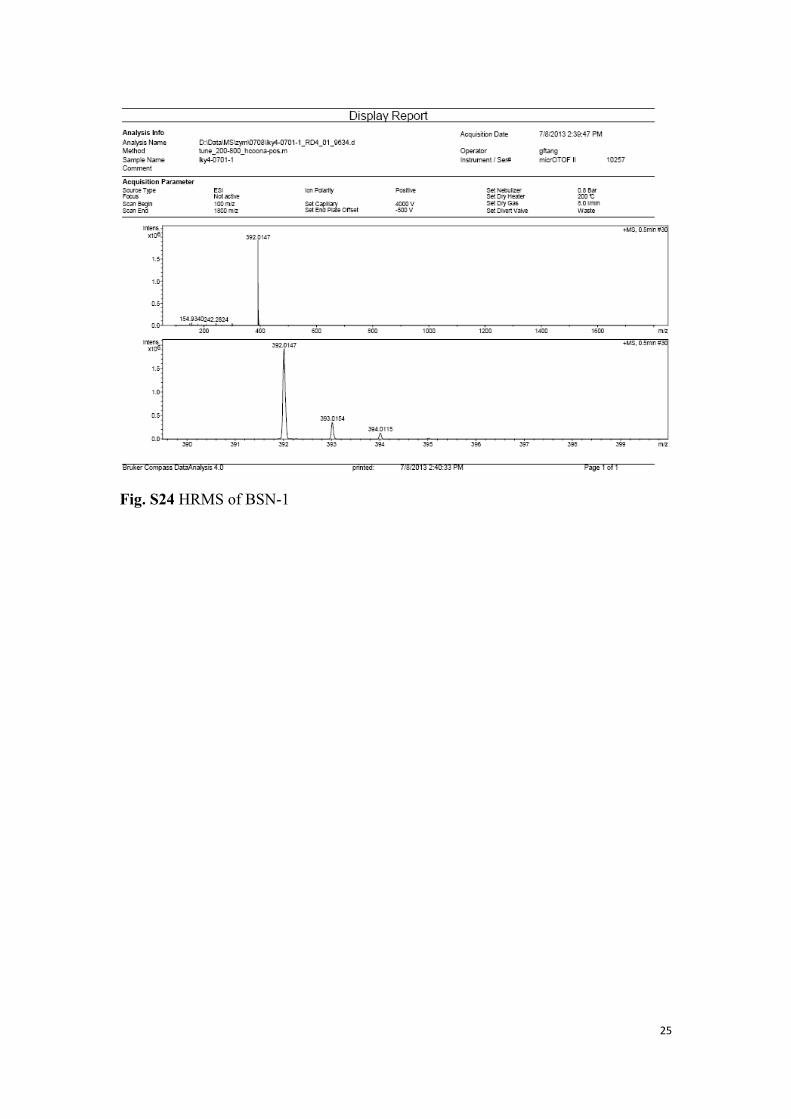
as a colorless solid (0.65 g, 1.25 mmol), yield: 18.66%. 1H NMR, (CDCl3, 400 MHz): δ (ppm), 3.15 (t, J = 6.4 Hz, 2H, CH2), 3.48 (s, 3H, CH3), 3.50- 3.52 (m, 2H, CH2), 3.57- 3.61 (m, 4H, CH2), 4.12 (t, J = 4.8 Hz, 2H, CH2), 5.26 (t, J = 4.8 Hz, 2H, CH2), 7.74 (t, J = 7.6 Hz, 1H, ArH), 7.84 (t, J = 7.6 Hz, 1H, ArH), 8.23 (d, J = 8.0 Hz, 1H, ArH), 8.36 (d, J = 8.0 Hz, 1H, ArH). 13C NMR (DMSO-d6, 100 MHz): δ (ppm), 12.19, 44.19, 62.13, 63.65, 64.46, 65.28, 111.69, 119.22, 122.66, 123.34, 123.85, 135.52, 172.84. HRMS (ESI, m/z): calcd for C14H19INO2S+ [M-I-]+, 392.0176; found, 392.0147. 2.1 Synthesis of 4-chloro-1-methylquinolin-1-ium iodide4-Chloroquinoline (0.5 g, 3.05 mmol), CH3I (0.56 g, 3.94 mmol) and 50 mL toluene were added in a 100 mL round bottom flask. The mixture was heated to 80oC overnight under argon protection. The slurry was filtered and the yellow solid was washed twice with 2 10 mL toluene to give pure product (0.75 g, 2.45 mmol), yield: 80.33%. 1H NMR, (DMSO, 400 MHz): δ (ppm), 3.01 (s, 3H, CH3), 4.59 (s, 3H, CH3), 8.07 (m, 2H, ArH), 8.28 (t, J = 8.0 Hz, 1H, ArH), 8.50 (d, J = 8.8 Hz, 1H, ArH), 8.55 (d, J = 8.8 Hz, 1H, ArH), 9.38 (d, J = 6.0 Hz, 1H, ArH).
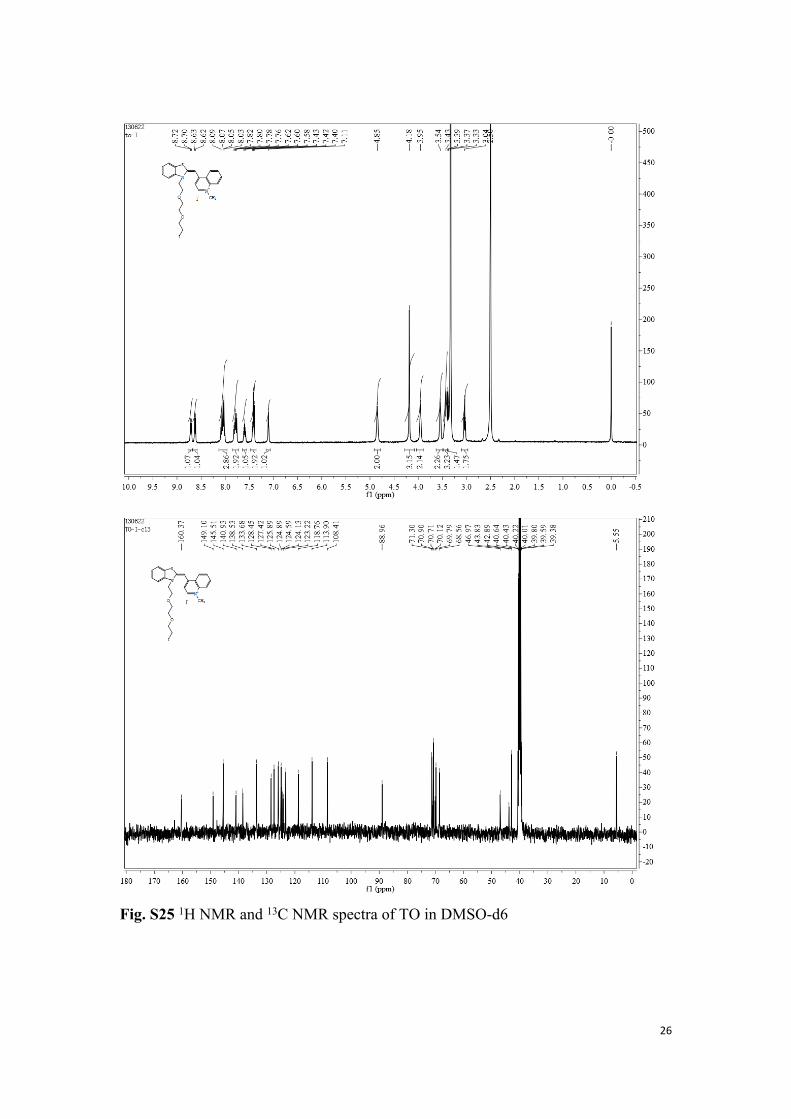
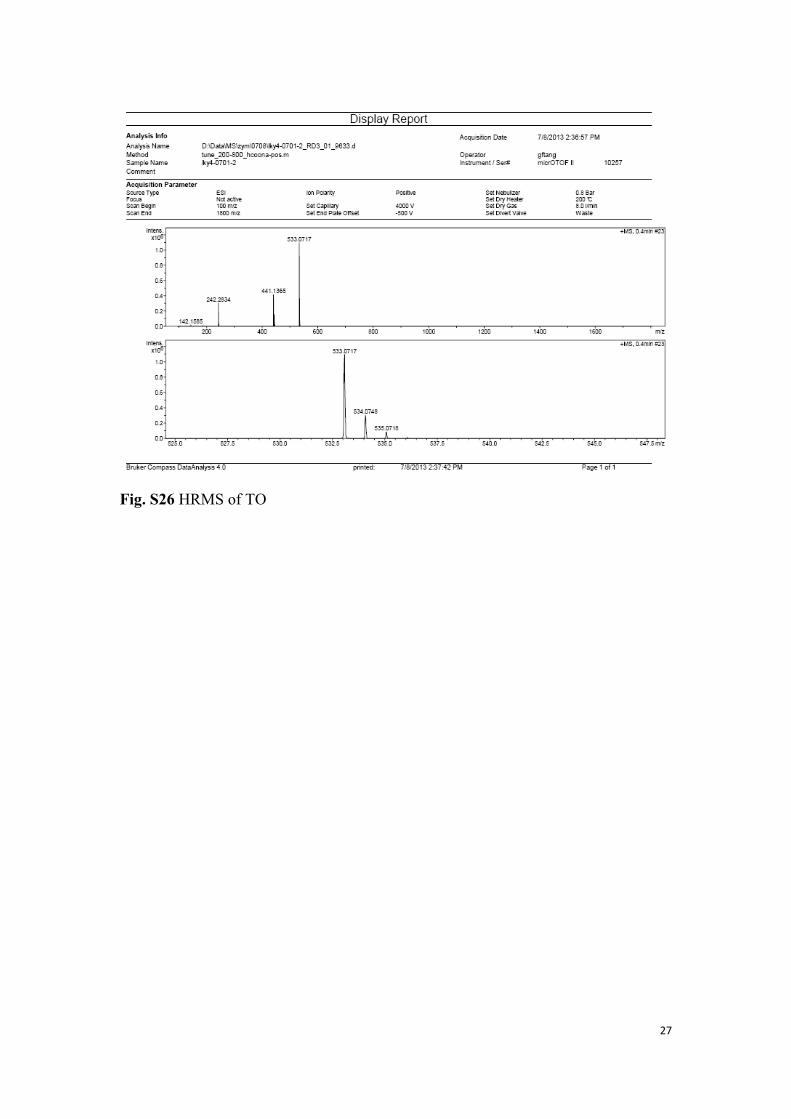
2.3 Synthesis of TO-ITo a 50 mL round bottom flask containing BSN-I (50.3 mg, 0.97 mmol) and 4-chloro-1-methylquinolin-1-ium iodide (33.5 mg, 0.97 mmol), 1,2-dichloroethane (1 mL), methanol (1 mL) and tri-ethyl amine (68 μL) were added. 1, 2 The mixture was stirred under argon for 3 hours at room temperature. The red solution was concentrated in vacuum and the residue was further purified by silica gel column (MeOH/CH2Cl2 = 2: 98, v/v). TO-I was obtained as a red solid (50.0 mg, 0.76 mmol), yield: 78.35%. 1H NMR (DMSO-d6, 400 MHz): δ (ppm), 3.04 (t, J = 6.4, 2H, CH2), 3.37- 3.42 (m, 5H, CH2), 3.54 (t, J = 4.8 Hz, 2H, CH2), 3.96 (t, J = 4.8 Hz, 2H, CH2), 4.19 (s, 3H, CH3), 4.85 (t, J = 4.8 Hz, 2H, CH2), 7.11 (d, J = 13.2 Hz, 1H, CH), 7.42 (t, J = 7.2 Hz, 2H, ArH), 7.60 (d, J = 8.4 Hz, 1H, ArH), 7.77 (t, J = 8.4 Hz, 1H, ArH), 7.81 (t, J = 8.4 Hz, 1H, ArH), 8.03- 8.09 (m, 3H, ArH), 8.62 (d, J = 7.2 Hz, 1H, ArH), 8.71 (d, J = 8.4 Hz, 1H, ArH). 13C NMR (DMSO-d6, 100 MHz): δ (ppm), 42.89, 43.83, 46.97, 68.56, 69.79, 70.12, 70.71, 70.90, 71.30, 88.96, 108.41, 113.90, 118.76, 123.22, 124.13, 124.59, 124.89, 125.89, 127.42, 128.45, 133.68, 138.53, 140.93, 145.51, 149.10, 160.37. HRMS (ESI, m/z): calcd for C24H26IN2O2S+ [M-I-]+, 533.0760; found: 533.0717.
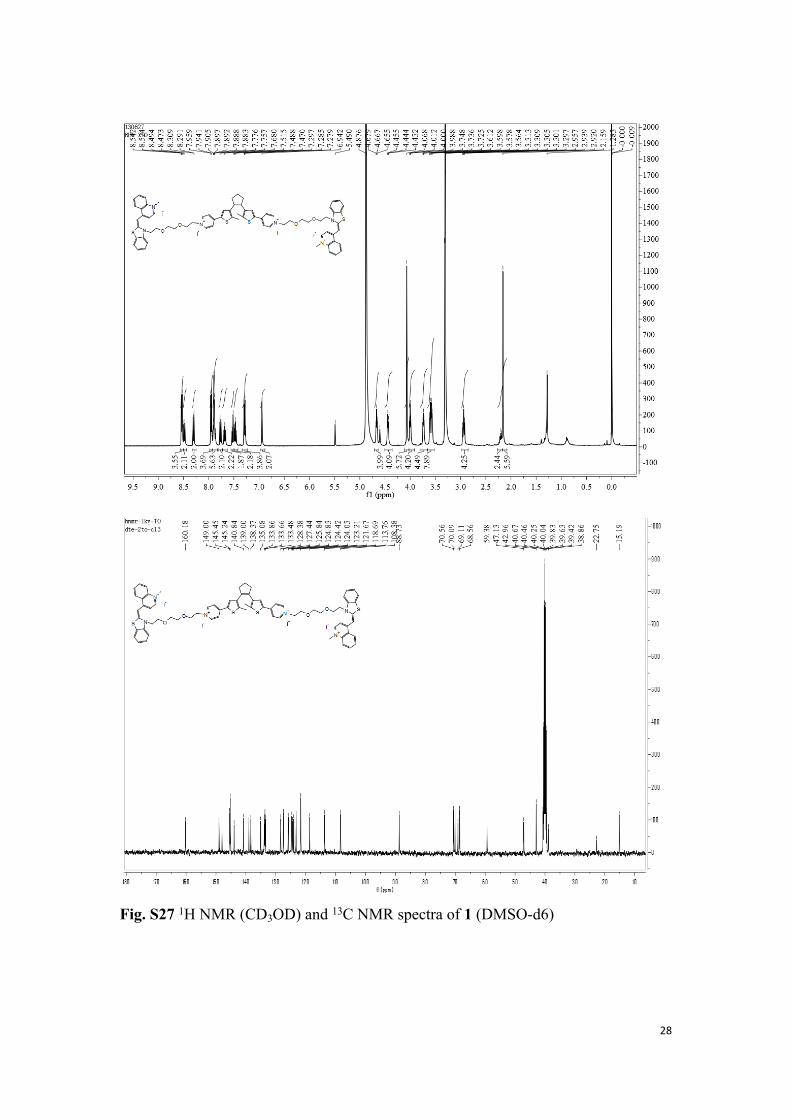
2.4 Synthesis of 1To a round bottom flask containing 1,2-bis(2-methyl-5-(pyridin-4-yl)thiophen-3-yl) cyclopent-1-ene (50 mg, 0.12 mmol) 3, 4 and TO-I (175.4 mg, 0.266 mmol), acetonitrile 30 mL was added. The mixture was heated at 110oC under argon for 7 days. The solvent was removed in vacuum and the residue was further purified by silica gel column, eluted with methanol/dichloromethane from 1: 100 to 1: 10. 1 was obtained as a red solid (100 mg, 0.0576 mmol), yield: 48%. 1H NMR, (CD3OD, 400 MHz): δ (ppm), 2.16 (s, 6H, CH3), 2.18 (m, 2H, CH2), 2.94 (t, J = 7.6 Hz, 4H, CH2),
4
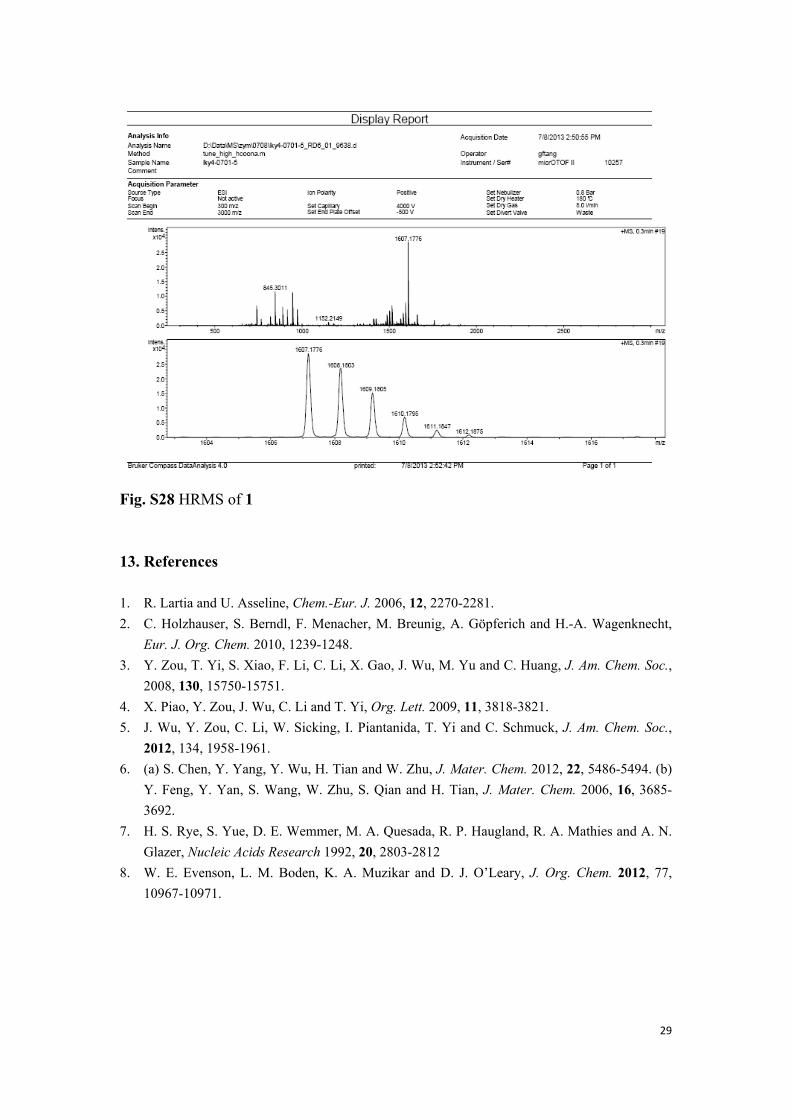
3.56- 3.61 (m, 8H, CH2), 3.74 (t, J = 4.4 Hz, 4H, CH2), 4.00 (t, J = 4.8 Hz, 4H, CH2), 4.07 (s, 6H, CH3), 4.44 (t, J = 4.8 Hz, 4H, CH2), 4.67 (t, J = 4.8 Hz, 4H, CH2), 6.94 (s, 2H, ArH), 7.27- 7.30 (m, 4H), 7.45- 7.54 (m, 4H, ArH), 7.66- 7.70 (m, 2H, ArH), 7.77 (t, J = 7.6 Hz, 2H, ArH), 7.87- 7.96 (m, 10H, ArH), 8.30 (d, J = 7.2 Hz, 2H, ArH), 8.48 (d, J = 8.4 Hz, 2H, ArH), 8.53 (d, J = 8.4 Hz, 4H, ArH). 13C NMR (DMSO-d6, 100 MHz): δ (ppm), 15.19, 22.75, 42.96, 47.13, 59.38, 68.56, 69.11, 70.09, 70.56, 88.73, 108.38, 113.76, 118.69, 121.67, 123.21, 124.03, 124.42, 124.83, 125.84, 127.44, 128.38, 133.48, 133.66, 133.86, 135.08, 138.37, 139.00, 140.84, 143.97, 145.24, 145.45, 148.00, 149.00, 160.18. HRMS (ESI, m/z): calcd for C73H74I3N6O4S4
+ [M-I-]+, 1607.1783; found: 1607.1776.
3. TechniquesFluorescent spectra were tested on Edinburgh Instruments FLS 920 (or FLS 900). Absorption spectra were recorded on a Shimadzu UV-vis 2550 spectroscope. Fluorescent quantum yield in aqueous solution was measured using Rh-B in ethanol solution as a standard. CD (circular dichroism) spectra were performed on an MOS-450 spectropolarimeter. 1D and 2D 1H NMR were performed on a Bruker DRX 500 spectrometer at room temperature. The photo cyclization process of 1 was performed by UV light, generated by a low pressure mercury lamp with 360 nm long wavelength pass filter. In the visible light induced ring open process, a 670 nm laser (I = 0.8 A) was used as light source.
4. DNA titration Two kinds of DNA with 10 basepairs per chain was used, namely Poly(dA-dT)10 (AT10): ATATATATATATATATATAT, and Poly(dC-dG)10 (CG10): CGCGCGCGCGCGCGCGCGCG. The stock solution of 1 (5.0 10-4 M) was made in pure water with 2.5% DMSO. The stock solution was diluted in Tris buffer for DNA titration experiments. In the process of titration, aliquot of oligo DNA stock solution in 100 μM chain concentration (1 mM in basepair concentration) was added to a buffer solution (pH = 7.2) containing 5 mM Tris-HCl, 5 mM NaCl and 5 μM 1. The mixture was stirred for 10 min before spectral testing.5 The process was traced with absorption and fluorescence spectra at intervals.
5. Cell culture and confocal laser scanning microscopyHela cells were planted on glass dishes and allowed to adhere for 12 h. The cells were then washed and incubated with 1 in nutrient solution or physiological saline (0.9% NaCl, pH = 7.0) for 15 to 60 min in 37oC incubator. Cell imaging was performed after washing the cells with physiological saline or nutrient solution on Confocal Laser Scanning Microscope (CLSM).
Fix cell co-localization with Hoechst33258. The cells were fixed with paraformaldehyde at 4oC for 30 min, washed thoroughly with nutrient solution or physiological saline. The fixed cells were then incubated with 1 (5 μM) for 30 min at 37oC incubator, washed with saline buffer and incubated in Hoechst33258 (10 μM)
5
for another 30 min, washed with saline and watched on CLSM.
Luminescence imaging on CLSM (xy-scan, xz-scan and λ-scan) was performed with an Olympus confocal fluorescence microscope and a 60 oil immersion objective lens. Cell incubated with 1 were excited at 488 nm with a semiconductor laser, the emission band was collected at 520- 620 nm. Hoechst33258 was excited by 405 nm laser and collected at 420-480 nm. Quantization by line plots was accomplished with the software package provided by Olympus instruments. For the photochromism of 1 in cell imaging, a 405 nm laser was used as light source to induce photocyclization and the reverse process was irradiated with a 633 nm laser installed in the instrument.
6. Cytotoxicity experimentsMTT assay. The cytotoxicity was performed by 3-(4,5-dimethylthiazol-2-yl) -2,5-diphenyltetrazolium bromide (MTT) assay with Hela cell lines. Cells growing in log phase were planted into a 96-well cell culture plate at 1 105/ well. The cells were incubated for 12 h at 37 oC under 5% CO2 in an incubator. A solution of 1 (100.0 μL/ well) at concentrations of 5.0, 10.0, 20.0, 40.0, 60.0 μM in nutrient with 1‰ DMSO was added to the wells of the treatment group, respectively. In control group, 100 μL of nutrient with 1‰ DMSO was used. The cells were incubated at 37oC under 5% CO2 for 6 h. The solvent was removed from 96 well plate, then washed with nutrient solution. A combined solution of 5 mg/mL MTT in PBS was diluted to 10 times with nutrient solution and added to each well of the 96 well plate assay in 100.0 μL/well. The cells were incubated for an additional 4 hours. The solvent was removed and Formazan extraction was performed with DMSO, the quantity was determined colorimetrically using a Mutil reader (TECAN, Infinite M200). The absorbance values at wavelengths of 570 and 690 nm were collected, the absorption at 690 nm was used as correction of interference. The following formula was used to calculate the viability of cell growth: Viability (%) = (mean of absorbance value of treatment group/mean absorbance value of control) 100.2
6
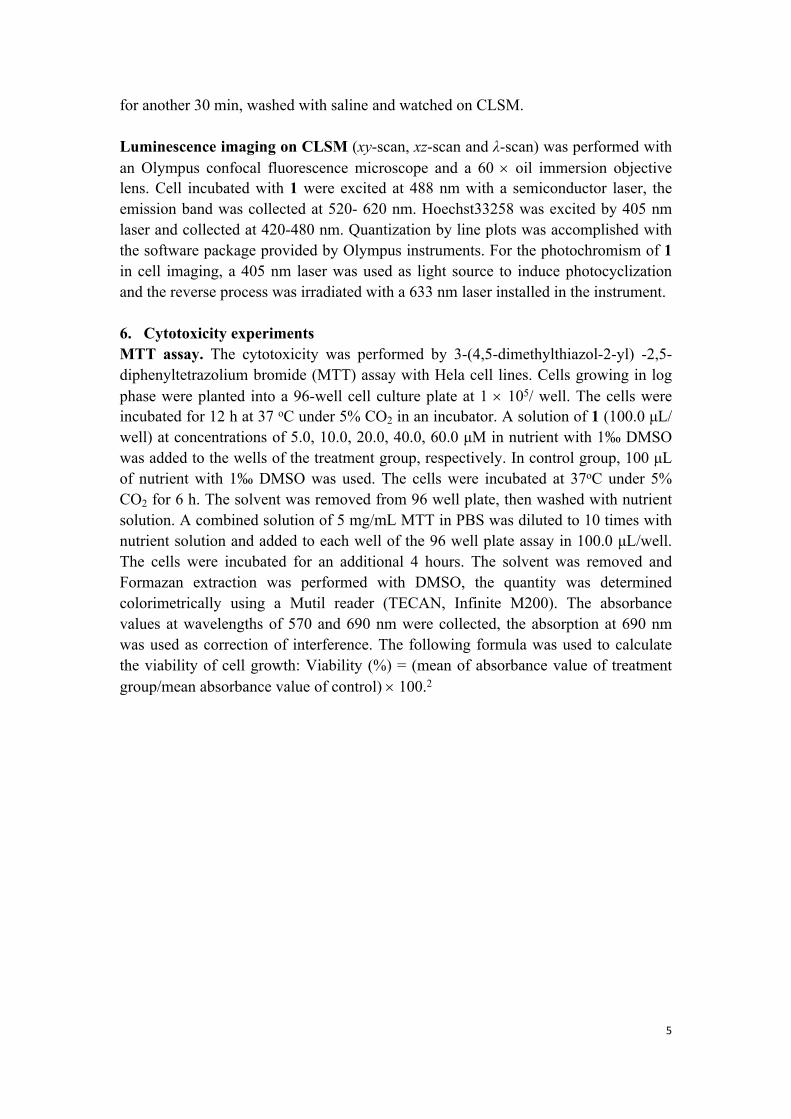
7. Photophysical and photochemical properties of 1
Table S1 Photophysical and photochemical properties of 1 in different conditionsAbsorption Emission Photochromism
Medium, a state λ/nm (ε/dm3mol
-1cm
-1 10
-3)
b λem
/nm ØFL
c Conversion
at PSSd Ø
o→c
e
open292 (30), 328 (29), 383 (31),
475sh (64), 504 (115)
570
< 0.01%
acetonitrile
close 286 (50), 504 (115), 680 (20) - -
86% 46.9%
H2O open292 (31), 382 (29), 475 (100),
504sh (48)
620 0.25% -
open340 (25), 406 (26), 492 (78),
514sh (42)590 2.4% With AT10
(R= 1.3: 1)
Binding I close339 (14), 492sh (38), 514 (41),
700 (11)- -
90% 49.3%
open337 (21), 398 (22), 492sh (52),
514 (74)550 3.4% With AT10
(R = 10: 1)
Binding II close335 (18), 492sh (53), 514 (80),
710 (15)- -
-f 52.0%
open337 (21), 398 (22), 482sh (52),
510 (74)540 8.3%
With CG10
(R = 3: 1)close
335 (18), 482sh (53), 510 (80), 710 (15)
- -
-f 47.3%
a: The initial concentration of 1 is 5.0 10-6 M, R: molar ratio of basepair to 1. The absorption and emission spectra were collected after 10 min stirring in the presence of DNA. All the data were collected at 25oC. b: sh, shoulder peak. c: Fluorescent quantum yield was measured using Rhodamine-B in absolute ethanol solution as a standard. d: Photochromic transformation yield in PSS (the photo stationary state) was measured by signal of 1H NMR at 25oC. e: Photochromic quantum yields were calculated according to method reported by literature. 6 f: The 1H NMR change before and after UV light irradiation is unconspicuous due to the dominant signals of DNA.
7
320 360 400 440 480 520 5600.0
0.5
1.0
1.5
2.0Ab
s.
Wavelength / nm
1.0 x 10⁻⁶ M 2.0 x 10⁻⁶ M 4.0 x 10⁻⁶ M 6.0 x 10⁻⁶ M 8.0 x 10⁻⁶ M 1.0 x 10⁻⁵ M 1.2 x 10⁻⁵ M 1.4 x 10⁻⁵ M 1.6 x 10⁻⁵ M 1.8 x 10⁻⁵ M 2.0 x 10⁻⁵ M 383
504a
0 5 10 15 200.0
0.4
0.8
1.2
1.6
2.0
2.4
Abs.
C1 / uM
Absorbance at 504 nm Absorbance at 476 nm A476 / A504
c
320 360 400 440 480 520 5600.0
0.2
0.4
0.6
0.8
1.0
Abs.
Wavelength / nm
2.0 x 10⁻⁷ M 4.0 x 10⁻⁷ M 6.0 x 10⁻⁷ M 8.0 x 10⁻⁷ M 1.0 x 10⁻⁶ M 2.0 x 10⁻⁶ M 4.0 x 10⁻⁶ M 6.0 x 10⁻⁶ M 8.0 x 10⁻⁶ M 1.0 x 10⁻⁵ M
476
505
b
0 2 4 6 8 10
0.0
0.2
0.4
0.6
0.8
1.0
Abs.
C1 / uM
Absorbance at 476 nm, H2O Absorbance at 504 nm A504/ A476
d
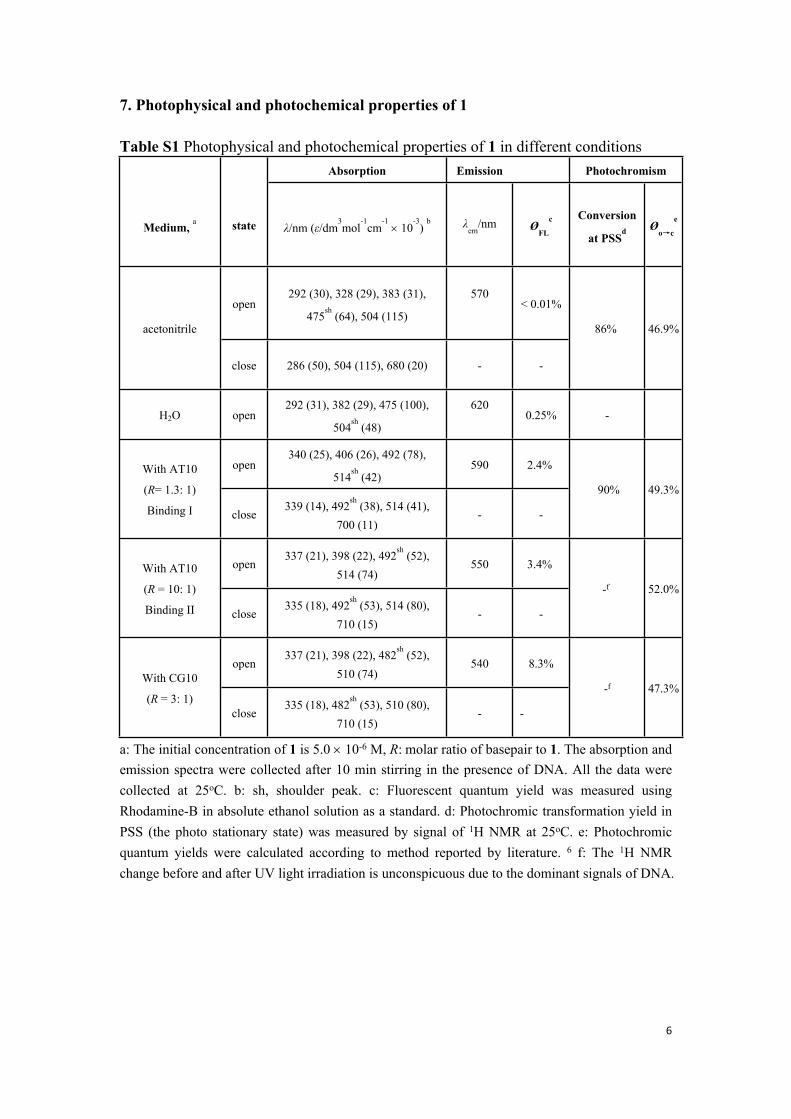
Fig. S1 The absorption spectra of 1 in (a) acetonitrile from 1.0 10-6 to 2.0 10-5 M and (b) water from 2.0 10-7 M to 1.0 10-5 M, 1 cm cell, room temperature. (c) and (d) show the linear relationship between absorbance of the maximum absorption and the shoulder ones with the concentration of 1 in acetonitrile and water, respectively.
8
420 450 480 510 540 570
0.0
0.2
0.4
0.6
0.8
1.0Ab
s.
Wavelength / nm
100 (H2O, V%) 80 70 60 50 40 30 20 0
476
504a
500 550 600 650 700 7500.0
0.2
0.4
0.6
0.8
1.0
1.2
Inte
nsity
/ a.u
.
Wavelength / nm
100% (H2O, V%) 90% 80% 70% 60% 50% 40% 30% 0
620
540
b
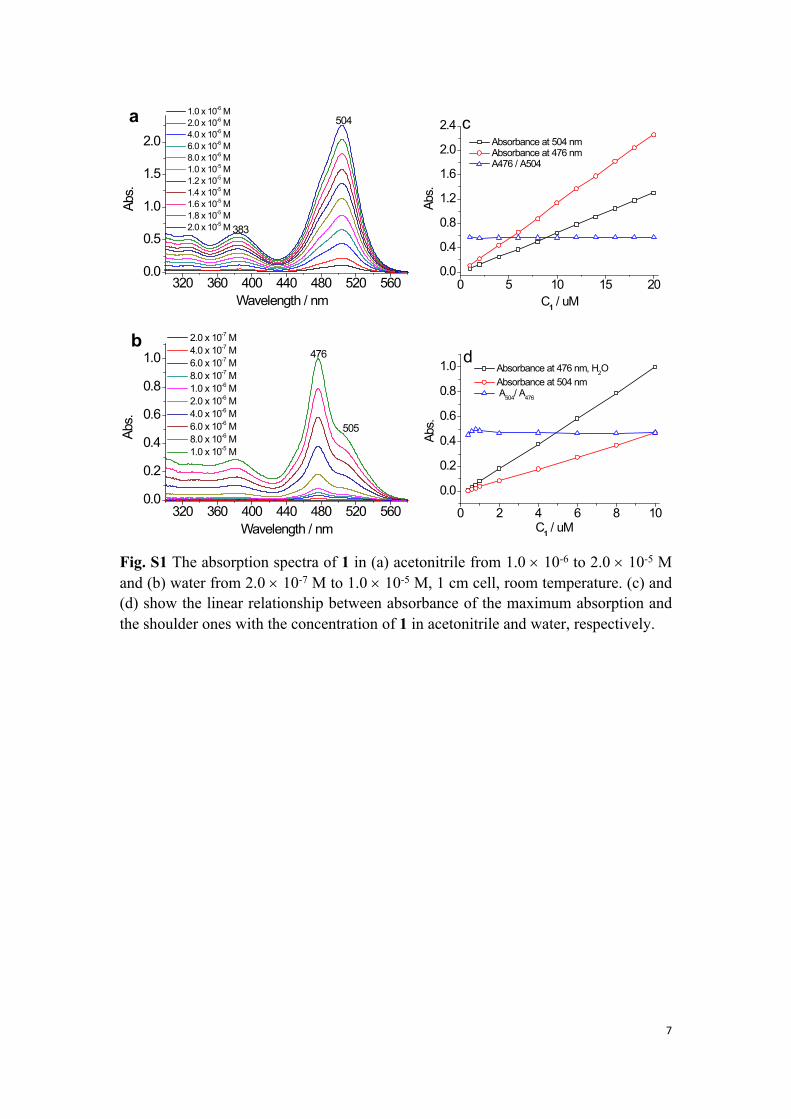
Fig. S2 The absorption (a) and emission (b) spectra of 1 (1.0 10-5 M) in a mixed solvents of acetonitrile and water with different volume ratio, 1 cm cell, room temperature, λex = 480 nm.
9
8. Photochromic process and 1H NMR NOESY spectra of 1
300 400 500 600 700 8000.0
0.1
0.2
0.3
0.4
0.5
0.6
Abs.
Wavelength / nm
1 in MeCN 5 M Uv = 30 s 60 s 90 s 120 s 180 s 210 s 240 s 270 s 300 s 330 s 360 s 420 s 480 s 540 s 600 s
a
0 100 200 300 400 500 6000.00
0.02
0.04
0.06
0.08
0.10
Abso
rban
ce a
t 682
nm
Time / Sec
c
300 400 500 600 700 8000.0
0.1
0.2
0.3
0.4
0.5
0.6
Abs.
Wavelength / nm
1, PSS 670 nm = 20 s 40 s 60 s 80 s 100 s 120 s 140 s 180 s 300 s
b
0 50 100 150 200 250 3000.00
0.02
0.04
0.06
0.08
0.10Ab
sorb
ance
at 6
82 n
m
Time / Sec
d
UV
670 nm
e
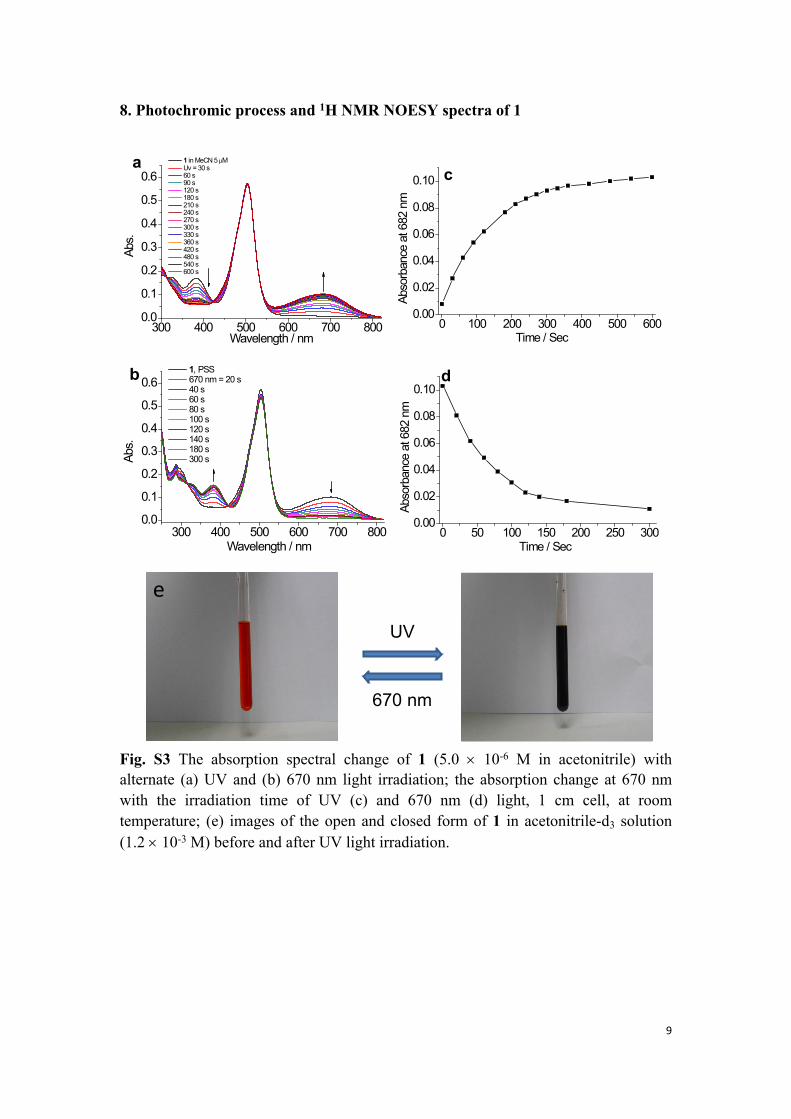
Fig. S3 The absorption spectral change of 1 (5.0 10-6 M in acetonitrile) with alternate (a) UV and (b) 670 nm light irradiation; the absorption change at 670 nm with the irradiation time of UV (c) and 670 nm (d) light, 1 cm cell, at room temperature; (e) images of the open and closed form of 1 in acetonitrile-d3 solution (1.2 10-3 M) before and after UV light irradiation.
10
2.02.42.83.23.64.04.46.87.27.68.08.4f1 (ppm)
1
2
3
4
5
6
7
8
9
10
11
12
670 nm 24 min
670 nm 36 min
UV 6 min
UV 2 min
670 nm 48 min
Original
UV 120 min
UV 30 min
UV 18 min
670 nm 12 min
UV 12 min
670 nm 60 min
a
8.5 8.0 7.5 7.0 4.5 4.0 3.5 3.0 2.5 2.00
200
400
600
800
1000
1200
Inte
nsity
/ a.u
.
Chemical Shift/ ppm
Open state PSS
S SR R
H
H
H
S SR R
H
H
H
b
a
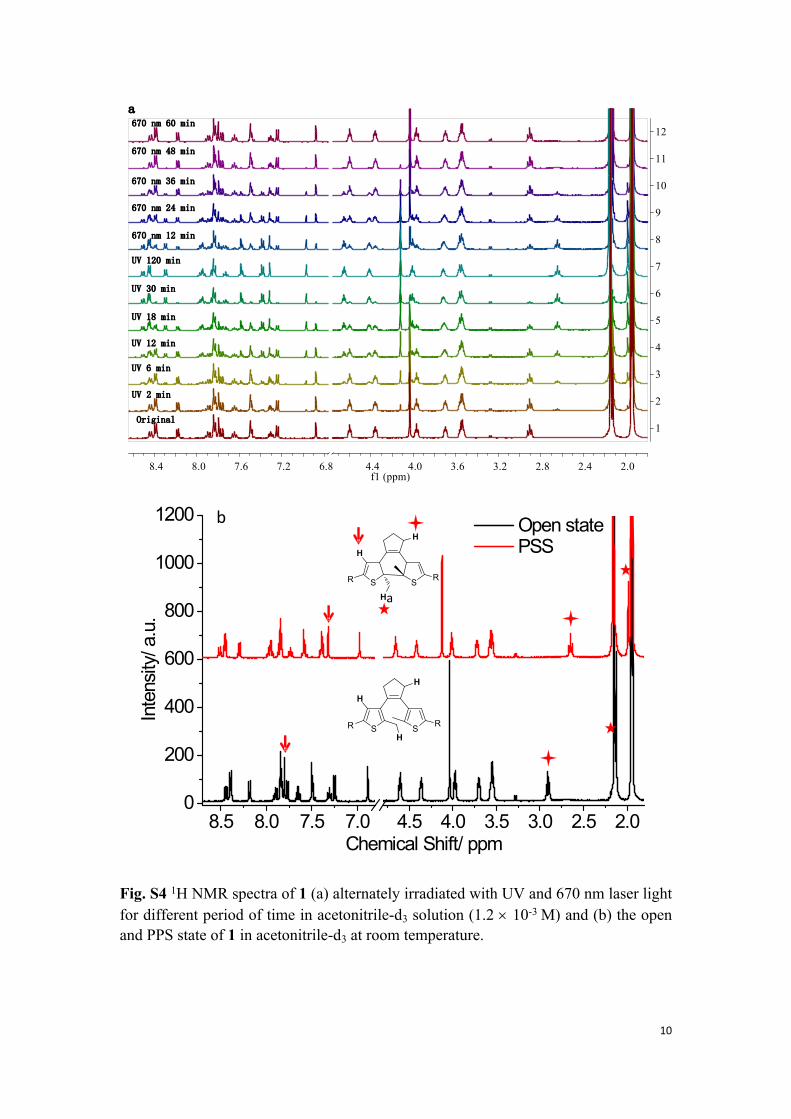
Fig. S4 1H NMR spectra of 1 (a) alternately irradiated with UV and 670 nm laser light for different period of time in acetonitrile-d3 solution (1.2 10-3 M) and (b) the open and PPS state of 1 in acetonitrile-d3 at room temperature.
11
360 400 440 480 520 560 600 640
0.000.050.100.150.200.250.300.350.40
Abso
rban
ce
Wavelength/ nm
5 M 1 UV = 30 s 60 s 90 s 120 s 150 s 180 s
476 nm
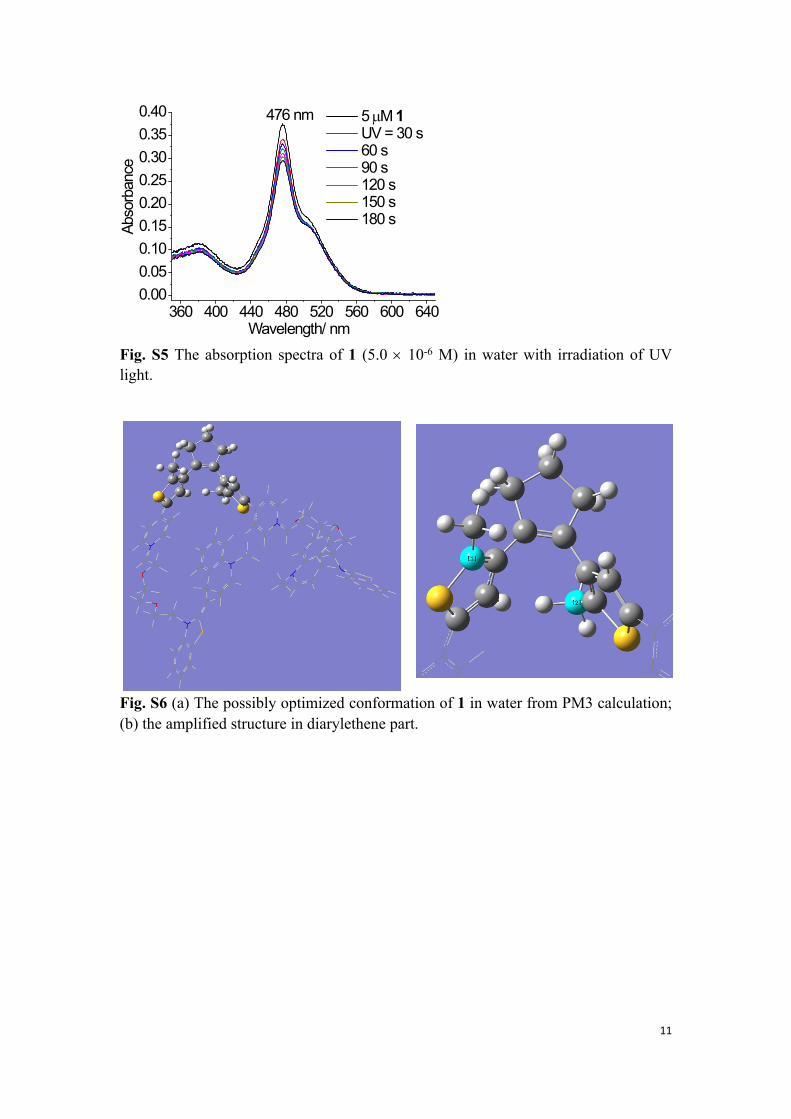
Fig. S5 The absorption spectra of 1 (5.0 10-6 M) in water with irradiation of UV light.
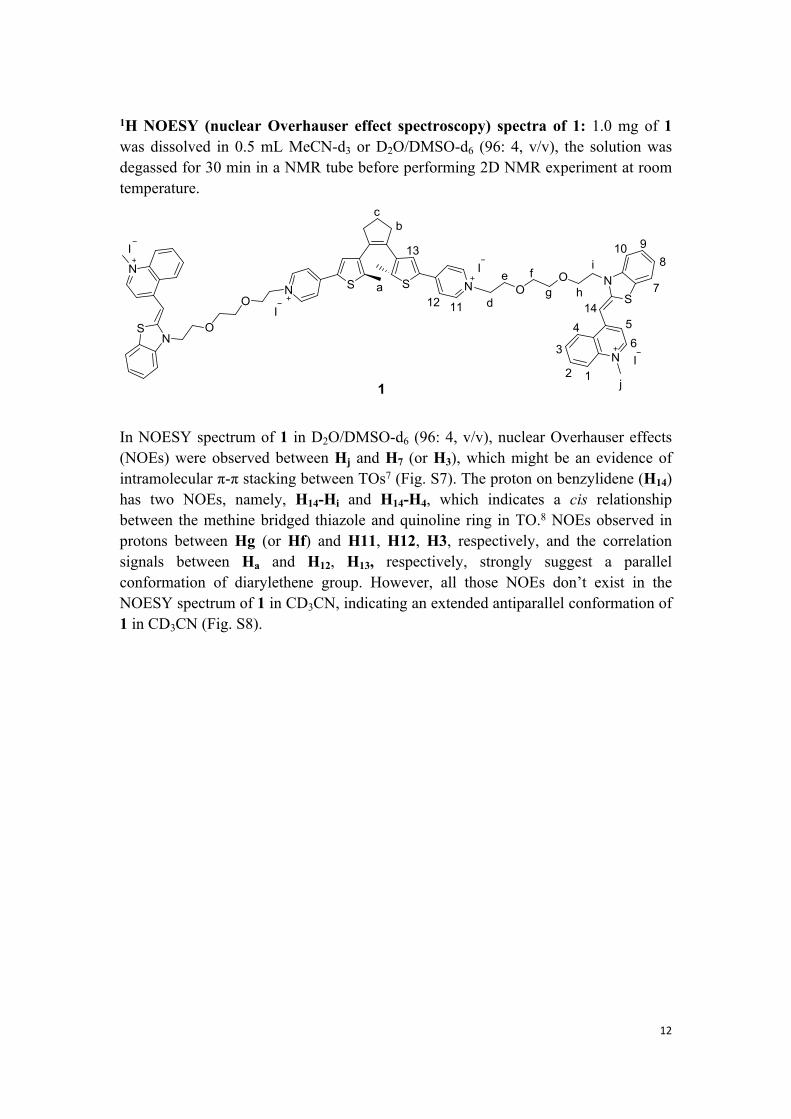
Fig. S6 (a) The possibly optimized conformation of 1 in water from PM3 calculation; (b) the amplified structure in diarylethene part.
12
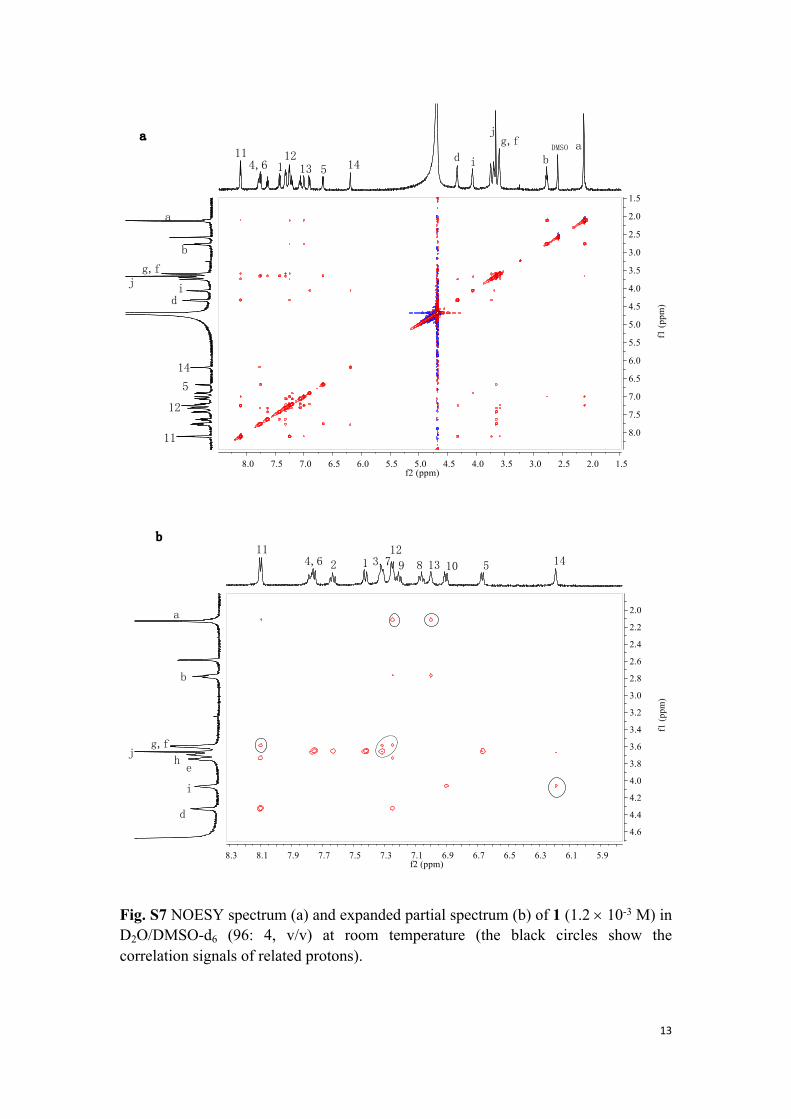
1H NOESY (nuclear Overhauser effect spectroscopy) spectra of 1: 1.0 mg of 1 was dissolved in 0.5 mL MeCN-d3 or D2O/DMSO-d6 (96: 4, v/v), the solution was degassed for 30 min in a NMR tube before performing 2D NMR experiment at room temperature.
S SN N
NS O
O
N
I
NS
OO
N I
I
I
12
3
4 56
7
8910
141112a
bc
13
d
e fg h
i
j1
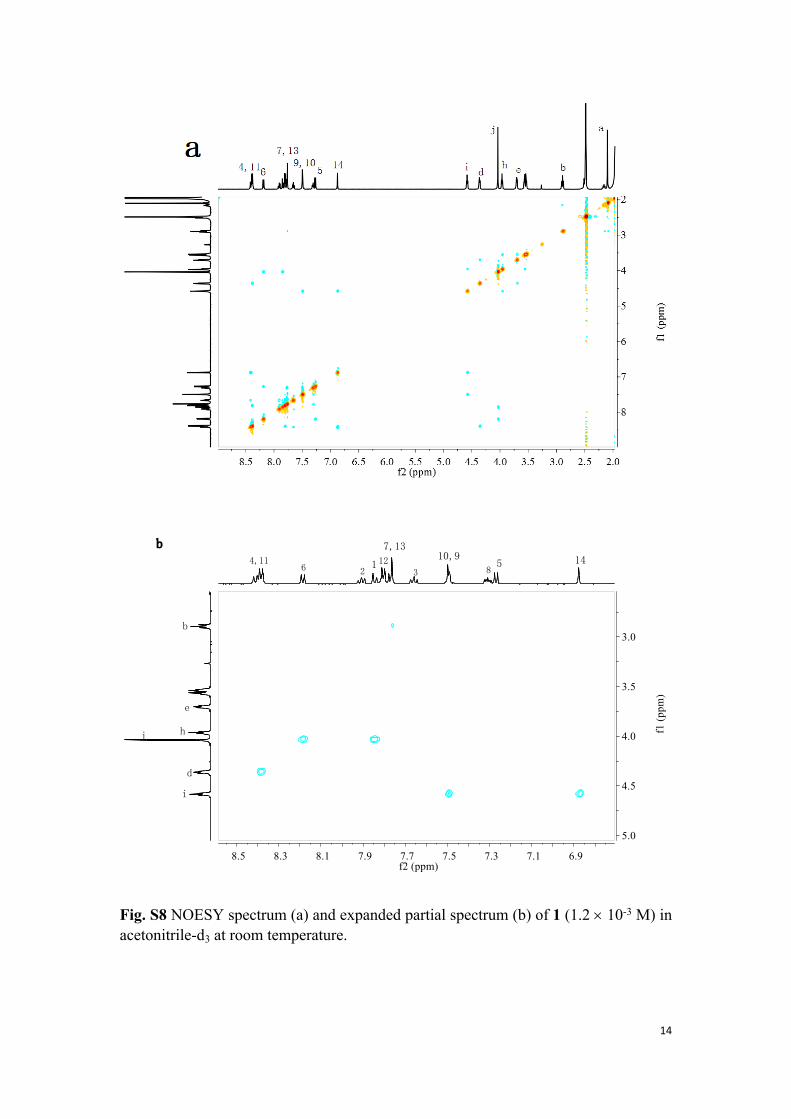
In NOESY spectrum of 1 in D2O/DMSO-d6 (96: 4, v/v), nuclear Overhauser effects (NOEs) were observed between Hj and H7 (or H3), which might be an evidence of intramolecular π-π stacking between TOs7 (Fig. S7). The proton on benzylidene (H14) has two NOEs, namely, H14-Hi and H14-H4, which indicates a cis relationship between the methine bridged thiazole and quinoline ring in TO.8 NOEs observed in protons between Hg (or Hf) and H11, H12, H3, respectively, and the correlation signals between Ha and H12, H13, respectively, strongly suggest a parallel conformation of diarylethene group. However, all those NOEs don’t exist in the NOESY spectrum of 1 in CD3CN, indicating an extended antiparallel conformation of 1 in CD3CN (Fig. S8).
13
1.52.02.53.03.54.04.55.05.56.06.57.07.58.0f2 (ppm)
1.5
2.0
2.5
3.0
3.5
4.0
4.5
5.0
5.5
6.0
6.5
7.0
7.5
8.0
f1 (p
pm)
a
1451312
14,611
b
g,fj i
d
ab
g,fj
id
14
5
12
11
DMSOa
5.96.16.36.56.76.97.17.37.57.77.98.18.3f2 (ppm)
2.0
2.2
2.4
2.6
2.8
3.0
3.2
3.4
3.6
3.8
4.0
4.2
4.4
4.6
f1 (p
pm)
a
14513
12
1014,6 2
113,7 89
b
g,fj
he
i
d
b
Fig. S7 NOESY spectrum (a) and expanded partial spectrum (b) of 1 (1.2 10-3 M) in D2O/DMSO-d6 (96: 4, v/v) at room temperature (the black circles show the correlation signals of related protons).
14
6.97.17.37.57.77.98.18.38.5f2 (ppm)
3.0
3.5
4.0
4.5
5.0
f1 (p
pm)
144,11
i
e
7,13
b
10,9516
h
d
j
212
3 8
b
Fig. S8 NOESY spectrum (a) and expanded partial spectrum (b) of 1 (1.2 10-3 M) in acetonitrile-d3 at room temperature.
15
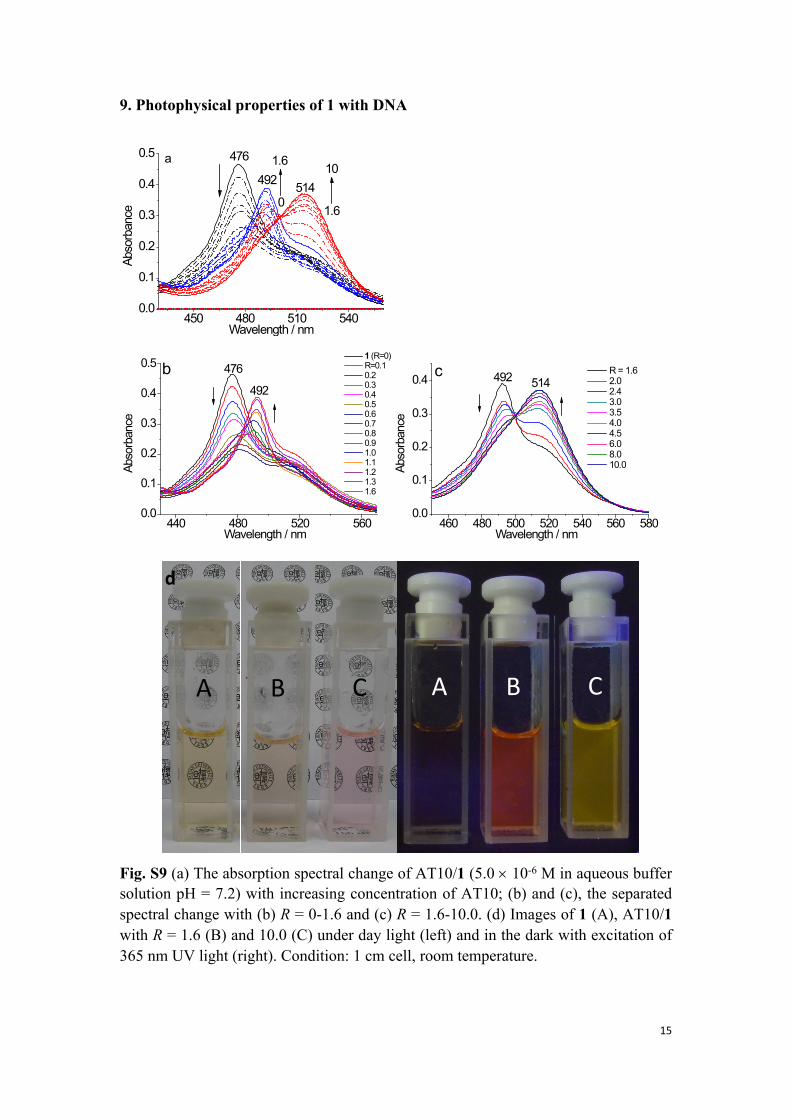
9. Photophysical properties of 1 with DNA
450 480 510 5400.0
0.1
0.2
0.3
0.4
0.5
Abso
rban
ce
Wavelength / nm
476
492 514
1.6
10
0
1.6a
440 480 520 5600.0
0.1
0.2
0.3
0.4
0.5
Abso
rban
ce
Wavelength / nm
1 (R=0) R=0.1 0.2 0.3 0.4 0.5 0.6 0.7 0.8 0.9 1.0 1.1 1.2 1.3 1.6
476
492
b
460 480 500 520 540 560 5800.0
0.1
0.2
0.3
0.4Ab
sorb
ance
Wavelength / nm
R = 1.6 2.0 2.4 3.0 3.5 4.0 4.5 6.0 8.0 10.0
492 514c
A B C A B C
d
Fig. S9 (a) The absorption spectral change of AT10/1 (5.0 10-6 M in aqueous buffer solution pH = 7.2) with increasing concentration of AT10; (b) and (c), the separated spectral change with (b) R = 0-1.6 and (c) R = 1.6-10.0. (d) Images of 1 (A), AT10/1 with R = 1.6 (B) and 10.0 (C) under day light (left) and in the dark with excitation of 365 nm UV light (right). Condition: 1 cm cell, room temperature.
16
500 550 600 650 700 7500.0
0.2
0.4
0.6
0.8
1.0In
tens
ity/ a
.u.
Wavelength / nm
590
550
a
0.0 0.2 0.4 0.6 0.8 1.00.0
0.2
0.4
0.6
0.8
1.0
Norn
alize
d in
tens
ity /
a.u.
Cbp/ C1+bp
550 nm 590 nm
0.5
0.75
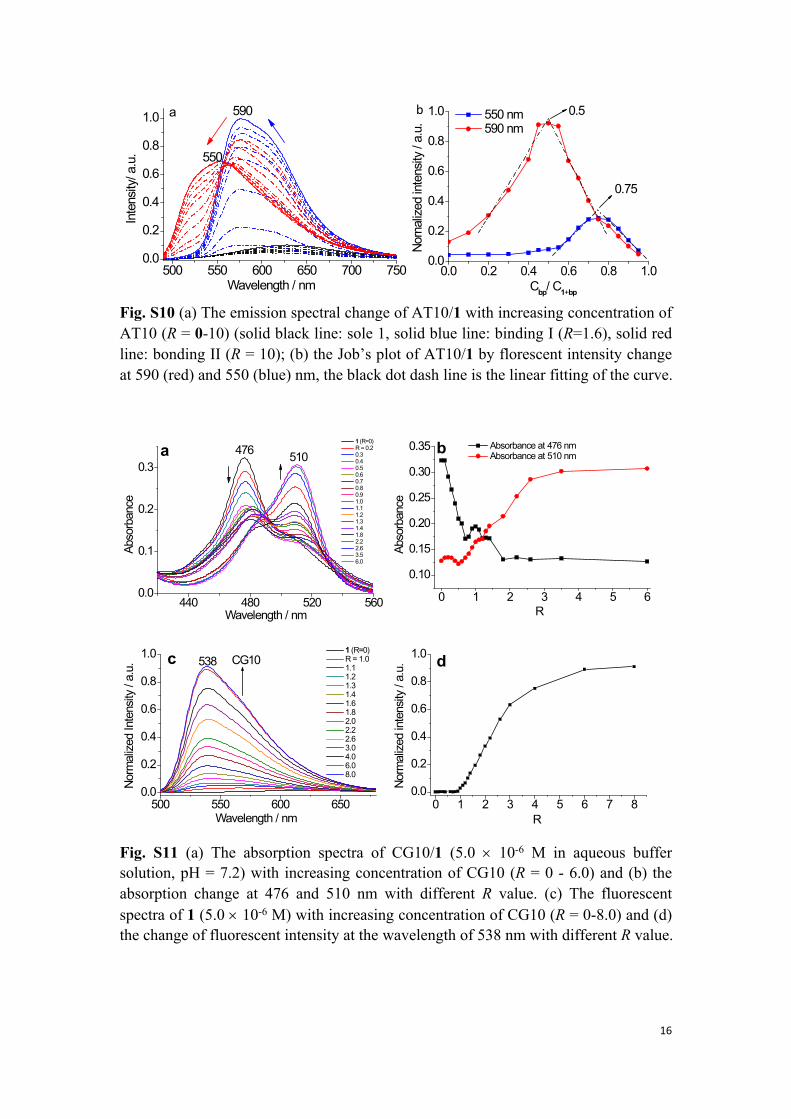
Fig. S10 (a) The emission spectral change of AT10/1 with increasing concentration of AT10 (R = 0-10) (solid black line: sole 1, solid blue line: binding I (R=1.6), solid red line: bonding II (R = 10); (b) the Job’s plot of AT10/1 by florescent intensity change at 590 (red) and 550 (blue) nm, the black dot dash line is the linear fitting of the curve.
440 480 520 560
0.0
0.1
0.2
0.3
Abso
rban
ce
Wavelength / nm
1 (R=0) R = 0.2 0.3 0.4 0.5 0.6 0.7 0.8 0.9 1.0 1.1 1.2 1.3 1.4 1.8 2.2 2.6 3.5 6.0
476 510a
0 1 2 3 4 5 6
0.10
0.15
0.20
0.25
0.30
0.35
Abso
rban
ce
R
Absorbance at 476 nm Absorbance at 510 nmb
500 550 600 6500.0
0.2
0.4
0.6
0.8
1.0
Norm
alize
d In
tens
ity /
a.u.
Wavelength / nm
1 (R=0) R = 1.0 1.1 1.2 1.3 1.4 1.6 1.8 2.0 2.2 2.6 3.0 4.0 6.0 8.0
538c CG10
0 1 2 3 4 5 6 7 80.0
0.2
0.4
0.6
0.8
1.0
Norm
alize
d in
tens
ity /
a.u.
R
d
Fig. S11 (a) The absorption spectra of CG10/1 (5.0 10-6 M in aqueous buffer solution, pH = 7.2) with increasing concentration of CG10 (R = 0 - 6.0) and (b) the absorption change at 476 and 510 nm with different R value. (c) The fluorescent spectra of 1 (5.0 10-6 M) with increasing concentration of CG10 (R = 0-8.0) and (d) the change of fluorescent intensity at the wavelength of 538 nm with different R value.
b
17
500 550 600 650 7000.0
0.2
0.4
0.6
0.8
1.0In
tens
ity /
a.u.
Wavelength / nm
1/CG10=10: 0 9: 1 8: 2 7: 3 6: 4 5: 5 4: 6 3: 7 2: 8 1: 9
536a
0.0 0.2 0.4 0.6 0.8 1.00.0
0.2
0.4
0.6
0.8
1.0
Inte
nsity
/ a. u
.
[bp]/ [1+bp]
0.75b
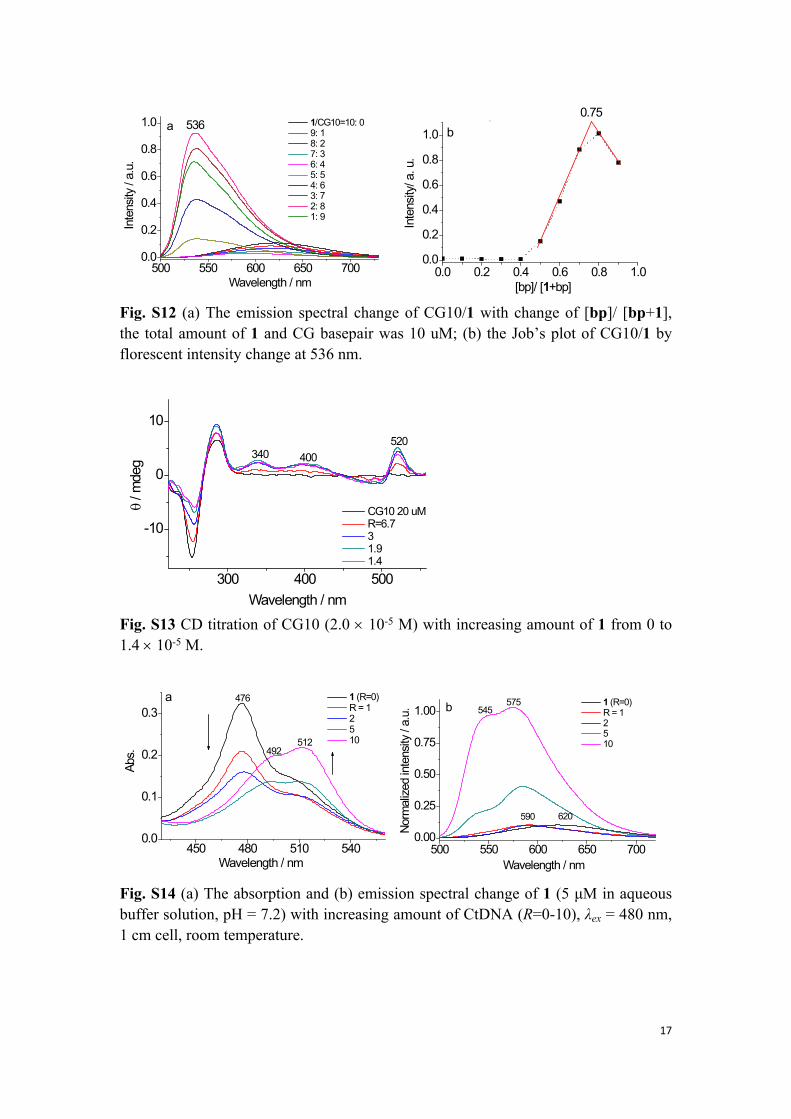
Fig. S12 (a) The emission spectral change of CG10/1 with change of [bp]/ [bp+1], the total amount of 1 and CG basepair was 10 uM; (b) the Job’s plot of CG10/1 by florescent intensity change at 536 nm.
300 400 500
-10
0
10
/ m
deg
Wavelength / nm
CG10 20 uM R=6.7 3 1.9 1.4
340 400520
Fig. S13 CD titration of CG10 (2.0 10-5 M) with increasing amount of 1 from 0 to 1.4 10-5 M.
450 480 510 5400.0
0.1
0.2
0.3
Abs.
Wavelength / nm
1 (R=0) R = 1 2 5 10
476
492512
a
500 550 600 650 7000.00
0.25
0.50
0.75
1.00 1 (R=0) R = 1 2 5 10
Norm
alize
d in
tens
ity /
a.u.
Wavelength / nm
620590
575545b
Fig. S14 (a) The absorption and (b) emission spectral change of 1 (5 μM in aqueous buffer solution, pH = 7.2) with increasing amount of CtDNA (R=0-10), λex = 480 nm, 1 cm cell, room temperature.
18
350 400 450 500 550 600 6500.000.050.100.150.200.250.300.35
Abso
rban
ce
Wavelength/ nm
1, 5 m in tris-HCl BSA, 10 g/ mL
476
506
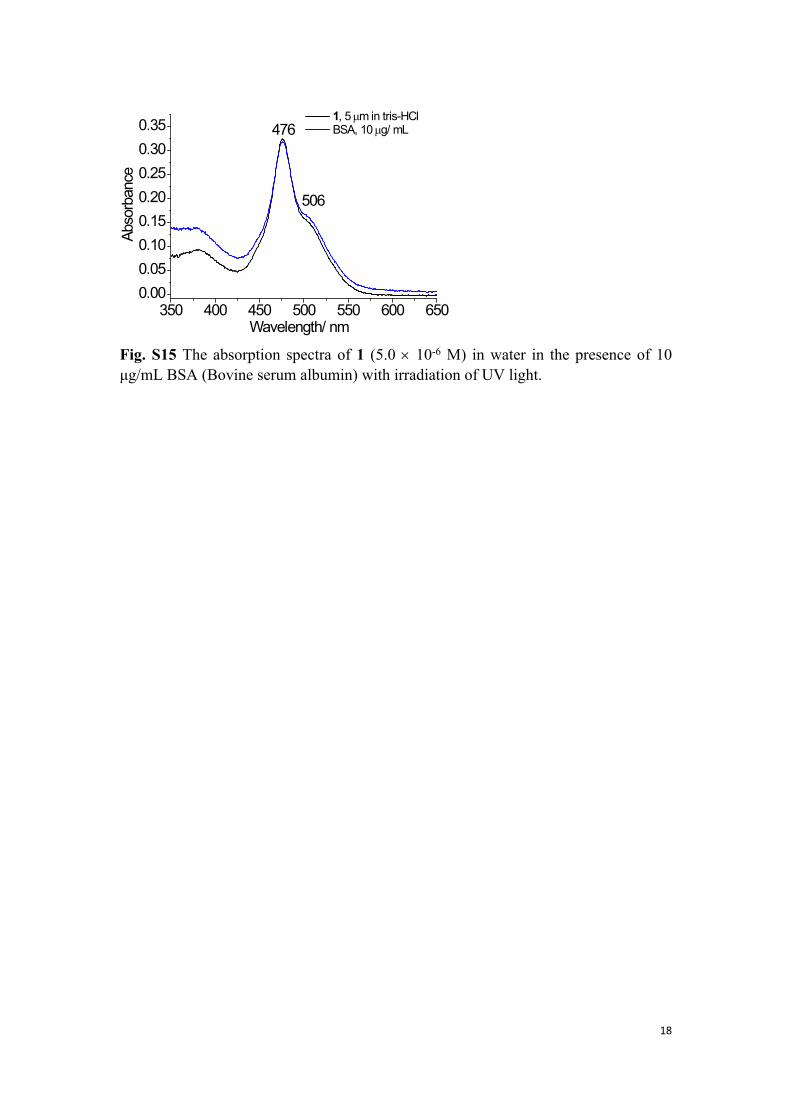
Fig. S15 The absorption spectra of 1 (5.0 10-6 M) in water in the presence of 10 μg/mL BSA (Bovine serum albumin) with irradiation of UV light.
19
10. Photochromic process of 1 with AT10
400 500 600 700 800
0.0
0.1
0.2
0.3
Abso
rban
ce
Wavelength/ nm
1/ AT10 = 1: 1.3 UV = 5 s 10 s 15 s 20 s 30 s 40 s 60 s 80 s 120 s 160 s
700
510
492
405
a
0 20 40 60 80 100 120 140 160 1800.00
0.01
0.02
0.03
0.04
0.05
0.06
Abso
rban
ce a
t 700
nm
Irradiate time/ s
e
400 500 600 700 8000.0
0.1
0.2
0.3
Abso
rban
ce
Wavelength/ nm
PSS 670 nm 20 s 60 s 120 s 200 s 300 s 400 s 540 s 660 s 780 s 960 s
510
492
405700
b
0 200 400 600 800 1000
0.01
0.02
0.03
0.04
0.05
0.06
Abso
rban
ce a
t 700
nm
Wavelength/ nm
f
400 500 600 700 800
0.0
0.1
0.2
0.3
0.4
Abso
rban
ce
Wavelength/ nm
1/ AT10 (1: 10) UV = 15 s 30 s 45 s 60 s 75 s 90 s 105 s 120 s 150 s 180 s 210 s 240 s
512
396710
c
0 50 100 150 200 2500.000.010.020.030.040.050.060.070.08
Abso
rban
ce a
t 710
nm
Time/ s
g
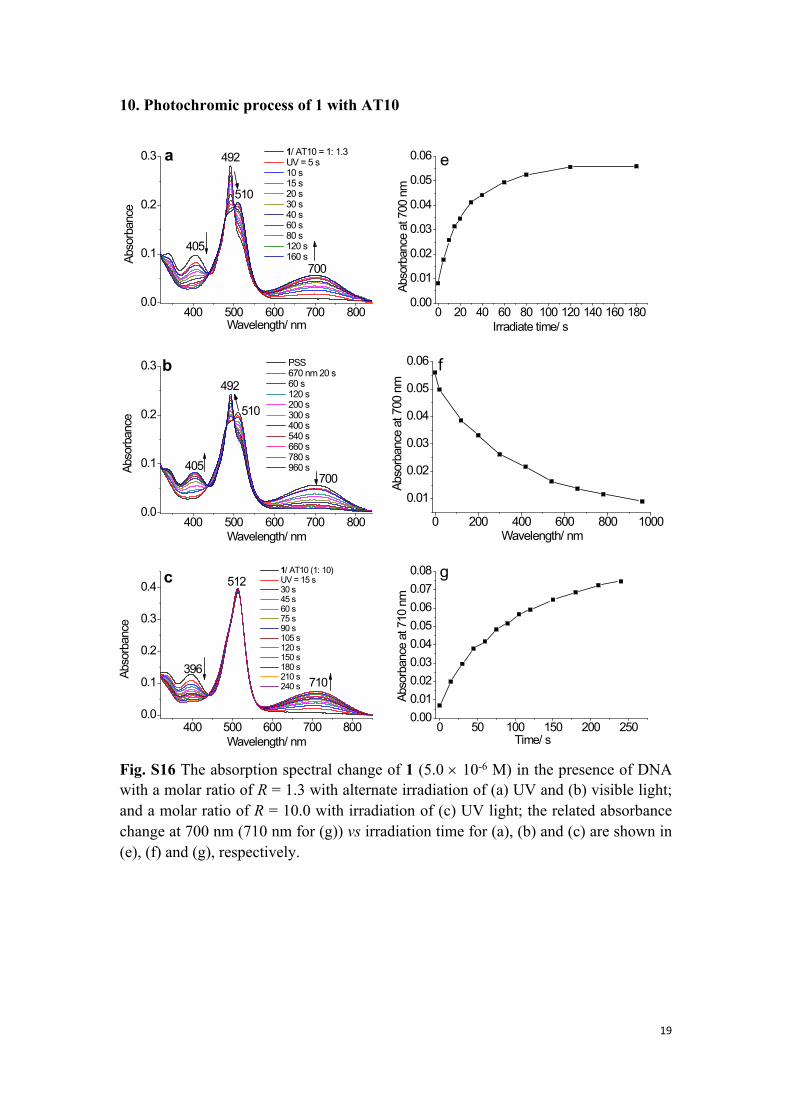
Fig. S16 The absorption spectral change of 1 (5.0 10-6 M) in the presence of DNA with a molar ratio of R = 1.3 with alternate irradiation of (a) UV and (b) visible light; and a molar ratio of R = 10.0 with irradiation of (c) UV light; the related absorbance change at 700 nm (710 nm for (g)) vs irradiation time for (a), (b) and (c) are shown in (e), (f) and (g), respectively.
20
550 600 650 700 7500.00.10.20.30.40.50.60.70.80.91.0
Inte
nsity
/ a.u
.
Wavelength/ nm
UV = 0 s 5 s 10 s 15 s 20 s 30 s 40 s 50 s 60 s 80 s 100 s 120 s 150 s 180 s
a 590
500 550 600 650 7000.0
0.4
0.8
1.2 UV = 0 s 15 s 30 s 45 s 60 s 75 s 90 s 105 s 120 s 135 s 150 s 180 s 210 s 240 s 270 s 300 s 360 s 480 s
Inte
nsity
/ a.u
.
Wavelength / nm
550b
0 2 4 6 8 10 12 14 16 18 200.0
0.2
0.4
0.6
0.8
1.0
590
nm
Nor
mal
ized
Inte
nsity
/ a.u
.
Cycles
590 nmc
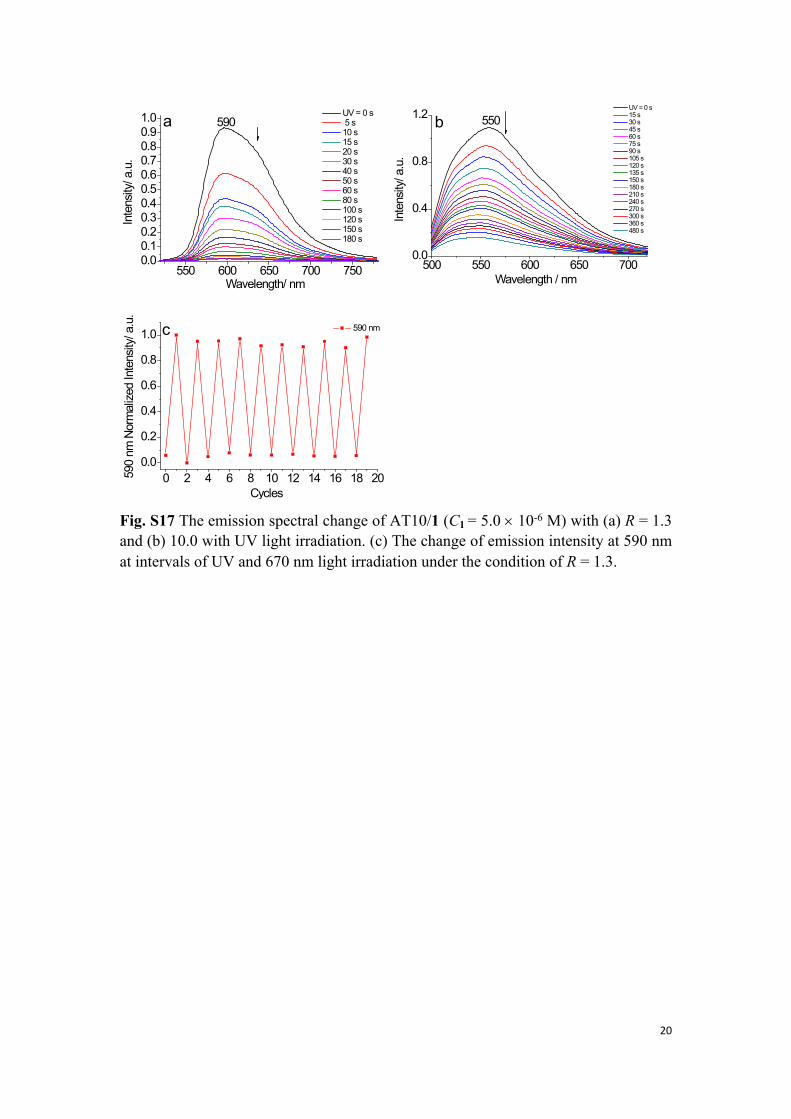
Fig. S17 The emission spectral change of AT10/1 (C1 = 5.0 10-6 M) with (a) R = 1.3 and (b) 10.0 with UV light irradiation. (c) The change of emission intensity at 590 nm at intervals of UV and 670 nm light irradiation under the condition of R = 1.3.
21
400 500 600 700 800
0.0
0.1
0.2
0.3 CG10/1 UV = 5 s 10 s 20 s 90 s 180 s 240 s 360 s 480 s 600 sAb
sorb
ance
Wavelength/ nm
510
388680
UV light
a
400 500 600 700 8000.0
0.1
0.2
0.3 PSS 670 nm, 60 s 120 s 240 s 360 s 480 s 720 s 900 s
Abso
rban
ce
Wavelength/ nm
510
388680
b
500 550 600 6500.0
0.2
0.4
0.6
0.8
1.0 R = 6.0 Uv = 5 s 10 s 15 s 20 s 25 s 30 s 40 s 50 s 60 s 80 s 100 s 130 s 180 s 240 s 300 s 360 s 480 s 600 s
Norm
alize
d in
tens
ity /
a.u.
Wavelength / nm
538 UV lightc
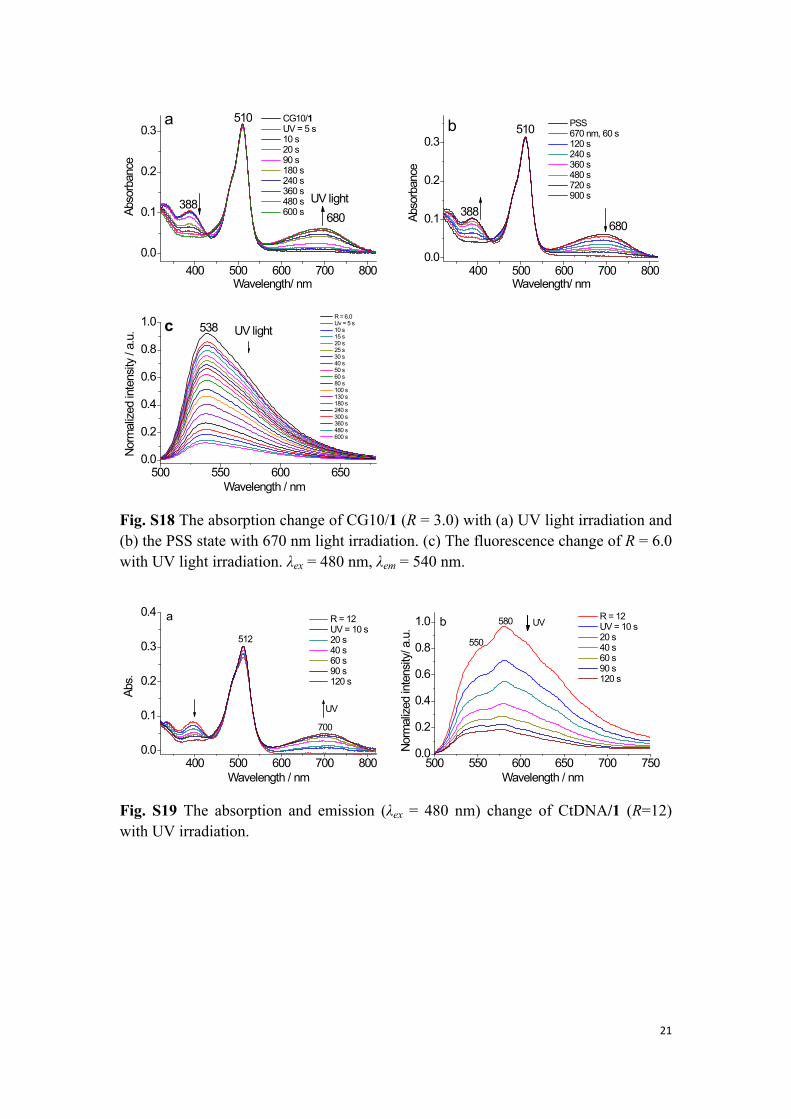
Fig. S18 The absorption change of CG10/1 (R = 3.0) with (a) UV light irradiation and (b) the PSS state with 670 nm light irradiation. (c) The fluorescence change of R = 6.0 with UV light irradiation. λex = 480 nm, λem = 540 nm.
400 500 600 700 800
0.0
0.1
0.2
0.3
0.4
Abs.
Wavelength / nm
R = 12 UV = 10 s 20 s 40 s 60 s 90 s 120 s
512
700
UV
a
500 550 600 650 700 7500.0
0.2
0.4
0.6
0.8
1.0
Norm
alize
d in
tens
ity/ a
.u.
Wavelength / nm
R = 12 UV = 10 s 20 s 40 s 60 s 90 s 120 s
580
550
UVb
Fig. S19 The absorption and emission (λex = 480 nm) change of CtDNA/1 (R=12) with UV irradiation.
22
300 400 500 600 700 800-100
-80
-60
-40
-20
0
20
40/
mde
g
Wavelength/ nm
R=1.4 UV = 15 s 30 s 45 s 60 s 75 s 90 s 105 s 120 s 135 s 150 s 165 s 180 s
a
300 400 500 600 700 800
-80
-60
-40
-20
0
20
/ m
deg
Wavelength / nm
PSS 670 nm, 20 s 40 s 60 s 80 s 120 s 160 s 200 s 240 s 280 s 320 s 360 s 400 s 460 s 540 s
b
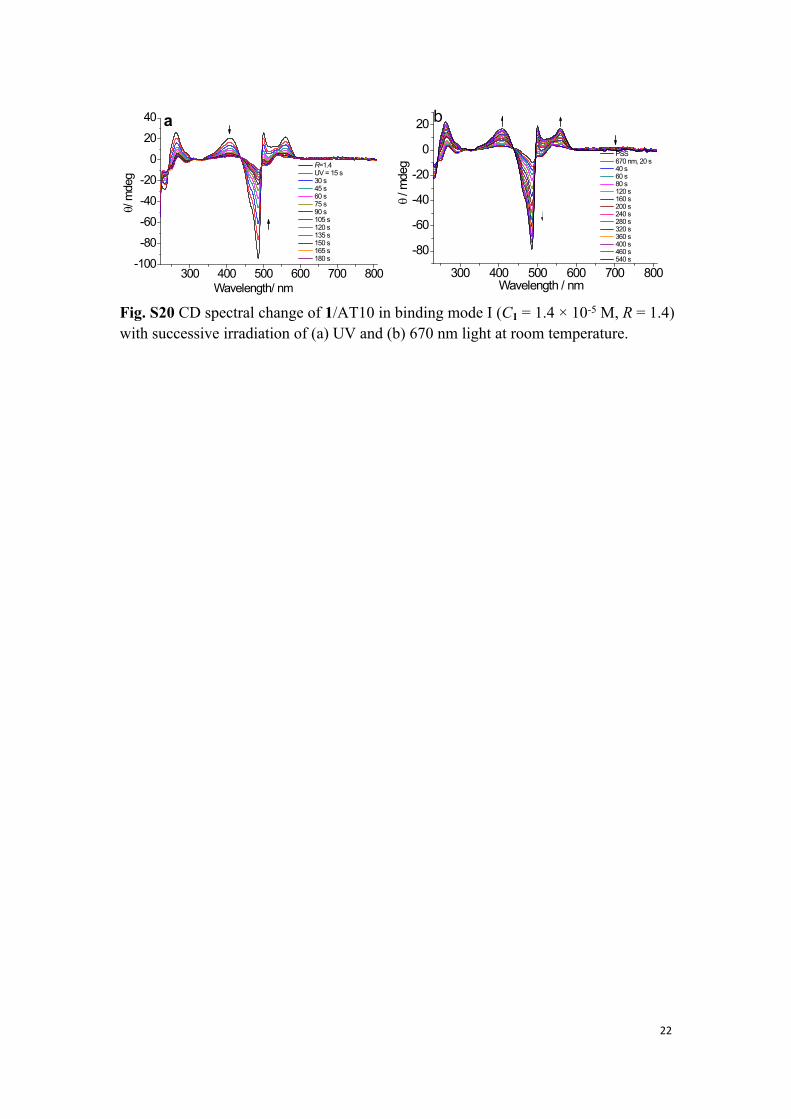
Fig. S20 CD spectral change of 1/AT10 in binding mode I (C1 = 1.4 × 10⁻⁵ M, R = 1.4) with successive irradiation of (a) UV and (b) 670 nm light at room temperature.
23
11. CLSM images for living and fixed Hela cells incubated with 1
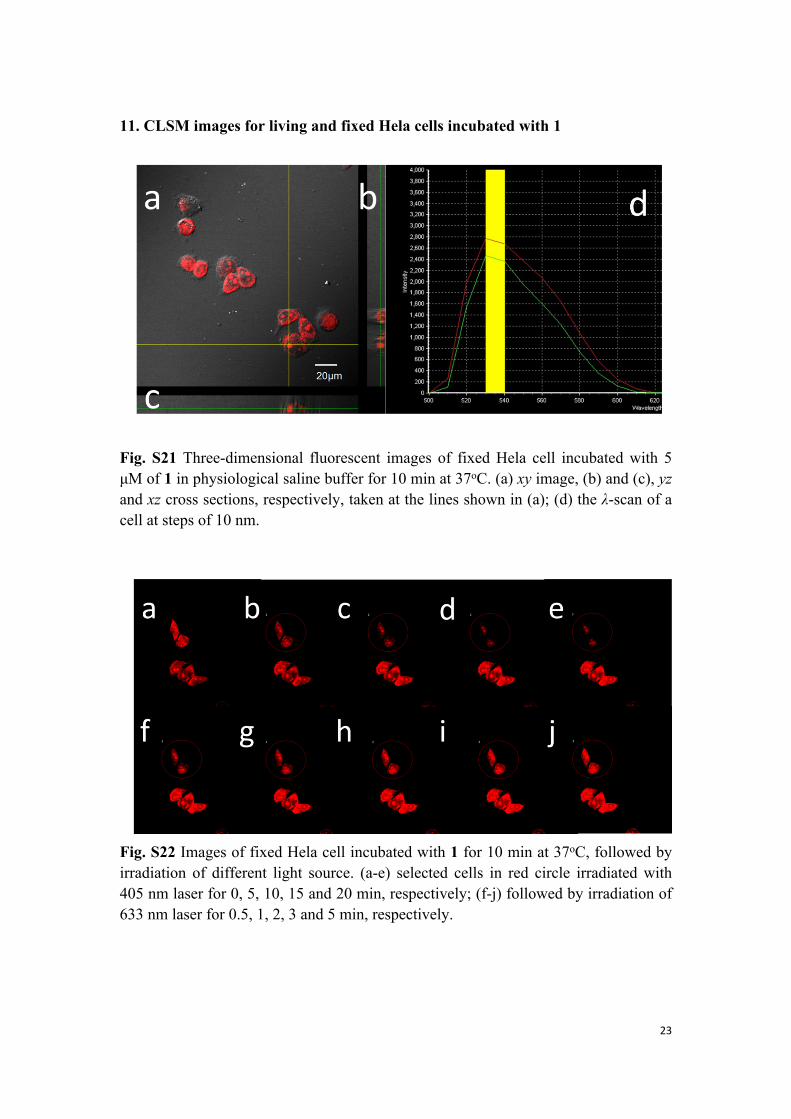
Fig. S21 Three-dimensional fluorescent images of fixed Hela cell incubated with 5 μM of 1 in physiological saline buffer for 10 min at 37oC. (a) xy image, (b) and (c), yz and xz cross sections, respectively, taken at the lines shown in (a); (d) the λ-scan of a cell at steps of 10 nm.
Fig. S22 Images of fixed Hela cell incubated with 1 for 10 min at 37oC, followed by irradiation of different light source. (a-e) selected cells in red circle irradiated with 405 nm laser for 0, 5, 10, 15 and 20 min, respectively; (f-j) followed by irradiation of 633 nm laser for 0.5, 1, 2, 3 and 5 min, respectively.
24
12. Characteristics of 1 and the intermediate products
Fig. S23 1H and 13C NMR spectrum of BSN-1 in CDCl3 and DMSO-d6, respectively.
25
Fig. S24 HRMS of BSN-1
26
Fig. S25 1H NMR and 13C NMR spectra of TO in DMSO-d6
27
Fig. S26 HRMS of TO
28
Fig. S27 1H NMR (CD3OD) and 13C NMR spectra of 1 (DMSO-d6)
29
Fig. S28 HRMS of 1
13. References
1. R. Lartia and U. Asseline, Chem.-Eur. J. 2006, 12, 2270-2281. 2. C. Holzhauser, S. Berndl, F. Menacher, M. Breunig, A. Göpferich and H.-A. Wagenknecht,
Eur. J. Org. Chem. 2010, 1239-1248.3. Y. Zou, T. Yi, S. Xiao, F. Li, C. Li, X. Gao, J. Wu, M. Yu and C. Huang, J. Am. Chem. Soc.,
2008, 130, 15750-15751.4. X. Piao, Y. Zou, J. Wu, C. Li and T. Yi, Org. Lett. 2009, 11, 3818-3821.5. J. Wu, Y. Zou, C. Li, W. Sicking, I. Piantanida, T. Yi and C. Schmuck, J. Am. Chem. Soc.,
2012, 134, 1958-1961.6. (a) S. Chen, Y. Yang, Y. Wu, H. Tian and W. Zhu, J. Mater. Chem. 2012, 22, 5486-5494. (b)
Y. Feng, Y. Yan, S. Wang, W. Zhu, S. Qian and H. Tian, J. Mater. Chem. 2006, 16, 3685-3692.
7. H. S. Rye, S. Yue, D. E. Wemmer, M. A. Quesada, R. P. Haugland, R. A. Mathies and A. N. Glazer, Nucleic Acids Research 1992, 20, 2803-2812
8. W. E. Evenson, L. M. Boden, K. A. Muzikar and D. J. O’Leary, J. Org. Chem. 2012, 77, 10967-10971.

![Title Photochromism and white long-lasting …...Title Photochromism and white long-lasting persistent luminescence in Bi[3+]-doped ZnGa[2]O[4] ceramics Author(s) Zhuang, Yixi; Ueda,](https://img.dokumen.tips/doc/110x75/5fca2348d932e01e9c134e64/title-photochromism-and-white-long-lasting-title-photochromism-and-white-long-lasting.jpg)


![Experimental (X-ray Diffraction and FT-IR) and Quantum · PDF filedepressant activity [2]. Thiazole, or 1,3-thiazole, is a heterocyclic compound that contains both sulfur and nitrogen](https://img.dokumen.tips/doc/110x75/5a8bea2a7f8b9a7f398c53f9/experimental-x-ray-diffraction-and-ft-ir-and-quantum-activity-2-thiazole.jpg)