Embed Size (px)
DESCRIPTION
PhD thesis, Cardiff University, UK
Citation preview

CARDIFF SCHOOL OF ENGINEERING
CARDIFF UNIVERSITY
EXPERIMENTAL COMPARISON OF
BRICKWORK BEHAVIOUR AT PROTOTYPE
AND MODEL SCALES
ABBA-GANA MOHAMMED
BEng, MSc
THESIS SUBMITTED TO CARDIFF UNIVERSITY IN CANDIDATURE FOR
THE DEGREE OF DOCTOR OF PHILOSOPHY
SEPTEMBER 2006
PDF processed with CutePDF evaluation edition www.CutePDF.comPDF processed with CutePDF evaluation edition www.CutePDF.comPDF processed with CutePDF evaluation edition www.CutePDF.com

i
Declaration This work has not previously been accepted in substance for any degree and is not
concurrently submitted in candidature for any degree.
Signed………………………………….. (Candidate) Date………………
Statement 1 This thesis is the result of my own independent work/investigation, except where
otherwise stated. Other sources are acknowledged by explicit references.
Signed………………………………….. (Candidate) Date………………
Statement 2 I hereby give consent for my thesis, if accepted to be available for photocopying and
for inter-library loan, and for the title and summary to be made available to outside
organisations.
Signed………………………………….. (Candidate) Date………………

ii
Acknowledgements
All praise is due to God for all His mercies to us, may He continue to guide us,
ameen. I would like to thank Prof. Tim Hughes for his assistance and encouragement
all through the research programme. Thanks are also due to the technical staff of
Cardiff School of Engineering, particularly Des, Harry, Brian, Len, Mal, Carl and
Andrew for all their assistance with my work.
The part sponsorship of my studies by the PTDF in Nigeria and the study fellowship
granted by University of Maiduguri is gratefully acknowledged. My appreciation also
goes to my erstwhile colleagues in the masonry research group, Richard and
Mahmood for their encouragement and support during the course of the work.
I am also grateful to the family of Dr Gana for all their support and friendship during
my study in Cardiff. Thanks are also due to Bukar, Suleiman, Dr Junaidu and their
families for making our stay here enjoyable. The companionship of the brothers and
sisters at the Maktaba is also gratefully appreciated.
Finally I would like to thank my family for their moral and financial support and
particularly my wife and kids for their constant and enduring support.

iii
Abstract
A programme of masonry tests has been undertaken at prototype and model scales
with a view to comparing their behaviour and strength under various conditions of
loading. Characterisation tests were carried out to determine the principal behaviour
of the units and mortar before the main programme of masonry test. The testing
regime was in two parts: in the first category of tests; compressive, shear, flexural,
bond and diagonal tensile strength tests were carried out on prototype, half, fourth and
sixth scale models. While in the second category of tests; the effect of different joint
thickness, increasing mortar strength and different sand gradings were tested on the
compressive, shear, flexural, bond and diagonal tensile strengths of sixth scale model
masonry.
The size effect laws for quasi-brittle materials from fracture mechanics were also
applied to the test data in order to find out their suitability to masonry model studies.
The knowledge gained on the model scale behaviour of masonry was then applied to a
prototype study involving the effect of eccentricity on the compressive strength of
masonry as it relates to masonry arches. The sixth model scale was used for this study
using four different eccentricities.
On the whole, the model tests showed similar behaviour to the prototype. While there
was no discernable scale effect in the shear, flexural, bond and diagonal tensile
strength test, the compressive strength tests showed a noticeable scale effect. The
parametric study at sixth scale also showed it is possible to use a sixth model to
determine the effect of the increasing mortar strength and different grading of sands
on masonry strength. However, the effect of increasing joint thickness was difficult to
quantify. Indications from the size effect analysis of test data were also encouraging.
The experimental data from the different tests were generally found to be in good
agreement with the size effect laws of fracture mechanics. The application study was
found to agree with the prototype investigation for low eccentricities but does not
correspond well for higher eccentricities. Overall the results showed that it was
possible to use model tests to provide masonry strength properties that could be used
to determine the structural behaviour real life structures from numerical studies.

iv
Table of Contents 1 INTRODUCTION................................................................................................. 1-1
1.1 BACKGROUND .................................................................................................. 1-1 1.2 OBJECTIVES...................................................................................................... 1-2 1.3 LAYOUT ........................................................................................................... 1-2
2 LITERATURE REVIEW..................................................................................... 2-1
2.1 SOME IMPORTANT PROPERTIES OF THE UNITS.................................................... 2-1 2.1.1 Suction rate and moisture content of the unit ............................................. 2-1 2.1.2 Strength and stiffness of the unit ................................................................ 2-2
2.2 SOME IMPORTANT PROPERTIES OF MORTARS..................................................... 2-3 2.2.1 Water retentivity ......................................................................................... 2-3 2.2.2 Strength and stiffness of mortars ................................................................ 2-4
2.3 PROPERTIES OF THE COMPOSITE........................................................................ 2-4 2.3.1 Compression ............................................................................................... 2-4 2.3.2 Shear ........................................................................................................... 2-7 2.3.3 Flexural strength ......................................................................................... 2-8 2.3.4 Tensile strength........................................................................................... 2-9
2.4 STRUCTURAL MODELS .................................................................................... 2-10 2.4.1 Classes of structural models...................................................................... 2-10 2.4.2 Elastic model............................................................................................. 2-11 2.4.3 Indirect model ........................................................................................... 2-11 2.4.4 Direct model ............................................................................................. 2-11 2.4.5 Strength model .......................................................................................... 2-11
2.5 BRICK MASONRY MODELLING......................................................................... 2-12 2.5.1 Uniaxial and biaxial strength tests on piers and walls .............................. 2-12 2.5.2 Shear strength tests ................................................................................... 2-16 2.5.3 Lateral and flexural load tests ................................................................... 2-17 2.5.4 Reinforced masonry.................................................................................. 2-18 2.5.5 Prestressed masonry.................................................................................. 2-18 2.5.6 Seismic effect studies................................................................................ 2-18 2.5.7 Centrifuge modelling ................................................................................ 2-19
2.6 MODELS AND SIZE EFFECTS ............................................................................ 2-20 2.6.1 Size effect ................................................................................................. 2-20 2.6.2 History ...................................................................................................... 2-20 2.6.3 The energetic and deterministic size effect............................................... 2-22 2.6.4 The theory of Crack Fractality or the Multifractal Scaling Laws (MFSL). .. 2-24 2.6.5 Karihaloo’s size effect formula for notched quasi-brittle structures......... 2-25
2.7 FRACTURE MECHANICS CHARACTERISATION OF MASONRY ............................. 2-26 2.8 FACTORS AFFECTING SIZE/SCALE EFFECT ....................................................... 2-27
3 EXPERIMENTAL DESIGN AND MATERIAL TESTS.................................. 3-1
3.1 EXPERIMENTAL DESIGN.................................................................................... 3-1 3.1.1 Bricks .......................................................................................................... 3-4 3.1.2 Cutting method ........................................................................................... 3-6 3.1.3 Mortar ......................................................................................................... 3-7 3.1.4 Masonry specimens..................................................................................... 3-8 3.1.5 Adjustment of the suction rate of masonry units ...................................... 3-10 3.1.6 Preparation of specimens .......................................................................... 3-11
3.2 MATERIALS AND TESTS .................................................................................. 3-11

v
3.2.1 Materials ................................................................................................... 3-11 3.2.1.1 Sand .................................................................................................. 3-11 3.2.1.2 Cement.............................................................................................. 3-12 3.2.1.3 Lime.................................................................................................. 3-12 3.2.1.4 Bricks................................................................................................ 3-12
3.2.2 Tests on constituent elements; Brick units................................................ 3-12 3.2.2.1 Compressive strength test................................................................. 3-13 3.2.2.2 Modulus of elasticity test.................................................................. 3-15 3.2.2.3 Flexural strength test ........................................................................ 3-16 3.2.2.4 Indirect tensile strength test.............................................................. 3-18 3.2.2.5 Water absorption test ........................................................................ 3-19 3.2.2.6 Fracture energy test .......................................................................... 3-19
3.2.3 Tests on constituent elements; Mortars..................................................... 3-22 3.2.3.1 Compressive strength test................................................................. 3-23 3.2.3.2 Modulus of elasticity test.................................................................. 3-25 3.2.3.3 Flexural strength test ........................................................................ 3-26 3.2.3.4 Fracture energy test .......................................................................... 3-27 3.2.3.5 Mortar consistence test; Dropping Ball ............................................ 3-30 3.2.3.6 Water retentivity and consistence retentivity Tests .......................... 3-30
4 MASONRY ASSEMBLIES AND TESTS........................................................... 4-1
4.1 COMPRESSIVE STRENGTH TEST ......................................................................... 4-2 4.2 SHEAR STRENGTH TEST..................................................................................... 4-5 4.3 FLEXURAL STRENGTH TEST .............................................................................. 4-7 4.4 BOND WRENCH TEST......................................................................................... 4-9 4.5 DIAGONAL TENSILE STRENGTH TEST............................................................... 4-10
5 MASONRY TESTS AT DIFFERENT SCALES RESULTS AND DISCUSSIONS............................................................................................................... 5-1
5.1 COMPRESSIVE TEST RESULTS............................................................................ 5-1 5.1.1 Triplets ........................................................................................................ 5-1
5.1.1.1 Failure patterns ................................................................................... 5-1 5.1.1.2 Compressive strength ......................................................................... 5-1 5.1.1.3 Stiffness .............................................................................................. 5-4
5.1.2 Wallettes ..................................................................................................... 5-6 5.1.2.1 Failure pattern..................................................................................... 5-6 5.1.2.2 Compressive strength ......................................................................... 5-7 5.1.2.3 Stiffness .............................................................................................. 5-7 5.1.2.4 Characteristic strength of masonry..................................................... 5-9 5.1.2.5 Size effect analysis ............................................................................. 5-9
5.2 SHEAR TEST RESULTS ..................................................................................... 5-10 5.2.1 Failure mode ............................................................................................. 5-10 5.2.2 Initial shear strength and coefficient of internal friction .......................... 5-10 5.2.3 Size effect analysis.................................................................................... 5-11
5.3 FLEXURAL TEST RESULTS ............................................................................... 5-12 5.3.1 Flexural strength normal to bed joints ...................................................... 5-12 5.3.2 Flexural strength parallel to bed joint ....................................................... 5-13 5.3.3 Size effect analysis.................................................................................... 5-14
5.4 BOND TEST RESULTS....................................................................................... 5-15 5.4.1 Failure mode ............................................................................................. 5-15 5.4.2 Bond strength............................................................................................ 5-15 5.4.3 Bond strength test compared to flexural strength test............................... 5-15

vi
5.4.4 Size effect analysis.................................................................................... 5-16 5.5 DIAGONAL TENSILE TEST RESULTS ................................................................. 5-16
5.5.1 Failure mode ............................................................................................. 5-16 5.5.2 Diagonal tensile strength........................................................................... 5-16 5.5.3 Stiffness .................................................................................................... 5-17 5.5.4 Size effect analysis.................................................................................... 5-18
5.6 CONCLUSIONS ................................................................................................ 5-19
6 MASONRY TESTS AT SIXTH SCALE RESULTS AND DISCUSSIONS .... 6-1
6.1 COMPRESSIVE STRENGTH TEST ......................................................................... 6-1 6.1.1 Varying joint thickness ............................................................................... 6-1 6.1.2 Effect of sand grading and mortar type....................................................... 6-2
6.1.2.1 M95, Mortar designations ii, iii, and iv. ............................................. 6-2 6.1.2.2 M60, Mortar designations ii, iii, and iv. ............................................. 6-3 6.1.2.3 Effect of different sand gradings ........................................................ 6-3
6.2 SHEAR STRENGTH TEST..................................................................................... 6-4 6.2.1 Varying joint thickness ............................................................................... 6-4 6.2.2 M95, mortar designations ii, iii, and iv....................................................... 6-5 6.2.3 M60, mortar designations ii, iii, and iv....................................................... 6-5 6.2.4 Effect of different sand gradings................................................................. 6-6
6.3 FLEXURAL STRENGTH TEST .............................................................................. 6-6 6.3.1 Varying joint thickness ............................................................................... 6-6 6.3.2 M95, mortar designations ii, iii, and iv....................................................... 6-7 6.3.3 M60, mortar designations ii, iii, and iv....................................................... 6-7 6.3.4 Effect of different sand gradings................................................................. 6-8
6.4 BOND STRENGTH TEST ..................................................................................... 6-9 6.4.1 Varying joint thickness ............................................................................... 6-9 6.4.2 M95, mortar designations ii, iii, and iv....................................................... 6-9 6.4.3 M60, mortar designations ii, iii, and iv....................................................... 6-9 6.4.4 Effect of different sand gradings............................................................... 6-10
6.4.4.1 Flexural strength normal to bed joint compared to bond strength.... 6-10 6.5 DIAGONAL TENSILE STRENGTH TEST............................................................... 6-11
6.5.1 Varying joint thickness ............................................................................. 6-11 6.5.2 M95, mortar designations ii, iii, and iv..................................................... 6-11 6.5.3 M60, mortar designations ii, iii, and iv..................................................... 6-12 6.5.4 Effect of different sand gradings............................................................... 6-12
6.6 CONCLUSIONS ................................................................................................ 6-13
7 APPLICATION STUDY ...................................................................................... 7-1
7.1 BACKGROUND .................................................................................................. 7-1 7.2 MASONRY SPECIMENS ...................................................................................... 7-2 7.3 TESTING ........................................................................................................... 7-2 7.4 STRESS CALCULATIONS .................................................................................... 7-3 7.5 DISCUSSION OF RESULTS .................................................................................. 7-3 7.6 CONCLUSIONS .................................................................................................. 7-5
8 CONCLUSIONS AND RECOMMENDATIONS .............................................. 8-1
8.1 CONCLUSIONS .................................................................................................. 8-1 8.2 RECOMMENDATIONS ........................................................................................ 8-3

vii
LIST OF TABLES
Table 2.1- Factors affecting masonry strength(19). ......................................................... 2-30 Table 3.1- Average dimensions of prototype and model bricks. ................................... 3-32 Table 3.2- Different mortar types used in the tests........................................................ 3-32 Table 3.3- Details of all masonry tests .......................................................................... 3-33 Table 3.4- Mechanical properties of prototype and model bricks. ................................ 3-34 Table 3.5- Effect of loading orientation on brick strength. ........................................... 3-34 Table 3.6- Average dimension of flexural tensile strength specimens. ......................... 3-34 Table 3.7- Properties of prototype and model mortars (COV in brackets).................... 3-35 Table 5.1- Summary of triplet masonry compression test results in the four scales. .... 5-22 Table 5.2- Summary of wallette masonry compression test results in prototype and sixth scale. .............................................................................................................................. 5-22 Table 5.3 –Summary of masonry shear strength test results in the four scales. ............ 5-22 Table 5.4- Summary of masonry flexural strength normal to bed joints test results in the four scales. ..................................................................................................................... 5-22 Table 5.5- Summary of masonry flexural strength parallel to bed joints test results in the four scales. ..................................................................................................................... 5-22 Table 5.6- Summary of bond strength test results in the four scales. ............................ 5-23 Table 5.7- Summary of diagonal tensile strength test results in the four scales............ 5-23 Table 6.1- Summary of compressive strength test results. ............................................ 6-15 Table 6.2- Summary of initial shear strength test results. ............................................. 6-15 Table 6.3- Summary of flexural strength parallel to bed joints test results. .................. 6-15 Table 6.4- Summary of flexural strength normal to bed joints test results.................... 6-16 Table 6.5- Summary of bond strength test results. ........................................................ 6-16 Table 6.6- Summary of diagonal tensile (shear) strength test results. ........................... 6-16 Table 7.1- Mortar proportions ......................................................................................... 7-6 Table 7.2 – Test results for specimens made with designation iv mortar, S4, with COV in brackets ............................................................................................................................ 7-6 Table 7.3- Test results for specimens made with designation v mortar, S5, with COV in brackets ............................................................................................................................ 7-7

viii
TABLE OF FIGURES Figure 2.1- (a) Masonry specimen under axial force, (b) Stress states for brick and mortar elements. ........................................................................................................................ 2-31 Figure 2.2- Failure modes of masonry in shear with precompression........................... 2-31 Figure 2.3- Size effect according to strength criteria, linear and nonlinear fracture mechanics. ..................................................................................................................... 2-32 Figure 2.4- (a) Multifractal scaling law (MFSL) for tensile strength, (b) Bilogarithmic diagram for the same. .................................................................................................... 2-32 Figure 3.1- Drawing plans showing the cutting dimensions in the half, fourth and sixth model units respectively ................................................................................................ 3-36 Figure 3.2-Water absorption characteristics of the prototype brick. ............................. 3-36 Figure 3.3- grading curves for prototype and model sands within the BS limits. ......... 3-36 Figure 3.4- Unit compressive strength in the four scales. ............................................. 3-37 Figure 3.5- Orientation of model units in a prototype brick.......................................... 3-37 Figure 3.6- Stress/strain curves in some prototype brick stiffness tests. ....................... 3-38 Figure 3.7-Typical stress/strain relationship in prototype brick. ................................... 3-38 Figure 3.8- Modulus of rupture of prototype and model scale units ............................. 3-38 Figure 3.9- Indirect tensile strength of prototype and model scale units....................... 3-39 Figure 3.10- Compressive strength/tensile strength relationship for prototype and model units................................................................................................................................ 3-39 Figure 3.11- Water absorption of units across the four scales....................................... 3-39 Figure 3.12- Load/deflection curves for prototype brick beam fracture test ................. 3-40 Figure 3.13- Load/deflection curves for prototype unit fracture test............................. 3-40 Figure 3.14- Typical load/deflection response for beam and single unit prototype fracture energy tests. ................................................................................................................... 3-40 Figure 3.15- Flexural stress/deflection response for prototype and half scale unit Fracture Energy tests.................................................................................................................... 3-41 Figure 3.16- Compressive strength of model mortars/strength class relationship......... 3-41 Figure 3.17- Variation of compressive strength of model mortars with w/c ratio......... 3-41 Figure 3.18- Comparison typical stress/ axial strain plot for prototype and model mortars........................................................................................................................................ 3-42 Figure 3.19- Comparison of typical stress/lateral strain plot for prototype and model mortars. .......................................................................................................................... 3-42 Figure 3.20- Variation of stiffness with strength for model mortars ............................. 3-42 Figure 3.21- Variation of stiffness with strength class for model mortars. ................... 3-43 Figure 3.22- Flexural strength of model mortars/strength class relationship ................ 3-43 Figure 3.23- Variation of flexural strength of model mortars with w/c ratio ................ 3-43 Figure 3.24- Mean compressive strength/ mean flexural strength relationship for model mortars. .......................................................................................................................... 3-44 Figure 3.25- Load/deflection graphs for prototype mortar fracture tests. ..................... 3-45 Figure 3.26- Load/deflection graphs for benchmark mortar fracture test...................... 3-45 Figure 3.27 - Load/crack mouth opening deflection, CMOD for M95-ii mortar fracture test.................................................................................................................................. 3-45 Figure 3.28- Load/CMOD curves for M95-iv mortar fracture test................................ 3-46 Figure 3.29- Load/CMOD curves for M60-iii mortar fracture test. .............................. 3-46 Figure 3.30- Load/CMOD curves for M60-ii mortar fracture test. ............................... 3-46 Figure 3.31- Load/CMOD curves for M60-iv mortar fracture test................................ 3-47 Figure 3.32- Comparison of Load/CMOD and central deflection at mid span for M95-iii fracture test. ................................................................................................................... 3-47 Figure 3.33- Comparison of typical load/CMOD curves from mortar fracture test ...... 3-47 Figure 3.34- Variation of fracture energy with mortar class in model mortars. ............ 3-48

ix
Figure 3.35- Comparison of flexural stress/deflection curves for some mortars and prototype brick during fracture tests.............................................................................. 3-48 Figure 3.36- Variation of consistence retentivity in model scale mortars. .................... 3-49 Figure 3.37- Variation of water retentivity in model scale mortars............................... 3-49 Figure 4.1- Position of transducers in wallette specimens............................................. 4-13 Figure 4.2- Position of transducers in triplet specimens................................................ 4-13 Figure 4.3- Set up dimensions for shear strength tests. ................................................. 4-13 Figure 4.4 - Set up dimensions (mm) for flexural strength parallel to bed joint tests. .. 4-14 Figure 4.5- Set up dimensions (mm) for flexural strength normal to bed joint tests. .... 4-14 Figure 4.6- Set up dimensions (mm) for bond strength test using the bond wrench. .... 4-15 Figure 4.7- Set up dimensions and transducer lengths (mm) for diagonal tensile strength tests. ............................................................................................................................... 4-15 Figure 5.1- Triplet compressive strength in the four scales........................................... 5-24 Figure 5.2- Normalised triplet compressive strength across the four scales.................. 5-24 Figure 5.3- Summary of stress/axial strain curves for prototype masonry triplet tests. 5-24 Figure 5.4- Typical stress/axial strain curves for half scale masonry triplets, test 2C-A2. ........................................................................................................................... 5-25 Figure 5.5- Summary of stress/axial strain curves in all half scale masonry triplet tests .. 5-25 Figure 5.6 – Typical stress/axial strain curves for fourth scale masonry triplets, test 4C-A3. ........................................................................................................................... 5-25 Figure 5.7- Summary of stress/axial strain curves for fourth scale masonry triplet tests. . 5-26 Figure 5.8- Typical stress/strain curves for sixth scale masonry triplets, test 6C-B4.... 5-26 Figure 5.9- Summary of stress/axial stain curves for sixth scale masonry triplet tests. 5-26 Figure 5.10- Stress/strain curves for selected triplet tests across the four scales. ......... 5-27 Figure 5.11- Stiffness of masonry triplets in the four scales. ........................................ 5-27 Figure 5.12- Comparison of prototype and sixth scale wallette compressive strength. 5-27 Figure 5.13- Comparison of normalised prototype and sixth scale wallette strength.... 5-28 Figure 5.14- Position of transducers in prototype and sixth scale wallettes.................. 5-28 Figure 5.15- Typical stress/axial strain curves for transducer 1, 2, 4, 5 and their average strain as shown in Figure 5.14, prototype test 1C-B1.................................................... 5-28 Figure 5.16- Typical stress/lateral strain curves for transducer 3, 6, and their average strain as shown Figure 5.14, prototype test 1C-B1........................................................ 5-29 Figure 5.17- Summary of stress/strain curves in prototype masonry wallette tests....... 5-29 Figure 5.18- Typical stress/axial curves for sixth scale wallette for MMCG’s 1, 2, 4 and 5 as shown in Figure 5.14, test 6C-I1. .............................................................................. 5-29 Figure 5.19- Typical stress/strain curves for sixth scale wallette for transducers 3 and 6 as shown in Figure 5.14, test 6C-I1. .................................................................................. 5-30 Figure 5.20- Summary of stress/strain curves for sixth scale wallette masonry tests.... 5-30 Figure 5.21- Typical stress/strain curves for prototype and sixth scale wallette specimens, tests 1C-B1 and 6C-I4. .................................................................................................. 5-30 Figure 5.22- Variation of wallette stiffness with scale in prototype and sixth scale tests. 5-31 Figure 5.23- Size effect analysis of masonry compressive strength triplet test results. 5-31 Figure 5.24- Shear stress/precompression stress relationship for prototype specimens.5-31 Figure 5.25- shear stress/precompression stress relationship for half scale specimens. 5-32 Figure 5.26- Shear stress/precompression stress relationship for fourth scale specimens. 5-32 Figure 5.27- Shear stress/precompression stress relationship for sixth scale specimens. . 5-32 Figure 5.28- Coefficient of friction across the four scales. ........................................... 5-33
x
Figure 5.29- Initial shear strength across the four scales............................................... 5-33 Figure 5.30- Size effect analysis of shear strength tests results at a precompression stress of 0.2N/mm2 .................................................................................................................. 5-33 Figure 5.31- Size effect analysis of shear strength test results at a precompression stress of 1.0N/mm2 .................................................................................................................. 5-34 Figure 5.32- Flexural strength normal to bed joint across the four scales..................... 5-34 Figure 5.33- Flexural strength parallel to bed joints across the four scales................... 5-34 Figure 5.34- Flexural strength parallel to bed joint/modulus of rupture of units. ......... 5-35 Figure 5.35- Plot of flexural strength in the orthogonal directions. .............................. 5-35 Figure 5.36- Relationship between the orthogonal ratio and σnormal. ............................. 5-35 Figure 5.37- Size effect analysis of flexural strength (normal to bed joints) test data. . 5-36 Figure 5.38- Size effect analysis of flexural strength (parallel to bed joints) test data.. 5-36 Figure 5.39- Variation of bond strength across the four scales. .................................... 5-36 Figure 5.40- Relationship between flexural strength and bond strength in the four scales........................................................................................................................................ 5-37 Figure 5.41- Size effect analysis of bond wrench test results........................................ 5-37 Figure 5.42- Variation of shear strength with scale in the diagonal tensile strength tests. 5-37 Figure 5.43 – Typical shear stress/axial strain curves in prototype diagonal tensile strength test 1D-A1........................................................................................................ 5-38 Figure 5.44- Typical shear stress/lateral strain curves in prototype diagonal tensile strength test 1D-A1........................................................................................................ 5-38 Figure 5.45- Summary of shear stress/axial strain curves for the diagonal tensile strength prototype tests. ............................................................................................................... 5-38 Figure 5.46- Summary of shear stress/lateral strain curves for the diagonal tensile strength test prototype tests. ........................................................................................................ 5-39 Figure 5.47- Typical shear stress/axial strain curves in half scale diagonal tensile strength test 2D-A5...................................................................................................................... 5-39 Figure 5.48- Typical shear stress/lateral strain curves in half scale diagonal tensile strength test 2D-A5........................................................................................................ 5-39 Figure 5.49- Summary of shear stress/axial strain curves for the half scale diagonal tensile strength tests. ................................................................................................................. 5-40 Figure 5.50- Summary of shear stress/lateral strain curves for the half scale diagonal tensile strength tests. ...................................................................................................... 5-40 Figure 5.51- Typical shear stress/axial strain curves in fourth scale diagonal tensile strength test 4D-A2........................................................................................................ 5-40 Figure 5.52- Typical shear stress/lateral strain curves in fourth scale diagonal tensile strength test 4D-A2........................................................................................................ 5-41 Figure 5.53- Summary of shear stress/axial strain curves for the fourth scale diagonal tensile strength tests. ...................................................................................................... 5-41 Figure 5.54- Summary of shear stress/lateral strain curves for the fourth scale diagonal tensile strength tests. ...................................................................................................... 5-41 Figure 5.55- Typical shear stress/axial strain curves in sixth scale diagonal tensile strength test 6D-B1. ....................................................................................................... 5-42 Figure 5.56- Typical shear stress/lateral strain curves in sixth scale diagonal tensile strength test 6D-B1. ....................................................................................................... 5-42 Figure 5.57-Summary of shear stress/axial strain curves for the sixth scale diagonal tensile strength tests. ...................................................................................................... 5-42 Figure 5.58- Summary of shear stress/lateral strain curves for the sixth scale diagonal tensile strength test. ....................................................................................................... 5-43 Figure 5.59- Comparison of typical shear stress/axial strain curves for the diagonal tensile strength tests in the four scales. ..................................................................................... 5-43

xi
Figure 5.60- Comparison of typical shear stress/lateral strain curves for the diagonal tensile strength tests in the four scales........................................................................... 5-43 Figure 5.61- Size effect analysis of diagonal tensile strength test data. ........................ 5-44 Figure 6.1- Effect of bed joint thickness on triplet masonry compressive strength ...... 6-17 Figure 6.2- Effect of M95 mortar strength on triplet masonry compressive strength. .. 6-17 Figure 6.3- Variation of masonry stiffness with M95 mortar strength. ......................... 6-17 Figure 6.4- Effect of M60 mortar strength on triplet masonry compressive strength. .. 6-18 Figure 6.5- Effect different sand gradings on masonry compressive strength. ............. 6-18 Figure 6.6- Shear strength/precompression stress relationship for benchmark test....... 6-18 Figure 6.7- Shear strength/precompression stress relationship for 1mm bed joint test. 6-19 Figure 6.8- Shear strength/precompression stress relationship for 2.5mm bed joint test. . 6-19 Figure 6.9- Variation of initial shear strength with joint thickness. .............................. 6-19 Figure 6.10- Variation of co-efficient of friction with joint thickness. ......................... 6-20 Figure 6.11- Shear strength/precompression stress relationship for M95ii test. ........... 6-20 Figure 6.12- Shear strength/precompression stress relationship for M95iv test............ 6-20 Figure 6.13- Variation of initial shear strength with M95 mortar strength. .................. 6-21 Figure 6.14- Variation of co-efficient of friction with M95 mortar strength................. 6-21 Figure 6.15- Shear strength/precompression stress relationship for M60iii test. .......... 6-21 Figure 6.16- Shear strength/precompression stress relationship for M60ii test. ........... 6-22 Figure 6.17- Shear strength/precompression stress relationship for M60iv test............ 6-22 Figure 6.18- Variation of initial shear strength with M60 mortar strength. .................. 6-22 Figure 6.19- variation of co-efficient of friction with M60 mortar strength. ................ 6-23 Figure 6.20- Effect of sand grading on initial shear strength. ....................................... 6-23 Figure 6.21-Effect of sand grading on co-efficient of friction. ..................................... 6-23 Figure 6.22- Effect of joint thickness on flexural strength. ........................................... 6-24 Figure 6.23- Ratio of moduli in orthogonal directions for different bed joints tests. .... 6-24 Figure 6.24- Effect of M95 mortar strength on flexural strength. ................................. 6-24 Figure 6.25 – Ratio of moduli in orthogonal directions for M95 mortar test. ............... 6-25 Figure 6.26- Effect of M60 mortar strength on flexural strength. ................................. 6-25 Figure 6.27- Ratio of moduli in orthogonal directions for M60 tests............................ 6-25 Figure 6.28- Effect of sand grading on flexural strength parallel to bed joint............... 6-26 Figure 6.29- Effect of sand grading on flexural strength normal to bed joint. .............. 6-26 Figure 6.30- Effect of joint thickness on bond strength. ............................................... 6-26 Figure 6.31- Effect of M95 mortar strength on bond strength....................................... 6-27 Figure 6.32- Effect of M60 mortar strength on bond strength....................................... 6-27 Figure 6.33- Effect of sand grading on bond strength. .................................................. 6-27 Figure 6.34- Effect of joint thickness on flexural strength/bond strength relationship. 6-28 Figure 6.35- Effect of M95 mortar on flexural strength/bond strength. ........................ 6-28 Figure 6.36- Effect of M60 mortar on flexural strength/bond strength. ........................ 6-28 Figure 6.37- Summary of shear stress/strain curves for diagonal tensile strength 1mm joint test. ........................................................................................................................ 6-29 Figure 6.38- Summary of shear stress/strain curves for diagonal tensile strength benchmark test. .............................................................................................................. 6-29 Figure 6.39- Summary of shear stress/strain curves for diagonal tensile strength 2.5mm joint test. ........................................................................................................................ 6-29 Figure 6.40- Shear stress/strain comparison for effect of joint thickness...................... 6-30 Figure 6.41- Effect of joint thickness on shear strength. ............................................... 6-30 Figure 6.42- Summary of shear stress/strain curves for diagonal tensile strength M95-ii test.................................................................................................................................. 6-30 Figure 6.43- Summary of shear stress/strain curves for diagonal tensile strength M95-iv test.................................................................................................................................. 6-31

xii
Figure 6.44- Comparison of shear stress/strain curves for the effect of varying grades of M95 mortar. ................................................................................................................... 6-31 Figure 6.45- Effect of increasing M95 mortar strength on shear strength..................... 6-31 Figure 6.46- Summary of shear stress/strain curves for diagonal tensile strength M60-iii test.................................................................................................................................. 6-32 Figure 6.47- Summary of shear stress/strain curves for diagonal tensile strength M60-ii test.................................................................................................................................. 6-32 Figure 6.48- Summary of shear stress/strain curves for diagonal tensile strength M60-iv test.................................................................................................................................. 6-32 Figure 6.49- Comparison of shear stress/strain curves for the effect of varying M60 mortar grades. ................................................................................................................ 6-33 Figure 6.50- Effect of increasing M60 mortar strength on shear strength..................... 6-33 Figure 6.51- Effect of different sands on shear strength................................................ 6-33 Figure 7.1- Dimensions of specimens in mm. ................................................................. 7-8 Figure 7.2- Assumed stress distributions for eccentric loading (a) no tension (b) linear cracked............................................................................................................................. 7-8 Figure 7.3-Variation of compressive strength with e/d ratio for prototype test 1............ 7-8 Figure 7.4-Variation of compressive strength with e/d ratio for prototype test 2............ 7-9 Figure 7.5-Variation of stress at failure with e/d ratio for S4 specimens. ....................... 7-9 Figure 7.6- Variation of compressive strength with e/d ratio for S5 specimens. ............ 7-9 Figure 7.7- Comparison of the effect of eccentricity in prototype and model test. ....... 7-10

xiii
TABLE OF PLATES Plate 3.1(a)- Triplet masonry specimen in preparation.................................................. 3-50 Plate 3.1(b)- Sixth scale wallette specimen in preparation............................................ 3-50 Plate 3.2- Set up of brick modulus of elasticity test. ..................................................... 3-51 Plate 3.3- Prototype brick flexural strength test specimen at failure. ............................ 3-51 Plate 3.4- Set up for brick beam fracture energy test..................................................... 3-52 Plate 3.5- Set up for single brick unit fracture energy test. ........................................... 3-52 Plate 3.6- Set up for half scale model unit fracture test. ................................................ 3-52 Plate 4.1- MMCG used for deformations measurements in the sixth scale................... 4-16 Plate 4.2- Set up for sixth scale triplet and wallette specimens respectively................. 4-16 Plate 4.3- Triplet specimens in the four scales. ............................................................. 4-16 Plate 4.4- Set up for prototype wallette. ........................................................................ 4-17 Plate 4.5- Set up for prototype shear strength test. ........................................................ 4-17 Plate 4.6- Set up for sixth scale shear strength test........................................................ 4-18 Plate 4.7- Set up for prototype flexural strength test. .................................................... 4-18 Plate 4.8- Set up for sixth scale flexural strength test.................................................... 4-19 Plate 4.9- Set up for the prototype bond wrench test..................................................... 4-19 Plate 4.10- Set up for sixth scale bond wrench test. ...................................................... 4-19 Plate 4.11- Wooden panel used for carrying the prototype diagonal tensile strength test specimens....................................................................................................................... 4-20 Plate 4.12- Set up for the prototype diagonal tensile strength test. ............................... 4-20 Plate 4.13- Set up for the half scale diagonal tensile strength test................................. 4-21 Plate 4.14- Set up for the sixth scale diagonal tensile strength test. .............................. 4-21 Plate 5.1- Cracking patterns in prototype triplets. ......................................................... 5-45 Plate 5.2- Cracking patterns in sixth scale triplets......................................................... 5-45 Plate 5.3- Cracking patterns in sixth scale wallettes...................................................... 5-45 Plate 5.4- Shear failure in prototype specimens. ........................................................... 5-46 Plate 5.5- Failure in half scale flexural strength specimens. ......................................... 5-46 Plate 5.6- Failure in sixth scale flexural strength specimens......................................... 5-46 Plate 5.7- Failure in prototype flexural strength specimens. ......................................... 5-47 Plate 5.8- Failure patterns in half scale diagonal tensile specimens. ............................. 5-47 Plate 5.9- Failure pattern in sixth scale diagonal tensile specimens. ............................. 5-48 Plate 7.1- Set up of model test at an eccentricity of 0.25. ............................................. 7-11 Plate 7.2- Typical failure pattern in prototype tests....................................................... 7-11 Plate 7.3 - Typical failure pattern in model tests. .......................................................... 7-11 Plate 7.4- Bond failure in top bed joint of model specimen at e/d of 0.39. ................... 7-12
1 Introduction
1-1
1 Introduction
1.1 Background
Recent programmes of research undertaken using a geotechnical centrifuge on sixth
and twelfth scale masonry arch bridges as well as various other model studies on
masonry-infilled frames, walls and other masonry components and structures has
necessitated further investigation into the small scale experimental structural
behaviour of masonry. This recent interest in masonry modelling has arisen because
of the need to assess and maybe strengthen existing historic masonry structures like
bridges and buildings. For instance there are over 40,000 masonry arch bridges in the
UK. Most of these bridges are over 100 years old, while some are as old as 500 years.
Increasing traffic speeds and weights have made assessing both the ultimate and
serviceability requirements of these bridges necessary.
There is also the need to understand the structural behaviour of masonry structures
under extreme natural events like windstorms, floods, earthquakes etc, since some of
these events, like flooding have become recurrent actions posing danger to thousands
of people inhabiting or working in masonry structures. For example in January 2005,
up to £250m worth of damage was caused by flooding due to very heavy rainfall in
Carlisle, England(1). In Iran an earthquake in Bam killed about 35,000 people and
flattened about 90% percent of the city’s mainly masonry houses(2). Because of the
issues associated with the cost implications of full size masonry tests, coupled with
the danger of instrumentation destruction at failure, repeatability and difficult
boundary conditions it has become increasingly necessary to carry out such tests at
reduced scales.
Small scale centrifuge studies have ranged from investigation into soil/masonry
structure interaction by Taunton(3), to a parametric study of the factors that influence
the strength of masonry arches by Burroughs(4), as well as studies into modelling
repair techniques of masonry arches by Baralos(5) and Miri(6). In these investigations,
a centrifuge was used as a means of simulating full scale gravity stresses on the
reduced scale models. But, it is the case that most model studies are undertaken

1 Introduction
1-2
without recourse to a centrifuge, bearing in mind there are only a few in the UK. Such
other studies have shown that it is possible to model masonry behaviour at model
scale.
The need therefore arose for a small scale experimental testing programme of
masonry with a view to understanding its structural behaviour under a variety of
conditions as will be detailed in the next section.
1.2 Objectives
In general the investigation was aimed at understanding of the model scale structural
behaviour of masonry structures by testing masonry components to determine the
masonry structural behaviour and properties under various conditions, looking at;
• Comparison of masonry behaviour at prototype and model scales under different
loading conditions.
• Parametric study of factors affecting masonry behaviour at a suitable model scale.
• Application of size effect laws from fracture mechanics to masonry test results.
• Application of small scale masonry model testing to a prototype investigation.
1.3 Layout
In Chapter 1, reasons for the need of the research as well as the main objectives have
been presented.
Chapter 2 contains the literature review and starts with discussion on the strength
properties of masonry and factors affecting it. This is followed by a review of small
scale modelling of masonry. Discussion also focuses on size effect issues from the
fracture mechanics perspective and finally the chapter finishes with a look at factors
affecting size effects.
Chapter 3 focuses initially on the considerations that went into the design of the
research programme, looking at the choice of materials, method of construction,
scales considered etc. Discussion on the constituent materials used in the programme
is included as well as the tests on the materials.

1 Introduction
1-3
In Chapter 4, the different categories of tests undertaken at four scales are presented
here. Issues like instrumentation at model scale and fabrication of tests rigs are
discussed.
Chapter 5; the results of the masonry tests conducted at different scales are presented
and discussed here. The masonry structural behaviour at the different scales is
compared for each category of test, while also looking at the effect of scale on the
particular strength property like shear or bond. An analysis of the masonry test data
with respect to the size effect laws of fracture mechanics is also presented.
Chapter 6 discusses a parametric study on a number factors like joint thickness,
mortar strength etc, that affect sixth model scale masonry strength under a variety of
conditions.
In Chapter 7, small scale modelling at sixth scale is applied to a real prototype
problem. The results from the model scale are presented and compared to the
prototype test.
Chapter 8 concludes on the most important findings of the investigation and
recommendations for further study are also detailed.

2 Literature Review
2-1
2 Literature Review
Masonry is a composite material, with the constituents having distinct strength and
deformation characteristics. However even though masonry has been used for
thousand of years it is yet not as well understood as it should be, because of the
different properties of its components as well as its failure mechanisms.
Before going into the mechanics of masonry behaviour under different loading
conditions, it is necessary to first look at those factors that influence masonry
behaviour whatever the loading condition. Because it is these factors that ultimately
determine how good or bad a composite, a particular masonry assembly is. It is the
interaction between the stiff brick and the less stiff mortar bed that largely determines
the overall properties of the masonry assembly under the condition to which they are
subjected.
2.1 Some important properties of the units
Masonry consists of individual units of brick, block or stone bound with a jointing
material usually mortar. Bricks and blocks are made of fired clay, calcium silicate or
concrete. Clay bricks as used in this study are a type of ceramic formed by burning
clay or shale at very high temperatures. Physically they are hard, brittle, non-ductile
and highly temperature resistant. They are made up of varying composition of
silicates and metallic oxides like alumina, kaolinite, mica etc, which are chemically
stable and therefore make clay bricks suitable as a construction material.
2.1.1 Suction rate and moisture content of the unit
During the manufacture of bricks, some pores are formed during firing because of the
combustion of organic matter. This makes them porous with relatively high suction.
According to Sneck(7) the suction rate of the masonry units is the most important
extrinsic parameter affecting the fresh mortar, and consequently the properties of the
hardened mortar and ultimately the properties of the whole masonry assembly. This is
because water suction from mortar by the brick affects the mortar bed as a whole and

2 Literature Review
2-2
the properties of the interface between the unit and the mortar. The suction rate of the
units depends also on a number of factors; the water absorption of the unit, rate of
absorption and the capillary suction force. The water absorption of the masonry unit
gives a measure of the quantity of water that can be removed from the mortar, while
the absorption rate gives a measure of how rapidly water is removed from the mortar.
The capillary suction force could be important in cases where the unit is made up of
material with very fine pores like sand-lime units.
The importance of the amount of water in the mortar cannot be over emphasised,
because it is that which determines the rate of hydration of the cement particles, and
ultimately the strength of a joint and its adhesion to the unit. To underscore this point
Brocken et al(8) under took a Nuclear Magnetic Resonance study of water extraction
from mortar during bricklaying and found that, using a particular fired-clay brick
most of the water was extracted from the mortar in about 3 minutes. In addition they
found that prewetting the same brick by 50% of its saturation value hardly affects the
extraction process. It is only when the bricks are nearly fully saturated that all
extraction of water from the mortar stops. Closely related to the suction rate is the
moisture content of the bricks. The importance of this parameter on masonry
behaviour as stated by Harvey(9) is firstly in the expansion/contraction of the masonry
units as they come into equilibrium with their surroundings. And secondly in the
effect the moisture content of the unit has on the all known physical properties of
masonry. Therefore, for the same type of brick, because of the smaller exposed
surface area in a model unit compared to prototype unit, it could have a faster rate of
coming into equilibrium with the surroundings which could result in a faster suction
rate.
2.1.2 Strength and stiffness of the unit
The compressive strength of masonry units is obviously the most important strength
parameter from the structural perspective. But due to their high porosity and
brittleness, bricks are generally weak in tension and stronger in compression. Their
compressive strength varies over a wide range depending on the porosity of the brick.
Generally, the more porous is the brick the lower is the compressive strength. With
the same brick, the compressive strength of bricks can vary considerably,
consequently a coefficient of variation of between 15 and 20% is typical for a

2 Literature Review
2-3
particular sample(10). The stiffness of clay bricks is approximately 300 times the
compressive strength(11) and because of their brittle nature the stress/strain
relationship remains linear almost up to the point of fracture. As with all ceramics the
strength and stiffness properties of bricks are mainly determined by minute flaws or
cracks in their structure. There is usually a random distribution of such flaws in
various sizes, and the largest of these will be responsible for the fracture of a solid(12).
According to the Griffith concept, the less surface area there is present, the stronger
the material should be, since there is less chance of flaws occurring(13). This implies
that for brittle materials like clay masonry, reduced scale models could be stronger
than the prototypes because of this phenomenon.
2.2 Some important properties of mortars
Mortars are used to bed and join masonry units giving them the continuity required
for stability and exclusion of weather elements(10). The proportion of the different
constituents is usually determined by how the masonry is to be used, which is
governed by the strength requirement of the application, degree of resistance to
movement required, degree of frost resistance and rain penetration required etc.
Traditionally lime is usually added to sand to make mortar, but nowadays cement-
lime-sand, masonry cement–sand or cement-sand with plasticizer are normally used
as mixtures for mortar. Lime is added to cement mortar to improve the workability,
water retention and bonding properties(14).
2.2.1 Water retentivity
Water retentivity allows mortar to resist the suction of dry masonry units and
maintains moisture for proper curing and ensures that hydration of the cement can
take place. It quantifies the mortar's ability to retain its plasticity when in contact with
the absorptive masonry units. If enough water is not retained by a mortar, hydration
will suffer resulting in a poor bond between the brick and mortar(14). This property of
mortar is closely related to the suction rate of a brick, in that, a less absorptive brick
and very retentive mortar will not form a good composite, just as a highly absorptive
brick and mortar with low retentivity will result in a poor bond. This is very important
for model scale masonry because of their relatively thin joints and model masonry
assemblies may therefore require a more retentive mortar than a prototype, to ensure
that there is sufficient water for hydration of the cement.

2 Literature Review
2-4
2.2.2 Strength and stiffness of mortars
The main agent responsible for the setting and strength development of cement
mortars is the cement hydration process. Consequently the higher the cement content
in mortar the higher its strength. But because adequate cement hydration only takes
place in the presence of sufficient water, the water/cement ratio of mortar becomes
one of the most important factors that affect the compressive strength of mortars(14).
There are many parameters that influence mortar strength apart from the water/cement
ratio and they include; cement volume, workability and sand grading. The effect of
sand grading on the compressive strength has shown a higher strength yield in mortars
with coarse sands. While the effect of sand grading on the tensile bond properties of
mortars has been discussed by Anderson and Held (15), who found that the finer the
grading of sand, the lower the bond strength of the masonry. This suggests that, since
very fine sands have to be used in relatively small brickwork models because of the
thin joints, the bond strengths of such models may show lower bond strengths to a
comparable prototype because of this reason. And generally the higher the cement
content of mortar the stronger is the bond while the converse is true for the water to
cement ratio.
The stiffness properties of mortar are also important because they greatly influence
the stiffness properties of brickwork as well as its strength(10). The stress/strain
relationship in mortars usually shows distinct plastic characteristics.
2.3 Properties of the composite
2.3.1 Compression
Masonry is usually loaded in compression in most situations under which it is used.
Under an axial compressive stress on a masonry assembly as shown in Figure 2.1, the
softer mortar expands laterally because of the Poisson effect, but because of the bond
and friction between the mortar and unit, it is confined and unable to expand freely
which results in a state of lateral tension in the unit and triaxial compression in the
mortar(16). It is this state of stress that causes the vertical tensile splitting cracks in
masonry observed in many situations. In some cases failure of masonry can be due to
shear failure along some line of weakness, this type of failure is usually as a result of
the mechanical properties of the mortar being similar , or even greater than that of the
unit(17). In the verification of a theoretical approach to the modelling of masonry

2 Literature Review
2-5
behaviour and its elastic properties, McNary and Abrams(18) found that the strength
and deformation of stack bonded masonry specimens were influenced primarily by
the mortar, but that was not the limiting failure criteria. They concluded that even
though failure of the masonry was as a result of the lateral tensile strength of the unit,
it is the mortar that induces the tensile stresses.
A variety of factors affect the compressive strength of masonry as shown in Table 2.1.
Some of these factors, like the unit characteristics are determined in the
manufacturing process, while others like mortar properties are influenced by variation
in constituent materials, proportioning and mixing(19). Even though masonry strength
is not directly proportional to the mortar strength it does however still increase with
increasing mortar stiffness. This is because as detailed above the tensile stresses in the
unit are due to the mortar. An inherent property of the unit that plays a very important
role in determining the compressive strength is the tensile strength of the units. This is
influenced by the clay quality, firing temperature, porosity etc(17).
Hendry(19) reported that compressive strength of masonry varies roughly as the square
root of the unit strength and the third or fourth root of the mortar strength. Apart from
the strength of the unit, the other properties of the unit that have important influences
on the masonry characteristics include the bed joint thickness and the unit height. An
increase in the former has been reported by Francis et al(20) to decrease the
compressive strength of four unit high stack bonded masonry made with perforated
clay units. Tests by Porto et al(21) have also shown that the compressive strength of
clay block masonry wallettes made with thin layer mortar of 1.3mm average thickness
were 20% more than those made with mortar of 12mm average joint thickness. This
implies that model masonry with very thin joints could show a stronger strength due
to thinness of the joint alone. Hendry(14) also states that the compressive strength of
masonry decreases with increasing unit height due to platen restraint. The influence of
the unit compressive strength on that of the masonry compressive strength suggests
that the Griffith concept as detailed in section 2.1 would also be applicable to
masonry strength which could result in a higher compressive strength in small scale
masonry models.
Various empirical relations have been developed by different authors to determine
masonry strength from the properties of the unit and the mortar. A review of which

2 Literature Review
2-6
can be found in Hendry (19). One of such formulae for the characteristic strength of
masonry provided by Eurocode 6 (EC 6)(22) is given as Equation 2.1
225.065.0 / mmNfKff mbk = (2.1)
Where K is a constant taken as 0.6 for group 1 masonry units, bf is the normalised
compressive strength of masonry units in N/mm2 and mf is the mean compressive
strength for general purpose mortar.
The normalised compressive strength of the masonry units bf , is obtained by
multiplying the mean compressive strength of the samples by a conversion factor of
1.2 to get it to an equivalent to the air–dry condition, which is a requirement before
being multiplied again by the shape factor of 0.85 from the table of shape factors in
EC 6.
From the findings of McNary and Abrams(18), they also found that the theoretical
model they used to predict the compressive strength of masonry from the tests they
carried out, underestimated the actual strength from the test results by about 35%.
This they attributed to among other things, the assumption of uniform lateral strain
conditions at the brick-mortar interface. This assumption does not of course reflect the
unique property of the interface.
The deformation properties of masonry seem to be determined mainly by the softer
mortar bed, therefore masonry stiffness increases with increasing mortar strength.
However masonry stiffness is still often directly related to brick strength(23). The
influence of mortar in determining the stiffness properties of masonry is best
illustrated from the findings of Lenczner(10), which showed that there was almost no
change in the stiffness of masonry made with 1: 1/4:3 mortar using units with very
dissimilar strengths; one with a mean strength of 32.6 N/mm2 and the other 90.2
N/mm2. The stiffness properties of masonry are different in the two orthogonal
directions because of the anisotropy of the unit(24-26). This could be due to way the
clay brick is extruded and then fired. This further illustrates the difficulties in
accurately modelling the properties of masonry.
Equations for the determination of masonry stiffness show that some of these relations
are dependent on unit strength, like that of Plowman(23), while others are dependent on

2 Literature Review
2-7
the masonry strength as those reported by Sahlin(11) and the ones used in BS 5628(27)
and Eurocode 6 (EC 6)(22). Brooks and Baker(26) use an analytical approach to propose
a formula shown as Equation 2.2 that estimates masonry stiffness, Ewy depending on
the unit strength, fby, and mortar strength, fm, as well as a coefficient that takes into
account the water absorption properties of the unit, γwa.
wabywy fE γ
175.015.21+= (2.2)
An empirical relation from EC 6(22) for the masonry stiffness uses a very simple
approximation given as Equation 2.3
kfE 1000= (2.3)
Where fk is as previously defined. Knutsson and Nielsen(28) observed that it is rather
too simplistic to use this approximation, since the stiffness and strength are not
uniquely related for different types of masonry.
2.3.2 Shear
The shear strength of masonry is of significance when designing for lateral forces on
walls. Resistance of a wall to horizontal shear increases as the normal load it is
subjected to, is increased. Many authors(10, 11) have found the relationship between the
shear strength, τ and the precompression force follows a Coulomb type relationship
given by Equation 2.4.
Cμσττ += 0 (2.4)
where 0τ is the shear strength at zero precompression, μ is an apparent coefficient of
friction and Cσ is the normal compressive stress. This relationship holds up to a
certain value of the normal precompressive stress beyond which joint failure between
the unit and mortar is replaced by cracking through the units. The limiting value for
the normal compressive stress for clay brick masonry has been determined to be
around 2.0 N/mm2 (14). For higher values of the compressive stress, cracking through
the units is further replaced by crushing failure of the masonry. The entire failure
envelope for the different failure stages is shown in Figure 2.2 according to the failure
theory developed by Mann and Muller(19) in Hendry(19). This failure envelope is

2 Literature Review
2-8
slightly different to the one proposed by Riddington and Ghazali (29), in their case at
higher compressive stresses of above 2.0 N/mm2, tensile failure of the mortar is
replaced by a joint slip failure as determined using triplet specimens. Their findings
also showed that the average bond shear strength of masonry reduces as the degree of
bending, to which the specimens were subjected, is increased. The degree of bending
in the specimens was varied by moving the support from a position that is just close to
the joints to the edge of the two outer units, while the loading condition were kept
constant. Set up of the triplet test will be discussed in Chapter 4.
In reporting on some aspects of a programme of tests involving about 1300 triplets,
Jukes and Riddington(30) found that the degree of bending as defined earlier plays an
important role in the shear strength of masonry. They recommended a test
arrangement as in BS EN 1052-3(31) that minimises the effects of bending on the
specimen. This is because bending causes a deviation from the normal Coulomb
criterion for shear failure, which is that of linear shear stress/precompression stress.
This finding would be more critical for model tests since the boundary conditions for
minimum bending in such tests would be relatively difficult to achieve than for a
prototype test.
2.3.3 Flexural strength
When masonry is required to withstand out of plane lateral loads knowledge is needed
of its flexural strength. In most situations because of the way masonry is built, it is the
flexural strength normal to the bed joints, normal that structural engineers are
interested in. However if masonry is supported on its vertical edges, by say columns,
but free at its upper and lower edges, its flexural strength parallel to the bed joints,
parallel also becomes important. The flexural strength in this direction is usually about
3-6 times more than the flexural strength normal to the bed joints(11).
If the brick-mortar bond is good, the flexural strength parallel to the bed joint is
limited by the modulus of rupture of the units. But if the adhesion is poor, the limiting
factor is the shear strength of the unit mortar interface in the bed joints(14). In the first
instance the failure takes the form of a crack through the perpend joints and units.
While in the second case failure is in the form of a zigzag through the bed joints and
perpend joints(32).

2 Literature Review
2-9
The limiting factor in the flexural strength normal to the bed joints is either the bond
strength or the tensile strength of the mortar. Failure is usually occasioned by failure
in the mortar joint, or in the interface between the mortar bed joint and the unit or
sometimes partly in the mortar and unit(11). Many factors affect the flexural strength in
this direction, some of which, as discussed by Sise et al (33), include the moisture
characteristics of the unit and mortar composition, as well as the joint thickness and
curing conditions. But they concluded that the joint thickness was the single most
important factor affecting the flexural strength normal to the bed joints. Their findings
also showed that there is an optimum moisture content in the units for good bond
development, beyond which the flexural bond strength begins to drop. This is
corroborated from findings by Fried and Li(34), who also found that the flexural bond
strength increases slightly when the units were fully saturated. However in a recent
paper by Reda Taha et al(35), they found that the volume of cement in the mortar is the
most important parameter governing bond strength in masonry. There appears to be
no unanimity on the factor that has the most influence on bond strength so far,
probably because there are many variables involved and the test methods and curing
conditions are also different. However because of the thin joints in small scale
masonry models, the flexural strength normal to the bed joint could be lower due to
findings by Anderson and Held (15) (section 2.2.2) that mortar with fine grained sand
result in a lower bond strength.
2.3.4 Tensile strength
Direct tensile stresses in masonry are mainly due to in-plane loading effects caused by
wind, eccentric gravity loads, and thermal/moisture movements or by foundation
movement(14). The tensile strength of masonry is generally controlled by the tensile
bond strength at the brick-mortar interface. This is influenced by many characteristics
of the units and mortars as discussed by Groot (36), who found the moisture
content/suction of the unit as one of the main variables affecting the tensile bond
strength, as well as the mortar composition (including sand grading).
The nature of the bond is mechanical-chemical as reported in a paper by Shrive and
Reda Taha(37) from findings by Dubovoy and Ribar(37). The chemical nature of the
bond is due to the covalent or Van der Waals bond between the unit and cement
hydrates. While the mechanical bond is due to the mechanical interlocking of the
2 Literature Review
2-10
hydration products transferred into the surface pores of the unit. However, it was
argued that the mechanical bond is much stronger than the chemical bond.
Various methods have been used for the determination of the bond strength of
masonry, and can be divided into; direct tensile bond methods like the couplet test and
the flexural bond strength methods like the bond wrench test. The former use direct
tensile principles to test the joints under consideration while in the latter, bond
strength is determined by subjecting the specimen to some form of bending stress. In
a review of bond strength test methods by Jukes and Riddington(38), the authors were
of the view that a direct tensile bond test method is more appropriate for testing the
in-plane bond strength of masonry. While the bond wrench test is ideal for testing the
out-of-plane bond strength of masonry, in their view the flexural bond strength tests
measure the bond strength of the edge of a joint, which could be different to that at the
centre. However, whatever the deficiencies of the bond wrench test, it provides an
easy and repeatable way to determine the bond properties of masonry as evidenced in
its recent adoption in the British Standards as a test method for determining the bond
strength of masonry; BS EN 1052-5:2005(39).
2.4 Structural models
A structural scale model is any structural element or assembly of structural elements
built to a reduced scale (in comparison with full size or prototype structures) which is
to be tested, and for which laws of similitude must be employed to interpret the
results.(40)
Structural modelling involves a broad range of studies on full scale structures, also
called prototypes, in virtually all fields of physical engineering under a variety of
loading conditions including; static, dynamic, seismic, wind, zero gravity etc.
2.4.1 Classes of structural models
Models can be classified into different categories based upon their intended purpose.
Questions that arise in model application studies decide which class of model is
suitable for a particular research. Such questions could be whether an elastic response
is sufficient or a complete loading behaviour is necessary to understand the mode of
failure of the model.(41)

2 Literature Review
2-11
2.4.2 Elastic model
Elastic models as the name suggests are types of models that are used for studies in
the elastic range only. The homogenous elastic material for the model may not
necessarily have any semblance to the prototype material but the model still has a
direct geometric correlation to the prototype. The post cracking behaviour of masonry
or concrete and the post yield behaviour of steel cannot be predicted with this type of
model.
2.4.3 Indirect model
An indirect model is a type of elastic model that is used to obtain influence diagrams
for reactions, shearing forces, bending moments, axial forces etc. Load application in
such models has no direct bearing to the actual loads expected on the prototype, since
load effects are determined from superposition of the influence values. Thus these
models do not have a direct physical resemblance to the prototype. Their application
is less today as computers are now used for purely elastic calculations.
2.4.4 Direct model
A direct model is a geometrically similar model to the prototype in all ways, and load
application in this model is the same as in the prototype. Strains, deformations, and
stresses in this model for a particular loading condition are typical of similar
quantities in the prototype for the corresponding loading condition. An elastic model
can also be a direct model.
2.4.5 Strength model
A strength model is also called an ultimate strength, realistic or replica model; it is a
direct model that is made of materials that are similar to the prototype materials such
that the models will predict prototype behaviour for all loads up to failure. The
models under investigation in this research project would be looking at strength
behaviour as well as other effects.
Other model types include wind effects models, dynamic models, design models,
photomechanical models etc.

2 Literature Review
2-12
2.5 Brick masonry modelling
In the last century, the first small scale masonry model test was perhaps the one
carried out by the Road Research Laboratory (now TRL) under the auspices of the
RAF. The aim of the test was to predict the effect of bombing specific German dams
during the Second World War. 5 million bricks of approximately 5mm by 7.5 mm by
10 mm were used to represent the dam at a scale of 1:50. The model test showed that
a breach could be produced by a bomb from an aircraft at some predetermined
distance from the crest of the dam. This proved to be the case when the Moehne and
Eder dams were breached by RAF planes bombardment in 1943.(42)
2.5.1 Uniaxial and biaxial strength tests on piers and walls
H. Vogt (43) carried out a series of tests in the 1950’s, on fourth scale model bricks of
size 60mm by 29mm by 20mm assembled in the form of pillars, of cross section
60mm by 60 mm and 300mm high (about 12 courses). The pillars consisted of two
model bricks with the joints at 90° in alternate courses. 8 pillars were tested in 4
groups, with 2 pillars in each group. Group 1 pillars had cement mortar joint; Group 2
had lime-cement mortar, Group 3 lime mortar, while Group 4 had cardboard strips as
joints. The results showed that, the mortar strength exhibited a decreasing trend from
Group 1 to 3, Group 1 being the strongest. Similarly the compressive strength of the
pillars also showed this decreasing trend from Group 1 to 3. The pillars in Group 4
remarkably had strength of about 50% more than that of Group 3. Based on the results
the author concluded that the tensile strength of the joint material played an important
role in the overall strength of the pillars. Further tests carried out on reinforced pillars
in a second programme of tests, led the author(43) to conclude that it was feasible to
carry out test on model scale bricks with some degree of confidence.
A testing programme conducted by Hendry et al (44), concluded that it was possible to
reproduce the strength of full scale brickwork strengths from tests on model
brickwork. The model tests on one third and sixth scale model bricks consisted of
replicating tests carried out on full scale masonry specimens, by other researchers, in
three categories of tests. The first series of tests were concerned with the relationship
between strength of brickwork and mortar strength. In the second series the effects of
eccentricity and slenderness were considered. Lastly, in the final programme of tests
the effect of elastic restraint afforded by slabs to wall connections was investigated. In

2 Literature Review
2-13
the first category of tests, square piers consisting of 2 bricks per course laid at right
angles to the bricks in the next course in an alternate fashion and 11 courses high,
were tested in compression. Both third and sixth scale piers were tested in this manner
using mortars of different mixes and strengths. The variation of brickwork strength
against mortar strength using 25.4mm (1 inch) cubes showed good correspondence
between the model and full scale results although there was considerable scatter in the
results. The strength axes were normalised with respect to the brick strength to give
dimensionless scales to allow for comparison of the full scale and model scale results.
The failure pattern in both full and model tests also was similar with the brickwork
failing under horizontal tension. Mortar strengths obtained from 25.4mm (1inch)
cubes were found to be more appropriate for the model scale in place of the traditional
70.6mm (2.78) inch cubes.
To investigate the effect of eccentricity and slenderness in the second group of tests,
piers of both third and sixth scale models of varying heights were tested with knife
edge loads at various eccentricities. The results again showed acceptable agreement
between the full scale and model scale results even in their mode of failure, which
was mainly by buckling.
In the last batch of tests sixth scale model walls loaded between reinforced concrete
slabs were modelled. As was the case with the full scale tests, the model walls
generally failed by vertical splitting, showing good correspondence between the two
tests in terms of the failure pattern. Because of the difference in the brick strengths in
the full scale and model scale tests, it was necessary to adjust the full scale brick
strengths by application of factor using a relationship derived by Davey and
Thomas(44) in Hendry et al (44), in order to allow for comparison between the two
scales. From these adjustments it was seen that there was good agreement between the
brickwork strength in the model and full scales. One area of divergence in the test
results was in the modulus of elasticity of the model walls which was about half the
value at full scale. No explanations were given by the authors for that behaviour and
as such no comparisons were drawn in that regard.
Sinha and Hendry(45) investigated the effect of brickwork bond on sixth scale model
brick walls and concluded that the different bonds considered did not affect the
brickwork strength in any significant measure. A note was also made of the failure

2 Literature Review
2-14
mode of the walls, which was typically by vertical splitting, underlying the
importance of the tensile strength of the brick, in the behaviour of the brickwork in
compression.
In another study by Sinha and Hendry(46) the relationship between brickwork strength
under compression and brick crushing and tensile strengths was explored using sixth
scale models walls and piers along with other parameters. Generally it was observed
that brickwork strength increased with the compressive strength of the brick used but
not in direct proportion. In contrast, the relationship between the brickwork and
tensile strength was reasonably linear, probably due to the failure of the brickwork by
tensile splitting. Thus it was suggested by the authors that the tensile strength of
bricks appeared to be a better indicator of brick performance in brickwork than the
conventionally used compressive strength test.
Khoo and Hendry(47) carried out a series of tests on third scale model bricks in order
to establish a failure criterion for brickwork in compression. The basis of their failure
theory was that an element of brick under uniform vertical compression within a
masonry panel is influenced by a combination of vertical compression and bilateral
tension. The latter as result of differential lateral strain between the brick element and
mortar bed. The horizontal mortar joint is therefore in a state of triaxial compression,
comprising a vertical compression and a pair of lateral compressions. According to
the authors, this interplay of forces causes a slightly concave bi-axial compression-
tension failure envelop for brick as the results of their investigation showed,
indicating a greater interaction of compression –tension than the theoretical curves of
other researchers. The main draw back of the earlier theoretical failure theories on
masonry is their over simplification of the interaction between the brick and mortar
under stresses, which may not be elastic because of the heterogeneity of the mortar.
In an investigation to determine the strength of brickwork under biaxial tensile and
compressive stress by Samarasinghe and Hendry(48), the authors used sixth scale
model bricks for their research. Panels measuring 150 x 150 x 18mm and 230 x 240 x
18mm were used for the investigation. From their results the authors concluded that
the biaxial strength of brickwork cannot be represented wholly by a two dimensional
relationship between the principal stresses without considering a third variable; the
bed joint in relation to the principal stresses. Thus the failure surface of brickwork in

2 Literature Review
2-15
biaxial stress must be defined by a three dimensional surface namely; the major
principal stress, a minor principal stress and their orientation relative to the bed joint.
Using the results of this study the authors developed a finite element model to
simulate the in-plane behaviour of brickwork(49). By the use of shear wall tests to
validate the model, they showed that the crack pattern and associated stress levels can
be predicted, so also could the load condition at failure which could be estimated
provided that there was no extensive cracking at the base of the wall.
Page (50) investigated the biaxial compressive strength of brick masonry using half
scale model bricks. The results showed that masonry exhibits directional properties
that require the use of a three dimensional surface in terms of the two principal
stresses and their orientation to the bed joint as highlighted in the preceding paper(49).
The author concluded that the bed joint orientation did not play a significant role in
the failure mode of the masonry panels except in cases where one of the principal
stresses was dominant. He also found that for most principal compressive stress ratios,
the uniaxial panel strength with the load normal to the bed joint underestimated the
biaxial compressive strength irrespective of the bed joint orientation.
Egermann et al(51) undertook a testing programme to compare the strength and
stiffness relationship of brick masonry at different scales. Tests were carried out at
full scale, half scale and fourth scale in order to compare the strength- stiffness
behaviour at these scales. The results were correlated with those of an earlier study by
Hendry and Murthy(44), and both showed that model brickwork strengths can be
reasonably used to predict prototype brick strengths for the same brick type. However
the stiffness of the model walls was observed to decrease in proportion to the scale.
This according to the authors could be due to poorer compaction of the mortar bed in
the model walls and or to the size of the walls (to use the analogy of soils, where the
larger particles have a higher stiffness ratio.)
In a recent research carried out to investigate the behaviour of brickwork at small
scale, Hughes and Kitching(52) found that using sixth scale model bricks cut from full
scale bricks, it was possible to replicate prototype strength behaviour in line with
previous authors. However the sixth scale model specimens were about 50 % as stiff
as the prototype specimens to support the point made in the last paper and first raised

2 Literature Review
2-16
by Hendry and Murthy(44), that the deformation and stiffness behaviour of full scale
brickwork is not properly modelled at model scale.
2.5.2 Shear strength tests
One storey height, 3 bay, brick wall panels in the form of cross walls made of sixth
scale model bricks were tested by Murthy and Hendry(53) in order to determine the
correlation between the shear strength of the panels and the vertical compressive
stress they were subjected to. The horizontal shear force was applied at the floor slab
level through a hydraulic jack. Results obtained from the model tests compared well
with the shear resistance calculated from the coefficient of friction of a pair of bricks
under vertical stress, with a mortar bed in between them. The mortar bed was
prevented from making a bond in between the bricks by separating them during
setting with a thin film of paper. A modified soil mechanics shear box was used for
the determination of the coefficient of friction, and was found to be approximately
0.72.
Further tests(53) on sixth scale 3 storeys, 3 bay, cross wall structures were carried out
to investigate how the rigidity of shear panels affected the ultimate strength of the
structure. The lateral loading was applied at right angles to the cross-walls, and the
dead load of the structure increased six fold in order to achieve correct scaling of the
dead load stresses. By adding the shear walls in stages in the bays, their effect on the
rigidity of the structure was observed to vary considerably from 15.7 times with one
bay infilled to 104 times with infill in all three bays compared with the initial
structure without infill. The ultimate load was determined with all the bays infilled.
The results established the reliability of model scale results even though no direct
comparisons were made to full scale tests.
In similar work by Kalita and Hendry(54) , on lateral loading of a sixth scale model
cross wall structure of 5 storeys, they concluded that the model results showed
reasonable agreement with finite element analyses of the same structure, provided that
the shear modulus of the brickwork was varied with the level of precompression.
Sinha et al(55) carried out model and full scale tests on five storey cross wall structures
under lateral loading to simulate wind type loading conditions. The model structure
was made of sixth scale bricks and loaded with a purpose built frame for the

2 Literature Review
2-17
application of the loads, while the full scale tests were undertaken on a five storey
building in a disused quarry, where the horizontal loads were applied by jacking the
structure against the quarry face. The deflection results of the two tests showed good
agreement at low stresses but were considerably greater for the model structure at
higher stresses.
2.5.3 Lateral and flexural load tests
One third model scale wall panels were used by Baker(56) to investigate their
behaviour under wind type loads. All the panels were 27 courses high and 10, 15 or
20 bricks long, giving aspect ratios of 1, 1.5 and 2 respectively. In order to achieve
uniformity in the wall construction the panels were laid on their sides and mortar
vibrated into the joint spaces while the bricks units were clamped in position on a flat
base over a vibrating table. This ensured uniformity of the joints in the walls and a
rapid construction time of 10 minutes for each wall. Testing was also carried out in
this orientation; that is with the panels cast horizontally on their sides and then loaded
through a water bag that exerted an upward pressure on the walls. Thus the effect of
gravity is missing both in the actual construction of the specimens and the testing.
Since the paper was focused mainly on highlighting the manufacture and testing of
the wind panels nothing significant was reported on the findings from the test results,
apart from a mention that the test provided an accurate and simple reading of data.
Duarte and Sinha(57) investigated the effect of lateral pressure on half scale model
brickwork panels with openings in the middle in order to understand the real
behaviour of brickwork cladding with window openings, as found in buildings. The
lateral load was applied until failure via an air bag placed in between the panels and
the loading frame. Different aspect ratios and boundary conditions were explored in
the testing regime, but in each case the opening was positioned in the centre of the
panels. The results of the experimental programme were compared to a yield line
analysis and an elastic analysis using a standard computer program, with the former
giving results that were in reasonable agreement to the experimental investigation.
The results also showed that the flexural tensile strengths of the specimens normal
and perpendicular to the bed joint were similar.
In out of plane loading tests for the investigation of the influence of size on the
flexural strength masonry, Lourenco and Barros(58) tested a number of block masonry

2 Literature Review
2-18
panels of varying height, ranging from 100mm to 300mm. The results showed that
there was a reduction in the flexural strength as the specimen height was increased. In
concluding the authors suggested that the masonry codes should include provisions
for making the flexural strength dependent on specimen height.
2.5.4 Reinforced masonry
Suter and Keller(59) used third model scale brickwork to determine the ultimate shear
strength of reinforced brickwork lintels and compared the results to three other tests
on full scale lintels. All the specimens were five courses high while the width varied
from just a single brick to two bricks separated by a grouted and reinforced cavity.
The specimens were tested by a two point loading arrangement to bring about a shear
failure. Overall the results of the third scale and full scale tests showed good
agreement, and therefore, the authors concluded that it was possible to use small scale
bricks to model the shear behaviour of full scale lintel beams.
2.5.5 Prestressed masonry
Third model scale bricks were utilised for an investigation of the behaviour of post
tensioned brickwork fin walls by Daou and Hobbs(60). The 1.52m model cross walls
were constructed on a reinforced concrete base and were tested while held in position
at the bottom in the form of a cantilever. Prestressing and load testing were carried out
on the same day to eliminate time dependent prestress losses. A lateral loading system
was used to stimulate earth pressures as obtained in retaining walls. Variables in the
testing programme were prestress force, steel area and the arrangement of the lateral
loading system. The data obtained provided useful knowledge on the understanding of
how the variables interacted.
2.5.6 Seismic effect studies
Reduced scale models of masonry buildings have been used to study the effect of
earthquakes because of their relative ease of construction and testing compared to full
size buildings. In this area, shaking table tests have been extensively employed to
investigate the response of masonry models of different forms construction.
Qamaruddin et al(61) used fourth scale models to test the suitability of a so called
sliding building model concept for earthquake zones before half scale models were
later employed in the actual testing programme. The authors found that lintel bands

2 Literature Review
2-19
and steel at the corners and junctions of walls, as well as at the jambs of openings
were adequate in giving the required strength and energy absorbing capacity even for
the severest of earthquakes. Other shaking table tests by various authors(62-65) have
shown that scale models can be conveniently used to undertake seismic effect
investigations of masonry buildings.
2.5.7 Centrifuge modelling
The use of a centrifuge for modelling of masonry structures at small scale was
perhaps pioneered by Taunton(3), who used one to study the soil/masonry structure
interaction as it related to arch bridges. Using a geotechnical centrifuge to accurately
scale up the gravity stresses of a sixth scale model of an arch bridge, the results
showed good correlation with documented failure mechanism of similar full scale
arches and good modelling of peak loads. Other results of distorted twelfth and
eighteenth scale models having the same width as the sixth scale model but with
correctly scaled ring thickness and span length did not show good correspondence to
the prototype tests. The author attributed this to defects in the construction of the
models because of their very small sizes. Of particular importance was the observance
of the separation of the arch ring in the centrifuge model tests, a phenomenon hitherto
induced only by artificial means in conventional small scale model tests. This finding
in addition to the repeatability of modelling peak loads led the author to the
conclusion that a centrifuge can be effectively used for small scale modelling of
masonry arch behaviour.
Hughes et al(66) have discussed the advantages of using a centrifuge to undertake
small scale modelling of masonry. The paper highlighted the areas centrifuge
modelling could be used in like seismic effects on masonry, blast action on structures,
masonry arch bridge modelling etc. They concluded that the main benefit in using the
centrifuge lies in accurately scaling gravity stresses while carrying out the tests in
highly controlled environment and flexible conditions.
Sicilia(67) undertook a study of a 3D masonry arch at Ponypridd, Wales (built by
William Edwards) using both a 1/55 centrifuge model and FE analysis. His research
confirmed that centrifuge modelling can be used to produce repeatable results on
complex masonry arch structures. Further research explored the small scale modelling
of the repair techniques of arch bridges using a centrifuge. Work by Barolos(5) showed

2 Literature Review
2-20
the feasibility of using a centrifuge to model different repair techniques in arch
bridges. These included the use of steel bars, dowels and meshes within grout and
microconcrete in damaged arches.
Another investigation by Burroughs(4) looked into the parameters that influence the
strength of masonry arches using a centrifuge. A series of 1/12 scale models with full
size spans of 6m were made and tested for the effect of arch barrel thickness, masonry
strength, loss of mortar etc under serviceability and ultimate loads. On the whole the
findings gave new insights into the behaviour of masonry arches behaviour under
ultimate and serviceability loads.
2.6 Models and size effects
Historically the value in scale models lies in being able to predict the behaviour of a
prototype model from the scale model. Presently small models are usually used to
validate numerical models which will then be used to predict the structural behaviour
of whole structures like model arch bridges and buildings. However for a researcher
to be able to predict this with some degree of confidence, knowledge is required of the
effect of size or scale on the model material. This becomes more important in the case
of composites like masonry where the constituent brick and mortar have different
properties. Therefore an appreciation is needed of the effect of size or scale on the
model material, if reliable model studies are to be made.
2.6.1 Size effect
Scale effect is a phenomenon related to the change, usually an increase in strength
that occurs when the specimen size is reduced (41). The importance of this effect
cannot be overemphasised as more and more reduced scale model studies are being
undertaken for the prediction of various aspects of prototype behaviour and design
strengths (that is in codes and standards). Correct understanding of size effects is also
necessary for the accurate interpretation of material properties tests of various sizes
and shapes in different parts of the globe.
2.6.2 History
The subject of size effect of objects was discussed by Leonardi da Vinci as early as
the 1500’s, and concluded that “among cords of equal thickness the longest is the
least strong”. He also added that a cord “is so much stronger … as it is shorter”(68).

2 Literature Review
2-21
After more than a century Galileo, in 1638, rejected Leonardo’s exaggerated rule and
argued that cutting a long cord at various points should not necessarily make the
remainder stronger. However he added that a size effect is seen because large animals
have relatively bulkier bones than small ones, which he referred to as the “weakness
of giants”.
Some decades later Mariotte experimented with ropes, paper and tin and concluded
that “a long rope and a short one always support the same weight except that in a long
rope there may happen to be some faulty place in which it will break sooner than in a
shorter (one)” He suggested that this is as a result of the principle of “the inequality of
matter whose absolute resistance is less in one place than (in) another”. In effect he
had put the foundations of the statistical theory of size effect, two and half centuries
before Weibull.
Griffith’s (68)famous work in 1921 followed, which founded the theory of fracture
mechanics and also introduced fracture mechanics into study of size effect. Griffith
concluded from his observations that “the weakness of isotropic solids… is due to the
presence of discontinuities or flaws. The effective strength of technical materials
could be increased 10 or 20 times at least if these flaws could be eliminated”. His
work in effect provided an experimental basis of Mariottes’s statistical concept of size
effect rather than a discovery of a new type of size effect(68). Weibull then completed
the statistical size effect initiated by Mariotte in a series of papers over 17 years from
1939-1956(68). Most of the studies thereafter until the 1980s dealt with the purely
statistical origin for size effect on the strength of quasi-brittle materials, therefore
until the mid 1980’s size effect on strength was thought of as having a statistical
origin. This is seen in Sabnis’s review(69) of studies in the area in which he only
discussed the known statistical concepts at that time of bundled strength and weakest
link. The most notable of the statistical concepts was the latter, which holds that, the
presence of a single severe defect in any of the constituent elements is adequate to
cause failure of the whole material. Consequently the failure strength of a specimen
subjected to uniform stress is determined by the strength of the weakest element
present. The most prominent exponent of this theory was Weibull (69).

2 Literature Review
2-22
2.6.3 The energetic and deterministic size effect
In Linear Elastic Fracture Mechanics (LEFM), where the failure criterion is expressed
in terms of the energy consumed per unit crack length increment. The fracture process
is assumed to occur at one point, the crack tip, which exhibits the strongest possible
size effect. In this case the nominal strength is inversely proportional to the square
root of structure size (70). But this is only true if the cracks are large and there is a
sudden failure at the start of cracking. This theory can therefore, only be true for very
large structures in which failure occurs immediately after crack initiation. However it
has been observed that concrete test data do not follow LEFM criteria, neither do they
obey strength theory, in which there is no size effect. Therefore there is need for a
non-linear form of fracture mechanics that takes into account the stable crack growth
and the large micro-cracked zone of the fracture surface. This criteria or law as shown
in Figure 2.3, bridges the zero size effect of the strength criterion and the size effect
predicted by LEFM because it recognizes the large size of the micro-cracked zone of
quasibrittle materials like concrete, rocks and clay bricks. It is seen from the figure
that most structures lie in between the strength criterion (most laboratory tests) and
LEFM (very large structures like dams). This figure suggests that there may not be a
strong size effect for most tests conducted in laboratories with a relatively small size
for a reference structural size D (as defined below). This could apply to this
investigation since the tests would be on small masonry assemblies and not large
masonry structures.
The size effect derived by Bazant(71) is based on the theory of stress redistribution and
fracture energy release. It is assumed that the length of a crack at maximum load is
proportional to a reference structure size D (say beam depth) while the size (width) of
a fracture process zone at maximum load is constant, related to the heterogeneity of
the material. The fracture energy, Gf is defined as a material property representing the
amount of energy required to propagate a unit area of crack, then the energy used and
released by fracture is proportional to GfD(68). Because the energy required to produce
a unit fracture extension is approximately independent of the structural size, the
nominal stress at failure of a larger structure is lower than for a smaller one, so that
the energy release would exactly match the energy required for the fracture
formation(72).

2 Literature Review
2-23
The size effect on structural strength is taken as the effect of the characteristic
structure size (say D) on the nominal strength σN of the structure when geometrically
similar structures are compared. This size effect in two dimensions is defined in terms
of a nominal stress at failure in Equation 2.5
N = Cn( Pu/bD) (2.5)
Where Pu = maximum (ultimate) load, b = thickness of specimen or structure, D =
characteristic dimension, and Cn = dimensionless constant. This is rewritten in terms
of size effect of fracture mechanics type in the form of Equation 2.6
N = )1( β+
to fB, =β D /Do (2.6)
Where ft = is a measure of material strength introduced to make Bo non-dimensional
and Bo and Do are empirical constants; coefficients Bo and Do represent specimen
shape and size. This assumes that the thickness b = constant for different D and also
the specimen proportions are constant for all sizes. When the specimen is small,
plasticity is also small, size effect does not manifest at these smaller values of , and
effectively results in a horizontal curve as seen in Figure 2.3. At intermediate values,
there is a smooth transition and in the case of LEFM at large sizes ( ) at which
case size effect is very pronounced it approaches the asymptote with slope of 1:2(41).
Equation 2.6 can be transformed to a linear plot in the form of Equations 2.7 and 2.8
Y = AX+ C (2.7)
Where X = D, Y =( )2
1
Nσ, A =
22
1
too fBD, and C = ADo (2.8)
The intercept C and slope A can be determined through linear regression analysis of
data.
Some criticisms abound in the literature regarding the applicability of the law to
unnotched structures. Carpenteri and Chiaia(73) observed that in deriving the formula
the energy dissipated to cause fracture in a notched specimen is proportional to GfD,
and D is proportional to the crack length. But for unnotched specimens the length of
the characteristic flaw responsible for crack propagation is independent of specimen
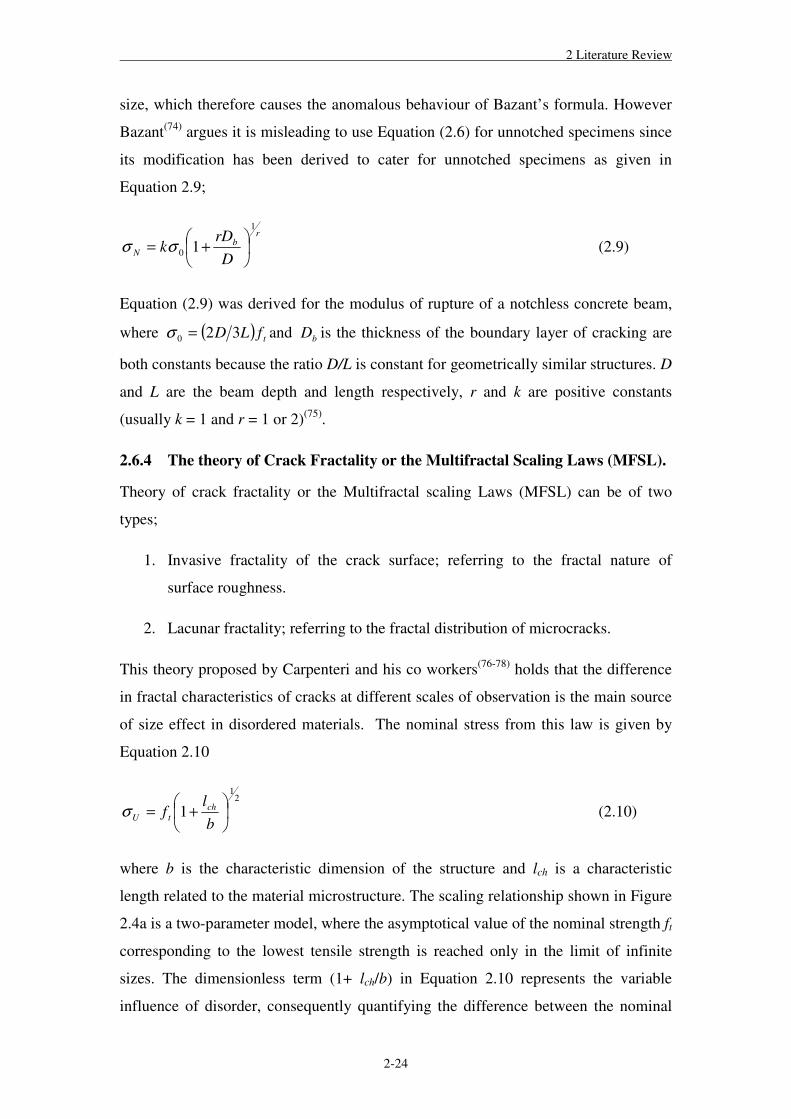
2 Literature Review
2-24
size, which therefore causes the anomalous behaviour of Bazant’s formula. However
Bazant(74) argues it is misleading to use Equation (2.6) for unnotched specimens since
its modification has been derived to cater for unnotched specimens as given in
Equation 2.9;
rb
N D
rDk
1
0 1+= σσ (2.9)
Equation (2.9) was derived for the modulus of rupture of a notchless concrete beam,
where ( ) tfLD 320 =σ and bD is the thickness of the boundary layer of cracking are
both constants because the ratio D/L is constant for geometrically similar structures. D
and L are the beam depth and length respectively, r and k are positive constants
(usually k = 1 and r = 1 or 2)(75).
2.6.4 The theory of Crack Fractality or the Multifractal Scaling Laws (MFSL).
Theory of crack fractality or the Multifractal scaling Laws (MFSL) can be of two
types;
1. Invasive fractality of the crack surface; referring to the fractal nature of
surface roughness.
2. Lacunar fractality; referring to the fractal distribution of microcracks.
This theory proposed by Carpenteri and his co workers(76-78) holds that the difference
in fractal characteristics of cracks at different scales of observation is the main source
of size effect in disordered materials. The nominal stress from this law is given by
Equation 2.10
21
1+=b
lf ch
tUσ (2.10)
where b is the characteristic dimension of the structure and lch is a characteristic
length related to the material microstructure. The scaling relationship shown in Figure
2.4a is a two-parameter model, where the asymptotical value of the nominal strength ft
corresponding to the lowest tensile strength is reached only in the limit of infinite
sizes. The dimensionless term (1+ lch/b) in Equation 2.10 represents the variable
influence of disorder, consequently quantifying the difference between the nominal

2 Literature Review
2-25
quantity measured at scale b and the asymptotic value. In the logarithmic plot shown
in Figure 2.4b, the transition from the fractal regime to the homogeneous becomes
clear. The threshold of this transition is represented by point Q, whose ordinate and
abscissa are log ft and log lch respectively.
Some observations have been made by Bazant(68, 74) on the MFSL some of which are:
1. That the MFSL is identical to a special case of the energetic- statistical scaling
law for failure at crack initiation (Equation (2.9)).
2. That the derivation of MFSL from fractal concepts includes problematic steps
which invalidate it and that the MFSL does not follow mathematically from
the fractal hypothesis made by its proponents.
3. That the MFSL cannot predict the dependence of size effect law parameters on
the structure geometry. On the other hand, the energetic theories are able to
predict their dependence.
It can be seen that taking k = 1 and r = 2 in Equation (2.9) gives
21
0
21+=
D
DbN σσ (2.11)
The remarkable similarity between Equations 2.10 and 2.11 is then apparent, and the
constants in the equations can easily be obtained through statistical regression of test
data as before.
2.6.5 Karihaloo’s size effect formula for notched quasi-brittle structures
Karihaloo(79) used the concept of a fictitious crack model (FCM) to arrive at a size
effect formula for the nominal strength of notched three point bend fracture specimens
of concrete and other quasi-brittle structures defined as
21
1−=W
BANσ (2.12)
Where ( )( )α
ασ
g
glBA p
′== ∞∞ 2
1; (2.13)

2 Literature Review
2-26
Where ∞pl and ∞σ refer to the size of the fracture process zone in a very large
specimen ( )∞→W and its nominal strength, while ( )αg and ( )αg ′ are a non-
dimensional geometry factor and its first derivative, respectively. They depend on the
notch to depth ratio Wa=α . Deficiencies and refinements to Equation (2.12) have
been discussed by Abdalla(80) and Karihaloo et al(81) and will not be covered here.
2.7 Fracture mechanics characterisation of masonry
Fracture mechanics characterisation of masonry properties has been carried out by a
number of authors(82-84), and their studies has shown that fracture mechanics can be
used for the determination of the fracture parameters like fracture energy of masonry
from adaptations to the standard RILEM(85) test set up for the determination of
fracture energy for concrete. Bocca et al(82) undertook a series of three-point bending
tests on clay brick units of 20 by 40mm in cross section and 200mm long, including
varying the notch lengths. Their findings showed that load-deflection curves with
post-peak softening branches can be obtained by controlling the crack mouth opening
displacement. This finding is significant as it implies that clay brick units show a
process of crack growth as evidenced in the strain softening (from the load-deflection
graphs) and can therefore be modelled by LEFM techniques. Numerical models can
then be used to predict fracture properties of masonry as well as gain a further insight
into the mechanics of the composite behaviour of masonry using LEFM concepts.
Carpenteri et al(84) carried out perhaps the first test for the determination of the
fracture parameters of a complete masonry assembly. Three-point bending tests were
carried out on five notched masonry walls of different sizes (same thickness but
varying span and depth) by controlling the crack mouth opening displacement. The
load-deflection diagrams show a softening branch, an indication of strain softening
and stable crack growth. From the diagrams, the fracture energy of the specimens was
calculated and analysis with respect to the MFSL using fractal fracture mechanics
concepts. Also carried out was the analysis of the nominal strength from the tests
according to the MFSL. The normal log-log plot of the nominal strength and reference
structure size showed good agreement of the test data with the MFSL.
In a further study by Olivito and Stumpo(83) to characterise the mechanical behaviour
of masonry using fracture mechanics concepts, they concluded that masonry can
2 Literature Review
2-27
support low tensile stress conditions and exhibits a bimodular behaviour which must
be defined individually, because it is related to masonry composition and texture.
Their results also show that masonry exhibits a strain softening behaviour caused by
the start and growth of cracking. The fracture specimens were masonry walls built in
the form of a beam of two different sizes; (length x height x thickness) 720 x 225 x
120mm and 720 x 225 x 60mm. Instead of cutting a notch on the masonry, the central
mortar perpend joint in the lowest brick row was left unfilled in order to initiate
cracking in the central part of the specimens.
Using numerical simulations to model size effect in masonry structures, Lourenco(86)
found that, for a masonry pier subjected to a point load in which failure was mainly
due to a tensile failure mechanism, there is evidence of a size effect for the range of
sizes simulated. The observed size effect closely followed the MFSL law as well as
the size effect law (Equation 2.6), but more in agreement with the former. The reason
for that, as has been discussed previously, is that the comparison should have been
made to Bazant’s other law for crack initiation from a smooth surface (Equation
2.11), which is identical to the MFSL (Equation 2.10). In the simulations for a shear
wall with an opening and open on the top edge, in which a shear or sliding failure was
dominant, no size effect was seen. The analysis was not conclusive about another
configuration of shear walls tested that were restrained on the top edge in which a
compressive failure was dominant.
2.8 Factors affecting size/scale Effect
A number of factors affect the strength properties and ultimately the overall behaviour
of quasi-brittle materials. Some of the strength properties include compressive,
tensile, tensile, bond and fatigue strengths, and various dimensional changes including
creep. The materials affected by size effect range from naturally occurring rock,
timber etc to man made materials like concrete, steel etc and even composites like
masonry.(87)
Random strength
Random strength describes the effect random distribution of flaws has in a
heterogeneous material. It plays an important role in the micro mechanisms

2 Literature Review
2-28
determining the strength of materials. Thus a larger specimen should have more flaws
and consequently less strong than a smaller specimen with fewer flaws(41).
Compaction
Generally smaller specimens of mortar or concrete will tend to achieve better
compaction and higher density and thus a higher strength because of their smaller
volumes. This is especially the case when standard compaction procedures are
employed through vibration for a given time or specific number of tampings(41).
Curing and drying
Curing is an important variable influencing mortar strength. Two specimens of
different sizes will cure differently because the surface to volume ratio increases with
decrease in specimen size. The strength of the material will vary from the surface of
the specimen to its centre, depending on its size, since hydration may not be uniform
throughout the specimen at the time of testing(41).
Drying of the specimen will also influence the gain in strength as a result of the
surface to volume ratio, which varies inversely with the specimen size(41).
Loading rate and state of stress
The rate of loading influences the strength of specimens, because higher loading rates
lead to higher strengths. The stress of stress, for example compression, tension, and
flexure, also influences the strength of the specimen. For instance the strength of
compressive specimens depends on the accuracy of the loaded ends, and on
parallelism, if rotating heads are not used. It is also possible to achieve a higher level
of capping accuracy in smaller specimens, which will result in higher strength(41).
Testing machine and loading platens
Properties of the testing machine such as the stiffness of the loading platens have a
profound effect on test results. Stiff end plates tend to apply uniform strain conditions
to the specimen under test, thus resulting in a higher strength than if thinner plates
were used(41).

2 Literature Review
2-29
Compaction of mortar bed by masonry units
Because of the heavier masses of larger masonry units, they tend apply more pressure
on the mortar bed than smaller units. This observation was made by Egermann et al(51)
as a possible cause for the decrease in stiffness as masonry model size is reduced.

2 Literature Review
2-30
Workmanship factorsIncorrect proportioningand mixing of mortarIncorrect adjustmentof suction rate of unitsIncorrect jointing Disturbance of units after layingUnfavourble curing conditions
Absorption properties height/thickness ratio
water/cement ratio
Deformation propertiesRelative thickness
hollow perforated water retentivity
mix
Unit characteristics Mortar characteristics
Type and geometry: solid
StrengthMasonry
Strength: BondDirection of stressingLocal stress raisers
Table 2.1- Factors affecting masonry strength(19).

2 Literature Review
2-31
(a) (b)
y
x
y
y
y
y
y
y
x x
xx
Figure 2.1- (a) Masonry specimen under axial force, (b) Stress states for brick and
mortar elements.
Joint slip
Tensile failure of units (Mann and Muller) Brickwork
crushing
Mortar tensile failure(Riddington and Ghazali)
Shea
r St
reng
th,
Precompression Stress, C
o
Figure 2.2- Failure modes of masonry in shear with precompression.

2 Literature Review
2-32
0
2
4
6
8
10
12
14
0.01 0.1 1 10 100Log (Size)
Nom
inal
Str
ess
at F
ailu
re,
N
Most structures
2
1
Strength or yield criterion
LEFM
Nonlinear Fracture Mechanics
Most lab tests
Figure 2.3- Size effect according to strength criteria, linear and nonlinear fracture
mechanics.
b
f t
U
(a)
logb
Logf t
log u
Q
logl ch
Extreme disorder (fractal regime)
(b)1
2
Extreme order (homogeneous regime)
Figure 2.4- (a) Multifractal scaling law (MFSL) for tensile strength, (b) Bilogarithmic diagram for the same.

3 Experimental Design and Material Tests
3-1
3 Experimental Design and Material Tests
3.1 Experimental design
The various factors taken into account in designing the composite masonry
experimental programme are initially considered followed by a discussion of the tests
to be undertaken on the constituent materials; the brick and mortar.
The aim of this research as it has been stated is to compare experimentally brickwork
structural behaviour at prototype and model scales. Because of this, the research
programme was divided into two parts; firstly looking at the effect of scale in the
experimental structural behaviour of brickwork and secondly to further investigate
opportunities for small scale modelling looking at the effects of some parameters like
different joint thickness, sand grading and different mortar strengths. However a
reference scale was needed that provides significant opportunities for modelling
overall structural behaviour of for example arch bridges, whole buildings, retaining
walls etc as well as for undertaking the parametric study. Taunton(3) has suggested
twelfth scale as a limiting scale in small scale masonry modelling as discussed in
section 2.5.7 while other authors(44, 51, 53) have reported reasonable model to prototype
scale correspondence using half, third, fourth and sixth scale model masonry. An
examination of the different factors led to the choice of the sixth scale as the
benchmark model because it is most suitable for modelling whole masonry structures
and components in a controlled laboratory environment. Two further scales of half
and fourth scale were also investigated for the first programme of tests in order to get
a complete picture of masonry behaviour across the range of scales. It was intended
that material tests would be first carried out to determine the properties of the
constituent materials that make up the masonry; the bricks and mortar e.g.
compressive strength and flexural strength etc. Knowing the individual material
properties will aid in understanding the composite behaviour of the masonry
assembly; by determining how properties of the components contribute to overall
brickwork behaviour under various conditions of loading.

3 Experimental Design and Material Tests
3-2
In order to fully understand the composite behaviour of the masonry specimens,
consideration was made of how best to capture the structural behaviour of a masonry
structure, because in any masonry structure, its various elements are under the
influence of a variety of actions. For instance a masonry wall could at any point be
under a vertical compressive load, out-of-plane and or in-plane lateral forces, etc.
Even though most of these forces act together, it is better to isolate each one to
understand the mechanics of its action. Therefore to understand the fundamental
behaviour of masonry, each of the actions was taking separately and considered for
each of the chosen scales. Consequently in order to understand the behaviour of
masonry under some of the most common actions to which it is subjected to, the
following tests were chosen.
• Compressive strength test. Masonry is loaded in compression in the majority of
the situations under which it is used. Therefore it is necessary to understand the
mechanics of brickwork in compression for both prototypes and models. In
addition to the compressive strength, the stiffness of the masonry under
compression would also be investigated in order to compare the stiffness
behaviour of prototype and model scale masonry. Various formats of specimens
are used for compressive strength test; stack bonded units, wallettes and piers.
Stack bonded units(prisms) tests are adopted as the standard for determination of
the compressive strength of masonry in North America and Australia(19). They
provide a reliable estimate of masonry strength that is reasonably representative of
masonry walls(88). Hendry(19) suggests that an aspect ratio (height to width ratio) of
5 was necessary in order to eliminate platen effects in the testing of such
specimens. But it was thought that, since comparable specimens would be used for
the prototype and model tests, the end restrains would be similar and therefore a
lower aspect ratio would still be acceptable for the purposes of comparison.
Consequently it was decided to use a three brick high stack bonded triplet. It was
also intended to use a wallette format that would allow for the determination and
comparison of the lateral strains and Poisson effects in prototype and model scale
masonry. Hence it was decided to use the wallette format complying with the
specifications of BS EN 1052-1(89). The triplet tests would be used for the
prototype and three model scales since it would be easier to construct and test

3 Experimental Design and Material Tests
3-3
while wallette tests would be used for the prototype and sixth benchmark model to
allow for comparisons of lateral strain properties of masonry.
• Flexural strength test. The flexural resistance of masonry is important when
masonry is loaded laterally due to for example wind, floods etc. For the flexural
strength normal to the bed joints, which is a flexural bond strength, the different
grading of the sands in the prototype and models could be important because as
reported in the literature review, a lower bond strength could result due to a finer
grading of sand (as is the case for the model scales) for comparable specimens.
Many types of specimen formats are used for determining the flexural strength of
masonry, a review by Fried and Anderson(90) has indicated that the following have
been used; wallette specimens e.g. the BS 1052-2(91) wallettes, stack bonded piers
tested as beams, crosses couplets, derivation of horizontal flexural resistance from
vertical resistance and unit modulus of rupture (M of R). Some of the methods test
every joint, while others test only the weakest joint in a specimen. However it was
thought even though the wallette specimens would be relatively difficult to
construct compared to the other formats, testing in four point bending would be
relatively easier to undertake and the format is the most representative of a
masonry wall. Hence it was concluded that the BS 1052-2(91) wallette specimen
formats would be adopted for the determination of the flexural strength of the
prototype and model specimen. However because of the variable loading
arrangement in the four scales, undertaking the test in the vertical orientation as
stipulated by the standard would have required different test set-ups for the four
scales that would have resulted in significant challenges which would have been
difficult to overcome within the duration of the testing programme. Therefore it
was decided to undertake the test in the horizontal orientation by taking into
account the contribution of the self weight of the specimens.
• Shear strength test. The shear resistance of brickwork is of significance when
masonry walls are subjected to in-plane lateral loads. Two types of tests should be
undertaken here; an initial shear strength test to determine the initial shear strength
at zero precompression stress for masonry bed joints and a shear strength test on
shear panels to determine the diagonal tensional shear strength at the centre of a
masonry panel. A review of masonry joint shear strength tests by Jukes and
Riddington(92) has indicated a wide range of tests, and concluded that a triplet test

3 Experimental Design and Material Tests
3-4
with applied precompression and minimum bending was the most suitable because
the specimens are easy to build, the apparatus not too complex and the results
were shown to be consistent. Therefore the triplet test complying with provisions
of BS 1052-3(31) was adopted for the determination of the initial shear strength for
masonry bed joints. There are various formats for the diagonal shear strength
test(19); shear panels precompressed biaxially, with the shear load applied at the
edges, diagonals etc. The RILEM recommendation for testing materials suggests a
shear panel that is tested diagonally. This format is easier to test in the laboratory
and is most suitable for model study investigation because of the simpler set up
for the test. Therefore the RILEM recommendation LUMB6(93) for the diagonal
tensile strength test was adopted for the investigation.
• Bond wrench test. As reported in the literature review the bond strength of
masonry is important under the action of in-plane loads like wind, eccentric
gravity loads etc. After due consideration of the relative advantages and
disadvantages of the direct tensile test methods (like the Sheffield test) and the
flexural bond strength test methods (like bond wrench test) in terms of the
reliability of the test method, ease of fabrication and testing of the apparatus with
regards to the range of scale being investigated, the bond wrench test was chosen.
It provides a simple and reliable way of determining the bond strength for the
range of sizes under consideration in this project. The test can be carried out on
varying heights of stacks bonded units from couplets to eleven units high. Because
of the need for the relative ease of handling and carrying out of the tests couplets
were used in the prototype, half and fourth scales while triplets were used for the
sixth scale. The couplet and triplet test are thought to be comparable since the
second joint in a triplet would be tested as a couplet.
3.1.1 Bricks
The first consideration in the choice of the bricks was how many types of bricks to
use. Since the main aim of the research was to investigate small scale modelling of
brickwork it was thought that one brick type was suitable and adequate for meeting
the aims of the study; because the same brick type can be used for the different scale
study and the parametric study at sixth scale. The method of manufacture of the
model bricks played a very important part in the choice of the prototype bricks. In
work by Vogt (43) it was concluded that it was difficult to manufacture model bricks

3 Experimental Design and Material Tests
3-5
through the usual firing process that will give the required accuracy at a particular
model scale. The fourth scale model bricks manufactured for their testing programme
had a noticeable curvature that greatly affected the dimensions of the bricks. In a
more recent work by Egermann et al(51), full scale and half scale bricks produced from
the same brickworks and extruder still left the model brick slightly stronger and more
burnt than the full scale bricks because of the firing process. Even though the
dimensional accuracies of the model bricks were not commented upon, a simpler,
economical and more controllable way of manufacturing bricks is still desirable.
Because of these issues and others regarding the making of small bricks as reported
by Taunton(3), a cutting method which has been used successfully by other researchers (3, 52) was used for the production of the model bricks.
The following factors were considered in choosing the prototype brick.
• Strength. Because most masonry structures are or were generally built from low to
medium strength bricks and in order to understand the behaviour of masonry it is
necessary to use comparable models to the full size structures, it was decided that
a brick with low to medium strength would be chosen.
• Absence of void. In order to allow for comparison between model and prototype,
and since it may be difficult to accurately produce a model brick with perforations
or frogs, solid bricks were preferable.
• Internal Structure. An internal structure of a brick that has relatively few internal
cracks would be most ideal for the investigation. This would entail that cut model
bricks will be most representative of the prototype brick.
Using the criteria set above for the selection of a suitable prototype brick, two types of
brick were selected for consideration as the prototype brick; Ibstock Birtley Warwick
Old English brick and Baggeridge Mellowed Red Stock brick. In the case of the
former the initial model bricks produced from the first few prototype bricks were
satisfactory but subsequently substantial flaws in their internal structure compromised
the quality of the model bricks. Even though the former were easier to cut than the
latter, the latter was chosen because of the stated problem. The Mellowed Red Stock
was then chosen to produce all the model bricks and also to carry out the prototype
tests. The average dimensions of the prototype and model bricks are given in Table
3.1.

3 Experimental Design and Material Tests
3-6
3.1.2 Cutting method
As stated earlier the cutting method used here had been used by Taunton (3) to produce
sixth, twelfth and eighteenth scale model bricks. It involves sawing a prototype brick
into half to give two approximately square half bricks. Each half brick was then glued
on the bedding face to a steel base plate to provide a way of securing it to the cutter.
Another cut was made on the face opposite the bed face to remove the coarse wire-cut
surface. Parallel cuts were then made as shown in the Figure 3.1, followed by another
series of parallel cuts normal to the first series. The cut brick columns were then broke
off for subsequent sizing to the correct length with a slit off saw. The sixth scale and
fourth model bricks were produced in this manner, while the half was produced using
a different technique. This was simply made by first trimming all the four sides of a
prototype brick to make it 197 x 96 x 62 mm. Followed by a longitudinal cut through
the brick at half its depth. Two other cuts were then made; one transverse across the
brick at mid span and another longitudinal cut across the brick at half its width. This
resulted in eight “half scale” bricks not exactly the required half scale dimension but
sufficiently close at 1:2.22. The alternative to this would have been to get only one
correctly sized half scale brick from one full scale brick because of the wastages
resulting from the thickness of the cutting blade.
Tests undertaken by Taunton(3) to determine whether the firing process may have left
the core of the brick less fired than the core concluded that there was no significant
difference in strength between model bricks cut from the surface when compared to
those cut from the core for a similar type of brick. Issues related to the effect of
different frictional properties of sawn and prototype bricks have also been
investigated by Taunton for a similar brick to the one used in this study and concluded
that the surface finish does not significantly affect the angle of friction(3). However the
different surface finish of the prototype and cut model bricks could affect the flexural
and bond strength of masonry since these have been shown to be affected by the
surface finish of the units(94). This point will be considered in the discussion of the
results. There is also an inherent selection process in the cutting method during
sawing of the model bricks by way of snapping of some of the cut bricks. However
this is not deemed to be of great significance as there is also a selection process in the
use of the prototype bricks, since only suitable bricks with no visible defects were
considered suitable for the prototype tests.

3 Experimental Design and Material Tests
3-7
3.1.3 Mortar
In the selection of an appropriate mortar for the tests, it was intended that a mortar
that best compares to what is in use currently and in the past for masonry structures
would be most suitable. The first consideration was whether to use a cement-sand
mortar or cement-sand-lime mortar. Traditionally lime has been used in mortar to
improve its workability and water retention properties. It was thought that both of
these properties were desirable considering possible difficulties in adequately placing
mortar in the bed joints of the model specimens and rapid suction of water from the
model bed joints because of their small thickness. In the case of cement-sand mortars,
plasticers are normally used currently in the construction industry to improve
workability. However it was thought that since most historic masonry structures were
made of lime based mortars, it was concluded that a cement-lime-sand mortar mix
was most appropriate for this study.
For the prototype tests, it was intended to use a mortar that was comparable to ones
used in practice, since this would best reflect the behaviour of a full size structure.
Therefore normal building sand was chosen to make the prototype mortar. For the
models scales the intention was to use two mortars that would be most suitable for the
small bed joints in the model tests, but in order to achieve this, the sand for one of the
mortars, a reference mortar, should be of fine grading to allow the mortar to be used
for the parametric study involving different joint thicknesses. And of a strength that
was appropriate to the aims of the investigation. Since low to medium strength mortar
is used in most masonry structures from existing historic structures to new build,
mortar designation iii, ( BS 5628(95)) was chosen as the benchmark mortar made using
HST95 Congleton sand with an average grain size of 130μm. While the second
mortar was required to be of coarser grading in order to allow for the comparison of
the effect different sand gradings on sixth scale masonry behaviour. Therefore it was
concluded that Congleton HST95 and HST60 silica sands were most suitable for the
investigation, after carrying out sieve analysis tests to determine their particle size
distribution with reference to the grading limits of BS 13139, further discussion on the
gradings of the three sands is reported in section 3.2.1.1. In order to further investigate
the effect of increasing mortar strength at model scale, mortar designations (ii) and
(iv) were also considered, in addition to the designation (iii). Therefore six mortar
types were used in the sixth scale; that is three each for each of the two sand types.

3 Experimental Design and Material Tests
3-8
While only one mortar designation; the benchmark model mortar was used for the
half and fourth scales. Details of the different mortars used for the various scales are
summarised in Table 3.2. The batching for the constituents of dry mortar was carried
out in accordance with the guidance given in BS 4551(96) for the batching by weight
of the three chosen mortar designations.
It has been reported by Hendry and Murthy (44) that is preferable to use 25mm mortar
cubes instead of the standard 71mm cubes. In fact 25mm cubes have comparable
strengths to the standard 100mm cubes as found from tests undertaken to compare
their respective compressive strengths. Tests carried out using prototype mortar show
that, the compressive strength of 25mm cubes was only 2% more than that of a
100mm cube (97). In the case of the benchmark model mortar the compressive strength
of the 100mm cube was just 4% more than that of the 25mm cube. Furthermore the
25mm cubes are judged to be most suitable for the small mortar mixes used in the
research since using 100mm mortar cubes may not be representative of the actual
mortar used for making the specimens. Therefore three, 25mm mortar cubes were
adopted for the determination of mortar compressive strength for quality control
purposes.
In summary the masonry tests would be undertaken in two categories; in the first
category all the masonry tests detailed above would be carried out using one mortar
type (designation iii, BS 5628(95)) to compare structural brickwork behaviour across
the four scales. In the second category three mortar grades (designations ii-iv, BS
5628(95)) and two different sand types would be chosen to compare the effect of
increasing mortar strength and different sand grading on the five masonry tests at
sixth scale. Also the effect of different joint thicknesses (using model benchmark
mortar) will also be investigated at this scale. In all there are eight different sub tests
being undertaken for each of the five tests stated earlier at the sixth scale.
3.1.4 Masonry specimens
The first consideration here was the joint thicknesses, and using the recommendation
in Eurocode 6 (98) that the prototype joint thickness for masonry made with general
purpose mortar should be between 8-15mm because of the marked influence of joint
thickness on the strength of masonry(20); a joint thickness of 10mm was therefore
adopted for the prototype specimens. In order to obtain the joint thickness for the
3 Experimental Design and Material Tests
3-9
model scale specimens, the prototype joint thickness of 10mm was simply divided by
the corresponding scale factor. Thus the corresponding joint thicknesses in the half,
fourth and sixth scales were 5.0mm, 2.5mm and 1.6mm respectively. Two further
joints thicknesses of 1.0mm and 2.5mm were also considered in the sixth scale in
order to investigate the effect of varying joint thickness on masonry strength. In
choosing the number of specimens for a particular test, the guidance given by the
appropriate standard or recommendation was followed. Details of all the masonry
tests undertaken are given in Table 3.3
Traditionally masonry is constructed by laying units on their bed faces and the brick
or blockwork built vertically. However this method requires a lot of skill and is
subject to very significant workmanship variations even when carried out by the same
mason(19). Another method of making masonry is to lay the units horizontally in
special moulds before mortar is placed in the bed spaces to fill the joints. This method
can be carried out under controlled conditions and is much faster to undertake. It is
usually used to manufacture prefabricated masonry panels in the factory. Furthermore,
the horizontal method of laying ensures uniformity of construction and eliminates the
differential compaction of mortar joints by the different weights of units through the
different scales. It may be argued here that the horizontal method of laying does not
correspond with the normal way of laying bricks and therefore does not accurately
model brickwork behaviour. However, firstly, it was necessary to minimise
workmanship variations in this research project so that real structural behaviour of the
specimens is not masked by material variability. This point has also been made by
Baker(56) who used this method to make one-third scale masonry panels for wind
loading tests. Secondly, since both the prototypes and models would be constructed in
this way, there is a valid point for comparison. Hence after due consideration of all of
the factors detailed above, the horizontal method of making masonry was adopted for
the current research project. Plate 3.1(a) shows the preparation of a triplet specimen,
the wooden spacers can be seen in between the bricks.
In the choice of materials for making the specimen mould for laying the sixth scale
specimens, a material that offered very high dimensional tolerance was needed as well
as being able to resist corrosion. The material also needed to be suitable for the large
number of tests and different size specimens (because of the different joints) at the
sixth scale. After consideration of the different factors, brass was chosen because it

3 Experimental Design and Material Tests
3-10
offers the needed dimensional tolerance being a metal and will also resist corrosion.
However, in the prototype, half and fourth scales the number of tests are less and the
degree of dimensional tolerance required not as high as in the sixth scale. Therefore
timber was preferred for the larger scales because it is lighter for handling purposes
and could be reasonably used for the smaller number of tests. In the case of the sixth
scale specimens the moulds were made is such a way as to accommodate the different
joint thicknesses of the specimens.
However some issues could have arisen by using the horizontal laying method. This
could have included the improper filling of the joints at the bottom of the end of a
joint, segregation of the mortar constituents during compaction by vibration and
differential curing of the exposed top face of the specimen in contrast to the covered
bottom. In order to minimise the first and second problems it was intended to fill and
compact the mortar joints gradually in stages. Since the intention was to cure the
specimens while exposed at the ambient laboratory temperature, any effects of the
differential curing on the top and bottom surfaces would be considered in the
discussions of the results.
3.1.5 Adjustment of the suction rate of masonry units
The suction rate of masonry units is one the most important extrinsic factors affecting
mortar, and hence, the properties of the hardened mortar and of the whole
composite(7). It has been established through nuclear magnetic resonance (NMR) tests
that water extraction out of mortar during brick laying only slows down when the
bricks are almost saturated(8). But using fully saturated bricks could have its draw
back when highly retentive mortars like lime-cement mortars are used. Also failure to
adjust the suction rate usually leads to a weak mortar on setting resulting in a pillow
shaped, weak mortar bed(14, 19).
In order to determine the water absorption characteristics of the brick used in this
research, the water absorbed by five masonry units immersed in a tank of water was
weighed at regular intervals over a period of 30 minutes and then weighed after a
period of 24 hrs. From this it was observed that twenty minutes was the time needed
for the units to reach 95% of their saturation value at 24 hrs. Figure 3.2 shows the
graph brick weight against log of time. It is seen from the figure that for the first 20
minutes there is very rapid absorption of water characterised by a very steep slope, it

3 Experimental Design and Material Tests
3-11
then steadies to a gentler slope. Therefore it was decided that 20 minutes was
sufficient time to wet the bricks to an appreciable degree of wetness so that the
suction rate of the brick units does not limit the water needed for the complete
development of the strength properties of the mortar.
3.1.6 Preparation of specimens
Having determined 20 minutes as the time needed to appreciably wet the specimens,
all masonry units ( prototype and model scales ) were wetted for that duration prior to
being laid on their edge faces in their particular moulds. Spacers were used to define
the joint thicknesses as well as to rigidly keep the units in place. Wooden spacers
were used for making the prototype specimens while tile spacers of 1.0mm, 1.6mm,
2.5mm and 5.0mm thicknesses were used for the scale models. The mould and
contents were placed on a vibrating table, mortar of standard consistence was then
placed on top of the gaps between the units and vibrated gradually until all the joints
were full of mortar and the spacers removed. The time taken to finish this procedure
varies with the type of specimen and the scale. Moulds were left undisturbed for two
days before demoulding and storing the specimens away for curing under normal
laboratory conditions until they were tested. Plate 3.1(b) shows the preparation of a
sixth scale wallette specimen, the plastic tile spacers can be seen separating the model
bricks.
3.2 Materials and tests This section details the different materials used and the various tests undertaken. The
tests detailed here are those concerned with the mechanical properties of the
materials, while the tests on the masonry assemblies are covered in the next chapter.
3.2.1 Materials
3.2.1.1 Sand
Three types of sand were used in this research. Ordinary building sand was used for
tests involving prototype specimens while Congleton HST95 and HST60 silica sands
were used for the model scale tests. In order to ensure the same sands were used
throughout the study, all the sands were bought in one batch and of sufficient quantity
to last the duration of the programme. The grading curves for the model sands and the
ordinary building sand are shown in Figure 3.3, it shows that HST 60 sand and the
3 Experimental Design and Material Tests
3-12
building sand lie within the grading limits of the code, but nearer the fine limit. The
building sand is just coarser than the HST 60 sand. While the other model sand, HST
95, has a grading that is finer than the fine limit set by the code but straddles an
assumed sixth scale coarse grading line. The two sixth scale grading lines were fitted
by simply dividing the sieve sizes for the main grading limits set by a factor of 6. The
grading of all the sands shows that they are within the limits set by BS EN
13139:2002(99) for aggregates used in mortar.
3.2.1.2 Cement
The cement used conforms to BS EN 197-1:2000(100). It was acquired in different
batches in order to ensure that the fresh qualities of the cement needed for strength
build up are maintained during the duration of the testing programme.
3.2.1.3 Lime
Hydrated lime which conforms to BS EN 459-1: 2001(101) was acquired in one batch
and used throughout.
3.2.1.4 Bricks
The Mellowed Red stock bricks used are solid, wire cut, frogless clay bricks made by
Baggeridge Plc and supplied in one batch. They have a standard dimension of 215 x
102.5 x 65mm and conform to the requirements of BS 3921(102).
3.2.2 Tests on constituent elements; Brick units
In order to fully understand the behaviour of the units under load, some series of tests
were proposed. These tests would be necessary in understanding the composite
behaviour of masonry, since the unit and mortar react differently under load. They
would be carried out to determine the most fundamental properties of the units that
influence the composite behaviour of the assembly. The tests would be carried out on
all the brick units; that is both prototype and model scales (unless stated otherwise).
• Compressive strength test. One of the most commonly quoted mechanical
properties of a clay brick is its compressive strength. It is the main reason it is
widely used as construction material. As with most brittle materials, the strength
of clay bricks is determined by the natural distribution of flaws as it has been
discussed already. Consequently, it is important to determine the compressive

3 Experimental Design and Material Tests
3-13
strength for the prototype and model bricks because the effect of random strength
predicts a higher strength for the model bricks.
• Modulus of elasticity. The deformation properties of masonry units are important
because engineers need to predict the deflection of masonry under load. The
intention is to understand the stress-strain relationship in the unit with a view to
determining its contribution to that of the composite when the masonry tests are
undertaken. The modulus of elasticity test would only be carried out on the
prototype units because it would be difficult to carry out the test in the model
scales because of the small size of the model units.
• Flexural strength test. When masonry is subjected to out-of-plane flexural stress in
the direction of the bed joints, failure could either be through the perpend joints
and units or through the units. In the former the flexural strength of masonry is
governed by the modulus of rupture or flexural strength of the unit. Therefore it is
essential to determine this parameter for the prototype and model units.
• Indirect tensile strength test. Even though clay masonry is primarily strong in
compression and weak in tension, its failure under compressive stress is governed
by the tensile strength of the units, consequently the determination of this
parameter is necessary for the understanding of the failure mechanics of masonry.
• Water absorption test. The importance of the suction properties of the units in
ensuring proper bond development and strength has already been discussed. This
is a standard test aimed at comparing the water absorption characteristics of the
prototype and model bricks.
• Fracture energy tests (prototype and half scale only). The mechanism of failure in
a brick unit is mainly occasioned by fracture of the brick. This is due to the energy
release characteristic of the material. Understanding the energy release mechanism
of brick fracture should help in understanding the mechanics of the fracture
formation in composite masonry.
3.2.2.1 Compressive strength test
The prototype units were tested in accordance to the requirements of BS EN 772-
1:2000(103) in a compression testing machine at a loading rate of 6.6 kN/s until failure

3 Experimental Design and Material Tests
3-14
occurred. Prior to being tested the units were immersed in water for a minimum of 24
hrs until just before testing. Plywood pieces 5mm thick were used as packing in the
tests in order to minimise the platen restrain and also to ensure a level and flat surface
for even load application.
All other compressive strength tests on the model bricks were tested in a compression
testing machine at comparable strain rates using loading rates of 0.9kN/s, 0.4kN/s,
and 0.2kN/s for the half, fourth and sixth scale units respectively. No stiffness tests
were carried out on the model bricks because of the small size of the specimens.
Typical failure of units was by tensile cracks parallel to the direction of load
application followed by splitting, which was followed by crushing of the specimens.
The mean compressive strength of the prototype and model bricks are shown in Table
3.4, the mean compressive strength of the prototype units was determined to be 29.2
N/mm2 with a Coefficient of Variation, (COV) of 14.3%. The COV indicates the
inherent variability in the strength of kiln fired clay masonry probably due to the way
bricks are extruded or pressed and subsequently fired in the kiln as has been reported
by Jessop et al (25). Figure 3.4 shows the variation of the compressive strength of the
units with scale. It is seen that there is a noticeable increase in compressive strength of
the units as the scale is reduced.
Consideration of Figure 3.4 shows that there is no uniform trend in the increase in
strength as the scale is reduced, for example the half scale units’ strength is only
marginally higher than the prototype unit strength, while the fourth and sixth scale
unit strengths are 43% and 63% higher than the prototype unit strength. It is seen from
the results that, there exist some similarities in the strength of the prototype and half
scale on one hand, and also in the strengths of the fourth and sixth scale units on the
other hand. In order to further investigate the possible effect of the orientation of the
model units in the prototype in relation to their orientations while being tested in
compression, a test was devised as follows; three 50mm cubes specimens each were
cut from a prototype brick and their faces labelled to show the orientation of the cut
pieces in the parent material. Figure 3.5 shows the orientation of the model units in
the prototype as well as how top, end and side are defined. Sixteen samples from six
bricks were tested in the three different orientations. Results as shown in Table 3.5
show that there is about a 26-30% increase in strength for the specimens cut and
3 Experimental Design and Material Tests
3-15
loaded in the side-side and end-end orientations than for the specimens cut and loaded
in the top-bottom orientation. The side-side and end-end orientation coincides with
the top-bottom orientation in the fourth and sixth scales. Showing that, there is a
possible anisotropy with respect to the strength of a brick when considering the
loading orientation as reported by Shrive and Jessop(37), who concluded that extruded
clay units are anisotropic because of the manufacturing process.
Another reason for the higher strength in the fourth and sixth scale could be due to the
effect of fracture mechanics of brittle materials as first suggested by Griffith, that the
less the surface area of a brittle material is the stronger it is, since there is less
probability of flaws occurring(13). Therefore smaller brittle materials will show a
higher strength than larger materials because of this. This may be true for the fourth
and sixth scales but not for the half scale units. Since curiously there is no great
strength difference between the prototype and half model scale units, possibly because
they are tested in the same orientation the flaws in them are also embedded in a
similar manner and would therefore behave similarly under stress. It would be
interesting to see if the same effect would be seen in the masonry compressive
strength tests, since the strength of masonry is primarily due to the unit strength.
3.2.2.2 Modulus of elasticity test
Five 200 x 60 x 60mm specimens were used for the determination of the modulus of
elasticity of the units. These units were cut to size from standard prototype units and
were tested end to end in the direction of their longitudinal axis. Four, Linear Variable
Displacement Transducers (LVDT) were fitted (held with plastic padding) onto the
faces of units; two LVDTs, one each on opposite faces were attached in the vertical
orientation to measure the longitudinal deflection while the other two were attached
horizontally at mid section to measure the lateral deflection. Plate 3.2 shows the set up
for the test. Two pieces of Fibre board unit were used to cushion the platen effect on
the specimens. Load was applied at a rate of 0.1kN/s through two loading cycles of up
to a load of 40kN and then loaded to failure in the final lap. Failure was characterised
by the vertical splitting and cracking of the specimens in the direction of loading
followed by crushing of the units. Some units left pyramidal shaped masses on the
platens after failure, a consequence of the platen effect.

3 Experimental Design and Material Tests
3-16
In the identification system used for the tests, the first letter B refers to Brick, MOD
refers to the type of test in this case modulus of elasticity, and the number refers to the
specimen number. Where a number is followed by a letter A or B it refers to the
deformation measurements both axial and lateral on either face of a brick. While a
number followed by AV refers to the averaged axial or lateral strain (average of A
and B) from two opposite deformation measurements. For example B-MOD-5A
would refer to the strain measurement from one face of brick sample 5 in the modulus
of elasticity test.
The brittle nature of the material is evident from the way they failed as shown in
Figure 3.6, which shows stress/strain relationship in three of the specimens. They
reveal that the units stress/strain relationship is linear up to the failure as evident from
a lack of a plastic region in the curves. In Figure 3.7, a complete set of stress/strain
curves for test B-MOD-5 is shown. The figure shows that there is minimal effect of
bending during test and it is representative of most of the test undertaken.
The modulus of elasticity was calculated based on the strain readings at a third of the
maximum stress reached for each of the units, as is common for masonry. An average
value of 11500 N/mm2 was obtained for the modulus of elasticity, with compressive
strength of 25.6 N/mm2 and a Poisson’s ratio of 0.06. It is also seen from the results
that the specimens used for the actual determination of the compressive strength were
about 14% higher in strength than the slender ones used for the determination of the
stiffness parameters; probably due to the greater effect of platen restraint in the
former.
3.2.2.3 Flexural strength test
The flexural strength test also called the modulus of rupture was carried out in
accordance with the requirements of LUM A2(104), which is the RILEM
recommendation for the flexural strength test of masonry units. Since the units’ span/
depth ratio is less than 4, three units were required to be joined together at their ends
with an epoxy resin adhesive. The ends to be joined together were first grooved
before the adhesive was applied in order to ensure effective bonding. The assembly
was left to cure for a day before being immersed in water for a minimum period of 24
hrs. Testing was by a three point bending, and load was applied gradually until failure
of the specimen in the central unit at a rate of 0.04kN/s in the case of the prototype

3 Experimental Design and Material Tests
3-17
beam. Plate 3.3 shows the set up for the test, the position of the two joints in the
specimen can be seen from the plate.
Epoxy resin was also used to glue the model scale units as mentioned earlier. Testing
of the specimens was carried out in a 20kN testing machine at a displacement rate of
0.2mm/min for the half scale beam and 0.1mm/min for the fourth and sixth scale
beams. Displacement rates were used in the smaller capacity machine because of
problems in testing under load control. The displacement rates chosen were made to
achieve failure within an average time that was comparable to the load controlled
prototype tests.
The RILEM recommendation gives the modulus of rupture, S as Equation 3.1
S = M/Z (3.1)
where:
M = the bending moment at failure in Nmm, given as Pl/4,
Z = section modulus of test specimen in mm3, given as bd2/6,
P = maximum load at failure, N,
l = distance between supports,
b = mean width of beam cross-section at line of fracture,
d = mean height of beam cross-section at the line fracture. The average dimensions of
the specimens used for the test is provided in Table 3.6.
Results and Discussions
Typical failure of the specimen was by tensile failure and cracking of the central unit
in bending. From Table 3.4, it is seen that the mean modulus of rupture for the
prototype specimens was determined to be 4.3 N/mm2, with a COV of 21.2%,
highlighting again the variability in the results. The modulus of rupture of the
prototype units is about 15% of their mean compressive strength. This is within the
range described by Nevader(11), that the modulus of rupture of solid bricks varies
within the limits 14 to 32 % of their compressive strength for compressive strengths
values of 20 to 51N/mm2.

3 Experimental Design and Material Tests
3-18
Figure 3.8 shows the modulus of rupture of the prototype and model units across the
four scales. It is seen from the results, that the half scale model units have the highest
modulus of rupture, followed by the prototype units while the fourth and sixth scales
units have similar values. However it is seen that half scale value is about twice the
fourth and sixth scale values. The expectation was for an increase in the flexural
strength as the size is decreased, but it seems there is no clear scale effect from the
prototype to the sixth scale. It would be interesting to see how modulus of rupture of
the units affects the masonry flexural strength parallel to the bed joints when failure is
governed by the flexural strength of the units.
3.2.2.4 Indirect tensile strength test
The indirect tensile test was also carried out in a load controlled machine according to
the specifications of LUM A3(105), the RILEM recommendation for the indirect tensile
strength test of masonry units. The units were first saturated in water for a minimum
of 24 hrs before being tested. The load was applied at a constant rate of 0.25kN/s until
the prototype units were split at the cross section under consideration. Each prototype
unit was split at three points across the normal orientation of its long axis; initially at
42.5mm from one edge, then across its centre and finally 42.5mm from the other
edge. While for the model scale units the splitting distance from either edge was
19mm, 11mm and 7mm respectively for the half, fourth and sixth scales.
The load rate of 0.02kN/s was used for the half scale test in a load controlled testing
machine, while a displacement rate of 0.20mm/min and 0.15mm/min was used for
fourth and sixth scale test respectively.
Results and Discussions
The results from Table 3.4 and Figure 3.9, which shows the variation of the mean
indirect tensile strength across the four scales, indicates a trend of gradual increase in
the tensile strength as the scale is reduced. It is seen that the prototype units have the
least tensile strength of 1.9N/mm2, while sixth scale units have the highest tensile
strength. The sixth scale tensile strength is 26% more than the prototype tensile
strength. The mean tensile strength is 7% of the compressive strength of the units in
the prototype and 5% of the compressive strength in the sixth scale. This indicates a

3 Experimental Design and Material Tests
3-19
possible linear relationship between tensile and compressive strength masonry units as
shown in Figure 3.10.
3.2.2.5 Water absorption test
The units were tested according to the specifications of LUM A4(106), the RILEM
recommendation for the water absorption and water porosity tests of masonry units.
The units were weighed before and after saturation in a water tank for 24 hrs.
Results and Discussion
The mean water absorption of the prototype units as seen from Table 3.4 was
determined to be 14.8%, this is about 11.5% less than the mean water absorption of
the half scale units, which is the highest across the four scales. Figure 3.11 shows the
variation of the water absorption across the scales, it reveals that there is a marginal
increase in the water absorption as the scale is reduced. But this is no conclusive proof
that there is definite scale effect, because the effect is marginal.
There is some debate about the appropriateness of this test as a measure of the
absorption characteristic of brick masonry. As indicated by the preliminary tests on
the suction property of the units; that in 20 minutes the units had reached 95% of their
total saturation value, suggests that 24hrs of wetting as prescribed by the water
absorption test is too long a time to highlight the critical phase of interaction between
the unit and mortar.
On the other hand the Initial Rate of Absorption, IRA test (which has not been
undertaken as part of this study) takes just one minute to carry out and is too short to
capture the important period of interaction between the units and mortar. The
Sorptivity test, as described by Reda Taha et al(107), seems to bridge the Water
Absorption and the IRA test methods by putting forward a modified IRA test that
takes about 25 minutes to complete with weighing done at regular intervals as
described in the test for suction properties stated earlier.
3.2.2.6 Fracture energy test
The facture energy is defined as the amount of energy required to propagate one unit
area of crack, and the area of crack is the projected area on a plane parallel to the
main crack direction. Since there is no specific standard test for fracture energy of

3 Experimental Design and Material Tests
3-20
masonry bricks, the RILEM recommendation, FMC 1(85) for the determination of the
fracture energy of mortar and concrete was adapted. Two separate tests were carried
out; one involving three brick units glued together (brick beam) and another
consisting of only one unit. Three brick units joined together at their ends, as in the
case of flexural energy test for brick units was tested in the first instance according to
the procedures outlined in FMC 1. A central notch 5mm wide and cut to half of the
unit height was made in the central unit of the specimens prior to being immersed in
water for a period of 24hrs. The setup was then placed in the rig, where a transducer
and a clip gauge were fitted to measure the vertical deflection at mid span and the
crack mouth opening displacement (CMOD) respectively. The test was carried in the
form of a three-point bending test and controlled by the CMOD gauge at a
displacement rate of 0.0004mm/s. The measurements/readings were recorded on a
data logger for later analysis. Plate 3.4 shows the set up for brick beam while Plate 3.5
shows the set up for the single unit test. It can be seen from the Plate 3.4 that while
the LVDT for measuring the central mid span displacement was suspended from a jig
mounted on the brick beam, the LVDT for the single brick test was supported from an
attachment screwed into the unit. The drilling of the holes for the attachment of the
screws in the unit, could have some undesired effect on the test even though it is
difficult to quantify the exact effect.
A similar test was also undertaken using three half scale units glued together with a
central 5mm wide, 10mm deep notch (1/3 of the unit height) in the middle unit. The
test was also undertaken in the same machine at a displacement rate of 0.0002mm/s.
Because of the expected low loads, a 250kgf Z-load cell was attached to the base of
the loading platen to apply the load as well as to record it. With this set up, it was
possible to use the 500kN capacity testing machine to measure loads to the accuracy
of 0.1N. A set up for the test is shown in Plate 3.6 with the 250kgf Z-load cell on top
of the specimen.
As stated earlier since there is no standard test for the fracture energy test for bricks,
some authors like Baker(108) have used both brick beams and single units for brick
fracture tests, while Bocca et al(82) used the single brick configuration for the their
fracture tests. In order to compare the two tests, both single unit and brick beam
configurations were used for the determination of the fracture energy in the current
work

3 Experimental Design and Material Tests
3-21
Calculations for the fracture energy were undertaken using Equation 3.2. This was
done after determining the value of Wo, which is the area under the load- deflection
graph calculated numerically on the PC using Equation 3.3.
lig
ooF
A
mgdWG
)( += (3.2)
Where:
GF = fracture energy in N/m;
Wo = area under load- deflection graph in N/m;
m = m1 + 2m2 in kg;
m1= weight of beam between supports in kg;
m2 = weight of loading arrangement not attached to machine in kg;
g = acceleration due to gravity in m/s2;
do = deformation at the final failure of the beam in m;
Alig = area of ligament, defined as the projection of the fracture zone on a plane
perpendicular to the beam axis in m2.
( )( )
2. 1
11
+
=
+
+−= ii
n
iiio
yyxxW (3.3)
Results and Discussions
Though the mean fracture energy from both the single brick and brick beam prototype
tests are close; 50.7 N/m for the former and 47.4 N/m for the latter, the results from
the single brick test are more variable with a COV of 54% compared with 10% for the
brick beam tests. In the identification system used for the tests, B and FRC refer to
Brick and Fracture test respectively, while BM and U refer to beam and single unit
specimens respectively. The load/deflection curves for the brick beam tests are shown
in Figure 3.12 while those for the single unit tests are shown in Figure 3.13. The
figures reveal that the load/deflection response for the beam test is softer than that for
the single unit test. Similar results have also been obtained by Baker(108). The

3 Experimental Design and Material Tests
3-22
difference is more noticeable when typical load/deflection curves for the two tests are
combined on the graph as shown in Figure 3.14, it shows that the single beam tests
have a sharper peak and steeper gradient than the beam tests which show a gentler
slope and flatter peak. This may be due to the greater bending effect because of the
increased span on the crack propagation process in the central unit in the case of
beam, while in the case of the single brick there is no such effect and hence the
sharper peak and more brittle response. Another advantage of the beam test could be
that, because of the restraining effect, it stabilises the specimen and hence variability
is reduced as is apparent in the results. For these reasons the prototype fracture energy
results shown in Table 3.4 are those from the beam test.
From the combined flexural stress/deflection response for the prototype and half scale
tests in Figure 3.15, it is seen that the half scale exhibits greater ductility than the
prototype, as well as a capacity to withstand a marginally higher load. The mean
fracture energy from the half scale test results was determined to be 58.2N/m, which
is about 23% more than the prototype beam fracture energy. Therefore about 23%
more energy is needed to propagate a unit area of crack in the half scale model unit
compared to the prototype beam. The results have confirmed the findings in the
literature(82) that load-deflection diagrams of clay units exhibit a softening branch that
indicate strain softening and stable crack growth. This is significant since it implies
that fracture mechanics concepts could be used to understand the process of crack
propagation and failure in masonry.
3.2.3 Tests on constituent elements; Mortars
The primary function of mortar is to bed and join units, providing them with the
continuity required for stability and the exclusion of weather elements(10). The
understanding of some important mechanical properties of mortar is essential for
better understanding of its contribution to the composite action of masonry. Therefore
the following tests were proposed in order to determine the important properties of
masonry, namely;
• Compressive strength test. The strength of mortar as a jointing material is
important for the overall strength of the composite masonry assembly. In
situations where strong brickwork is required, it is also necessary to have a strong
mortar in order to complement the strength of the unit. This test is needed, first to
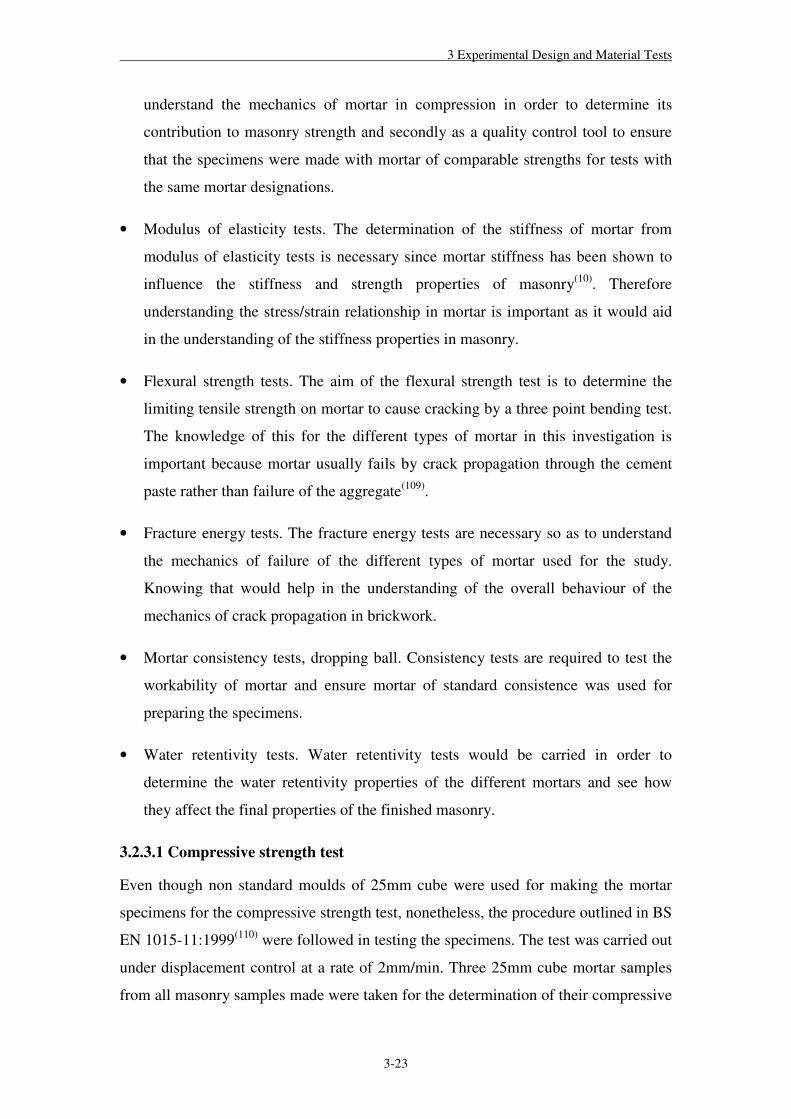
3 Experimental Design and Material Tests
3-23
understand the mechanics of mortar in compression in order to determine its
contribution to masonry strength and secondly as a quality control tool to ensure
that the specimens were made with mortar of comparable strengths for tests with
the same mortar designations.
• Modulus of elasticity tests. The determination of the stiffness of mortar from
modulus of elasticity tests is necessary since mortar stiffness has been shown to
influence the stiffness and strength properties of masonry(10). Therefore
understanding the stress/strain relationship in mortar is important as it would aid
in the understanding of the stiffness properties in masonry.
• Flexural strength tests. The aim of the flexural strength test is to determine the
limiting tensile strength on mortar to cause cracking by a three point bending test.
The knowledge of this for the different types of mortar in this investigation is
important because mortar usually fails by crack propagation through the cement
paste rather than failure of the aggregate(109).
• Fracture energy tests. The fracture energy tests are necessary so as to understand
the mechanics of failure of the different types of mortar used for the study.
Knowing that would help in the understanding of the overall behaviour of the
mechanics of crack propagation in brickwork.
• Mortar consistency tests, dropping ball. Consistency tests are required to test the
workability of mortar and ensure mortar of standard consistence was used for
preparing the specimens.
• Water retentivity tests. Water retentivity tests would be carried in order to
determine the water retentivity properties of the different mortars and see how
they affect the final properties of the finished masonry.
3.2.3.1 Compressive strength test
Even though non standard moulds of 25mm cube were used for making the mortar
specimens for the compressive strength test, nonetheless, the procedure outlined in BS
EN 1015-11:1999(110) were followed in testing the specimens. The test was carried out
under displacement control at a rate of 2mm/min. Three 25mm cube mortar samples
from all masonry samples made were taken for the determination of their compressive

3 Experimental Design and Material Tests
3-24
strength. Both the model scale and prototype mortar specimens for the compressive
strength were made from the same moulds.
Results and Discussion
Typical failure of the mortar specimens was by shear cracks in the direction of
loading. This tended to be triangular in shape originating from the sides of the
specimen at the top slanting inwards, towards the centre at mid height and diverging
again to the sides of specimen at the bottom. The final outcome of this is a pyramidal
shaped mass at failure considered to be due to the platen restraint.
The average value of the compressive strength for different batches of 1:1:6 prototype
mortars, (MP mortar) was 5.0N/mm2, as seen from Table 3.7, which gives a summary
of mortar test results. This value of compressive strength is higher than the expected
minimum compressive strength of 3.6N/mm2 from BS 5268(95) for mortar designation
(iii), which is an indication that the batching, mixing and curing conditions used were
appropriate for the attainment of the specified minimum strength.
From Figure 3.16, which shows the variation model mortar compressive strength as
the mortar strength class is increased, it is seen that mortars made with HST 60 sand
consistently had higher compressive strengths than those made with HST 95 sand.
The strength class is the new nomenclature used in the EC 6 to differentiate the
mortar types. Strength class M6, M4 and M2 correspond to mortar designations (ii),
(iii), and (iv) respectively. The strength class was substituted for the mortar
designations in the X- axis as it better illustrates the increase in strength. As expected
it can be seen from Figure 3.16 that the relationship between compressive strength
and strength class is a linear relationship. For designation ii, (class M6), there is a
58% difference between the compressive strength of the two mortar designations.
While for designation iv, (class M2), there is only a difference of about 30%,
indicating a convergence in the strength of the two mortars with decreasing mortar
designation. Because of the coarser grading of the HST 60 sand, it has higher a bulk
density and thus a lower water to cement (w/c) ratio than an equivalent weight of HST
95 sand, which subsequently increases the compressive strength of M60 mortars. The
wider divergence at higher mortar grades could be attributed to the greater quantity of
cement available for making a more cohesive mix in the case of HST 60 mortar,
which has coarser grading of sand. Therefore there is better cohesion between the
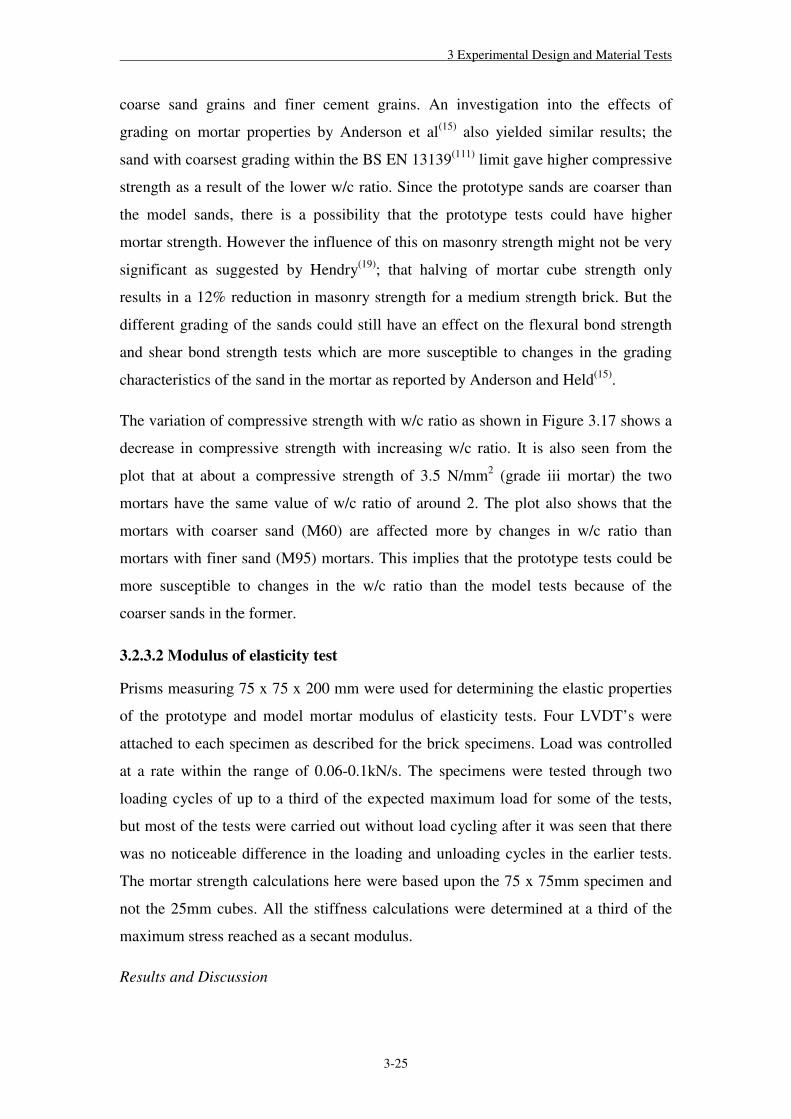
3 Experimental Design and Material Tests
3-25
coarse sand grains and finer cement grains. An investigation into the effects of
grading on mortar properties by Anderson et al(15) also yielded similar results; the
sand with coarsest grading within the BS EN 13139(111) limit gave higher compressive
strength as a result of the lower w/c ratio. Since the prototype sands are coarser than
the model sands, there is a possibility that the prototype tests could have higher
mortar strength. However the influence of this on masonry strength might not be very
significant as suggested by Hendry(19); that halving of mortar cube strength only
results in a 12% reduction in masonry strength for a medium strength brick. But the
different grading of the sands could still have an effect on the flexural bond strength
and shear bond strength tests which are more susceptible to changes in the grading
characteristics of the sand in the mortar as reported by Anderson and Held(15).
The variation of compressive strength with w/c ratio as shown in Figure 3.17 shows a
decrease in compressive strength with increasing w/c ratio. It is also seen from the
plot that at about a compressive strength of 3.5 N/mm2 (grade iii mortar) the two
mortars have the same value of w/c ratio of around 2. The plot also shows that the
mortars with coarser sand (M60) are affected more by changes in w/c ratio than
mortars with finer sand (M95) mortars. This implies that the prototype tests could be
more susceptible to changes in the w/c ratio than the model tests because of the
coarser sands in the former.
3.2.3.2 Modulus of elasticity test
Prisms measuring 75 x 75 x 200 mm were used for determining the elastic properties
of the prototype and model mortar modulus of elasticity tests. Four LVDT’s were
attached to each specimen as described for the brick specimens. Load was controlled
at a rate within the range of 0.06-0.1kN/s. The specimens were tested through two
loading cycles of up to a third of the expected maximum load for some of the tests,
but most of the tests were carried out without load cycling after it was seen that there
was no noticeable difference in the loading and unloading cycles in the earlier tests.
The mortar strength calculations here were based upon the 75 x 75mm specimen and
not the 25mm cubes. All the stiffness calculations were determined at a third of the
maximum stress reached as a secant modulus.
Results and Discussion

3 Experimental Design and Material Tests
3-26
Typical failure was by vertical cracks on the faces and splitting at the sides of the
specimens. It is also seen in Figure 3.18 and 3.19, which compare the stress/strain
curves for the axial strain and lateral strain respectively, that the M60-ii and M95-ii
mortars were the stiffest and showed a more brittle response than the less stiff M95-iv
and M60-iv. However from Table 3.7, the stiffness of M60-iv and MP-iii were found
to be similar even though MP-iii is a designation (iii) mortar. The figures also reveal
that the brick is more brittle in the stressed direction than the mortars as evident from
the sharp drop in the curve as opposed to the gentle “peak plateau” of the mortar
curves that show some ductility. It is also seen from the Figures 3.18 and 3.19 that
there is almost a linear stress/strain relationship in the brick up to failure as opposed
to the mortars, which show non-linearity at about half of the peak stress.
From the stiffness/strength plot in Figure 3.20 and the stiffness/strength class plot in
Figure 3.21, it is seen that there is a much greater difference in the stiffness between
the strength classes in the M60 mortar than in the M95 mortars. For instance there is a
51% percentage increase in stiffness between M95-iv and M95-ii, while the
percentage increase in stiffness between M60-iv and M60-ii is 149%. This is similar
to the greater effect the w/c ratio has on the strength of the M60 mortars than on the
M95 mortar strength, as has been investigated in section 3.2.3.1. This indicates that
even for suitable model sands, the stiffness and strength properties for the same
designation of mortar could be different. Therefore, when modelling prototype
behaviour at model scale, the grading of the model sand should be similar to that of
the prototype even though the average grain size is smaller. The stiffness of MP-iii
was determined to be 6700 N/mm2; this is about 3% stiffer than M95-iii and 86% less
stiff than M60-iii.
3.2.3.3 Flexural strength test
25mm x 25mm x 100mm moulds were used for the manufacture of the flexural
strength test specimens. The load was applied as three point bending. This is slightly
smaller than the recommended 40 x 40 x160mm mould prescribed by BS EN 1015(112)
for the flexural strength. But because of the small volumes of mortar being used for
the actual masonry construction it was thought that using the same moulds for both
the small and prototype scale mortar was more appropriate. Testing was done in

3 Experimental Design and Material Tests
3-27
accordance with the specifications of BS EN 1015-11: 1999(110) at a displacement rate
of 2mm/min.
Results and Discussion
The average value for the flexural strength for the prototype mortar was found to be
1.8 N/mm2, which is about 35% of its compressive strength. Failure of the specimen
was occasioned by a single vertical crack at the mid section of the prism specimen.
Figure 3.22 shows the flexural strength/ strength class relationship for the model scale
mortars, it is seen from the figure that there is a linear relationship between the
parameters, characterised by an increase in the flexural strength as the strength class is
increased. In this case however, the trend line for both the M60 and M95 mortars is
similar, implying that the rate of increase of flexural strength across strength class for
the two mortars types is identical. In the case of the relationship between flexural
strength and the w/c ratio, it is seen from Figure 3.23 that, as in the case of the
compressive strength, there is a decrease in flexural strength as the w/c ratio
increases. It is also seen from the figure that there is a convergence in the trend lines
for the two mortars at lower w/c ratios and a wider divergence for higher ratios. There
is also a linear relationship between the compressive strength and flexural strength
with increasing mortar strength for both types of mortars as shown in Figure 3.24.
3.2.3.4 Fracture energy test
The fracture energy test was carried out according to the recommendations of FMC
1(85), the RILEM recommendation for the fracture energy determination of mortars
and concrete. The specimens were 100mm square in section and 500mm long with a
notch 5mm wide at mid span, through half of the beam’s depth. Load application was
by three point bending at a displacement rate of 0.0003mm/s, while controlled by a
CMOD gauge fitted on the specimen and all the set up is as described for the brick
fracture test.
Results and Discussions
The average fracture energy for the 1:1:6 prototype mortar was determined to be 19.5
N/m (Table 3.7). The COV for the presented results was 8.3%, showing that there was
less variability in the results compared with the brick specimens. The mean fracture

3 Experimental Design and Material Tests
3-28
energy is based on an average of 3 specimens even though 5 were tested. The other
two gave load deflection graphs with sharp almost vertical drops in the post peak
portion, an indication that the deflection at the centre of the beam remained constant
even with further application of load, they were therefore not used in the analysis. The
load/deflection curves for the other three are shown in Figure 3.25, and they show a
somewhat gentle post peak gradient compared with the graphs for the brick test, thus
indicating that the brick specimens are more brittle than the mortar specimens. Since
less energy is needed to propagate a unit area of crack in the mortar than in the brick,
cracks normally develop from the weakest joint at the mortar/brick interface in
masonry composites and then propagate through the brick.
Figures 3.26, 3.27, and 3.28 show the load/deflection or load/CMOD curves for the
M95-iii, M95-ii and M95-iv model mortars, while Figures 3.29, 3.30 and 3.31 show
the load/CMOD curves for M60-iii, M60-ii and M60-iv model mortars. The
load/CMOD curves were used for some of the tests because for some unknown reason
the computer did not log the measurements of the LVDT measuring the central
deflection at mid span. And since it has been reported by Karihaloo(113), that the
CMOD and central mid span deflection for a three point bend test are almost
identical, the load/CMOD curves were used for the affected tests. The close
agreement of the load/CMOD and load deflection curves can be seen from one of the
tests unaffected by the anomaly in Figure 3.32. Barr et al(114) have suggested using of
a correction factor given as Equation 3.4, for the correlation of the CMOD and mid-
span deflection.
CMODH
L 1
4=δ (3.4)
Where L is the loaded span, H the apparent depth over which the beam rotates and
δ the mid-span deflection By using Equation 3.4 the correlation factor was found to
be 0.95, which indicates a very close correlation and therefore the load/CMOD curves
were used for the analysis.
The load/deflection curves for the benchmark mortar, M95-iii reveal that the peak
load in test M95-iii-3 is about half the peak load in the other two tests. As a result the
post-peak softening branch for that test is not identical to those of the other two tests.
No strong reason can be advanced for this. Not surprisingly the fracture energy for

3 Experimental Design and Material Tests
3-29
this mortar from Table 3.6 comes out to be lower than expected; 9.9N/m which is
even less than the fracture energy of the M95-iv mortar; 14.6N/m. In Figure 3.27, it is
seen that the area under the curve for the M95-ii tests is greater than that in the M95-
iii and MP-iii tests, an indication that more work is needed to create a unit area of
fracture in the M95-ii mortar than in the M95-iii and MP-iii mortars. This is to be
expected since the M95-ii is of higher strength class than the other two. The
load/CMOD curves in Figure 3.28 for the M95-iv test show a more gentle post peak
softening response than the M95-iii and M95-ii tests. This confirms the generally held
view that designation (iv) mortars are better in accommodating movement than
designation (ii) and (iii) mortars.
In Figures 3.29, 3.30 and 3.31, which show the load/CMOD curves for the M60
mortars, it is seen as expected that the area under the curves is largest in the M60-ii
mortar followed by the M60-iii mortar and least in the M60-iv mortar. A combined
plot of typical load/CMOD curves in Figure 3.33, for all the mortar tests, reveals that
the areas under each of the three M60 curves are greater than the areas under the
curves corresponding to the same mortar designation for the M95 mortars. This
confirms that mortars with coarse sands generally have higher strength than those
with finer sands because greater energy is required to propagate a unit area of crack.
Figure 3.34 shows the variation of the fracture energy in model mortars with respect
to their strength class. It shows that the fracture energy increases linearly with
increase in the strength of mortar. Probably because in the higher strength classes the
proportion of the binder (cement) is higher, therefore more energy will be required to
break the bond and create fracture. The fracture energy from the M60 mortar tests was
also higher than the M95 tests as observed previously in the case of the compressive
strength. In Figure 3.35, the flexural stress/deflection curves during fracture tests are
shown for some selected mortar types as well as for the brick beam. It is seen from the
figure that the brick is under a higher stress state than the mortars. In addition it has a
sharper softening branch than the mortars, which is an indication of its more brittle
nature. From the figure it can be seen that, the stress/deflection response in the pre
peak region is almost linear for the brick while this is not the case for the mortars.
However, the mean fracture energy for M60-ii mortar is higher than that of the brick
beam by about 15%.

3 Experimental Design and Material Tests
3-30
3.2.3.5 Mortar consistence test; Dropping Ball
The consistence of the mortar specimens was determined in accordance to BS
4551(115) and MR 2(116), the RILEM standard for the mortar consistence test.
Consistence is defined by the Commission W3(117) as the property of a mortar by
virtue of which it tends to resist deformation. This test was used to ensure a uniform
consistence of all the mortar used by ensuring that the penetration value of the ball
was within the prescribed limits.
3.2.3.6 Water retentivity and consistence retentivity Tests
The water retentivity and consistence retentivity tests were carried out in conjunction
with the mortar consistence test mentioned above. Water retentivity measures the
capacity of a mortar to retain part of its water content when it is in contact with an
absorbent surface like brick. This is important because the properties of hardened
mortar are largely affected by how much water is available for the complete hydration
of cement in the mix.
Consistence retentivity is the measure of how much consistence a mortar retains when
it is in contact with an absorbent surface like brick. Both tests were carried in
accordance with the specification of BS 4551 Part 1: 1998. The values of these
properties are summarised in Table 3.7.
The water retentivity of the prototype mortar, MP-iii was determined to be 84% and
its consistence retentivity 55%. From Figure 3.36, which shows the consistence
retentivity of the two model mortars across their respective strength classes, there
does not seem to be a significant change in the consistence retentivity values for the
M60 mortars. While for the M95 mortars there is decrease in consistence retentivity
as the strength is increased. Also consistence retentivity of the M95-iii mortar is
identical to that of the MP-iii mortar, while M95-iv had the highest consistence
retentivity value of 60%. In terms of the water retentivity/strength class variation as
seen from Figure 3.37; the M60 mortars had a marginally lower value of water
retentivity than the M95 mortars.
It is expected that both prototype and model specimens would have similar properties
with regards to bond formation between the unit and mortar, since the water
retentivity of the prototype and benchmark model mortars are identical and their water

3 Experimental Design and Material Tests
3-31
absorption properties similar. However the properties at the brick/mortar interface
might be affected by the different surface textures of the prototype and model units.
There could also be the effect of a faster drying rate of the thin model mortar joints
because of their smaller surface area.

3 Experimental Design and Material Tests
3-32
Scale Length ,mm Width, mm Depth, mmPrototype 215.0 102.5 65.0
Half 96.8 46.1 29.3
Fourth 53.8 25.6 16.3
Sixth 35.8 17.1 10.8
Table 3.1- Average dimensions of prototype and model bricks.
Mortar designation
and proportionMP-iii Prototype (iii),1:1:6 Builder’s sandM95- ii Sixth (ii), 1:1/2:4 Congleton HST 95M95- iii Half, fourth, & Sixth (iii),1:1:6 Congleton HST 95M95- iv Sixth (iv),1:2:9 Congleton HST 95M60- ii Sixth (ii), 1:1/2:4 Congleton HST 60M60- iii Sixth (iii),1:1:6 Congleton HST 60M60- iv Sixth (iv),1:2:9 Congleton HST 60
Mortar Type
Scale Sand
Table 3.2- Different mortar types used in the tests.

3 Experimental Design and Material Tests
3-33
Test Scale Specimen Quantity Mortar Type Sand Type Bed Joint Type mm
Compressive Strength Prototype Wallette 5 MP-iii Builder's sand 10Prototype Triplet 5 MP-iii Builder's sand 10
Half Triplet 5 M95-iii HST95 5Fourth Triplet 5 M95-iii HST95 2.5Sixth Triplet 5 M95-ii,M95-iii, M95-iv HST95 1.6Sixth Triplet 4 M60-ii,M60-iii,M60-iv HST60 1.6Sixth Triplet 4 M95-iii HST95 1Sixth Triplet 4 M95-iii HST95 2.5Sixth Wallette 5 M95-iii HST95 1.6
Test Scale Specimen Quantity Mortar Type Sand Type Bed Joint Type mm
Shear Strength Prototype Triplet 15 MP-iii Builder's sand 10Half Triplet 12 M95-iii HST95 5
Fourth Triplet 12 M95-iii HST95 2.5Sixth Triplet 12 M95-ii,M95-iii, M95-iv HST95 1.6Sixth Triplet 12 M60-ii,M60-iii,M60-iv HST60 1.6Sixth Triplet 12 M95-iii HST95 1Sixth Triplet 12 M95-iii HST95 2.5
Test Scale Specimen Quantity Mortar Type Sand Type Bed Joint Type mm
Flexural Strength Prototype Wallette 5 each MP-iii Builder's sand 10Normal and Parallel to Half Wallette 5 each M95-iii HST95 5
bed joints Fourth Wallette 5 each M95-iii HST95 2.5Sixth Wallette 5 each M95-ii,M95-iii, M95-iv HST95 1.6Sixth Wallette 5 each M60-ii,M60-iii,M60-iv HST60 1.6Sixth Wallette 5 each M95-iii HST95 1Sixth Wallette 5 each M95-iii HST95 2.5
Test Scale Specimen Quantity Mortar Type Sand Type Bed Joint Type mm
Bond Strength Prototype Couplet 9 MP-iii Builder's sand 10Half Couplet 9 M95-iii HST95 5
Fourth Couplet 9 M95-iii HST95 2.5Sixth Triplet 8 M95-ii,M95-iii, M95-iv HST95 1.6Sixth Triplet 8 M60-ii,M60-iii,M60-iv HST60 1.6Sixth Triplet 8 M95-iii HST95 1Sixth Triplet 8 M95-iii HST95 2.5
Test Scale Specimen Quantity Mortar Type Sand Type Bed Joint Type mm
Diagonal Tensile Prototype Wallette 3 MP-iii Builder's sand 10Strength Half Wallette 5 M95-iii HST95 5
Fourth Wallette 5 M95-iii HST95 2.5Sixth Wallette 5 M95-ii,M95-iii, M95-iv HST95 1.6Sixth Wallette 5 M60-ii,M60-iii,M60-iv HST60 1.6Sixth Wallette 5 M95-iii HST95 1Sixth Wallette 5 M95-iii HST95 2.5
Table 3.3- Details of all masonry tests.

3 Experimental Design and Material Tests
3-34
Prototype Half Fourth SixthTest
Compressive Strength, N/mm2 29.2 30.6 41.9 47.4COV, % 14.3 8.4 9.7 32.7
Flexural Strength, N/mm2 4.3 6.3 3.7 4.4COV, % 21.2 15.1 10.4 24.8
Indirent tensile strength, N/mm2 1.9 2.1 2.2 2.4COV, % 14.0 29.5 34.9 22.5Water Absorption, % 14.8 16.5 15.3 16.3COV, % 14.8 5.6 5.3 16.7
Modulus of Elasticity, N/mm211500 - - -
COV, % 31 - - -Fracture Energy, N/m 47.4 58.2 - -COV, % 10.5 25.8 - -Poisson's ratio 0.06 - - -COV, % 48.1 - - -
Table 3.4- Mechanical properties of prototype and model bricks.
Top Side End
Strength,N/mm2 Strength,N/mm2 Strength,N/mm2
1 24.3 27.1 31.32 31.4 35.4 31.93 24.9 35.4 29.34 22.8 31.8 38.85 24.2 32.7 31.16 21.7 26.1 31.9
Mean 24.9 31.4 32.4COV% 13.6 12.7 10.1% increase 0 26 30
Table 3.5- Effect of loading orientation on brick strength.
Total length Length of support, l b dScale mm mm mm mmPrototype 670.0 570.0 130.0 67.0Half 292.0 252.0 46.1 29.6Fourth 463.0 143.0 25.7 16.5Sixth 109.0 96.0 17.2 10.8
Table 3.6- Average dimension of flexural tensile strength specimens.

3 Experimental Design and Material Tests
3-35
HST95ii HST95iii HST95iv HST60ii HST60iii HST60iv MP
Mortar Designation ii iii iv ii iii iv iiiVol. Proportions 1 : 1/2 : 4 1 : 1 : 6 1 : 2 : 9 1 : 1/2 : 4 1 : 1 : 6 1 : 2 : 9 1 : 1 : 6W/c ratio 1.25 1.8 2.58 1.11 1.41 2.20 1.55Water retentivity,% 83 86 85 83 83 81 84Consistence retentivity,% 40 55 60 40 42 40 55
Comp. Str. N/mm2 6.3(3.3) 4.7(8.5) 1.8(8.1) 10.0(4.6) 7.1(8.8) 2.3(3.1) 5.0(1.8)
Flexural Str. N/mm2 3.3(5.1) 2.3(5.3) 0.8(5.5) 3.5(0.21) 2.5(6.0) 0.9(1.9) 1.8(11.8)Fracture Energy, N/m 42.0(19.8) 9.9(20.2) 14.6((36.2) 54.7(0.3) 43.3(14.0) 18.8(27.4) 19.5(8.3)Modulus of Elasticity, 12900(7.9) 6500(8.7) 4500(12.7) 17000(2.96) 12500(5.22) 6800(5.51) 6300(17.8)Poisson's ratio 0.10 0.10 0.09 0.12 0.11 0.10 0.12
Table 3.7- Properties of prototype and model mortars (COV in brackets).

3 Experimental Design and Material Tests
3-36
24.2
2.6
28.2106.2
5050
2.6
25.6
2.6
2.610.319.717.119.7
17.6
16.3
18.9
11.9
22.6
13.4
2.6
10.8
15.5
A B C
Figure 3.1- Drawing plans showing the cutting dimensions in the half, fourth and sixth model units respectively.
2.5
2.6
2.7
2.8
2.9
1 10 100 1000 10000
Log Time, mins
Bri
ck W
eigh
t,kg
Sample 1 Sample 2 Sample 3 Sample 4 Sample 5
24 hrs
Figure 3.2-Water absorption characteristics of the prototype brick.
0
20
40
60
80
100
0.01 0.1 1 10
Sieve size (mm)
Cum
mla
tive
% p
assi
ng
Fine Limit Coarse Limit 1/6 FineLimit 1/6 Coarse Limit
HST 95 HST 60 Sharp sand
Figure 3.3- grading curves for prototype and model sands within the BS limits.

3 Experimental Design and Material Tests
3-37
0
25
50
75
100
0.0 0.2 0.4 0.6 0.8 1.0 1.2
Scale
Com
pres
sive
Str
engt
h, N
/mm2
Figure 3.4- Unit compressive strength in the four scales.
Figure 3.5- Orientation of model units in a prototype brick.

3 Experimental Design and Material Tests
3-38
0
5
10
15
20
25
30
-0.003 -0.001 0.001 0.003 0.005
Strain
Com
pres
sive
Str
ess,
N/m
m2
B-MOD-2AV
B-MOD-3AV
B-MOD-5AV
Figure 3.6- Stress/strain curves in some prototype brick stiffness tests.
0
5
10
15
20
25
30
-0.003 -0.001 0.001 0.003 0.005
Strain
Com
pres
sive
Str
ess,
N/m
m2
B-MOD-5A
B-MOD-5B
B-MOD-5AV
Figure 3.7-Typical stress/strain relationship in prototype brick.
0
2
4
6
8
0 0.2 0.4 0.6 0.8 1 1.2
Scale
Mod
ulus
of r
uptu
re, N
/mm2
Figure 3.8- Modulus of rupture of prototype and model scale units

3 Experimental Design and Material Tests
3-39
0
0.5
1
1.5
2
2.5
0 0.2 0.4 0.6 0.8 1 1.2
Scale
Ten
sile
Str
engt
h, N
/mm
2
Figure 3.9- Indirect tensile strength of prototype and model scale units.
20
25
30
35
40
45
50
1.8 2 2.2 2.4 2.6
Tensile Strength, N/mm2
Com
pre
ssiv
e St
ren
gth
,N/m
m2
1 2
4 6
Figure 3.10- Compressive strength/tensile strength relationship for prototype and
model units.
0
5
10
15
20
0 0.2 0.4 0.6 0.8 1 1.2
Scale
Wat
er a
bso
rpti
on, %
Figure 3.11- Water absorption of units across the four scales.

3 Experimental Design and Material Tests
3-40
0
1
2
3
0 0.2 0.4 0.6
Deflection,mm
Loa
d, k
N
B-FRC-BM-1
B-FRC-BM-2
B-FRC-BM-3
B-FRC-BM-4
B-FRC-BM-5
Figure 3.12- Load/deflection curves for prototype brick beam fracture test.
0
1
2
3
0 0.2 0.4 0.6
Deflection, mm
Loa
d, K
N
B-FRC-U-1
B-FRC-U-2
B-FRC-U-3
B-FRC-U-4
B-FRC-U-5
Figure 3.13- Load/deflection curves for prototype unit fracture test.
0
1
2
3
0 0.2 0.4 0.6
Displacement, mm
Loa
d, k
N
B-FRC-BM-1
B-FRC-U-1
Figure 3.14- Typical load/deflection response for beam and single unit prototype
fracture energy tests.

3 Experimental Design and Material Tests
3-41
0
1
2
3
4
5
0.0 0.2 0.4 0.6 0.8 1.0 1.2 1.4
Deflection, mm
Fle
xura
l Str
ess,
N/m
m2
B-FRC-BM-1
B-FRC-U-1
B-FRC-BM-2
Figure 3.15- Flexural stress/deflection response for prototype and half scale unit
Fracture Energy tests.
0
2
4
6
8
10
12
0 1 2 3 4 5 6 7
Mortar Strength Class
Com
pre
ssiv
e S
tren
gth
, N/m
m2
M95
M60
Figure 3.16- Compressive strength of model mortars/strength class relationship.
0
2
4
6
8
10
12
0 0.5 1 1.5 2 2.5 3
W/c Ratio
Com
pre
ssiv
e S
tren
gth
, N/m
m2
M95
M60
Figure 3.17- Variation of compressive strength of model mortars with w/c ratio.

3 Experimental Design and Material Tests
3-42
0
6
12
18
24
30
0 0.001 0.002 0.003 0.004 0.005 0.006
Axial Strain
Com
pre
ssiv
e S
tres
s, N
/mm
2 M95-iii
M95-ii
M95-iv
M60-ii
M60-iii
M60-iv
MP-iii
Brick
Figure 3.18- Comparison typical stress/ axial strain plot for prototype and model
mortars.
0
6
12
18
24
30
-0.002 -0.001 0
Lateral Strain
Com
pre
ssiv
e S
tres
s, N
/mm
2
M95-iii
M95-ii
M95-iv
M60-ii
M60-iii
M60-iv
MP-iii
Brick
Figure 3.19- Comparison of typical stress/lateral strain plot for prototype and model
mortars.
0
5000
10000
15000
20000
0 5 10 15 20 25
Compressive Strength, N/mm2
Sti
ffn
ess,
N/m
m2
M95
M60
Figure 3.20- Variation of stiffness with strength for model mortars.

3 Experimental Design and Material Tests
3-43
0
5000
10000
15000
20000
0 2 4 6 8
Mortar Strength Class
Stif
fnes
s, N
/mm
2
M95
M60
Figure 3.21- Variation of stiffness with strength class for model mortars.
0
1
2
3
4
0 1 2 3 4 5 6 7
Mortar Strength Class
Fle
xura
l Str
engt
h, N
/mm
2
M95M60M60M95
Figure 3.22- Flexural strength of model mortars/strength class relationship.
0
1
2
3
4
0 1 2 3
W/c Ratio
Fle
xura
l Str
engt
h, N
/mm
2
M95
M60
Figure 3.23- Variation of flexural strength of model mortars with w/c ratio

3 Experimental Design and Material Tests
3-44
0
2
4
6
8
10
12
0 1 2 3 4
Flexural Strength, N/mm2
Com
pre
ssiv
e S
tren
gth
, N/m
m2
M95 mortar
M60 mortar
Figure 3.24- Mean compressive strength/ mean flexural strength relationship for
model mortars.

3 Experimental Design and Material Tests
3-45
0
0.2
0.4
0.6
0.8
1
0 0.2 0.4 0.6 0.8
Deflection, mm
Loa
d, k
N
MP-iii-2
MP-iii-4
MP-iii-5
Figure 3.25- Load/deflection graphs for prototype mortar fracture tests.
0
0.2
0.4
0.6
0.8
1
0 0.2 0.4 0.6 0.8
Deflection, mm
Loa
d, K
N
M95-iii-2
M95-iii-3
M95-iii-4
Figure 3.26- Load/deflection graphs for benchmark mortar fracture test.
0
0.2
0.4
0.6
0.8
1
0 0.2 0.4 0.6 0.8
CMOD, mm
Loa
d, k
N
M95-ii-2
M95-ii-3
M95-ii-4
M95-ii-5
Figure 3.27 - Load/crack mouth opening deflection, CMOD for M95-ii mortar
fracture test.

3 Experimental Design and Material Tests
3-46
0
0.2
0.4
0.6
0.8
1
0 0.2 0.4 0.6 0.8
CMOD, mm
Loa
d, k
N
M95-iv-1
M95-iv-2
M95-iv-3
Figure 3.28- Load/CMOD curves for M95-iv mortar fracture test.
0
0.2
0.4
0.6
0.8
1
0 0.2 0.4 0.6 0.8
CMOD, mm
Loa
d, k
N
M60-iii-1
M60-iii-2
M60-iii-3
Figure 3.29- Load/CMOD curves for M60-iii mortar fracture test.
0
0.2
0.4
0.6
0.8
1
0 0.2 0.4 0.6 0.8
CMOD, mm
Loa
d, k
N
M60-ii-1
M60-ii-2
Figure 3.30- Load/CMOD curves for M60-ii mortar fracture test.

3 Experimental Design and Material Tests
3-47
0
0.2
0.4
0.6
0.8
1
0 0.2 0.4 0.6 0.8
CMOD, mm
Loa
d, k
N
M60-iv-1
M60-iv-2
M60-iv-3
Figure 3.31- Load/CMOD curves for M60-iv mortar fracture test.
0
0.2
0.4
0.6
0.8
1
0 0.2 0.4 0.6 0.8
Deflection/CMOD, mm
Loa
d, K
N
Centraldeflection
CMOD
Figure 3.32- Comparison of Load/CMOD and central deflection at mid span for M95-
iii fracture test.
0
0.2
0.4
0.6
0.8
1
0 0.2 0.4 0.6 0.8
CMOD ,mm
Loa
d, k
N
MP-iii
M95-iii
M95-ii
M95-iv
M60-ii
M60-iii
M60-iv
Figure 3.33- Comparison of typical load/CMOD curves from mortar fracture test

3 Experimental Design and Material Tests
3-48
0
20
40
60
80
0 1 2 3 4 5 6 7
Mortar Strength Class
Fra
ctu
re E
ner
gy, N
/m M95
M60
M95
M60
Figure 3.34- Variation of fracture energy with mortar class in model mortars.
0
1
2
3
4
0 0.1 0.2 0.3 0.4 0.5
Deflection, mm
Fle
xura
l Str
ess,
N/m
m2
M95-iv
M95-ii
MP-iii
B-FRC-BM-1
Figure 3.35- Comparison of flexural stress/deflection curves for some mortars and
prototype brick during fracture tests.

3 Experimental Design and Material Tests
3-49
0
15
30
45
60
75
0 1 2 3 4 5 6 7
Mortar Strength Class
Con
sist
ence
Ret
enti
vity
,%
M95
M60
Figure 3.36- Variation of consistence retentivity in model scale mortars.
50
60
70
80
90
100
0 1 2 3 4 5 6 7
Mortar Strength Class
Wat
er R
eten
tivi
ty,%
M95M60
Figure 3.37- Variation of water retentivity in model scale mortars.

3 Experimental Design and Material Tests
3-50
Plate 3.1(a)- Triplet masonry specimen in preparation.
Plate 3.1(b)- Sixth scale wallette specimen in preparation.

3 Experimental Design and Material Tests
3-51
Plate 3.2- Set up of brick modulus of elasticity test.
Plate 3.3- Set up of prototype brick flexural strength test.

3 Experimental Design and Material Tests
3-52
Plate 3.4- Set up for brick beam fracture energy test.
Plate 3.5- Set up for single brick unit fracture energy test.
Plate 3.6- Set up for half scale model unit fracture test.

4 Masonry Assemblies and Tests
4-1
4 Masonry Assemblies and Tests
The details of the various masonry tests and their instrumentation are presented in this
chapter. Most of the tests are derived from standard masonry tests from the codes, and
performed on small specimens for example wallettes and triplets. The detail of the
development of the testing programmes has been given in Chapter 3.
The five masonry tests undertaken as part of the current study were the; compressive
strength test, initial shear strength test, flexural strength tests, bond wrench test and
diagonal shear strength test. All the five tests were carried out on each of the four
scales namely; prototype, half, fourth and sixth scale.
Loading rate
In general the tests were carried out under load control as specified by most of the
standards and their recommendations used. For example in the compressive strength a
loading rate of 0.15N/(mm2.min) for low strength units to 1.25N/(mm2.min) for high
strength unit was specified by BS EN 1052-1(89). Since the units used in this
investigation are of medium strength (29N/mm2 for the prototype and 46N/mm2 for
the sixth scale) a loading rate of 0.5N/mm2/min was used for the tests. For the
prototype and half scale triplet tests this works out as 0.18kN/s and 0.04kN/s
respectively. The same procedure was used to determine the loading rates for the
scales and tests. However in some of the model tests involving low loads where a
20kN capacity testing machine was used, testing in load control was not achievable
and a constant rate of displacement was used for the affected tests. In such cases a
trial test was first carried out in displacement control to determine the time taken to
reach maximum load in a test, from which a suitable displacement rate was
determined that would achieve failure in a time comparable to the time taken to reach
failure in the tests with load control. Maurenbrecher(118) has reported that compressive
strength tests on extruded stack bonded masonry units tested at 9.5N/mm2 and
0.3N/mm2 loading rates showed a reduction of only 4% in strength for the slower test.
Therefore it was concluded that using a constant displacement rate instead of constant

4 Masonry Assemblies and Tests
4-2
load rate for the smaller model tests should not significantly alter the outcome of the
tests.
4.1 Compressive strength test
Prototype
Two specimen formats were tested at this scale; a 2 brick wide by 6 brick high
wallette specimen as shown in Figure 4.1(a) and a three brick high triplet as shown in
Figure 4.2. Both specimen types were made with the MP mortar. The former were
tested in accordance with the requirements of BS EN 1052-1(89) in a testing machine
at a loading rate of 0.4kN/s while the latter were tested at a loading rate of 0.18kN/s
until failure occurred. Three 25mm cubes were collected from each batch of mortar
made and were tested at 28 days for the determination of their compressive strength
for quality control purposes.
In the case of the 2 x 6 wallette specimens, the positions of the LVDTs are as shown
in Figure 4.1(a), while Figure 4.2 shown the positions of the LVDTs in the triplet
specimens. The LVDTs were fitted in order to measure the deformations of the
specimens under compressive loading for the determination of the stiffness properties
of the masonry. In both instances, the LVDTs were fitted on both the front and back
faces of the specimens (top and bottom in relation to how the bricks were laid in the
mould) to identify any bending effects. Fibreboard pieces were used as packing to
ensure a flat level surface in case of the prototype specimens. However it was thought
that using fibreboard pieces would not be necessary for the testing of model scale
specimens since their surfaces were already flat. Furthermore it has been reported by
Templeton and Edgell(119) that the compressive strength of clay bricks with mortar
capped surfaces are only about 8% more than those with ground surfaces for low to
medium strength bricks. While Edgell et al(120) have found that mortar capped
masonry wallettes are only about 2% stronger in compression than plywood capped
wallettes. From the forgoing it was therefore concluded that using fibreboard capped
prototype specimens would still be comparable to uncapped surfaces of the model
specimens.

4 Masonry Assemblies and Tests
4-3
Instrumentation
Four LVDT’s, two on either face were used to measure vertical deformations on the
prototype wallettes. The range of these vertical transducers was ±15mm while the
range of the transducers used for measuring the horizontal deformations were ±10mm.
One each of these transducers was used on either face of the wallettes. Measurements
were monitored and recorded on a data logger together with the output from the load
cell.
In the case of the triplet specimens at half, fourth, and prototype scales, LVDT’s with
a range of ±5mm were used for recording the vertical deflections under the applied
loading. All measurement were monitored and recorded on a data logger connected to
both the transducers and the load signal.
Because of the small sizes of the sixth scale specimens, specially made gauges called
model masonry clip gauges (MMCG’s) were used for the deformation measurements.
These gauges were made for an earlier project involving sixth scale models (52) and
they consist of a central 6mm wide spring steel clip, 0.5mm thick as shown in Plate
4.1. The figure shows the ends of the steel clip which carry two M3 caphead bolts,
one at each end at a distance of 30mm apart. Fastened to the end of these bolts are two
aluminium arms with 1.0mm holes for attaching to drawing pins. A thin steel plate
was finally attached to one end to carry the wire connectors and also to secure the
wires. Mounted on the spring steel are four electrical resistance gauges, two aligned
orthogonally on each side. The gauges were manufactured by Micromeasurements
Group, UK and were of type CEA-06-UN-350. They were wired in a full bridge strain
gauge circuit and were made to locate on two standard drawing pins, placed 25mm
apart. This corresponds to the distance between the centres of the units in three
courses of sixth scale masonry. To ensure uniformity in laying the pins, small gauge
bars were used to position the pins at the required spacing of 25mm apart. Plate 4.2
shows the specimens fitted with the MMCGs for the sixth scale triplet and wallet
stiffness test
Half Scale
Three brick high triplet specimens were tested in compression in this case. Load was
applied at a rate of 0.04kN/s until failure occurred. Two transducers; one on each side,
were fitted longitudinally on opposite sides of the specimen for measurement of the

4 Masonry Assemblies and Tests
4-4
deformation of the specimen under the applied load. The mean of five specimens was
used for determining the compressive strength at this scale. Plate 4.3 shows all four
triplet specimens from the four scales side by side.
Fourth scale
Three brick triplet specimens similar to those in the other scales detailed were tested
in compression in a load control machine at a load rate of 0.02kN/s until failure
occurred. The specimens were fitted with one transducer each on opposite sides of the
specimen to measure the longitudinal deformations in the direction of loading.
Sixth Scale
Two specimen formats were tested as in the prototype test. Designation (iii) mortar
prepared with HST 95 sand (benchmark mortar) was used in this instance for both
specimen formats, while only triplet specimens were made with the other mortar types
shown in Table 4.1 and for the different joint thickness tests. The wallette specimens
were tested in accordance with the requirements of BS EN 1052-1(89) with
displacement control at a constant displacement rate of 0.005 mm/s until failure
occurred. While the triplet specimens were tested in displacement control at a
constant displacement rate of 0.06mm/min until failure of the specimens. MMCG’s
were used to measure the deformations of the specimens under the applied loading;
Figure 4.1(b) shows how the gauges were fixed to both sides of the wallette
specimens.
Stiffness
The modulus of elasticity of the wallette specimens was calculated according to the
recommendations of BS EN 1052-1(89), which stipulates that it should be determined
as a secant modulus from the mean of the strains of all four measuring positions at a
third of the maximum stress reached. In the case of the triplet specimens, the stiffness
was also determined from the mean strains of the two measuring points occurring at a
third of the maximum stress. Plate 4.4 shows the set up for the prototype modulus of
elasticity tests.
Calculations
Strength

4 Masonry Assemblies and Tests
4-5
From BS EN 1052-1(89), the compressive strength of masonry, if was determined from
Equation 4.1
ii A
Ff max= N/mm2 (4.1)
Where Fmax is the maximum load reached on an individual masonry specimen and Ai
is the loaded cross-section of an individual masonry specimen.
Also from the same code, the characteristic compressive strength of masonry is given
as 2.1/ffk = or min,ik ff = (4.2)
Where, min,if is the smallest compressive strength of an individual masonry specimen
and f is the mean compressive strength of the masonry.
Modulus of elasticity
The modulus of elasticity of an individual masonry specimen was evaluated as a
secant modulus from the mean of all the measuring positions (two for the triplet
specimens and four for the wallet specimens), occurring at a stress equal to one third
of the maximum stress reached according to the provisions of BS EN 1052-1(89) using
Equation 4.3.
iii A
FE
..3max
ε= (4.3)
Where iε is the mean strain in an individual masonry specimen at one third of the
maximum strength achieved.
4.2 Shear strength test
Prototype
The shear strength test for the prototype was carried out in accordance with the
provisions of BS EN 1052-3(31) the standard for the determination of initial shear
strength of masonry specimens. The set up dimensions for the initial shear strength
test are shown in Figure 4.3, which shows a triplet specimen supported on two rollers.
A special test rig was fabricated and used for the testing of the triplet specimens using
the general provisions of the standard. The rig is shown in Plate 4.5, which shows that

4 Masonry Assemblies and Tests
4-6
it made up of a four 25 x 25mm square Rectangular Hollow Section (RHS) welded to
15mm steel plates at either end. A 100kN load cell was bolted on one of steel plates
while a hydraulic ram was mounted on to the other. The supports consisted of two
12mm steel plates on to which 12mm diameter bars were welded while the load was
applied through two 12mm diameter bars held on to 12mm steel plate with plasticine.
The specimens were placed within the frame on the supports against 15mm steel
plates that push against the load cell on one end and the hydraulic ram on the other.
Fibre board pieces were put in between the specimen and steel plates to even out
surface irregularities on the bottom and top faces of the specimens. The ram was
controlled through an air regulator while the exerted pressure was read through a
Gemini universal signal conditioning unit. The experiments were carried out at three
precompression stress levels of 0.2N/mm2, 0.6N/mm2 and 1.0N/mm2 while the
shearing load was applied at a loading rate of 0.15kN/s using a load controlled
machine. Four specimens were tested at each precompression level making a total of
12 specimens.
Half Scale
A similar frame to the one used in the prototype test was used for testing the specimen
in this case. The only difference in the two frames was the size; apart from that they
were similar in every respect. The support bars were 6mm in diameter, which were
welded to 6mm steel plates as in previous case. The same hydraulic ram was used to
exert the precompression force needed for the test, while a 20kN load cell was used to
measure the applied precompression force. Instrumentation was as described in the
last section and load was applied at a loading rate of 0.02kN/s via the same testing
machine.
Fourth and sixth Scale
A specially constructed rig was used for testing the specimens in the fourth and sixth
scales. Plate 4.6 shows a picture of the set up for the sixth scale test. At one end of
this rig is a pneumatic ram attached to a 50kgf Z-load cell via a steel bolt, at the other
end is a rigidly bolted steel block. The specimen sits against this block and another
that is free to move horizontally and connected to the Z-load cell by means of a steel
ball. Compressed air was passed through an air regulator into the inlet valve of the

4 Masonry Assemblies and Tests
4-7
ram, this in turn pushes the Z-load cell and exerts a force that compresses the
specimen between the two steel blocks. The specimens were supported on 6mm bars
fixed to 5mm steel plates for the fourth scale test while a 5mm bar and 5mm steel
plate was used for the sixth scale test.
The force exerted on the load cell was read via a data logger, where it was monitored
and controlled by means of the regulator. The shearing load was applied at a rate of
0.01kN/s via the testing machine until the shear failure of the specimens.
Calculations
The individual shear strength, shif and precompression stress, pif for each specimen
were calculated from Equations 4.4 and 4.5 respectively
A
Ff i
ish 2max= (4.4)
A
Ff pi
pi = (4.5)
where Fimax and Fpi are the maximum shear load reached and the maximum
precompression force respectively. While A is the cross- sectional area of the
specimen parallel to the bed joints.
The initial shear strength was evaluated from the plot of shif against pif as the
intercept of the linear regression line of the plots on the vertical axis, while the
gradient represents the co-efficient of friction.
4.3 Flexural strength test
Prototype
The test specimens were in accordance with the specifications of methods of tests for
masonry-Part 2: determination of flexural strength, BS EN 1052-2(91), however the
actual test was carried out whilst the specimens were supported and loaded in a
horizontal orientation while the code recommends a vertical loading arrangement.
Two specimen formats were tested; a 2 units wide by 10 courses high rectangular
specimen for the determination of the masonry flexural strength across the bed joints

4 Masonry Assemblies and Tests
4-8
and a 4 units wide by 4 courses high wallette for the determination of the flexural
strength parallel to the bed joints. The load was applied at a load rate of 0.5kN/s until
the failure of the specimens while the panels were supported on two roller supports of
40mm diameter and loaded by two rollers of the same diameter. Plate 4.7 shows the
set up for the flexural strength parallel to bed joints test. Fibreboard pieces were put in
between the roller surfaces and specimen to ensure all round contact between them. A
steel panel carrying a swivel head was placed on the rollers to eliminate any
unevenness of the specimen surface so as to ensure uniform load application through
both loading rollers. Figure 4.4 shows the set up dimensions for the flexural strength
parallel to the bed joints while Figure 4.5 shows the set up dimensions for the flexural
strength normal to the bed joints in all four scales.
Half Scale
The two specimen formats were tested using a load controlled testing machine, in this
case at a loading rate of 0.05kN/s. Steel rollers of 19mm diameter were used to
support the specimens while loading rollers of the same diameter were used. The load
was applied through a swivel placed on top of a rigid steel plate as in the previous
case to ensure uniform load application through both rollers.
Fourth Scale
The flexural strength test was also carried out in a load controlled testing machine at a
load rate of 0.03kN/s. The specimens were supported on 12mm diameter steel rollers
and loaded in four point bending through rollers of similar diameter. A swivel head
was used to apply the load as in the previous cases.
Sixth Scale
A small capacity testing machine was used to carry out the flexural strength tests at
this scale. Load was applied via displacement control at a rate of 0.3mm/min until
failure of the specimens. Steel rollers of 9mm diameter were used to support and load
the specimens in four point bending. As in the other scales load was applied through a
swivel head, formed by placing a steel ball in between two steel plates with rounded
centres. The set up for the test is shown in Plate 4.8.
Calculation

4 Masonry Assemblies and Tests
4-9
The flexural strength of masonry, if was determined from Equation 4.6.
2
max
2
))((3 12
Bt
llWFfi
−+= (4.6)
where Fmax is the maximum load reached, W is the self weight of a specimen and t is
the width of masonry unit. B, l2 and l1 are as defined in Figures 4.4 and 4.5.
4.4 Bond wrench test
Prototype
Couplet specimens were made for the determination of the bond strength of masonry
using the bond wrench method and tested in accordance with the specifications of the
RILEM standard LUMB3(121). Plate 4.9 shows a picture of the test set up, which
consist of a lever clamped to the upper unit in the assembly and another clamp applied
to the lower unit, restraining the assembly from movement whilst load was applied to
the end of the upper lever. Load was applied via a load controlled testing machine at a
load rate of 0.07kN/s. The load was applied at a distance of 335mm from the
longitudinal centre of the assembly. Figure 4.6 gives the set up dimensions for the
four scales.
Half, fourth and sixth scales
A similar arrangement to the one used in the prototype tests were also used in the case
of the half, fourth and sixth scale models. The tests were however carried out in a
smaller capacity testing machine at displacement rates of 1mm/min, 0.6mm/min and
0.3mm/min corresponding to the rates in the half, fourth and sixth scale specimens
respectively. The load was applied at a distance of 175mm, 105mm and 43mm from
the longitudinal centre of half, fourth and sixth scale specimens respectively. Plate
4.10 shows the set up for the sixth scale test.
Calculations
The bond strength, S was calculated from Equation 4.7.
bd
W
Z
MS −= (4.7)

4 Masonry Assemblies and Tests
4-10
Where M = bending moment at failure in Nmm,
Z = section modulus in mm3 (given as bd2/6),
W= maximum compressive load applied to the joint, N,
b and d are mean width and depth respectively of joint at line of fracture.
4.5 Diagonal tensile strength test Prototype
The diagonal tensile strength test was carried in a testing machine according to the
provisions of the RILEM recommendation for the determination of the diagonal
tensile strength of small wall specimens, LUMB6(93). The specimens were 4 units
wide and 12 units high as shown in Figure 4.7, which shows dimensions of the test
specimens in all four scales. The specimens were required to be as reasonably square
as possible as recommend by the code; 940 x 905 mm was achieved for the prototype
specimens. This was because of variations in the dimensions of the units resulting
from the manufacturing process.
Because of the significant weight of the specimens, measures were taken to facilitate
handling of the specimen after construction as well as to put them in position for
testing. Firstly, the base of the wooden mould for constructing the specimens was
oiled and laid with a strong plastic sheet. The specimens were then constructed in the
usual way (as per this research) and left to cure for about a week before demoulding.
During demoulding the specimens were slid from the mould with the aid of the plastic
sheet where they were taken for storage until they were tested.
In order to position them in the rig for testing, the specimens were sandwiched
between two wooden panels, as shown in Plate 4.11. The panels have channel shaped
aluminium section screwed along the diagonals, so that they could be lifted up using a
crane from a bolt holding the two sections together. Fibreboard pieces made to the
size of the specimens were used in between the specimens and wooden panels to
cushion the effect of the clamping force. The two wooden boards were then bolted
together securely before the whole assembly was lifted by an overhead crane onto the
testing machine.

4 Masonry Assemblies and Tests
4-11
The specimens were then gently lowered onto specially made steel V-blocks for
testing the specimens diagonally. Another steel V-block was placed on the opposite
corner of a specimen before they were positioned, centred and plumbed prior to the
fixing of transducers for the measurement of the deformations. Fibreboard pieces
where used to even out surface irregularities on top and below the loaded diagonals.
Load was applied at a constant displacement rate of 0.01mm/s until failure of the
specimens. A constant displacement rate was used in this test to enable safe stoppage
of the testing machine at failure so that the LVDTs were not damaged. Two
transducers were placed on the compression and tension diagonals on each side to
measure the deformations. The lengths of the transducers are given in Figure 4.7. All
the transducers were calibrated LVDTs with a range of ±15mm. A different
transducer, with a range of ±25 was used to record the vertical deflection at the centre
of the panel. The measurements from the five transducers and the load signal were fed
to and monitored on a data logger, for later analysis. The set up for the test is shown
in Plate 4.12.
Half Scale
The half scale diagonal tensile strength test was also carried out in a testing machine
at a load rate 0.04kN/s until failure of the specimens. The specimens were loaded via
two brass V-blocks glued to the corners of the diagonals. Plastic padding epoxy resin
was used to glue the V-blocks and the specimens aligned and centred while the glue
was setting. The specimens were also fitted with transducers as discussed in the case
of the prototype specimens and the length of the gauges are set out in Figure 4.7. Plate
4.13 shows the set up for the test.
Fourth Scale
The diagonal tensile strength test at fourth scale was carried out in a testing machine
at a load rate of 0.01kN/s until the failure of the specimens. The specimens were also
loaded diagonally through two brass V-blocks glued to the top and bottom diagonals
using plastic padding. Two transducers, one each on the compression and tension
diagonals were used to measure the deformations of the panel under compression.
This was done for both the front and back (top and bottom) faces of the panel in order
to cancel out bending effects. Five specimens were tested in this way.

4 Masonry Assemblies and Tests
4-12
Sixth Scale
The diagonal tensile strength test in this case was carried out in a testing machine at a
displacement rate of 0.07mm/min. The gauges were fitted, as discussed for the other
scales and load was applied through two brass V-blocks glued to the top and bottom
of either diagonal. Strain measurement were recorded and monitored on an Orion
logger before being retrieved for subsequent analysis. Even though the sizes of the
specimens are different for the different joints test, a uniform gauge length as shown
Figure 4.6 was used for all the sixth scale tests. Plate 4.14 shows the set up for the
test.
Discussion
The difficulties posed by constructing and testing relatively large prototype specimens
is seen from this test and the advantage of model tests has further been highlighted.
All the model specimens were relatively easy to construct and test therefore less time
and effort was expanded in their testing because the challenges seen in the prototype
test were not seen.
Calculations
The diagonal tensile strength, ptS (shear strength) was evaluated from Equation 4.8
npt A
PS
707.0= (4.8)
Where P is the load at failure
An is the net area of the specimen = 2
)( tnBL + (4.9)
t is the wall thickness and L and B the face dimensions, n is the fraction of the gross
area of the specimen that is solid.

4 Masonry Assemblies and Tests
4-13
25m
m
73.2mm
72.8
mm
25mm
37.4mmLongitudinal MMCG spacing
Lateral MMCG length
Longitudinal MMCG length
Longitudinal LVDT spacing
440mm
150m
mLongitudinal LVDT length
160mm
440m
m
Lateral LVDT length
220mm
(a) Prototype (b) Sixth Scale Figure 4.1- Position of transducers in wallette specimens.
215mm 96.8mm
103
mm
53.8mm
56.5
mm
35.8mm
37.2
mm
230m
m
25m
m
65m
m
35m
m
145m
m
Prototype Half Scale Fourth Scale Sixth Scale
Figure 4.2- Position of transducers in triplet specimens.
e
e
t
d
t
L
L, mm e, mm d, mm t, mmPrototype 215 14.5 12 12Half 96.8 6.5 6 6Fourth 53.8 3.5 6 5Sixth 35.8 2.5 5 5
Figure 4.3- Set up dimensions for shear strength tests.

4 Masonry Assemblies and Tests
4-14
B
L
l1
l2
Length, L Width, B Support Span, l 2 Loading Span, l 1
Prototype 895 305 795 430
Half 400 135 350 155Fourth 225 75 200 85
Sixth 148 47 131 58
Figure 4.4 - Set up dimensions (mm) for flexural strength parallel to bed joint tests.
l1
l2
B
L
Length, L Width, B Support Span, l 2 Loading Span, l 1
Prototype 775 445 675 400
Half 345 200 295 177Fourth 180 110 155 90
Sixth 122 73 105 60
Figure 4.5- Set up dimensions (mm) for flexural strength normal to bed joint tests.

4 Masonry Assemblies and Tests
4-15
l
d
Depth, d Moment arm, l
Prototype 103 335
Half 46 175Fourth 26 105
Sixth 17 43
Figure 4.6- Set up dimensions (mm) for bond strength test using the bond wrench.
l1
l2
BL
Length, L Width, B l 1 l 2
Prototype 940 905 950 950
Half 410 405 220 220Fourth 228 224 100 60
Sixth 148 145 90 90
Figure 4.7- Set up dimensions and transducer lengths (mm) for diagonal tensile strength tests.

4 Masonry Assemblies and Tests
4-16
Plate 4.1- MMCG used for deformations measurements in the sixth scale.
Plate 4.2- Set up for sixth scale triplet and wallette specimens respectively.
Plate 4.3- Triplet specimens in the four scales.

4 Masonry Assemblies and Tests
4-17
Plate 4.4- Set up for prototype wallette.
Plate 4.5- Set up for prototype shear strength test.

4 Masonry Assemblies and Tests
4-18
Plate 4.6- Set up for sixth scale shear strength test.
Plate 4.7- Set up for prototype flexural strength test.
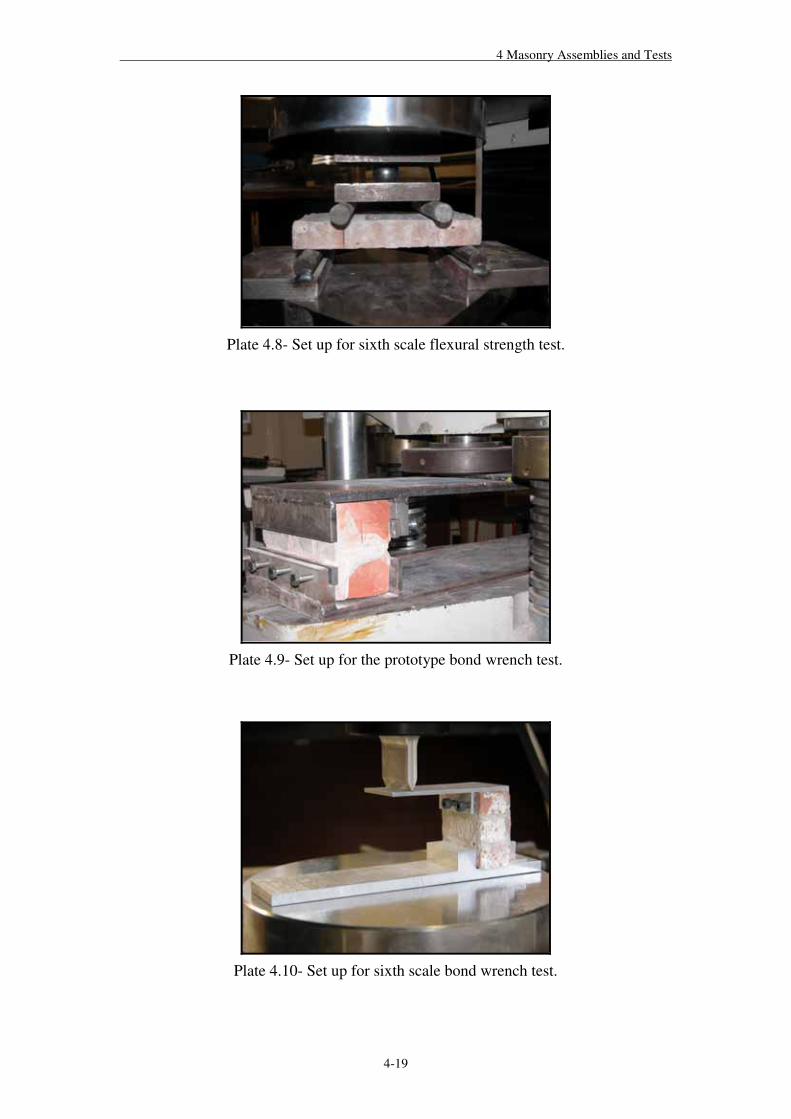
4 Masonry Assemblies and Tests
4-19
Plate 4.8- Set up for sixth scale flexural strength test.
Plate 4.9- Set up for the prototype bond wrench test.
Plate 4.10- Set up for sixth scale bond wrench test.

4 Masonry Assemblies and Tests
4-20
Plate 4.11- Wooden panel used for carrying the prototype diagonal tensile strength test specimens.
Plate 4.12- Set up for the prototype diagonal tensile strength test.

4 Masonry Assemblies and Tests
4-21
Plate 4.13- Set up for the half scale diagonal tensile strength test.
Plate 4.14- Set up for the sixth scale diagonal tensile strength test.

5 Masonry Tests at Different Scales, Results and Discussions
5-1
5 Masonry Tests at Different Scales Results and Discussions
In this chapter the results and discussion of the tests at different scales are presented
and discussed. Discussions also look at the size effect analysis of the test data with
respect to the two size effect laws; Size Effect Law, SEL and Multifractal Scaling
Laws, MFSL. In the identification system used for the tests, the first number denotes
the scale of the test followed by a letter denoting the type of test under consideration
(C- compressive strength test, S- shear strength test, F- flexural strength test, B- bond
strength test, D- diagonal tensile strength test) and the specimen number. For example
4D-A1 refers to the diagonal tensile strength test specimen 1 at the fourth scale.
5.1 Compressive test results
5.1.1 Triplets
5.1.1.1 Failure patterns
Plate 5.1 shows the typical failure patterns in the prototype triplets. The failure is
characterised by vertical splitting cracks, usually initiated from the sides of the
specimens and passing through the mortar bed. The failure is also sometimes
characterized by spalling off of the front face of the units prior to failure. Specimens
that have completely failed in the prototype tended to leave pyramidal shaped masses
on the platens. The failure mechanism and cracks are also similar in the half and
fourth scales with the typical tensile cracks at the sides of the specimens. Such
similarity in the failure patterns is also seen in Plate 5.2, which shows the typical
failure patterns in the sixth scale triplets. Therefore the failure mechanisms in the four
scales are similar with all the models showing the typical failure patterns evident in
the prototype.
5.1.1.2 Compressive strength
Most small scale masonry model tests to date have shown that the models are stronger
than the prototypes, as seen in Egermann et al(51). But current masonry theory
assumes that if the mechanical properties of the brick and mortar are similar then

5 Masonry Tests at Different Scales, Results and Discussions
5-2
there should not be a significant strength difference between models and prototype(16,
51).
Table 5.1 shows the summary of the triplet compressive strength test results and
Figure 5.1, shows the variation of the triplet compressive strength across the four
scales. It can be seen from the Figure 5.1 and Table 5.1, that even though there is an
increase of the compressive strength of masonry as the scale is reduced, there is wide
scatter in the results. There is a 20% increase in the mean triplet masonry strength
from prototype to half scale but this jumps to 150% in the fourth scale and drops to
120% in the sixth scale. Similar higher strengths at smaller scales have been seen in
earlier tests by Egermann et al(51) and Hughes and Kitching(52), in the latter study there
was a 84% increase in the masonry strength at sixth scale over the prototype for
standard triplets made with type III mortar. Despite the high fourth scale strength
results, the general trend as shown by the trend line in Figure 5.1 is for an increase in
compressive strength as the scale is reduced.
The results here suggest that the masonry strengths are similar in the half and
prototype scales on one hand and in the quarter and sixth scales on the other hand. As
explained in the case of the compressive strength of the units and as noted in
discussions from the tests carried to investigate the possible effect of strength
anisotropy in the units, it is possible that the trend in the similarity of the masonry
strength in the two sets of scales could also be due to anisotropy of the unit.
This behaviour could be due to the molecular structure of the clay compounds making
up the brick which usually consist of aluminosilicates sheets arranged parallel to each
other(122). The parallel arrangement of these molecules may explain the strength
differences seen in the bricks tested in the different orientations. Therefore some
degree of anisotropy may be exhibited by a clay brick due to its molecular make up. A
stronger factor could be the manufacturing process of extruded clay units in which the
plastic clay is forced through a die as discussed in Chapter 3. Jessop et al(25) have also
discussed the anisotropy of masonry with regards to their moduli properties, while
Shrive and Jessop(24) have reported on the anisotropy of extruded clay units with
respect to their strengths in orthogonal directions. But even this may not address the
big increase of masonry strength at the smaller scales. Because the masonry strengths
in the two smallest scales, that is the fourth and the sixth are more than twice the
5 Masonry Tests at Different Scales, Results and Discussions
5-3
strengths at prototype and half scales. While the average unit strengths difference in
the two sets of scales (fourth/sixth over prototype/half) is about 1.5.
In order to reduce the effect of the unit strength on the masonry strength, Figure 5.1 is
re-plotted with the masonry strength normalised with respect to their respective unit
strengths in Figure 5.2. This figure shows a reduced rate of increase of masonry
strength as the scale is reduced. This suggests there is still some additional factor that
is responsible for the high increase in strength, apart from the effect of unit strength
alone.
Studies of the fracture of brittle materials (mostly concrete) have shown that smaller
sized specimens have higher strengths than larger specimens(87). According to the
Griffith theory of brittle fracture, the less the surface area of a material the stronger it
is, since there is less probability of flaws occurring(13). Therefore this size effect seen
in testing brittle materials may also be one of the reasons for the strength differences.
But curiously there is little scale effect seen in the half scale results. This suggests a
possible interplay of two factors at the smallest scales; firstly a possible anisotropy
with respect to strength due to the manufacturing process of clay brick and secondly
the size effect phenomena.
For the brick under consideration here the half scale masonry strength shows very
good correspondence to the prototype. Such close half scale model to prototype
correspondence has been reported by Long et al (123) in testing grouted concrete block
masonry.
The fourth scale compared to the prototype shows the highest percentage increase in
strength, the reason for this is not clear. Even though the mean unit strength in the
fourth scale is more than that in the prototype, it still is less than the mean unit
strength in the sixth scale; nevertheless the fourth scale masonry strength is still the
highest of the four scales. So far only the influence of the brick material has been
discussed in relation to the masonry strength because its properties have the most
effect on the masonry assembly. But of course the behaviour of masonry is also
influenced by the mortar joint, because as stated by many authors the tensile stresses
that cause failure in the brick are due to the stresses induced by the mortar joint.
Again using the Griffith concept that smaller sized elements are stronger than larger
ones, it would be expected that thinner joint should be able to withstand higher

5 Masonry Tests at Different Scales, Results and Discussions
5-4
stresses than thicker ones; consequently the brick would be able to carry higher tensile
forces in masonry with a thinner joint. This has been corroborated by Porto et al(21)
who found that prototype masonry with thin layer joints (1.3mm) were 20% stronger
in compression than those with 12mm joints. This suggests that model masonry could
show a stronger compressive strength due to the thinness of their joints alone.
However this may be applicable to only the very small scales like the sixth and fourth
scales in this study, because as we seen from the results, the half scale strength is
similar to the prototype strength.
From Table 5.1 it can be seen that the mortar cube strengths for the tests are similar to
each other. The highest cube strength of 4.9N/mm2 was in the half scale test. This is
marginally higher than the mortar cube strength in the prototype test by about 6% and
fourth and sixth scale tests by about 4%. Therefore since the mortar strengths are
comparable to each other in the four scales the difference in masonry strengths seen
could be principally due to the unit properties and the size of the joints at the smallest
scales.
5.1.1.3 Stiffness
Figure 5.3 shows the stress/axial strain curves for the prototype triplets while the
summary of all the triplet test results is presented in Table 5.1. The curves reveal that
in two of the tests, the plots are similar, whereas in the third test there is some
variability. Unfortunately, because the deformation measurements could not be
continued until failure of the specimens, the peak behaviour of the specimens was not
captured. The transducers were removed before reaching of the peak loads so that
they were not damaged during the failure of the specimen. However, continuing the
measurements may not have shown much difference to the shape of the curve seen
here because of the way the specimens failed, which was usually quite sudden. One
problem encountered was that, even though two transducers were fixed (one each on
either face of a specimen) to measure the vertical deformations, only measurements
from one of the transducer was used because measurements from the other transducer
were erratic and were therefore not used for the analysis. This happened despite
having calibrated both transducers before the tests.
For the half scale tests, the complete stress strain measurements from a typical test are
shown in Figure 5.4. The figure shows the stress/strain curves from the front (top)
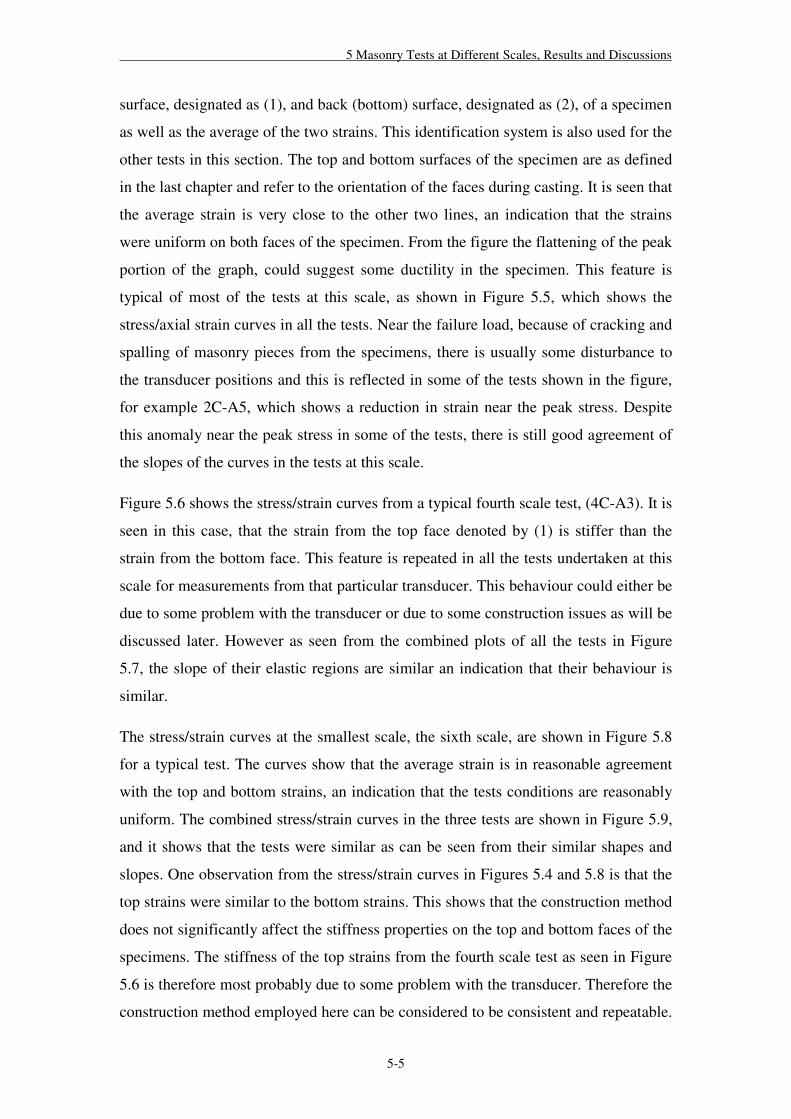
5 Masonry Tests at Different Scales, Results and Discussions
5-5
surface, designated as (1), and back (bottom) surface, designated as (2), of a specimen
as well as the average of the two strains. This identification system is also used for the
other tests in this section. The top and bottom surfaces of the specimen are as defined
in the last chapter and refer to the orientation of the faces during casting. It is seen that
the average strain is very close to the other two lines, an indication that the strains
were uniform on both faces of the specimen. From the figure the flattening of the peak
portion of the graph, could suggest some ductility in the specimen. This feature is
typical of most of the tests at this scale, as shown in Figure 5.5, which shows the
stress/axial strain curves in all the tests. Near the failure load, because of cracking and
spalling of masonry pieces from the specimens, there is usually some disturbance to
the transducer positions and this is reflected in some of the tests shown in the figure,
for example 2C-A5, which shows a reduction in strain near the peak stress. Despite
this anomaly near the peak stress in some of the tests, there is still good agreement of
the slopes of the curves in the tests at this scale.
Figure 5.6 shows the stress/strain curves from a typical fourth scale test, (4C-A3). It is
seen in this case, that the strain from the top face denoted by (1) is stiffer than the
strain from the bottom face. This feature is repeated in all the tests undertaken at this
scale for measurements from that particular transducer. This behaviour could either be
due to some problem with the transducer or due to some construction issues as will be
discussed later. However as seen from the combined plots of all the tests in Figure
5.7, the slope of their elastic regions are similar an indication that their behaviour is
similar.
The stress/strain curves at the smallest scale, the sixth scale, are shown in Figure 5.8
for a typical test. The curves show that the average strain is in reasonable agreement
with the top and bottom strains, an indication that the tests conditions are reasonably
uniform. The combined stress/strain curves in the three tests are shown in Figure 5.9,
and it shows that the tests were similar as can be seen from their similar shapes and
slopes. One observation from the stress/strain curves in Figures 5.4 and 5.8 is that the
top strains were similar to the bottom strains. This shows that the construction method
does not significantly affect the stiffness properties on the top and bottom faces of the
specimens. The stiffness of the top strains from the fourth scale test as seen in Figure
5.6 is therefore most probably due to some problem with the transducer. Therefore the
construction method employed here can be considered to be consistent and repeatable.

5 Masonry Tests at Different Scales, Results and Discussions
5-6
The concerns over the possible effects of the construction method on the top and
bottom faces of the specimens because of the different curing conditions on the
exposed top surface and the covered bottom surface have not materialised.
All the stiffness results are similar; the half and fourth scales stiffness were 6% and
2% more than the prototype stiffness, while the sixth scale stiffness was 9% more than
the prototype stiffness. Even though we have seen substantial variations with regards
to their strength properties their deformation properties are very similar. This is
further illustrated in Figure 5.10, a combined plot of stress/strain curves for the four
scales and in Figure 5.11, which shows the variation of stiffness of the masonry across
the four scales. It is seen from Figure 5.10 that the slope of their elastic region are
markedly similar. However results from other researchers(44, 51, 52) show a different
trend. Their results show that reduced scale masonry models are softer than prototype
by a factor approximately equal to the scale factor. This may be due to the manner in
which the models were constructed in our case which is different to the way the other
researchers made their specimens, that is, they all used conventional brick laying.
Because in conventional brick laying the light weight of model bricks subject the
mortar bed to a lower bedding stress than the heavier prototype bricks, as a result the
bed joints in the model scales are compacted to a lower degree during curing than the
bed joints in the prototype. Consequently the bed joints in scaled masonry models are
less compacted which could lead to a softer masonry response under compression.
Egermann et al(51) have suggested this as a possible reason for the softness of small
masonry models and it has also been reported by Mohammed and Hughes(97). By
comparing it to the stiffness of its constituents elements, it is seen that the average
stiffness of the masonry in the four scales; 5500N/mm2 in this case is about half of the
brick stiffness; 11500N/mm2 and roughly similar to the mortar stiffness (6300N/mm2
for prototype mortar and 6500N/mm2 for benchmark mortar) determined in Chapter
Three from Table 3.6. This shows the influence of mortar in determining the stiffness
properties of masonry.
5.1.2 Wallettes
5.1.2.1 Failure pattern
Typical failure patterns are shown in Plate 5.3 for the sixth wallettes. The failure
pattern in the prototype wallettes were also similar to the model wallettes,

5 Masonry Tests at Different Scales, Results and Discussions
5-7
characterised by vertical tensile splitting cracks at the sides and ends of the
specimens. The cracks usually radiated from within the units, above and below the
perpend joints at the ends. The cracks on the top surface of the specimens became
visible to the eye at around 70-75% of the peak load reached. Near the peak load,
there was also spalling of the surface of the units.
5.1.2.2 Compressive strength
Again it is seen from the summary of the compressive strength test results on the
wallette specimens in Table 5.2 and in Figure 5.12, which shows the variation of the
wallette strengths in the prototype and sixth scale, that the sixth scale compressive
strength is greater than the prototype compressive strength. The percentage increase in
masonry strength is 65% which is similar to the 64% increase in unit strength in the
two scales. This suggests that the wallette strength is mainly influenced by the unit
strength. This is better illustrated in Figure 5.13, which shows the variation of the
wallette strength normalised, with respect to their respective unit strength, plotted
against the scale. The figure seems to suggest that the difference in masonry strength
here may be mainly due to the influence of the unit strengths.
In the prototype tests, the wallette strength of 10.2N/mm2 is about 11% more than the
prototype triplet strength, while in the sixth scale tests; the wallette strength is 21%
less than the triplet strength. The reason for the difference in strength between the
prototype and model wallettes and triplets is not certain but could be contained within
the relatively higher COV of the model units over that of the prototype units as
previously discussed.
5.1.2.3 Stiffness
The position of the gauges for the wallette and sixth model tests are as shown in
Figure 5.14. Figure 5.15 shows a typical stress/axial strain curves for a prototype test.
This shows that there is good agreement in the four strains, an indication that the tests
conditions were uniform. This good correspondence in the axial strains is also seen in
the stress/lateral strain curves for the same test, Figure 5.16, which shows that the
curves are nearly identical. Figure 5.17 shows a summary of the axial and lateral
stress/strain curves from the prototype tests and reveals that there is good consistency
in the results.

5 Masonry Tests at Different Scales, Results and Discussions
5-8
For the sixth scale model tests, the stress/axial strain and stress/lateral strain figures
are shown in Figures 5.18 and 5.19. In this case, the curves are not as consistent as in
the prototype tests, nevertheless, the curves are similar. The summary of the axial and
lateral stress/strain curves for the sixth scale tests are shown in Figure 5.20, and they
show that curves have similar slopes in their elastic region which may be an
indication that the tests were consistent. They reveal a higher load carrying capacity
than the prototype tests; this can be seen from the comparison of typical stress/strain
curves of the two scales in Figure 5.21.
Figure 5.21 shows a good agreement in the stress/strain curves for the two scales. It is
seen that the slope of their elastic regions is quite similar. This shows that the sixth
scale model not only exhibits similar behaviour and failure patterns to the prototype, it
also models the deformation properties quite well. The curves also show the plasticity
of the wallette near its peak stress. This is different to what was seen in the triplets,
where the curves were characterized by a shorter plastic region. This may be due to
the presence of the perpend joints in the wallettes. The sixth scale model stiffness of
6800N/mm2 is about 20% stiffer than the prototype, which could be due to the
stronger model bricks. Figure 5.22 shows the variation of masonry wallette stiffness
with scale, from which the higher model scale stiffness is apparent. This is opposite to
the effect seen in the triplets, where there was no net increase or decrease in stiffness
across the four scales. The presence of the perpend joint in this case may have altered
the way the masonry behaves and this could result in the difference seen in the
stiffness.
The Poisson’s ratio of 0.19 for the model wallettes (which is three times more than
that for the prototype) makes it on the higher side possibly due to the constraints in
accurately placing the gauges because of the small specimen size.
By comparing the masonry stiffness in the prototype tests, it can be seen that the
triplet and wallette stiffnesses show a remarkable similarity. In fact they are exactly
the same at 5500N/mm2. While in the sixth model tests, the wallette stiffness is about
13% more than the triplet specimen. On the whole, the triplet tests do give a reliable
and quick way of determining masonry properties as suggested by Shrive(88) and
Edgell et al(124).

5 Masonry Tests at Different Scales, Results and Discussions
5-9
5.1.2.4 Characteristic strength of masonry
The characteristic compressive strength for the prototype wall and triplet specimens,
evaluated on the basis of Equation 4.2, yields 8.5N/mm2 and 7.7N/mm2 respectively.
These values were obtained by dividing the mean compressive strengths from Table
5.1 by a factor of 1.2 as prescribed by BS EN 1052-1(125).
In Eurocode 6(EC 6)(22), the characteristic strength for unreinforced masonry made
with general purpose mortar is given as Equation 2.1, whose evaluation is based on
the strength of the unit and mortar.
Using a K of 0.6 as given in EC 6 the characteristic compressive strength of the wall
and triplet specimens are 13.1 and 12.6 N/mm2 respectively. While using the formula
suggested by Khalaf and Hendry(126) for the calculation of the shape factor
(determined to be 0.74), the characteristic strength was found to be 12.0 N/mm2 for
the wall and 11.6 N/mm2 for the triplet specimens.
It can be seen that Equation 2.1, for determining the characteristic strength of
unreinforced masonry as given in EC 6, overestimates the value of the characteristic
strength as found from the test results and evaluated on the basis of BS EN 1052-1(89),
even though the formula is for use with masonry built in the conventional way. Since
characteristic strength should be less than the mean, calculations based on the EC 6
formula have overestimated the characteristic strength of the specimens here. This
may be significant for masonry that is prefabricated and cast in the horizontal plane as
in this case. Perhaps there may be need for further investigation in this area in order to
look at the applicability of formulae used for predicting masonry characteristic
strength built in the conventional way, for predicting the characteristic compressive
strength of prefabricated masonry panels cast horizontally.
5.1.2.5 Size effect analysis
The size effect analysis of the compressive strength data from the four scales is shown
in Figure 5.23. The log plot of nominal strength, in this case, the actual compressive
strength against the characteristic size, D (length of specimen), shows that the test
data approximately follows the size effect laws. The Multi Fractal Scaling Laws
(MFSL) agrees better with the data than the original Size Effect Law (SEL) of Bazant.
However as discussed in Chapter 2, the SEL is not intended for use with notch-less
specimens, rather Bazant’s other law, Equation 2.11, which is identical to the MFSL

5 Masonry Tests at Different Scales, Results and Discussions
5-10
should be used. The intention behind comparing the MFSL to the SEL was to see if
previous observations(72) that the MFSL agrees better with masonry data than the SEL,
will be repeated here or not. From the results, both Equation 2.11 of Bazant and the
MFSL agree with data more than the SEL. The graph reveals that there is a size effect
which is consistent with the sizes under consideration; as discussed with reference to
Figure 2.3 where most laboratory tests are shown not to exhibit a strong size effect. It
is therefore seen that size effect laws seem to be applicable to masonry as has been
suggested by Carpenteri(84) and Lourenco(72).
5.2 Shear test results
5.2.1 Failure mode
Typical failure of the prototype specimens is as shown in Plate 5.4, which shows a
failure plane through the mortar bed. In the model scale specimens the failure is
characterized by double shear lines; a failure line on either side of the middle brick.
The line of failure was mostly through the mortar bed and not at the mortar/unit
interface.
5.2.2 Initial shear strength and coefficient of internal friction
The initial shear strength is determined from the graph of the shear strength against
the precompression stress as the intercept of the best fit line on the appropriate axis.
The plot of the shear stress/precompression stress for the prototype test is shown in
Figure 5.24, it reveals a similar degree of scatter in the shear strength results at the
three levels of precompression stress. This may imply that the test conditions were
uniform and consistent. However the shear stress/precompression stress plot for the
half scale test in Figure 5.25 shows a different trend; it shows a similar degree of
scatter in the shear strength result at precompression stress levels of 0.2N/mm2 and
0.6N/mm2 and a much narrower scatter in the shear strength results at 1.0N/mm2. This
could be either due to the natural material variability in specimens or deviations in the
boundary condition to achieve minimum bending in the specimen, as reported by
Jukes and Riddington(30), the degree of bending in the triplet test has a significant
effect on the shear strength. The shear stress/precompression plot for the fourth scale
in Figure 5.26 and sixth scale in Figure 5.27, respectively, also reveal this dissimilar
scatter in the shear strengths recorded at the three levels of precompression. However
the plot for the sixth scale test, as seen in Figure 5.27, shows a greater consistency
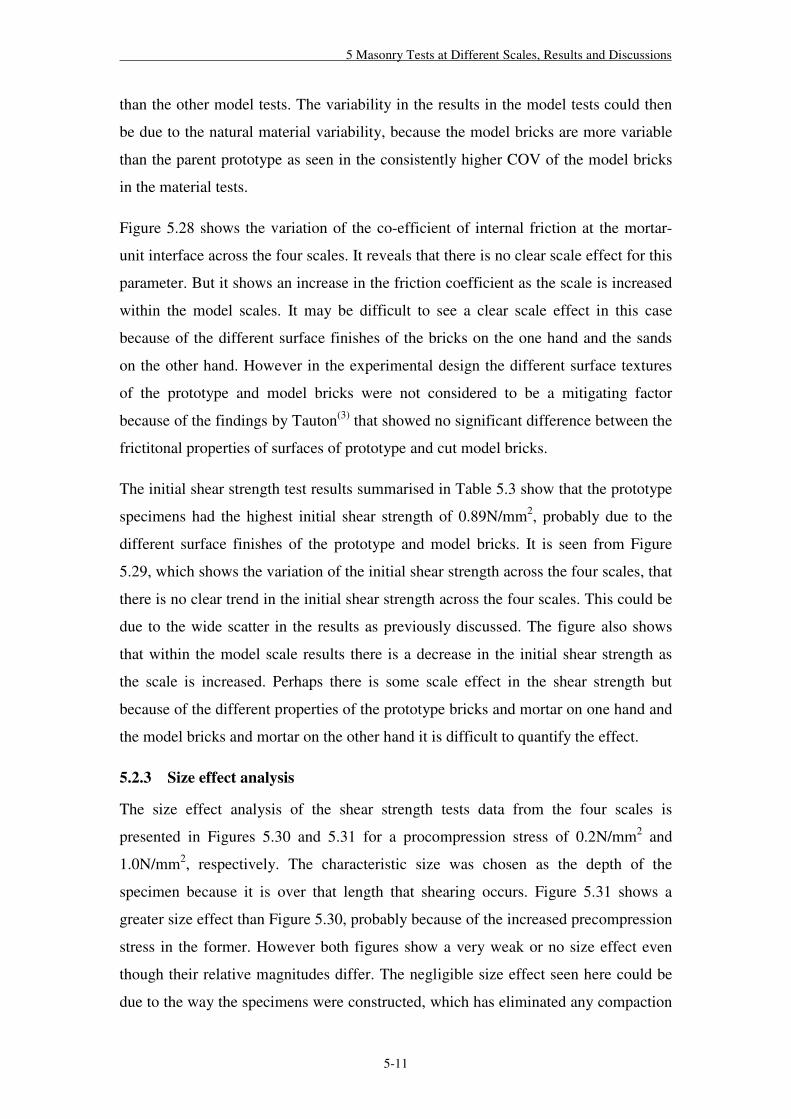
5 Masonry Tests at Different Scales, Results and Discussions
5-11
than the other model tests. The variability in the results in the model tests could then
be due to the natural material variability, because the model bricks are more variable
than the parent prototype as seen in the consistently higher COV of the model bricks
in the material tests.
Figure 5.28 shows the variation of the co-efficient of internal friction at the mortar-
unit interface across the four scales. It reveals that there is no clear scale effect for this
parameter. But it shows an increase in the friction coefficient as the scale is increased
within the model scales. It may be difficult to see a clear scale effect in this case
because of the different surface finishes of the bricks on the one hand and the sands
on the other hand. However in the experimental design the different surface textures
of the prototype and model bricks were not considered to be a mitigating factor
because of the findings by Tauton(3) that showed no significant difference between the
frictitonal properties of surfaces of prototype and cut model bricks.
The initial shear strength test results summarised in Table 5.3 show that the prototype
specimens had the highest initial shear strength of 0.89N/mm2, probably due to the
different surface finishes of the prototype and model bricks. It is seen from Figure
5.29, which shows the variation of the initial shear strength across the four scales, that
there is no clear trend in the initial shear strength across the four scales. This could be
due to the wide scatter in the results as previously discussed. The figure also shows
that within the model scale results there is a decrease in the initial shear strength as
the scale is increased. Perhaps there is some scale effect in the shear strength but
because of the different properties of the prototype bricks and mortar on one hand and
the model bricks and mortar on the other hand it is difficult to quantify the effect.
5.2.3 Size effect analysis
The size effect analysis of the shear strength tests data from the four scales is
presented in Figures 5.30 and 5.31 for a procompression stress of 0.2N/mm2 and
1.0N/mm2, respectively. The characteristic size was chosen as the depth of the
specimen because it is over that length that shearing occurs. Figure 5.31 shows a
greater size effect than Figure 5.30, probably because of the increased precompression
stress in the former. However both figures show a very weak or no size effect even
though their relative magnitudes differ. The negligible size effect seen here could be
due to the way the specimens were constructed, which has eliminated any compaction

5 Masonry Tests at Different Scales, Results and Discussions
5-12
of the bed joint during curing. It has been discussed that the nature of masonry bond is
more mechanical than chemical in nature; therefore any factor that would increase
interaction between the joints and bricks (like greater compaction) could affect the
nature of the bond. If this is case, then it is perhaps not unexpected that the size effect
seen here is negligible. The trend in the figures however agrees with the suggestion in
the size effect plot in Figure 2.3 that structures with relatively small values of the
characteristic structural size, D should not exhibit a strong size effect.
In Figure 5.30 it is seen that the MFSL agrees better with the test data than the SEL as
stated in the case of the compressive strength test. While in Figure 5.31, maybe
because of the higher precompression stress, both the SEL and the MFSL are in close
agreement.
5.3 Flexural test results
5.3.1 Flexural strength normal to bed joints
Failure of the flexural strength test normal to the bed joints in the prototype specimens
was always in between the loading rollers and in the third or fourth joint from either
support. Plate 5.5 shows typical failures in the half scale specimens, where failure was
mostly through the fourth joint from either support but there were cases of two failure
lines as well, all between the loading rollers. In the fourth scale, failure was usually in
the fourth or fifth joint from either support with one case of failure in the fifth and
second joints from a support. However, that test was still considered because the fifth
joint failure is between the loading rollers. Plate 5.6 shows typical failure in the sixth
scale specimens, where failure was usually in the fourth or fifth joint from either
support.
A summary of the flexural strength normal to bed joint test results is shown in Table
5.4 and Figure 5.32, which shows the variation of the mean flexural strength normal
to the bed joint. It is seen from the figure and table that there is no well defined trend
in the flexural strength. Since the surface texture of the bricks has a significant
influence on the flexural strength(94), it is therefore possible that there will be some
degree of variability in the results because of the different surface textures of the
prototype and model bricks as well as due to the different sand gradings in the model
and prototype mortars.

5 Masonry Tests at Different Scales, Results and Discussions
5-13
5.3.2 Flexural strength parallel to bed joint
In the case of the flexural strength test parallel to the bed joints, for the prototype
specimens, the failure line was mostly straight passing through a combination of joints
and units. Plate 5.7 shows a typical failure in the prototype tests. This failure pattern
was seen in most of the model scale tests except for the sixth scale, where there were
also cases of joint rotation. In this case the failure lines were always through the joints
(through the perpend and bed joints in a zigzag manner). As observed previously, the
first type of failure is limited by the modulus of rupture of the units and is an
indication of strong bond between the units and mortar while the second type of
failure is governed by the shear strength of the mortar/unit interface and it suggest a
less strong bond between the units and mortar. If this suggestion is correct, the
flexural bond strength parallel to the bed joints would be weaker in the sixth scale.
A summary of the flexural strength parallel to the bed joints is provided in Table 5.5.
It is seen from the Table and in Figure 5.33, which shows the variation of the flexural
strength across the scales, that there is an indication of a trend in the mean flexural
strength parallel to the bed joint. The figure shows that there is a slight decrease in the
mean flexural strength parallel to the bed joint as the scale is reduced; in this case the
modulus of rupture of the units is likely to have had a major influence on the flexural
strength. This can be seen in Figure 5.34, which shows that there is direct relationship
between the flexural strength parallel to the bed joint and the modulus of rupture of
the units. The modulus of rupture of the prototype and model scale units is about
twice the flexural strength parallel to the bed joint. It also seen that the sixth scale
flexural strength is the lowest of the four scales, this collaborates the earlier
suggestion made on the mode of failure in the sixth scale, which is characterised by
cracking through the bed and perpend joints suggesting a possible low bond strength.
In terms of the relationship between the flexural strengths in the orthogonal directions
as shown in Figure 5.35, it is seen that the flexural strength parallel to the bed joint is
about 4.0 times more than the flexural strength normal to the bed joints in the
prototype and sixth scale while this ratio is about 2.0 in the fourth scale and five in the
half scale. Figure 5.36 shows the orthogonal ratio against the flexural strength normal
to the bed joints, and it reveals the general trend reported in the literature(19), that the

5 Masonry Tests at Different Scales, Results and Discussions
5-14
orthogonal ratio decreases markedly with increase in the flexural strength normal to
the bed joint.
5.3.3 Size effect analysis
Figures 5.37 and 5.38 show the logarithmic plot of the nominal strength (actual
flexural strength) against the specimen depth for the flexural strength normal to the
bed joints and the flexural strength parallel to the bed joints respectively. They both
show that there is little or no noticeable size effect as seen in the case of the shear
strength test. In the plot of the flexural strength normal to the bed joints, the MFSL
agrees with the test data better than the SEL while in the graph of the flexural strength
parallel to the bed joints, both of the laws agree with the test data. It may be because
the latter failure is usually governed by the tensile strength of the unit (for failures
through unit and perpend joints) for which the mechanics of the failure is different to
the former, and therefore the crack propagation process agrees somewhat with the
SEL. The trend seen in Figure 5.37 is different to the findings of Lourenco(58), who
found that there is a strong size effect in the flexural strength normal to bed joint,
characterised by a marked decrease in flexural strength as the specimen depth was
increased. This could be due to the range of characteristic structure size D (specimen
depth) used in his tests which is in the range of 100-300mm while the range in this
study is 10.8-65mm. This suggests that the threshold structure size beyond which size
effect becomes manifest may not have been reached in this study, because as seen
from Figure 2.3 for small sizes of the D the strength criterion shows no apparent size
effect. Size effect only becomes manifest beyond a threshold value of D that follows
the size effect laws. This may be the reason for the suggestion by fracture
mechanicians for the incorporation of size effect laws in design codes to guide in the
extrapolation of the strength of real size structures from laboratory specimens.
Presently design calculations are based on small specimen tests in laboratories without
any extrapolations to determine the strength for real size structures, which could lead
to over predicting the actual strength of a structure. However the dead load factor used
in the codes compensates for this and therefore most designs are deemed to be safe
according to Bazant(127).

5 Masonry Tests at Different Scales, Results and Discussions
5-15
5.4 Bond test results
5.4.1 Failure mode
The failure pattern in most of the cases in both prototype and model specimens was
characterised by a clean failure plane between the brick and mortar. But there were
also cases of a “rough” failure face characterised by a failure line through the mortar
joint.
5.4.2 Bond strength
The results of the bond strength tests in the four scales are summarised in Table 5.6
and shown graphically in Figure 5.39, which shows the variation of the bond strength
across the four scales. From this figure it is seen that there is no clear trend in the
bond strength across the four scales, but there seems to be a gradual increase in bond
strength as the scale is increased. However the validity of this trend is distorted by the
relatively higher mortar cube strength in the half scale test over that of the fourth and
sixth scale tests; the mortar cube strength in the half scale test is about 20% higher
than those of the fourth and sixth scale tests. Since the bond strength in known to
increase with mortar strength perhaps the higher bond strength in the half scale test
may be due to the higher mortar strength in the test. But since the nature of the
mechanical bond in masonry has been suggested to be due to the mechanical
interlocking of the hydration products transferred into the surface pores of the unit, it
may be that the surface finish of the units and the different sand gradings of model
and prototype mortars may be more important in influencing the bond strength.
Anderson and Held(15) have suggested that mortars having sands with fine gradings
usually result in masonry with lower bond strength. This would mean that model tests
would all have lower bond strength than the prototype test. Since this is not the case
here, it may be that the scale of the tests or different surface finish of the model and
prototype bricks may have resulted in the lack of clear trend seen in the results.
5.4.3 Bond strength test compared to flexural strength test
Figure 5.40 shows the relationship between the flexural strength normal to the bed
joints and the bond strength test. It is seen from the figure that there is no clear
relationship because of the wide scatter in the results. If the trend line were fixed to
pass through the origin it gives a relation in which the mean flexural strength is half
the mean bond strength. Both of the methods measure only the bond strength in

5 Masonry Tests at Different Scales, Results and Discussions
5-16
relation to out-of-plane failure by bending but the flexural strength test results are
higher because of the influence of the normal stresses which have been neglected in
the case of the bond strength. The ratio of the bond strength to the flexural strength in
the prototype, half, fourth and sixth scales are 2.1, 3.0, 1.2 and 2.4 respectively.
5.4.4 Size effect analysis
The size effect analysis of the bond strength test results is shown in Figure 5.41. It
shows that there is no noticeable change in the nominal strength of the specimens as
their characteristic size (specimen width) is increased. This agrees with the effect seen
in the shear strength and flexural strength tests. Again it is seen that the MFSL agrees
with the test data better than the SEL.
5.5 Diagonal tensile test results
5.5.1 Failure mode
Typical failure of most specimens was by a shear failure in the direction of loading.
The failure line usually passing through the joints in a zigzag manner whist passing
through some units. Plate 5.8 shows a typical failure pattern in the half scale
specimen. Occasionally there were cases of bond failure in addition to the usual shear
failure as shown in Plate 5.9, which shows one of such cases in a sixth scale test. Most
of the failures in the prototype, half scale and fourth scale were abrupt and sudden.
While in the sixth scale most of the failures were more gradual with a few cases of
sudden failures.
5.5.2 Diagonal tensile strength
A summary of the shear strength from the diagonal tensile strength tests is shown in
Table 5.7 and the variation of the shear strength in the four scales is shown in Figure
5.42. They show that the sixth scale test has the lowest shear strength of 0.63N/mm2
and also the least COV among the model scale tests. While the fourth scale test
provided the highest shear strength of 0.96N/mm2 and also the highest COV in all the
scales. As a result of this lack of a clear trend, there is no net decrease or increase in
shear strength across the four scales as shown in the figure. This is also similar to the
effect seen in the initial shear strength test of masonry, which also showed no increase
or decrease in the initial shear strength across the four scales. The initial shear
strength in the sixth scale agrees closely with the shear strength obtained here, which

5 Masonry Tests at Different Scales, Results and Discussions
5-17
is also the case in the prototype test. For the prototype scale the shear strength
obtained here is about 2% higher than the initial shear strength while in the case of the
sixth scale, it is about 5% higher than the initial shear strength. But in the half and
fourth scale tests, the percentage increase is about 280% and 192% respectively. The
lack of a clear trend in the results could be due to the different surface textures of the
units as well as the different properties of the prototype and benchmark mortars.
5.5.3 Stiffness
The shear stress/axial strain curves for a typical prototype specimen are shown in
Figure 5.43. The deformation measurements from the top transducer designated as (1)
was from the upward surface of the specimen as cast horizontally, while the
deformation measurements from the bottom transducer designated as (2) was from the
downward surface. The bottom strains show a stiffer response than the top strain. This
could be due to some bending effect during the actual test, even though every care
was taken to position the specimens as plumb as possible. The stress/lateral strain
curves shown in Figure 5.44 are more similar to each other than the previous curves
for the axial strain. However the summary of the shear stress/strain curves, which are
shown in Figures 5.45 and 5.46 for axial strain and lateral strain in all the prototype
tests reveal that the shear behaviour of the specimens is very similar as can be seen
from the correspondence in their slopes. In one of the tests, 1D- A2, the failure stress
is much lower than the other two. This could be due to a very fine crack along one the
bed joints visible prior to testing. The abrupt nature of the failure as stated earlier, can
be seen from the shape of graph, which is almost a straight line with no plasticity.
In the half scale test, the stress/strain curves shown for a typical test in Figures 5.47
and 5.48 for the axial and lateral strain respectively reveal a better correspondence of
the curves in this test. This could be an indication that construction and test conditions
were uniform. Figures 5.49 and 5.50 show the stress/strain relationship in the axial
and lateral direction for the half scale specimens and indicate that some of the curves
have abnormal shapes. This is usually due to disruption to the gauge positions caused
by cracking etc. Nevertheless it can still be seen from the figures that the half scale
specimen showed a softer response than the prototype.
Figures 5.51 and 5.52 show the shear stress/strain behaviour in a particular test in the
axial and lateral directions respectively for the fourth scale test. It is again seen that,

5 Masonry Tests at Different Scales, Results and Discussions
5-18
as in the case of the prototype tests, the bottom strains are stiffer than the top strains.
The variability in the results at this scale can be seen from the differences in the shape
of the stress/strain curves in the axial direction in Figure 5.53. Surprisingly the strain
in the lateral direction for the same tests in Figure 5.54 shows a much better
correspondence. It may be that the different configurations of the units/joint in the
axial and lateral directions bring about different behaviour under load.
In the sixth scale it is seen that there is a much better agreement of the stress/strain
relationship in both the axial and lateral directions for the test shown in Figures 5.55
and 5.56 respectively. It is seen from the figures that there is very good
correspondence in the top and bottom strains in the axial direction while they are not
so dissimilar in the lateral direction. This feature is also repeated in the other tests at
this scale, as can be seen from the good agreement of the stress/strain curves in both
axial and lateral directions for the tests in Figures 5.57 and 5.58 respectively. The
curves also reveal the more plastic response of the specimens under load. This
behaviour is significant because of the numerous model scale shaking table studies
that have been made in relation to the dynamic behaviour of masonry in earthquake
regions. Because as seen here, a ductile model scale masonry response may not
necessarily mean the same behaviour in a prototype.
A comparison of the stress/strain curves for all the scales is shown in Figure 5.59 for
the axial direction and Figure 5.60 for the lateral direction. It is seen from the curves
for the axial strain that their slopes in the elastic region, at about a third of the
maximum stress reached, are similar. The close agreement of the curves is even more
apparent in the case of the lateral strain. The discussion that has just proceeded
regarding the more plastic response of the sixth scale is more apparent in the figures.
While in the other scales failure was abrupt, in the sixth scale it can be seen that there
is evidence of a more ductile and plastic response near the peak stress.
5.5.4 Size effect analysis
The size effect analysis of the diagonal tensile strength test data is shown in Figure
5.61. It shows, as seen in the case of the other tests, that except for the compressive
strength test, there is no size effect seen when the limiting failure condition is the
bond/shear characteristic of the masonry. Again it is seen that the MFSL agrees better
with the test data than the SEL, although only a slight improvement.

5 Masonry Tests at Different Scales, Results and Discussions
5-19
5.6 Conclusions
The results of the masonry tests at different scales has shown that the strength of
masonry triplet in compression was higher than the prototype in the fourth and sixth
model scales but the similar to the prototype in the half scale. The same pattern was
also repeated in the tests of the unit strengths, therefore indicating the strong influence
of the unit in determining the masonry properties. There is evidence of anisotropy of
strength in clay brick masonry possibly due to the manufacturing process of extruded
clay units which therefore makes the direction of loading on a cut model brick
important.
In terms of the wallette compressive strength, it was found that the sixth scale wallette
strength is 64% more than the prototype wallette strength. This percentage increase is
identical to the percentage increase between sixth scale and prototype unit strengths.
Therefore is seems that in the case of the wallette compressive strength, the increase
in the strength of the model test could be attributed to the stronger unit strength in the
model scale.
It can then be suggested that the increase in model unit strength, could be attributed to
two factors, namely; strength anisotropy and the energetic size effect in quasi-brittle
materials. The compressive strength test data was also found to closely follow the size
effect laws of fracture mechanics (MFSL and SEL) and shows a noticeable size effect
with increase in scale, characterised by a decrease in the nominal strength with
increase in scale.
It was found that triplet stiffnesses in the four scales were identical to each other and
no scale effect was observed. The prototype masonry and model stiffness were in
good agreement with the prototype and model mortar stiffness respectively. This may
be attributed to the way the specimens were constructed, which has effectively
cancelled any differential compaction of the joints due to the different weight of the
unit bricks in the various scales. The good agreement in the stiffness of the four scales
may be evidence of the importance of the mortar bed in determining the stiffness
properties of masonry. This finding is very significant bearing in mind that model
tests by other researchers showed a much softer model response to the prototype
under axial compression.

5 Masonry Tests at Different Scales, Results and Discussions
5-20
The EC 6 empirical formula for the unreinforced characteristic strength of masonry
overestimates the wallette and triplet characteristic strength evaluated on the basis of
the tests by more than 50%. But there is need for further research to confirm this
because the implications could be important in situations were masonry is constructed
horizontally like in prefabricated and cast masonry panels.
In the initial shear strength test, there is no clear evidence of an increase in either the
coefficient of friction or the initial shear strength as the scale was increased but within
the model scales there seems to be an increase in the coefficient of friction and a
decrease in the initial shear strength as the scale was increased. This suggests a
possible scale effect within the model scales but it is difficult to conclude.
Both the flexural strength normal to the bed joint and parallel to the bed joint shows
no clear effect of scale. But there is a slight increase in the flexural strength parallel to
the bed joints as the scale was increased, perhaps because it is significantly influenced
by the tensile strength of the units.
The bond strength test shows a possible increase in strength as the scale was increased
within the model scales, but there is no clear trend across the four scales. This could
be due to the different surface finishes on the model and prototype units on one hand
and different sand gradings of the model and prototype mortars on the other hand.
The same lack of clear trend is also seen in the diagonal tensile strength tests, which
shows there is no increase or decrease in the shear strength as the scale was increased.
The stress/strain relationship showed that the sixth scale had a more plastic response
than the other scales, characterised by a gradual and more restrained failure which is
different to failure in all the other three scales, most especially the prototype tests.
This may be significant in shaking table model tests that are used to simulate seismic
effects on masonry, in that, a softer model response may not necessarily suggest
similar behaviour at prototype scale.
The size effect analysis for the initial shear strength test, flexural strength tests, bond
strength tests and diagonal shear strength tests shows no significant size effect in all
these tests. This may be due to the general scale of the specimens in this study,
because as suggested by Figure 2.3 most laboratory tests should not exhibit a strong

5 Masonry Tests at Different Scales, Results and Discussions
5-21
effect since they are in strength failure criterion range; which implies no size effect is
seen. Generally the MFSL agreed better with the test data than with the SEL
It appears therefore, that the prototype compressive strength of masonry could be
predicted through model tests more easily than the other strength properties. This may
be because masonry compressive strength is mainly influenced by the unit
compressive strength and thus prototypes and models with similar unit compressive
strength should have similar masonry strength and vice versa. Hence masonry models
of down to sixth scale could be used to predict prototype masonry compressive
strength by taking into account the difference in unit compressive strength between
models and prototypes. But in order to predict stiffness properties from models the
effect of the weight of the units should be considered, because while setting, the
mortar bed in a model are at a lower stress state than in a prototype. Consideration
should also be made about the instrumentation for deformation measurements since
the smallest scales may require specially made gauges.
The support conditions in the initial shear strength test are the most important
considerations for a model test. Because of the size of the specimens in model tests,
achieving the boundary conditions for minimum bending in the specimens may be
challenging, and since achieving minimum bending is a perquisite for the validity of
the Coulomb criterion, the initial shear strength test may be better suited for half scale
and higher scales, where it is easier to achieve those boundary conditions.
The flexural strength test bond strength and diagonal tensile strength tests at model
scales appear not to pose significant challenges with regards to actual test set up but
rather with regard to the inherent properties of the constituent materials, for example
the fine grading of the sand in the model tests could result in lower bond strength.
Thus for modelling the bond strength of prototypes it is better to choose a scale that
will not require using a fine grading of sand because of the size limitations of the
joints. Therefore bond strength tests are best carried out on models that have similar
gradings of sands to the prototype as well as similar surface finish of units.

5 Masonry Tests at Different Scales, Results and Discussions
5-22
Mortar Bed thickness Compressive COV Stiffness COV Mortar Cube
Scale Type mm Strength,N/mm2% N/mm2
% Strength,N/mm2
Prototype MP-iii 10.0 9.2 10.8 5500 22.6 4.6
Half M95-iii 5.0 11.0 9.1 5200 26.9 4.9
Fourth " 2.5 23.0 9.1 5400 6.6 4.7
Sixth " 1.6 20.3 11.6 6000 20.1 4.7
Table 5.1- Summary of triplet masonry compression test results in the four scales.
Mortar Compressive COV Stiffness COV Poisson's Mortar Cube
Scale Type Strength,N/mm2% N/mm2
% Ratio Strength,N/mm2
Prototype MP-iii 10.2 2.7 5500 8.1 0.06 5.3
Sixth M95-iii 16.8 5.4 6800 21.4 0.19 3.7
Table 5.2- Summary of wallette masonry compression test results in prototype and sixth scale.
Mortar Type Initial Shear Co-efficient Mortar Cube
Scale Strength,N/mm2of friction Strength,N/mm2
Prototype MP-iii 0.89 1.17 3.6Half M95-iii 0.27 1.76 6.6Fourth " 0.50 1.19 4.7Sixth " 0.60 0.85 5.5
Table 5.3 –Summary of masonry shear strength test results in the four scales.
Flexural Strength Normal COV Mortar Cube
Scale to Bed Joint,N/mm2% Strength,N/mm2
Prototype 0.54 33.9 6.5Half 0.46 21.7 6.3Fourth 0.86 18.6 5.1Sixth 0.32 20.6 4.8
Table 5.4- Summary of masonry flexural strength normal to bed joints test results in the four scales.
Flexural Strength Parallel COV Mortar Cube
Scale to Bed Joint,N/mm2% Strength N/mm2
Prototype 1.91 20.5 6.1Half 2.01 5.2 5.4Fourth 1.72 14.6 5.7Sixth 1.26 31.2 4.8
Table 5.5- Summary of masonry flexural strength parallel to bed joints test results in the four scales.

5 Masonry Tests at Different Scales, Results and Discussions
5-23
Bond Strength COV Mortar Cube
Scale N/mm2% Strength,N/mm2
Prototype 1.00 17.3 4.3Half 1.27 31.6 4.3Fourth 0.99 22.0 3.5Sixth 0.73 28.1 3.6
Table 5.6- Summary of bond strength test results in the four scales.
Shear Strength COV Mortar Cube
Scale N/mm2% Strength,N/mm2
Prototype 0.91 0.41 3.92Half 0.76 11.09 3.95Fourth 0.96 37.63 4.47Sixth 0.63 7.24 4.06
Table 5.7- Summary of diagonal tensile strength test results in the four scales.

5 Masonry Tests at Different Scales, Results and Discussions
5-24
0
6
12
18
24
30
0 0.2 0.4 0.6 0.8 1 1.2
Scale
Com
pres
sive
Str
engt
h N
/mm
2
Figure 5.1- Triplet compressive strength in the four scales.
0
0.1
0.2
0.3
0.4
0.5
0.6
0 0.2 0.4 0.6 0.8 1 1.2
Scale
Nor
mal
ised
Str
engt
h
Figure 5.2- Normalised triplet compressive strength across the four scales.
0
5
10
15
20
25
0 0.005 0.01 0.015 0.02 0.025
Axial Strain
Com
pres
sive
Str
ess,
N/m
m2
1C-A3
1C-A4
1C-A5
Figure 5.3- Summary of stress/axial strain curves for prototype masonry triplet tests.

5 Masonry Tests at Different Scales, Results and Discussions
5-25
0
5
10
15
20
25
0 0.005 0.01 0.015 0.02 0.025 Axial Strain
Com
pres
sive
Str
ess,
N/m
m2
1
2
Average
Figure 5.4- Typical stress/axial strain curves for half scale masonry triplets,
test 2C-A2.
0
5
10
15
20
25
0 0.005 0.01 0.015 0.02 0.025
Average Axial Strain
Com
pres
sive
Sre
ss,N
/mm
2
2C-A1
2C-A2
2C-A3
2C-A4
2C-A5
Figure 5.5- Summary of stress/axial strain curves in all half scale masonry triplet tests.
0
5
10
15
20
25
0 0.005 0.01 0.015 0.02 0.025
Axial Strain
Com
pres
sive
Str
ess,
N/m
m2
1
2Average
Figure 5.6 – Typical stress/axial strain curves for fourth scale masonry triplets,
test 4C-A3.

5 Masonry Tests at Different Scales, Results and Discussions
5-26
0
5
10
15
20
25
0 0.005 0.01 0.015 0.02 0.025
Average Axial Strain
Com
pres
sive
Str
ess,
N/m
m2
4C-A1
4C-A2
4C-A3
Figure 5.7- Summary of stress/axial strain curves for fourth scale masonry triplet
tests.
0
5
10
15
20
25
0 0.005 0.01 0.015 0.02 0.025
Axial Strain
Com
pres
sive
Str
ess,
N/m
m2
1
2Average
Figure 5.8- Typical stress/strain curves for sixth scale masonry triplets, test 6C-B4.
0
5
10
15
20
25
0 0.005 0.01 0.015 0.02 0.025
Average Axial S train
Com
pre
ssiv
e S
tres
s,N
/mm
2
6C-B1
6C-B3
6C-B4
Figure 5.9- Summary of stress/axial stain curves for sixth scale masonry triplet tests.

5 Masonry Tests at Different Scales, Results and Discussions
5-27
0
5
10
15
20
25
0 0.005 0.01 0.015 0.02 0.025
Average Axial S train
Com
pre
ssiv
e S
tres
s, N
/mm
2
1C-A32C-A24C-A36C-B1
Figure 5.10- Stress/strain curves for selected triplet tests across the four scales.
0
2000
4000
6000
8000
0 0.2 0.4 0.6 0.8 1 1.2
Scale
Stif
fnes
s, N
/mm
2
Figure 5.11- Stiffness of masonry triplets in the four scales.
0
5
10
15
20
0 0.2 0.4 0.6 0.8 1 1.2
Scale
Com
pres
sive
Str
engt
h, N
/mm
2
Figure 5.12- Comparison of prototype and sixth scale wallette compressive strength.

5 Masonry Tests at Different Scales, Results and Discussions
5-28
0.30
0.32
0.34
0.36
0.38
0 0.2 0.4 0.6 0.8 1 1.2
Scale
Nor
mal
ised
Str
engt
h
Figure 5.13- Comparison of normalised prototype and sixth scale wallette strength.
1 2
3
Top face when casting
4 5
6
Bottom face when casting
Figure 5.14- Position of transducers in prototype and sixth scale wallettes.
0
5
10
15
20
0 0.002 0.004 0.006 0.008
Axial Strain
Com
pres
sive
Str
ess,
N/m
m2
1 42 5Average
Figure 5.15- Typical stress/axial strain curves for transducer 1, 2, 4, 5 and their
average strain as shown in Figure 5.14, prototype test 1C-B1.

5 Masonry Tests at Different Scales, Results and Discussions
5-29
0
5
10
15
20
-0.008 -0.007 -0.006 -0.005 -0.004 -0.003 -0.002 -0.001 0
Lateral Strain
Com
pres
sive
Str
ess,
N/m
m2
36Average
Figure 5.16- Typical stress/lateral strain curves for transducer 3, 6, and their average
strain as shown Figure 5.14, prototype test 1C-B1.
0
5
10
15
20
-0.008 -0.006 -0.004 -0.002 0 0.002 0.004 0.006 0.008
Average Strain
Com
pres
sive
Str
ess,
N/m
m2
1C-B1
1C-B2
1C-B3
Figure 5.17- Summary of stress/strain curves in prototype masonry wallette tests.
0
5
10
15
20
0 0.002 0.004 0.006 0.008
Axial Strain
Com
pres
sive
Str
ess,
N/m
m2
1245Average
Figure 5.18- Typical stress/axial curves for sixth scale wallette for MMCG’s 1, 2, 4
and 5 as shown in Figure 5.14, test 6C-I1.

5 Masonry Tests at Different Scales, Results and Discussions
5-30
0
5
10
15
20
-0.008 -0.006 -0.004 -0.002 0
Lateral Strain
Com
pres
sive
Str
ess
N/m
m2
36Average
Figure 5.19- Typical stress/strain curves for sixth scale wallette for transducers 3 and
6 as shown in Figure 5.14, test 6C-I1.
02468
101214161820
-0.008 -0.006 -0.004 -0.002 0 0.002 0.004 0.006 0.008
Average Strain
Com
pres
sive
Str
ess,
N/m
m2
6C-I1
6C-I2
6C-I3
6C-I4
Figure 5.20- Summary of stress/strain curves for sixth scale wallette masonry tests.
0
5
10
15
20
-0.008 -0.006 -0.004 -0.002 0 0.002 0.004 0.006 0.008
Average Strain
Com
pres
sive
Str
ess,
N/m
m2
6C-I4
1C-B1
Figure 5.21- Typical stress/strain curves for prototype and sixth scale wallette
specimens, tests 1C-B1 and 6C-I4.

5 Masonry Tests at Different Scales, Results and Discussions
5-31
0
3000
6000
9000
0 0.2 0.4 0.6 0.8 1 1.2
Scale
Stif
fnes
s, N
/mm
2
Figure 5.22- Variation of wallette stiffness with scale in prototype and sixth scale
tests.
1
10
100
10 100 1000
LogD
Nom
inal
Str
engt
h, L
og
N
Test
Size effect Law
MFSL
D
Figure 5.23- Size effect analysis of masonry compressive strength triplet test results.
0
0.5
1
1.5
2
2.5
0 0.2 0.4 0.6 0.8 1 1.2
Precompression Stress, N/mm2
Shea
r St
reng
th, N
/mm
2
Figure 5.24- Shear stress/precompression stress relationship for prototype specimens.

5 Masonry Tests at Different Scales, Results and Discussions
5-32
0
0.5
1
1.5
2
2.5
0 0.2 0.4 0.6 0.8 1 1.2
Precompression Stress, N/mm2
Shea
r St
reng
th, N
/mm
2
Figure 5.25- shear stress/precompression stress relationship for half scale specimens.
0
0.5
1
1.5
2
2.5
0 0.2 0.4 0.6 0.8 1 1.2
Precompression Stress, N/mm2
Sh
ear
Str
engt
h, N
/mm
2
Figure 5.26- Shear stress/precompression stress relationship for fourth scale
specimens.
0
0.5
1
1.5
2
2.5
0.0 0.2 0.4 0.6 0.8 1.0 1.2
Precompression Stress, N/mm2
She
ar S
tren
gth,
N/m
m2
Figure 5.27- Shear stress/precompression stress relationship for sixth scale specimens.

5 Masonry Tests at Different Scales, Results and Discussions
5-33
0
0.5
1
1.5
2
0 0.2 0.4 0.6 0.8 1 1.2
Scale
Coe
ffic
ient
of
fric
tion
Figure 5.28- Coefficient of friction across the four scales.
0.0
0.2
0.4
0.6
0.8
1.0
0.0 0.2 0.4 0.6 0.8 1.0 1.2
Scale
Shea
r St
reng
th, N
/mm
2
Figure 5.29- Initial shear strength across the four scales.
0.1
1
10
10 100 1000
Log D
Nom
inal
Str
engt
h, L
og σσ σσ
N
Test
MFSL
SEL
D
Figure 5.30- Size effect analysis of shear strength tests results at a precompression
stress of 0.2N/mm2

5 Masonry Tests at Different Scales, Results and Discussions
5-34
1
10
10 100 1000
Log D
Nom
inal
Str
engt
h, L
og
N
Test
MFSL
SEL
D
Figure 5.31- Size effect analysis of shear strength test results at a precompression
stress of 1.0N/mm2
0.0
0.3
0.6
0.9
1.2
0 0.2 0.4 0.6 0.8 1 1.2
Scale
Fle
xura
l Str
engt
h, N
/mm
2
Figure 5.32- Flexural strength normal to bed joint across the four scales.
0.0
0.5
1.0
1.5
2.0
2.5
0 0.2 0.4 0.6 0.8 1 1.2
Scale
Fle
xura
l Str
engt
h, N
/mm
2
Figure 5.33- Flexural strength parallel to bed joints across the four scales.
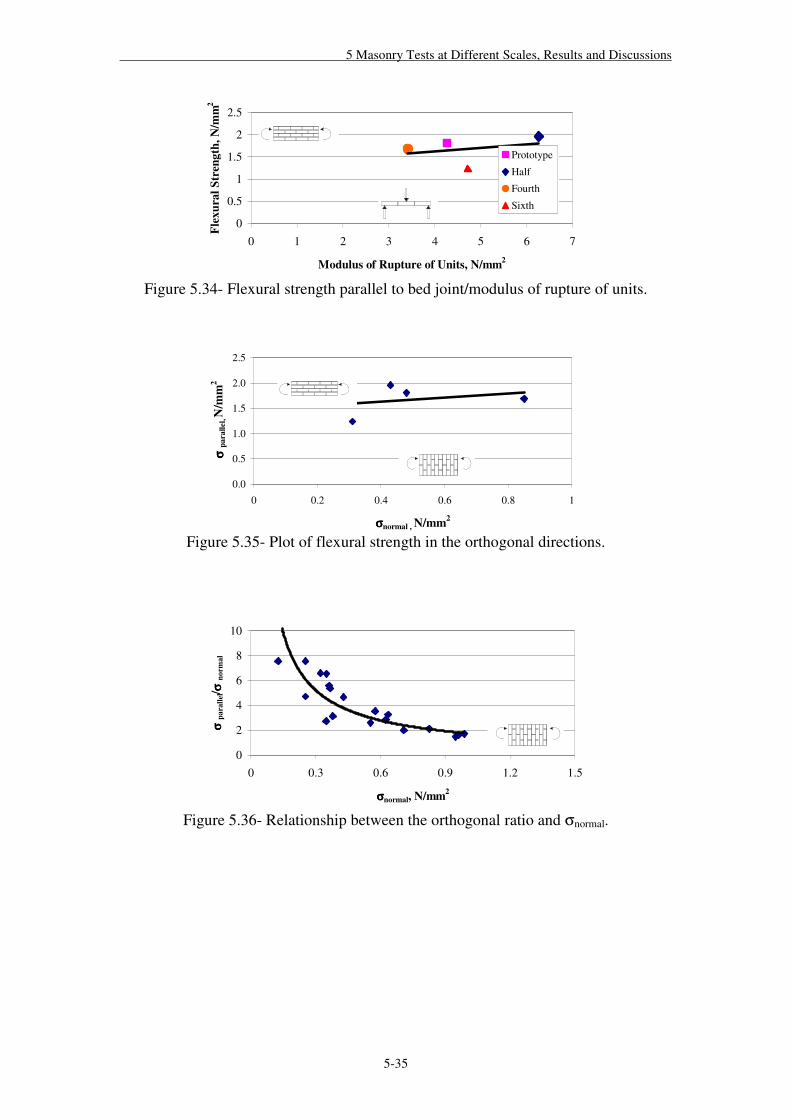
5 Masonry Tests at Different Scales, Results and Discussions
5-35
0
0.5
1
1.5
2
2.5
0 1 2 3 4 5 6 7
Modulus of Rupture of Units, N/mm2
Fle
xura
l Str
engt
h, N
/mm
2
Prototype
Half
Fourth
Sixth
Figure 5.34- Flexural strength parallel to bed joint/modulus of rupture of units.
0.0
0.5
1.0
1.5
2.0
2.5
0 0.2 0.4 0.6 0.8 1
σσσσnormal , N/mm2
σ
σ
σ
σ p
aral
lel, N
/mm
2
Figure 5.35- Plot of flexural strength in the orthogonal directions.
0
2
4
6
8
10
0 0.3 0.6 0.9 1.2 1.5
σσσσnormal, N/mm2
σ
σ
σ
σ p
aral
lel/ σ
σ
σ
σ
nor
mal
Figure 5.36- Relationship between the orthogonal ratio and σnormal.

5 Masonry Tests at Different Scales, Results and Discussions
5-36
0
1
10
10 100 1000
Log D
Log
σ
σ
σ
σ N
Test
SEL
MFSL
D
Figure 5.37- Size effect analysis of flexural strength (normal to bed joints) test data.
0
1
10
10 100 1000
Log D
Log
σ
σ
σ
σ N
Test
SEL
MFSL
D
Figure 5.38- Size effect analysis of flexural strength (parallel to bed joints) test data.
0.0
0.4
0.8
1.2
1.6
2.0
0.0 0.2 0.4 0.6 0.8 1.0 1.2
Scale
Bon
d St
reng
th, N
/mm
2
Figure 5.39- Variation of bond strength across the four scales.

5 Masonry Tests at Different Scales, Results and Discussions
5-37
0
0.3
0.6
0.9
0.0 0.3 0.6 0.9 1.2 1.5
Bond Strength, N/mm2
σ
σ
σ
σ n
orm
al, N
/mm
2
Prototype
Half
Fourth
Sixth
Figure 5.40- Relationship between flexural strength and bond strength in the four
scales.
0
1
10
10 100 1000
Log D
Nom
inal
Str
engt
h, L
ogσ
σ
σ
σ
N Test
MFSL
SEL
D
Figure 5.41- Size effect analysis of bond wrench test results.
0
0.5
1
1.5
2
0 0.4 0.8 1.2
Scale
Shea
r St
reng
th,N
/mm
2
Figure 5.42- Variation of shear strength with scale in the diagonal tensile strength
tests.

5 Masonry Tests at Different Scales, Results and Discussions
5-38
0
0.2
0.4
0.6
0.8
1
0 0.0003 0.0006 0.0009
Axial Strain
Shea
r St
ress
N/m
m2
1
2
Average
Figure 5.43 – Typical shear stress/axial strain curves in prototype diagonal tensile
strength test 1D-A1.
0
0.2
0.4
0.6
0.8
1
-0.0003 0
Lateral Strain
Shea
r St
ress
N/m
m2
1
2
Average
Figure 5.44- Typical shear stress/lateral strain curves in prototype diagonal tensile
strength test 1D-A1.
0
0.2
0.4
0.6
0.8
1
0 0.0003 0.0006 0.0009
Axial Strain
Shea
r St
ress
N/m
m2 1D-A1
1D-A2
1D-A3
Figure 5.45- Summary of shear stress/axial strain curves for the diagonal tensile
strength prototype tests.

5 Masonry Tests at Different Scales, Results and Discussions
5-39
0
0.2
0.4
0.6
0.8
1
-0.0003 0
Lateral Strain
Shea
r St
ress
N/m
m2
1D-A1
1D-A2
1D-A3
Figure 5.46- Summary of shear stress/lateral strain curves for the diagonal tensile
strength test prototype tests.
0
0.2
0.4
0.6
0.8
1
0 0.0003 0.0006 0.0009
Axial Strain
Shea
r S
tres
s, N
/mm
2
1
2
Average
Figure 5.47- Typical shear stress/axial strain curves in half scale diagonal tensile
strength test 2D-A5.
0
0.2
0.4
0.6
0.8
1
-0.0009 -0.0006 -0.0003 0
Lateral Strain
Shea
r St
ress
, N/m
m2
1
2
Average
Figure 5.48- Typical shear stress/lateral strain curves in half scale diagonal tensile
strength test 2D-A5.

5 Masonry Tests at Different Scales, Results and Discussions
5-40
0
0.2
0.4
0.6
0.8
1
0 0.0003 0.0006 0.000
Axial Strain
Shea
r S
tres
s, N
/mm
2
2D-A2
2D-A4
2D-A5
Figure 5.49- Summary of shear stress/axial strain curves for the half scale diagonal
tensile strength tests.
0
0.2
0.4
0.6
0.8
1
-0.0009 -0.0006 -0.0003 0Lateral Strain
Shea
r St
ress
, N/m
m2
2D-A2
2D-A4
2D-A5
Figure 5.50- Summary of shear stress/lateral strain curves for the half scale diagonal
tensile strength tests.
0
0.2
0.4
0.6
0.8
1
0 0.0003 0.0006 0.0009 0.0012
Axial Strain
Shea
r St
ress
, N/m
m2
12Average
Figure 5.51- Typical shear stress/axial strain curves in fourth scale diagonal tensile
strength test 4D-A2.

5 Masonry Tests at Different Scales, Results and Discussions
5-41
0
0.2
0.4
0.6
0.8
1
-0.0003 0
Lateral Strain
Shea
r St
ress
, N/m
m2
12Average
Figure 5.52- Typical shear stress/lateral strain curves in fourth scale diagonal tensile
strength test 4D-A2.
0
0.2
0.4
0.6
0.8
1
1.2
0 0.0003 0.0006 0.0009
Axial Strain
Sh
ear
Str
ess,
N/m
m2
4D-A2
4D-A3
4D-A5
Figure 5.53- Summary of shear stress/axial strain curves for the fourth scale diagonal
tensile strength tests.
0
0.2
0.4
0.6
0.8
1
1.2
-0.0006 -0.0004 -0.0002 0
Lateral Strain
Shea
r St
ress
, N/m
m2
4D-A2
4D-A3
4D-A5
Figure 5.54- Summary of shear stress/lateral strain curves for the fourth scale diagonal
tensile strength tests.

5 Masonry Tests at Different Scales, Results and Discussions
5-42
0
0.2
0.4
0.6
0.8
1
0 0.0003 0.0006 0.0009 0.0012 0.0015 0.0018
Axial Strain
Shea
r St
ress
, N/m
m2
1
2
Average
Figure 5.55- Typical shear stress/axial strain curves in sixth scale diagonal tensile
strength test 6D-B1.
0
0.2
0.4
0.6
0.8
1
-0.0024 -0.0018 -0.0012 -0.0006 0
Lateral Strain
Shea
r st
ress
, N/m
m2
1
2
Average
Figure 5.56- Typical shear stress/lateral strain curves in sixth scale diagonal tensile
strength test 6D-B1.
0
0.2
0.4
0.6
0.8
1
0 0.0003 0.0006 0.0009 0.0012 0.0015
Axial Strain
Shea
r St
ress
, N/m
m2
6D-B1
6D-B2
6D-B3
Figure 5.57-Summary of shear stress/axial strain curves for the sixth scale diagonal
tensile strength tests.

5 Masonry Tests at Different Scales, Results and Discussions
5-43
0
0.2
0.4
0.6
0.8
1
-0.004 -0.003 -0.002 -0.001 0
Lateral Strain
Shea
r St
ress
, N/m
m2
6D-B1
6D-B2
6D-B3
Figure 5.58- Summary of shear stress/lateral strain curves for the sixth scale diagonal
tensile strength test.
0
0.2
0.4
0.6
0.8
1
0 0.0005 0.001 0.0015
Axial Strain
Shea
r St
ress
N/m
m2
Prototype
Half
Fourth
Sixth
Figure 5.59- Comparison of typical shear stress/axial strain curves for the diagonal
tensile strength tests in the four scales.
0
0.2
0.4
0.6
0.8
1
-0.002 -0.0015 -0.001 -0.0005 0
Lateral Strain
Shea
r St
ress
N/m
m2
Prototype
Half
Fourth
Sixth
Figure 5.60- Comparison of typical shear stress/lateral strain curves for the diagonal
tensile strength tests in the four scales.

5 Masonry Tests at Different Scales, Results and Discussions
5-44
0
1
10
100 1000
Log D
Nom
inal
Str
engt
h, L
og
N
Test
MFSL
SEL
D
Figure 5.61- Size effect analysis of diagonal tensile strength test data.

5 Masonry Tests at Different Scales, Results and Discussions
5-45
Plate 5.1- Cracking patterns in prototype triplets.
Plate 5.2- Cracking patterns in sixth scale triplets.
Plate 5.3- Cracking patterns in sixth scale wallettes.

5 Masonry Tests at Different Scales, Results and Discussions
5-46
Plate 5.4- Shear failure in prototype specimens.
Plate 5.5- Failure in half scale flexural strength specimens.
Plate 5.6- Failure in sixth scale flexural strength specimens.

5 Masonry Tests at Different Scales, Results and Discussions
5-47
Plate 5.7- Failure in prototype flexural strength specimens.
Plate 5.8- Failure patterns in half scale diagonal tensile specimens.

5 Masonry Tests at Different Scales, Results and Discussions
5-48
Plate 5.9- Failure pattern in sixth scale diagonal tensile specimens.

6 Masonry Tests at Sixth Scale, Results and Discussions
6-1
6 Masonry Tests at Sixth Scale Results and Discussions
This chapter presents the results and discussion of sixth scale tests looking at
parametric effects of different joint thicknesses, different mortar grades and different
sand gradings. The aim was to investigate the feasibility of using sixth models to
determine the influence of these parameters on the compressive strength, shear
strength, flexural strength, bond strength and diagonal tensile strength tests. The
identification system used for the tests in this chapter is as per Chapter 5.
6.1 Compressive strength test
6.1.1 Varying joint thickness
Typical failure of the specimens was characterised by tensile cracks in the axial
direction, at the sides and on the top and bottom faces and splitting cracks on the end
faces as already shown in Plate 5.2. This failure pattern was seen in all the three joint
thicknesses of 1.0mm, 1.6mm and 2.5mm. A summary of the compressive strength
test results with varying joint thicknesses is shown in Table 6.1 and Figure 6.1 shows
the variation of compressive strength with increasing joint thickness. It can be seen
from the table that the mean compressive strength for the benchmark triplet (1.6mm
bed joint) is the same as the mean strength (neglecting the lowest triplet strength) of
the 1.0mm bed joint triplets. It is also seen that the mean strength of the benchmark
triplet is just 1% higher than the mean strength of the 2.5mm triplet. The figure shows
that there is no clear trend in the masonry compressive strength as the joint thickness
is increased. The expectation was for an increase in the masonry strength as the joint
thickness is decreased as reported by Francis et al(20) and others(19) from tests on stack
bonded full scale masonry units. Since the mortar cube strengths for the tests are in
good agreement as seen from the table, the expectation was to see an increase in the
masonry strength as the joint thickness was reduced.
One possible explanation for the lack of a clear effect may be because at the very
small scale of the test it is difficult to see the effect of increasing joint thickness for
the range of bed joints used. Since, as it has been discussed previously in relation to

6 Masonry Tests at Sixth Scale, Results and Discussions
6-2
Figure 2.3, that at relatively small scales, the strength criterion applies, this may
therefore imply that no size effect is seen in the masonry strength at small scales
because of the size of the joints. It is also possible that the relatively higher COV
(25.7%) of the 1.0mm tests as compared to the other tests masks the true structural
response of the results in that test, because as seen from the figure, both the highest
and lowest compressive strengths were recorded in the 1.0mm test. Therefore because
of such a large variation in the strength of the model bricks it may be difficult to see
the influence of the different joint thickness at this scale. It therefore seems that the
mortar joint thickness does not appear to have a marked effect on the compressive
strength at this scale, contrary to prototype results.
6.1.2 Effect of sand grading and mortar type
6.1.2.1 M95, Mortar designations ii, iii, and iv.
The cracking pattern in the M95 tests are characterised by the usual tensile cracking
pattern as seen previously. The summary of the test results are shown in Table 6.1 and
Figure 6.2. The mean triplet strengths for designation ii, iii and iv mortars were found
to be 22.6 N/mm2, 20.3 N/mm2 and 16.7 N/mm2 respectively. From the results it is
seen that that there is an increase in masonry strength as the mortar strength is
increased. There is about an 11% strength increase from designation iii to designation
ii, and a 20% increase from designation iv to iii. This is also true for numerous other
tests conducted at different scales, as detailed by Egermann et al(51). The reason for
the increase in masonry strength is because, as observed previously, the mortar
becomes stiffer with increasing strength (increasing cement content) which therefore
implies that more force is needed to create the frictional forces that induce the tensile
stresses that cause failure in the units and ultimately the masonry. Just as an
illustration, the EC6 formula for the characteristic strength of masonry (Equation 2.1)
is also shown in the figure to see if the results will conform to the trend in the
equation; the intention was not to see whether the characteristic strength prediction is
accurate or not but rather to see how the test data fit the trend set by the formula. It is
seen that the test results corresponds well to the general trend of Equation 2.1.
The stiffness results shown in Figure 6.3 also show that masonry stiffness increases
with increasing mortar strength. The mean stiffness of the designation iii triplet was
determined to be 6000 N/mm2, while the mean stiffness for the triplets with

6 Masonry Tests at Sixth Scale, Results and Discussions
6-3
designation ii mortar was 53% more than that. The stiffness for the triplets with
designation iv mortar is 30% less than the stiffness of the benchmark test.
Remarkably, the mean masonry triplet stiffness for the specimens made with
designation iii mortar is similar to the mortar stiffness from the material tests (Table
3.6); the mortar stiffness is about 8% higher than the masonry triplet stiffness. The
correspondence of the masonry stiffness to the mortar stiffness is even closer in the
tests made with designation iv mortar, the masonry stiffness is only 2% higher than
the mortar stiffness. However there does not seem to be a good correspondence in the
masonry stiffness in the tests made with designation ii mortar, the masonry stiffness is
about 35% higher than the mortar stiffness in this case. But despite the lack of
correspondence in this last result, the influence of mortar stiffness on the masonry
stiffness can be seen as has already been seen from the masonry triplet results on
different scales from Chapter 5, where the masonry stiffness in the four scales were
also in good agreement with the mortar stiffness.
6.1.2.2 M60, Mortar designations ii, iii, and iv.
The failure of the specimens in the M60 tests were also characterised by tensile
cracking patterns. The results from Table 6.1 and Figure 6.4 show that, as in the case
of the previous test, there is clear trend of an increase in the masonry strength as the
mortar strength is increased. In this case there is about an 8% increase from
designation iii to designation ii mortar and about an 18% increase from designation iv
to designation iii mortar. The percentage increases in this case from one designation
to the other also agrees with those from the M95 tests, an indication that it is possible
to use a sixth scale masonry model to look at the effects of increasing mortar strength.
The figure also reveals that the test data corresponds well with the EC6 equation even
though the trend line for the equation straddles the trend line for the test data.
6.1.2.3 Effect of different sand gradings
The combined plot for the variation of masonry strength with mortar strength for both
M95 and M60 tests is shown in Figure 6.5. It is seen that the trend line for the M95
test is steeper than that for the M60 test. This may mean that the M95 tests are more
receptive to changes in cement content because the sand grading is finer than in the
M60 tests. Another interesting point from the plot is that even though the M60
mortars are stronger than the M95 mortars in all three designations; the masonry
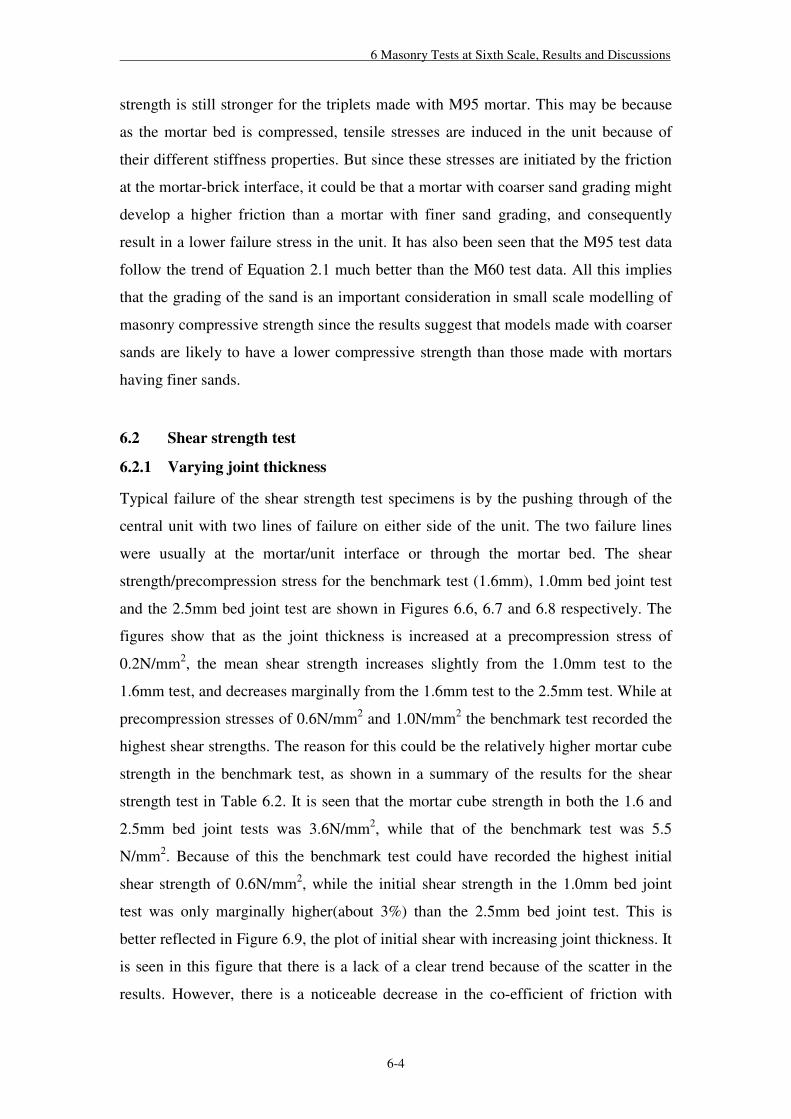
6 Masonry Tests at Sixth Scale, Results and Discussions
6-4
strength is still stronger for the triplets made with M95 mortar. This may be because
as the mortar bed is compressed, tensile stresses are induced in the unit because of
their different stiffness properties. But since these stresses are initiated by the friction
at the mortar-brick interface, it could be that a mortar with coarser sand grading might
develop a higher friction than a mortar with finer sand grading, and consequently
result in a lower failure stress in the unit. It has also been seen that the M95 test data
follow the trend of Equation 2.1 much better than the M60 test data. All this implies
that the grading of the sand is an important consideration in small scale modelling of
masonry compressive strength since the results suggest that models made with coarser
sands are likely to have a lower compressive strength than those made with mortars
having finer sands.
6.2 Shear strength test
6.2.1 Varying joint thickness
Typical failure of the shear strength test specimens is by the pushing through of the
central unit with two lines of failure on either side of the unit. The two failure lines
were usually at the mortar/unit interface or through the mortar bed. The shear
strength/precompression stress for the benchmark test (1.6mm), 1.0mm bed joint test
and the 2.5mm bed joint test are shown in Figures 6.6, 6.7 and 6.8 respectively. The
figures show that as the joint thickness is increased at a precompression stress of
0.2N/mm2, the mean shear strength increases slightly from the 1.0mm test to the
1.6mm test, and decreases marginally from the 1.6mm test to the 2.5mm test. While at
precompression stresses of 0.6N/mm2 and 1.0N/mm2 the benchmark test recorded the
highest shear strengths. The reason for this could be the relatively higher mortar cube
strength in the benchmark test, as shown in a summary of the results for the shear
strength test in Table 6.2. It is seen that the mortar cube strength in both the 1.6 and
2.5mm bed joint tests was 3.6N/mm2, while that of the benchmark test was 5.5
N/mm2. Because of this the benchmark test could have recorded the highest initial
shear strength of 0.6N/mm2, while the initial shear strength in the 1.0mm bed joint
test was only marginally higher(about 3%) than the 2.5mm bed joint test. This is
better reflected in Figure 6.9, the plot of initial shear with increasing joint thickness. It
is seen in this figure that there is a lack of a clear trend because of the scatter in the
results. However, there is a noticeable decrease in the co-efficient of friction with

6 Masonry Tests at Sixth Scale, Results and Discussions
6-5
increase in bed joint thickness even with the lack of correspondence in the mortar
cube strengths as seen from Figure 6.10, which shows the variation of joint thickness
with co-efficient of friction. This may imply that the co-efficient of friction is not as
susceptible to mortar strength as the initial shear strength because it is dependent on
the physical properties of the mortar-unit interface. The results in the next section
should provide further evidence in relation to this preposition.
6.2.2 M95, mortar designations ii, iii, and iv.
Figures 6.11 and 6.12 show the shear strength/precompression stress response in the
M95-ii and M95-iv tests, respectively. The figures show that there is some degree of
scatter in the result most notably at the precompression stress of 0.6N/mm2. The
figures also show that the shear strengths recorded at the different precompression
levels in the benchmark test are almost the same with the M95-ii test, even though the
mortar cube strength in the M95-ii test was marginally higher than that in the
benchmark test. Because of this, the plot of the initial shear with mortar cube strength
in Figure 6.13 shows an unexpected trend, as seen from the fitted trend line, which
shows a slight decrease in initial shear strength with increase in mortar cube strength.
The plot of the co-efficient of friction with mortar cube strength in Figure 6.14 shows
an increase in the friction co-efficient from the designation iv to the designation iii
mortar followed by drop from the designation iii to the designation ii mortar. In fact
the friction co-efficient is the same for the designation ii and designation iv mortar.
This seems to agree with the earlier preposition that co-efficient of friction is not
strongly influenced by different mortar strengths.
6.2.3 M60, mortar designations ii, iii, and iv.
The plot of shear strength/precompression stress for the M60-iii, M60–ii and M60-iv
mortar tests are shown in Figures 6.15, 6.16 and 6.17 respectively. The figures again
show some degree of scatter for the M60-iii and M60-ii tests but considerably less
scatter for the M60-iv test. The figures also show that there is a gradual increase in the
shear strength at the different precompression levels as the mortar strength was
increased. In this case therefore, there is a clear trend of an increase in the initial shear
strength as the mortar strength is increased, as seen from plot of initial shear strength
with mortar cube strength in Figure 6.18. This is to be expected since there will be a
better bond between the mortar and brick because of the higher cement content in the

6 Masonry Tests at Sixth Scale, Results and Discussions
6-6
stronger mortar grades which should increase the resistance to shear. The variation of
the friction co-efficient with mortar strength is shown in Figure 6.19 and it reveals
that mortar strength has no significant effect on the friction co-efficient as seen in the
last section.
6.2.4 Effect of different sand gradings
Figure 6.20 shows the effect of sand grading on initial shear strength and it reveals
that the influence of the sand gradings on the initial shear strength is different for the
two sands. It is seen that, there is an increase in initial shear strength as the mortar
strength is increased for the HST 60 sands while the reverse is true for the HST 95
sands, but the effect is not as marked as in the case of the HST 60 sands. However the
real response may be masked by difficulties in accurately placing the loading and
support rollers as a result of the small size of the specimens. Regardless, the HST 95
test showed higher initial shear strengths than the HST 60 test.
With respect to the friction co-efficient, Figure 6.21 shows how the sand gradings
affect the friction co-efficient. It is seen from the figure that there is a just noticeable
increase in the co-efficient as the mortar strength is increased for both HST 95 and
HST 60 sands. In fact because of the very marginal rate of increase, it could be argued
that there is no effect of the increase in mortar strength on the friction co-efficient. In
this case however, the tests with HST 60 sand gave higher friction co-efficients than
the tests with HST 95 sand. This could be because the grain size is coarser for the
HST 60 sands.
6.3 Flexural strength test
6.3.1 Varying joint thickness
Typical failure of the flexural strength test specimens is as shown in Plate 5.7, which
is characterised by a bond failure at the brick-mortar face in case of the flexural
strength normal to bed joint test and a combination of joint-brick fracture for the
flexural strength parallel to bed joint test. In the case of the 1.0mm and 2.5mm
flexural strength normal to bed joint tests, the failure line was mostly through the 3rd
joint from either the top or bottom face for the flexural strength normal to the bed
joints. While in the case of the benchmark tests the failure was normally through the
fourth or 5th joint from either face. Failure for the flexural strength parallel to bed

6 Masonry Tests at Sixth Scale, Results and Discussions
6-7
joint test was similar in all three test, but for two specimens that showed joint rotation
in the benchmark test; which failed through the joints and not through a joint-brick
failure as in the other cases.
The summarised results for failure normal to bed joints and failure parallel to the bed
joints are shown in Tables 6.3 and 6.4 respectively. From the tables and from the plot
of flexural strength with varying joint thickness in Figure 6.22, it is seen that there is
slight increase in flexural strength parallel to the bed joint as the joint is increased but
only marginally. A gradual decrease in flexural strength normal to bed joint is shown
as the bed joint is increased, but because of the variability in the results, it is difficult
to draw any definite conclusion on the effect of increasing joints thickness on flexural
strength. Figure 6.23, the plot of the orthogonal flexural strength ratio(Normal
Parallel
σ
σ) to the
flexural strength normal to the bed joints reveals the expected trend that with increase
in the latter the former reduces markedly as discussed by Hendry(19). The orthogonal
strength ratios are 4.4, 4.0 and 2.5 respectively for the 1.0mm, 1.6mm and 2.5 mm
bed joints test, which again shows the lack of a clear trend in the results. This could
be due to the general scale of the test as observed earlier with reference to Figure 2.3.
The trend seen here does not correspond to tests conducted on prototype specimens by
Sise et al(33), who found that the flexural bond strength is strongly influenced by the
bed joint thickness, characterised by a decrease in flexural strength as the joint
thickness was increased.
6.3.2 M95, mortar designations ii, iii, and iv.
Figure 6.24 shows the effect of increasing the M95 mortar strength on the flexural
strength for the two specimen formats. In this case, despite the scatter there is a
noticeable increase in both flexural strengths with increase in mortar strength. This is
to be expected since the unit-mortar bond should increase with increasing mortar
strength because of the increasing cement content. Again Figure 6.25, which is the
plot of the orthogonal ratio to the flexural strength normal to the bed joints, shows the
expected decrease of the former as the latter is increased.
6.3.3 M60, mortar designations ii, iii, and iv.
The graph of flexural strength with increasing M60 mortar strength is shown in Figure
6.26. It is seen from the figure that as in the case of the M95 mortars there is an

6 Masonry Tests at Sixth Scale, Results and Discussions
6-8
increase in the flexural strengths with increase in mortar strength. In this case
however the scatter is less, as seen from the COV of their mean flexural strength from
Tables 6.3 and 6.4. It also seen that the COV of the flexural strength normal to bed
joints is much higher than that for the flexural strength parallel to the bed joints for
both the M60 and M95 test. This may be because the failure in the flexural strength
normal to the bed joints is governed by the weakest joint in the specimen, which is
limited by two variables either the bond strength at the mortar-unit interface or the
tensile strength of the mortar. While failure in the flexural strength parallel to the bed
joints is mainly influenced by one variable, the modulus of rupture of the units of the
units when there is strong bond between the bricks and mortar. Figure 6.27 also shows
that the orthogonal ratio deceases with increasing flexural strength normal to the bed
joint as expected.
6.3.4 Effect of different sand gradings
The effect of the different sands on the flexural strength parallel to the bed joints is
shown in Figure 6.28. It is seen from the figure that even though the flexural strength
is higher for the M60 mortars, the effect is negligible, possibly because the flexural
strength parallel to the bed joint is mainly influenced by the tensile properties of the
units. But in the case of the effect of the different sand gradings on the flexural
strength normal to the bed joints as shown in Figure 6.29, there is a much more
noticeable effect of the increase in flexural strength. This could be due to the presence
of more cement per unit volume of M60 mortar than an equivalent weight of M95
mortar, because as observed in Chapter 3, the HST60 sands have a higher bulk density
than an equivalent weight of HST95 sand. The extra cement could then result in
increased bond between the mortar and unit which subsequently results in increased
bond strength.
The plot of the orthogonal ratios for the two mortar types in Figures 6.24 and 6.27
also shows that the ratio is higher for the M95 tests than the M60 tests at lower values
of the flexural strength normal to the bed joints. But as the flexural strength normal to
the bed joints is increased the ratios for the mortars begin to correspond, and actually
have similar ratios at about the flexural strength of 0.8N/mm2.

6 Masonry Tests at Sixth Scale, Results and Discussions
6-9
6.4 Bond Strength test
6.4.1 Varying joint thickness
Typical failure of the bond strength test specimens was in the top or bottom joint of
the triplet specimen but in no particular order. A summary of the mean bond strengths
is presented in Table 6.5 and the effect of joint thickness on bond strength shown in
Figure 6.30. It can be seen from the results that there is no net effect of the varying
joint thickness on the bond strength. The expectation was for a decrease in the bond
strength as the joint thickness was increased, as reported by Sise et al(33) from tests on
prototype specimens. Even though the 1.0mm and 2.5mm tests were constructed from
the same batch of mortar and the benchmark test from a separate one, the mean bond
strengths in the 1.0mm is only marginally higher than that in the 2.5mm test. The
bond strength from the benchmark test was the lowest of the three because of the
lower mortar strength in that test. The original benchmark test was discarded because
it was gave misleading results, but even if the benchmark test was not considered, the
figure still reveals a lack of a clear trend in the bond strength as the joint thickness is
increased. This is further complicated by the scatter in the results as seen from the
relatively high COV from the table. This seems to reinforce the earlier observation in
the previous sections, that it is difficult to model the effect of varying joint thickness
at small scales.
6.4.2 M95, mortar designations ii, iii, and iv.
The failure of the bond strength M95 test specimens was also as reported in the last
section with failure in either the bottom or top joint of a triplet. The effect of
increasing the M95 mortar strength on the bond strength is shown in Figure 6.31,
from which it is clear that there is an increase in the bond strength as the mortar
strength is increased. This is to be expected since the mortar strength increase is due
to the increase in cement content. It follows therefore that this may also affect the
brick-mortar bond which consequently results in higher bond strength, since a greater
amount of force would be required to break the bond at the mortar-unit interface.
6.4.3 M60, mortar designations ii, iii, and iv.
Figure 6.32 shows the effect of increasing the M60 mortar strength on the bond
strength. It is seen from the figure and Table 6.5 that there is an unexpected drop in
the bond strength for the M60-iii test batch. However this does not affect the general

6 Masonry Tests at Sixth Scale, Results and Discussions
6-10
trend of the regression line, which shows that there is an overall increase in the bond
strength as the mortar strength is increased.
6.4.4 Effect of different sand gradings
The effect of the different sands on the bond strength is shown in Figure 6.33. From
which it can be seen that because of the low bond strength results from the M60-iii
batch and relatively lower M60-iv bond strength (compared to M95-iv), the fitted
regression line for the M95 mortars appears to be higher than that for the M60
mortars. It is therefore difficult to conclusively argue about the effect of the sand
grading.
6.4.4.1 Flexural strength normal to bed joint compared to bond strength
The flexural strength normal to the bed joint is in actual fact a flexural bond strength
since failure will always occur at the weakest joint. This can therefore be related to
the flexural bond strength from the bond wrench test. The two values are of course not
exactly the same since in the bond wrench test; individual joints are tested, while in
the flexural strength test; failure occurs at the weakest joint. Fried et al(90) have
reported that Lawrence(90) found that the bond strength obtained from testing single
joints could be greater than that at which a single joint (the weakest) fails. Figure 6.34
shows the effect of the joint thickness on the flexural strength/bond strength
relationship. As seen from the previous discussion on the effect the bed joint thickness
has on the bond strength, the fitted regression line does not show the expected trend;
that is, a direct relationship between the flexural strength and the bond strength.
In the case of the M95 tests, the relationship between the flexural strength and the
bond strength seems to be linear, as shown in Figure 6.35. The plot again reveals a
wide scatter in the results, despite that a correlation can still be made between the
flexural strength and the bond strength. The regression line from the plot shows a
positive intercept and also above the equality line, indicating that the flexural strength
is greater than the bond strength for this set of tests. This does not correspond to the
findings of Lawrence as stated earlier. But, as it has been previously stated, the
normal stresses are neglected in the bond wrench calculations but not in the
determination for flexural strength, which could lead to the lower bond strength, as
seen here. The flexural strength/bond strength relationship for the M60 tests shown in
Figure 6.36 also reveals a direct relationship between the two.

6 Masonry Tests at Sixth Scale, Results and Discussions
6-11
6.5 Diagonal tensile strength test
Typical failure of the diagonal tensile strength test specimens was by shear failure
through the joints and in some cases combination of joints and units. The failure line
usually occurred in the direction of the compression diagonal, but there were cases of
shear-bond failure between the mortar bed and units along the bed joint. There were
also cases of explosive and sudden failure of the specimens, although most specimens
failed more gradually.
6.5.1 Varying joint thickness
The shear stress/strain curves for the 1.0mm, 1.6mm and 2.5mm test are shown in
Figures 6.37, 6.38, 6.39 respectively. The curves show that there is good agreement
between the curves for each of the tests, as evidenced by the slope of the curves. From
Figure 6.40, which shows typical stress/strain curves on the same plot, it can be seen
that the curves have similar slopes although the curves from the benchmark test have
a less steep slope. The curves also reveal that failure is not abrupt after attainment of
the maximum shear stress but are more plastic. This is more noticeable in the case of
the benchmark test, in which it is seen that there is a greater plasticity at the maximum
stress. In Figure 6.41 the effect of joint thickness on shear strength is shown and it
reveals that there is a decrease in shear strength as the joint thickness is increased. The
summary of the test results in Table 6.6 also shows that mean shear strength of the
benchmark tests; 0.63N/mm2 is the lowest of the three probably due to its lower
mortar strength.
6.5.2 M95, mortar designations ii, iii, and iv.
Figures 6.42 and 6.43 show the stress/strain curves for the M95-ii and M95-iv test.
Again the figures show that curves in each set of tests are similar to each other. The
curves are more consistent for the benchmark test than for the M95-ii and M95-iv
tests as seen from their higher COV in Table 6.6. In Figure 6.44, which compares
typical stress/strain curves for the three mortar grades, it is seen that the specimens
made with designation iii and iv mortars have a greater capacity to withstand
deformation at the attainment of their respective maximum shear stresses, than
specimens made with designation ii mortar. But the latter have a greater capacity to
withstand higher shear stress. The effect of increasing mortar strength on shear
strength is seen in Figure 6.45, and it shows, as expected, that there is an increase in

6 Masonry Tests at Sixth Scale, Results and Discussions
6-12
shear strength as the mortar strength increases. From Table 6.6 it is seen that even
though the M95-ii cube strength is four times the M95-iv cube strength, the shear
strength of the specimens made with the M95-ii mortar are about 2.3 times more than
that made with the M95-iv mortar. This test underlines the importance of using the
right kind of mortar designation to model masonry behaviour because as seen here
their plastic responses can differ significantly.
6.5.3 M60, mortar designations ii, iii, and iv.
The stress/strain curves for the M60-iii, M60-ii and M60-iv tests are shown in Figures
6.46, 6.47 and 6.48 respectively. The curves again show that their slopes are similar,
an indication that test specimens have identical characteristics in each particular set.
However the curves in the M60-iii test are more variable than those in the other two
tests as seen from the relatively higher COV in that test. The comparison of typical
stress/strain curves for the three mortar designations is shown in Figure 6.49, from
which it is seen that there is a softer response in the M60-iv test than either the M60-ii
or M60-iii tests. The M60-ii test however shows a greater capacity to withstand shear
than the other two. As expected the plot of shear strength against mortar strength in
Figure 6.50 shows an increase in the shear strength as the mortar strength is increased.
This is to be expected since there is more cement per unit area of bed joint as the
mortar strength is increased, which consequently results in greater adhesion between
the mortar bed and units. The mean shear strength of the M60-ii tests is about 2.8
times more than the mean shear strength of the M60-iv tests. However, even though
the mean mortar cube strength of the M60-ii tests is more than twice the cube strength
of the M60-iii test, the mean shear strength from the M60-ii tests is only about 1.2
times the shear strength in the M60-iii tests.
6.5.4 Effect of different sand gradings
The effect of different sand gradings on shear strength is shown in Figure 6.51. It
reveals that the specimens made with the HST60 sands had slightly higher shear
strength than those made with the HST95 sand. This, as observed earlier, could be due
to the presence of more cement per unit volume of M60 mortar than an equivalent
weight of M95 mortar. The additional cement could then result in increased bond
between the mortar and unit which consequently manifests in increased shear
strength. The different stress/strain curves for the two mortar types also show that

6 Masonry Tests at Sixth Scale, Results and Discussions
6-13
specimens made with the HST95 sand are more able to resist further deformations
after the maximum shear stress was reached.
6.6 Conclusions
The results show that in the case of the compressive strength tests, there was no
change in the masonry strength with increasing joint thickness due to the wide scatter
in the results. However masonry strength and stiffness was observed to increase with
increasing mortar strength. Significantly it was also observed that, even though the
M60 mortar strengths were higher, the M95 masonry tests gave higher results.
The initial shear strength was observed to decrease marginally with increase in joint
thickness in the shear strength tests. In the M60 mortar tests, the initial shear strength
increases with increase in mortar strength while there was virtually no change in the
shear strength for the M95 tests. But because of the effect of the different sand the
M95 tests had higher initial shear strength than the M60 tests.
In the case of the joint thickness tests for the flexural strength there was a mixed
picture; the flexural strength normal to the bed joint was seen to increase marginally
with increase in joint thickness, while the flexural strength parallel to the bed joints
was observed to decrease marginally with increase in the mortar bed thickness. But
the picture was clearer in the other tests, as it was observed that the flexural strengths
were both increasing with increasing mortar strengths. In this case however the M60
tests showed slightly higher flexural strengths.
In the bond strength tests, no net effect was seen on the bond strength with increasing
joint thickness. However the bond strength was observed to increase with increasing
mortar strength in both M60 and M95 tests. In terms of the effect of the different sand
types, the M95 tests had higher bond strengths than the M60 tests.
The shear strength was found to decrease with increasing mortar bed thickness in the
diagonal tensile strength test. In this case there was clear trend of decrease in shear
strength with increasing joint thickness. The shear strength was also found to increase
with increasing mortar strength in both M60 and M95 mortar tests. But in this case,
the M60 tests gave higher shear strength values.

6 Masonry Tests at Sixth Scale, Results and Discussions
6-14
Overall, the results suggest that the effect of varying joint thickness is difficult to
quantify at this scale while it is possible to see the effect of increasing mortar strength
and different sand gradings.

6 Masonry Tests at Sixth Scale, Results and Discussions
6-15
Mortar Joint thickness Compressive COV% Stiffness Mortar Cube
Test Reference Type mm Strength, N/mm2 N/mm2 Strength, N/mm2
6C-A1-4 M95-iii 1.0 20.3 25.7 - 5.2
6C-B1-5 " 1.6 20.3 11.6 6000 4.7
6C-C1-4 " 2.5 20.1 8.9 - 5.2
6C-D1-4 M95-ii 1.6 22.6 4.6 9200 7.7
6C-E1-4 M95-iv " 16.7 15.5 4600 1.7
6C-F1-4 M60-iii " 18.0 13.6 - 7.3
6C-G1-4 M60-ii " 19.5 7.7 - 9.9
6C-H1-4 M60-iv " 15.3 23.8 - 1.8 Table 6.1- Summary of compressive strength test results.
Mortar Joint thickness Initial Shear Co-efficient Mortar Cube
Test Reference Type mm Strength, N/mm2of Friction Strength, N/mm2
6S-A1-12 M95-iii 1.0 0.35 0.78 3.66S-B1-12 " 1.6 0.60 0.85 5.56S-C1-12 " 2.5 0.34 0.65 3.66S-D1-12 M95-ii 1.6 0.58 0.65 6.16S-E1-12 M95-iv " 0.24 0.65 2.06S-F1-9 M60-iii " 0.19 1.16 4.7
6S-G1-12 M60-ii " 0.55 1.27 6.46S-H1-9 M60-iv " 0.16 1.15 1.7
Table 6.2- Summary of initial shear strength test results.
Mortar Joint Thickness Flexural Strength COV Mortar Cube
Test Reference Type mm N/mm2% Strength, N/mm2
6F-A1-5 M95-iii 1 1.13 44.3 5.56F-B1-5 " 1.6 1.24 31.6 4.86F-C1-5 " 2.5 0.99 18.0 5.06F-D1-5 M95-ii 1.6 1.76 13.9 6.26F-E1-5 M95-iv " 0.88 13.6 1.46F-F1-5 M60-iii " 1.34 18.1 4.16F-G1-5 M60-ii " 1.89 16.9 7.06F-H1-5 M60-iv " 0.74 7.9 1.5
Table 6.3- Summary of flexural strength parallel to bed joints test results.

6 Masonry Tests at Sixth Scale, Results and Discussions
6-16
Mortar Joint Thickness Flexural Strength COV Mortar Cube
Test Reference Type mm N/mm2% Strength, N/mm2
6F-I1-5 M95-iii 1 0.26 50.0 5.46F-J1-5 " 1.6 0.31 21.1 4.86F-K1-4 " 2.5 0.40 39.5 5.06F-L1-5 M95-ii 1.6 0.74 21.1 6.26F-M1-4 M95-iv " 0.22 66.4 1.46F-N1-5 M60-iii " 0.64 26.8 4.16F-O1-5 M60-ii " 0.77 35.5 7.06F-P1-2 M60-iv " 0.13 5.0 1.4
Table 6.4- Summary of flexural strength normal to bed joints test results.
Mortar Joint Thickness Bond Strength COV Mortar Cube
Test Reference Type mm N/mm2% Strength, N/mm2
6B-A1-8 M95-iii 1 0.93 25.7 5.16B-B1-7 " 1.6 0.73 28.1 3.66B-C1-8 " 2.5 0.88 35.5 5.16B-D1-7 M95-ii 1.6 0.89 24.3 5.26B-E1-8 M95-iv " 0.57 34.0 2.06B-F1-7 M60-iii " 0.48 30.7 4.46B-G1-7 M60-ii " 1.04 12.5 7.76B-H1-8 M60-iv " 0.50 20.2 1.7
Table 6.5- Summary of bond strength test results.
Mortar Joint thickness Shear Strength COV Mortar Cube
Test Reference Type mm N/mm2% Strength, N/mm2
6D-A1-4 M95-iii 1 0.94 22.6 5.1
6D-B1-4 " 1.6 0.63 7.2 4.1
6D-C1-4 " 2.5 0.67 18.5 5.4
6D-D1-4 M95-ii 1.6 0.92 26.3 6.7
6D-E1-5 M95-iv " 0.40 39.0 1.6
6D-F1-5 M60-iii " 1.02 26.2 4.4
6D-G1-5 M60-ii " 1.21 13.5 9.8
6D-H1-4 M60-iv " 0.44 11.0 2.0
Table 6.6- Summary of diagonal tensile (shear) strength test results.

6 Masonry Tests at Sixth Scale, Results and Discussions
6-17
0
6
12
18
24
30
0 0.5 1 1.5 2 2.5 3
Bed Joint Thickness, mm
Mas
onry
Str
engt
h, N
/mm
2
Figure 6.1- Effect of bed joint thickness on triplet masonry compressive strength.
0
5
10
15
20
25
0 2 4 6 8 10 12
Mortar Strength, N/mm2
Mas
onry
Str
engt
h, N
/mm
2
Test
Test
EC6
Figure 6.2- Effect of M95 mortar strength on triplet masonry compressive strength.
0
2000
4000
6000
8000
10000
12000
0 2 4 6 8 10
Mortar Strength, N/mm2
Mas
onry
Sti
ffn
ess,
N/m
m2
Figure 6.3- Variation of masonry stiffness with M95 mortar strength.

6 Masonry Tests at Sixth Scale, Results and Discussions
6-18
0
5
10
15
20
25
0 2 4 6 8 10 12
Mortar Strength, N/mm2
Mas
onry
Str
engt
h, N
/mm
2
TestTestEC6
Figure 6.4- Effect of M60 mortar strength on triplet masonry compressive strength.
0
5
10
15
20
25
0 2 4 6 8 10 12
Mortar Strength, N/mm2
Mas
onry
Str
engt
h, N
/mm
2
M95
M60
Figure 6.5- Effect different sand gradings on masonry compressive strength.
0.0
0.5
1.0
1.5
2.0
2.5
0.0 0.2 0.4 0.6 0.8 1.0 1.2
Precompression Stress, N/mm2
She
ar S
tren
gth,
N/m
m2
Figure 6.6- Shear strength/precompression stress relationship for benchmark test.

6 Masonry Tests at Sixth Scale, Results and Discussions
6-19
0.0
0.5
1.0
1.5
2.0
2.5
0.0 0.2 0.4 0.6 0.8 1.0 1.2
Precompression Stress, N/mm2
She
ar S
tren
gth,
N/m
m2
Figure 6.7- Shear strength/precompression stress relationship for 1mm bed joint test.
0.0
0.5
1.0
1.5
2.0
2.5
0.0 0.2 0.4 0.6 0.8 1.0 1.2
Precompression Stress, N/mm2
She
ar S
tren
gth,
N/m
m2
Figure 6.8- Shear strength/precompression stress relationship for 2.5mm bed joint
test.
0
0.2
0.4
0.6
0.8
0.0 0.5 1.0 1.5 2.0 2.5 3.0
Joint Thickness, mm
Init
ial S
hear
Str
engt
h, N
/mm
2
Figure 6.9- Variation of initial shear strength with joint thickness.

6 Masonry Tests at Sixth Scale, Results and Discussions
6-20
0.0
0.2
0.4
0.6
0.8
1.0
0.0 0.5 1.0 1.5 2.0 2.5 3.0
Joint Thickness, mm
Co-
effi
cien
t of
Fri
ctio
n
Figure 6.10- Variation of co-efficient of friction with joint thickness.
0.0
0.5
1.0
1.5
2.0
2.5
0.0 0.2 0.4 0.6 0.8 1.0 1.2
Precompression Stress, N/mm2
She
ar S
tren
gth,
N/m
m2
Figure 6.11- Shear strength/precompression stress relationship for M95ii test.
0.0
0.5
1.0
1.5
2.0
2.5
0.0 0.2 0.4 0.6 0.8 1.0 1.2
Precompression Stress, N/mm2
She
ar S
tren
gth,
N/m
m2
Figure 6.12- Shear strength/precompression stress relationship for M95iv test.

6 Masonry Tests at Sixth Scale, Results and Discussions
6-21
0
0.2
0.4
0.6
0.8
0 1 2 3 4 5 6 7
Mortar Cube Strength, N/mm2
Init
ial S
hear
Str
engt
h, N
/mm
2
Figure 6.13- Variation of initial shear strength with M95 mortar strength.
0.0
0.2
0.4
0.6
0.8
1.0
0 1 2 3 4 5 6 7
Mortar Cube Strength, N/mm2
Co-
effi
cien
t of
Fri
ctio
n
Figure 6.14- Variation of co-efficient of friction with M95 mortar strength.
0.0
0.5
1.0
1.5
2.0
2.5
0.0 0.2 0.4 0.6 0.8 1.0 1.2
Precompression Stress, N/mm2
She
ar S
tren
gth,
N/m
m2
Figure 6.15- Shear strength/precompression stress relationship for M60iii test.

6 Masonry Tests at Sixth Scale, Results and Discussions
6-22
0.0
0.5
1.0
1.5
2.0
2.5
0.0 0.2 0.4 0.6 0.8 1.0 1.2
Precompression Stress, N/mm2
She
ar S
tren
gth,
N/m
m2
Figure 6.16- Shear strength/precompression stress relationship for M60ii test.
0.0
0.5
1.0
1.5
2.0
2.5
0.0 0.2 0.4 0.6 0.8 1.0 1.2
Precompression Stress, N/mm2
She
ar S
tren
gth,
N/m
m2
Figure 6.17- Shear strength/precompression stress relationship for M60iv test.
0
0.2
0.4
0.6
0.8
0 1 2 3 4 5 6 7
Mortar Cube Strength, N/mm2
Init
ial S
hear
Str
engt
h, N
/mm
2
Figure 6.18- Variation of initial shear strength with M60 mortar strength.

6 Masonry Tests at Sixth Scale, Results and Discussions
6-23
0
0.3
0.6
0.9
1.2
1.5
0 1 2 3 4 5 6 7
Mortar Cube Strength, N/mm2
Co-
effi
cien
t of
Fri
ctio
n
Figure 6.19- variation of co-efficient of friction with M60 mortar strength.
0
0.2
0.4
0.6
0.8
0 1 2 3 4 5 6 7
Mortar Cube Strength, N/mm2
Init
ial S
hear
Str
engt
h, N
/mm
2
M60
M95
Figure 6.20- Effect of sand grading on initial shear strength.
0
0.3
0.6
0.9
1.2
1.5
0 1 2 3 4 5 6 7
Mortar Cube Strength, N/mm2
Co-
effi
cien
t of
Fri
ctio
n
M60
M95
Figure 6.21-Effect of sand grading on co-efficient of friction.

6 Masonry Tests at Sixth Scale, Results and Discussions
6-24
0
0.5
1
1.5
2
2.5
0 0.5 1 1.5 2 2.5 3
Joint Thickness, mm
Fle
xura
l Str
engt
h, N
/mm
2
Normal
Parallel
Figure 6.22- Effect of joint thickness on flexural strength.
0
5
10
15
20
25
0 0.1 0.2 0.3 0.4 0.5 0.6 0.7
σσσσNormal, N/mm2
σ
σ
σ
σ P
aral
lel / σ
σ
σ
σ
Nor
mal
Figure 6.23- Ratio of moduli in orthogonal directions for different bed joints tests.
0
0.5
1
1.5
2
2.5
3
0 2 4 6 8 10
Mortar Cube Strength, N/mm2
Fle
xura
l Str
engt
h, N
/mm
2
Normal
Parallel
Figure 6.24- Effect of M95 mortar strength on flexural strength.

6 Masonry Tests at Sixth Scale, Results and Discussions
6-25
0
2
4
6
8
10
12
0 0.2 0.4 0.6 0.8 1 1.2 1.4
σ σ σ σ Normal, N/mm2
σ
σ
σ
σ P
aral
lel /
σ
σ
σ
σ N
orm
al
Figure 6.25 – Ratio of moduli in orthogonal directions for M95 mortar test.
0
0.5
1
1.5
2
2.5
3
0 2 4 6 8 10
Mortar Cube Strength, N/mm2
Fle
xura
l Str
engt
h, N
/mm
2
Normal
Parallel
Figure 6.26- Effect of M60 mortar strength on flexural strength.
0
2
4
6
8
10
12
0 0.2 0.4 0.6 0.8 1 1.2 1.4
σ σ σ σ Normal, N/mm2
σσ σσ P
aral
lel /
σ
σ
σ
σ N
orm
al
Figure 6.27- Ratio of moduli in orthogonal directions for M60 tests.

6 Masonry Tests at Sixth Scale, Results and Discussions
6-26
0
0.5
1
1.5
2
2.5
3
0 2 4 6 8 10 12
Mortar Cube Strength, N/mm2
σ
σ
σ
σ p
aral
lel,
N/m
m2
M95
M60
M60
M95
Figure 6.28- Effect of sand grading on flexural strength parallel to bed joint.
0
0.2
0.4
0.6
0.8
1
0 2 4 6 8 10 12
Mortar Cube Strength, N/mm2
σ
σ
σ
σ N
orm
al, N
/mm
2
M95
M60
M95
M60
Figure 6.29- Effect of sand grading on flexural strength normal to bed joint.
0
0.3
0.6
0.9
1.2
1.5
0 0.5 1 1.5 2 2.5 3
Joint Thickness, mm
Bon
d St
reng
th,N
/mm
2
Figure 6.30- Effect of joint thickness on bond strength.

6 Masonry Tests at Sixth Scale, Results and Discussions
6-27
0
0.3
0.6
0.9
1.2
1.5
0 3 6 9
Mortar Cube Strength, N/mm2
Bon
d St
reng
th,N
/mm
2
Figure 6.31- Effect of M95 mortar strength on bond strength.
0
0.3
0.6
0.9
1.2
1.5
0 3 6 9
Mortar Cube Strength, N/mm2
Bon
d St
reng
th,N
/mm
2
Figure 6.32- Effect of M60 mortar strength on bond strength.
0
0.3
0.6
0.9
1.2
1.5
0 3 6 9
Mortar Cube Strength, N/mm2
Bon
d St
reng
th,N
/mm
2
M60
M95
M60
M95
Figure 6.33- Effect of sand grading on bond strength.

6 Masonry Tests at Sixth Scale, Results and Discussions
6-28
0
0.3
0.6
0.9
1.2
1.5
0 0.5 1 1.5
Bond Strength, N/mm2
σ
σ
σ
σ N
orm
al,N
/mm
2
1mm Bed Joint
1.6mm bed Joint
2.5mm Bed Joint
Figure 6.34- Effect of joint thickness on flexural strength/bond strength relationship.
0
0.5
1
1.5
2
0 0.5 1 1.5
Bond Strength, N/mm2
σ
σ
σ
σ N
orm
al,N
/mm
2
M95-ii
M95-iv
M95-iii
Figure 6.35- Effect of M95 mortar on flexural strength/bond strength.
0
0.5
1
1.5
2
0 0.5 1 1.5
Bond Strength, N/mm2
σ
σ
σ
σ N
orm
al,N
/mm
2
M60-ii
M60-iv
M60-iii
Figure 6.36- Effect of M60 mortar on flexural strength/bond strength.

6 Masonry Tests at Sixth Scale, Results and Discussions
6-29
0
0.3
0.6
0.9
1.2
1.5
-0.004 -0.003 -0.002 -0.001 0 0.001 0.002
Strain
Shea
r St
ress
, N/m
m2 6D-A1
6D-A2
6D-A3
Figure 6.37- Summary of shear stress/strain curves for diagonal tensile strength 1mm
joint test.
0.0
0.3
0.6
0.9
1.2
1.5
-0.004 -0.003 -0.002 -0.001 0 0.001 0.002
Strain
Shea
r St
ress
, N/m
m2 6D-B1
6D-B2
6D-B3
Figure 6.38- Summary of shear stress/strain curves for diagonal tensile strength
benchmark test.
0
0.3
0.6
0.9
1.2
1.5
-0.004 -0.003 -0.002 -0.001 0 0.001 0.002
Strain
Shea
r St
ress
, N/m
m2
6D-C1
6D-C2
6D-C4
Figure 6.39- Summary of shear stress/strain curves for diagonal tensile strength
2.5mm joint test.

6 Masonry Tests at Sixth Scale, Results and Discussions
6-30
0
0.3
0.6
0.9
1.2
1.5
-0.004 -0.003 -0.002 -0.001 0 0.001 0.002
Strain
Shea
r St
ress
, N/m
m2 6D-B1(1.6mm)
6D-A1(1mm)
6D-C1(2.5mm)
Figure 6.40- Shear stress/strain comparison for effect of joint thickness.
0
0.3
0.6
0.9
1.2
0 0.5 1 1.5 2 2.5 3
Joint Thickness, mm
Shea
r St
reng
th, N
/mm
2
Figure 6.41- Effect of joint thickness on shear strength.
0.0
0.3
0.6
0.9
1.2
1.5
-0.004 -0.003 -0.002 -0.001 0 0.001 0.002
Strain
Shea
r St
ress
, N/m
m2
6D-D1
6D-D2
6D-D4
Figure 6.42- Summary of shear stress/strain curves for diagonal tensile strength
M95-ii test.

6 Masonry Tests at Sixth Scale, Results and Discussions
6-31
0.0
0.3
0.6
0.9
1.2
1.5
-0.004 -0.003 -0.002 -0.001 0 0.001 0.002
Strain
Shea
r St
ress
, N/m
m2 6D-E1
6D-E2
6D-E3
Figure 6.43- Summary of shear stress/strain curves for diagonal tensile strength
M95-iv test.
0.0
0.3
0.6
0.9
1.2
1.5
-0.004 -0.003 -0.002 -0.001 0 0.001 0.002
Strain
Shea
r St
ress
, N/m
m2
6D-D1(M95-ii)
6D-B1(M95-iii)
6D-E1(M95-iv)
Figure 6.44- Comparison of shear stress/strain curves for the effect of varying grades
of M95 mortar.
0
0.4
0.8
1.2
1.6
0 5 10 15
Mortar Strength, N/mm2
Shea
r St
reng
th, N
/mm
2
Figure 6.45- Effect of increasing M95 mortar strength on shear strength.

6 Masonry Tests at Sixth Scale, Results and Discussions
6-32
0.0
0.3
0.6
0.9
1.2
1.5
-0.004 -0.003 -0.002 -0.001 0 0.001 0.002
Strain
Shea
r St
ress
, N/m
m2 6D-F1
6D-F2
6D-F3
Figure 6.46- Summary of shear stress/strain curves for diagonal tensile strength M60-
iii test.
0.0
0.3
0.6
0.9
1.2
1.5
-0.004 -0.003 -0.002 -0.001 0 0.001 0.002
Strain
Shea
r St
ress
, N/m
m2
6D-G1
6D-G2
6D-G3
Figure 6.47- Summary of shear stress/strain curves for diagonal tensile strength
M60-ii test.
0.0
0.3
0.6
0.9
1.2
1.5
-0.004 -0.003 -0.002 -0.001 0 0.001 0.002
Strain
Shea
r St
ress
, N/m
m2 6D-H1
6D-H2
6D-H3
Figure 6.48- Summary of shear stress/strain curves for diagonal tensile strength M60-
iv test.

6 Masonry Tests at Sixth Scale, Results and Discussions
6-33
0
0.3
0.6
0.9
1.2
1.5
-0.004 -0.003 -0.002 -0.001 0 0.001 0.002
Strain
Shea
r St
ress
, N/m
m2
6D-G1(M60-ii)
6D-F2(M60-iii)
6D-H1(M60-iv)
Figure 6.49- Comparison of shear stress/strain curves for the effect of varying M60
mortar grades.
0
0.4
0.8
1.2
1.6
0 2 4 6 8 10 12 14
Mortar Strength, N/mm2
Shea
r St
reng
th, N
/mm
2
Figure 6.50- Effect of increasing M60 mortar strength on shear strength.
0
0.4
0.8
1.2
1.6
0 5 10 15
Mortar Strength, N/mm2
Shea
r St
reng
th, N
/mm
2 M60M95M60M95
Figure 6.51- Effect of different sands on shear strength.

7 Application Study
7-1
7 Application Study
In order to test the applicability of small masonry models to real life problems, an
investigation by Roberts et al(128) into masonry behaviour relevant to the serviceability
requirement of masonry arch bridges was chosen as the prototype test. The prototype
test involved the testing of various arrangements of specimens in dynamic and static
loading.
7.1 Background
In masonry arches, the arch barrel, which is the main structural component, carries the
applied load principally through the induced axial compressive thrust. However, as
traffic moves over the bridge, the arch barrel may also be subjected to significant
reversed bending and shear forces. This may result in the arch barrel being subjected
to considerable cyclic stress ranges, which could affect the use of the bridge
adversely(129).
Recently there has been interest in the establishment of serviceability limits for
masonry bridges, BD 21/97(130) and Boothby et al(131). In BD 21/97 (1997), it is
suggested that the service load should be limited to 50% of the predicted ultimate
load. This conclusion is based on the results of numerous large and full scale tests,
which show that the load deflection response of masonry arch bridges remains
approximately linear up to 50% of the ultimate load. However, because of the
uncertainties in the material properties of masonry due to environmental effects,
theoretical predictions of the ultimate loads of masonry arch bridges are usually not
reliable(129).
In masonry arches the compressive force will generally be eccentric and in
approaching failure, the force on some units will be highly eccentric and these forces
will generally be concentrated on a small part of the surface area of the unit and form
a so called hinge(132). Various prototype studies(133, 134) have shown that the
compressive stress at failure under eccentric loading is greater than under axial
loading and further enhancement to the apparent compressive strength have been

7 Application Study
7-2
established under highly concentrated loads by other studies(132, 135). Therefore the
main objective of the application study was to investigate the effect of eccentric
concentrated loading on sixth scale masonry with a view to comparing it to the
prototype study by using static tests as a tool for the understanding of the overall
behaviour of masonry arches.
7.2 Masonry specimens
Only representative masonry specimens were considered in the study, this
corresponded to parts of an arch ring in a complete masonry arch. For the purpose of
this study a five unit high, sixth scale masonry specimen as shown in Figure 7.1 was
used. All the quality control and preparation procedures were as described for the
sixth scale model tests in Chapter 3 but using two mortar designations; designation iv
and designation v. These were weak mortars to better conform to existing old
structures. The proportions of the constituent elements used in the mortar are as given
in BS 5628(95) and the dry mass proportions in BS 4551(96) were used and are shown
in Table 7.1. All mortars were made using HST 95 sand. All the specimens were
allowed to cure normally in the laboratory after preparation and tested at or shortly
after 28 days of curing.
Other specimen formats were also used in the original study(128), but for the purpose
of the application study, only the five unit high stack bonded specimen was used. This
was because the objective was to see if it was feasible to conduct such tests at sixth
scale.
7.3 Testing
Testing was carried in a 20kN capacity testing machine under constant rate of
displacement of 0.25mm/min. Load was applied via an arrangement of 6mm steel
plates and 6mm steel bars as shown in Plate in 7.1. The specimens were also
supported on similar arrangement of plates and bars as used in applying the loads in
order to ensure uniform eccentricity from the centre of the specimens. Loads were
applied at four eccentricities of 0, 5, 9, and 14mm from the centre of the specimens.
This corresponds to e/d ratios of 0, 0.14, 0.25, and 0.39, where e is the eccentricity of
the load and d the length of the transverse section of the specimens as defined in
Figure 7.1.

7 Application Study
7-3
7.4 Stress calculations
The assumed stress blocks used in calculations are shown in Figure 7.2. For
concentric and eccentric loading within the middle third of the section the stress
distribution is as shown in Figure 7.2 (a). In this case the maximum compressive
stress mf is given by Equation 7.1
2
6
bd
Pe
bd
Pfm += (7.1)
Where P is the applied compressive force and bd is the loaded cross-section area
(width x depth)
When the eccentricity of load is beyond the middle third of the cross-section the
cracked triangular stress block in Figure 7.2 (b) was assumed. For this distribution,
equilibrium of external and internal forces entails that Equations 7.2 and 7.3 applies
Pbhfm =
2 (7.2)
Pehdbhfm =−322
(7.3)
Substituting for P in (7.3) gives Equations 7.4 and 7.5
−= ed
h2
3 (7.4)
bh
Pfm
2= (7.5)
The cracked triangular no tension distribution was chosen for this solution because it
gave an upper bound solution rather than the cracked parabolic no tension distribution
(not presented here).
7.5 Discussion of results
In the prototype test failure of the specimens was initiated by crushing and squeezing
of the mortar from the mortar joints followed by vertical splitting of the bricks as
shown in Plate 7.2.

7 Application Study
7-4
Figure 7.3 and 7.4 show the variation of compressive strength with load eccentricity
for mortar designation v. Both of the figures show that the compressive strength is
increased as the eccentricity is increases in line with findings by most authors, notably
Page and Hendry(136) who have even suggested design rules for concentrated loads
with varying eccentricities on masonry . The reason for the enhancement as suggested
by Drysdale and Hamid(133) is due to the strain gradient effect on the compressive
strength. They argued that the gradient of vertical compression strain across a brick
due to eccentricity of load will be accompanied by a corresponding tensile strain
gradient in the lateral direction. But because the tensile strength of masonry units are
affected by strain gradient (as shown by the greater flexural tensile strength in
comparison to the direct axial tensile strength), they concluded that the apparent
compressive strength should be higher for eccentrically loaded brickwork.
Typical failure of the specimens in the model study was usually characterised by
vertical splitting cracks under the load point as well as at the sides of the specimens.
This was followed by crushing of the loaded point in some cases. Plate 7.3 shows a
typical failure in one of the tests. In the case of the specimens with e/d of 0.39 there
were cases in which tension debonding was noticeable at the edge furthest from the
load point just before failure, in specimens made with both designation iv and
designation v mortar. Plate 7.4 shows the debonding on the tensile side in one of the
tests. This type of failure represents an elastic instability characterised by debonding
on the tensile side for loads with high eccentricity according Sahlin(11).
The results as tabulated in Tables 7.2 and 7.3 for tests using mortar designations iv
(test; S4) and v (test; S5) show a mixed picture as seen in Figures 7.5 and 7.6, which
show the variation of maximum compressive strength with e/d ratio for tests using
mortar designations iv and v, respectively. In Figure 7.5, it is seen that there is an
initial increase in strength from the point of zero eccentricity to point e/d = 0.14.
Followed by a decrease in strength from this point up to the last point e/d = 0.39.
While in Figure 7.6, there is an increase in strength from the point of zero eccentricity
up to the point e/d = 0.25 before decreasing at the last point e/d = 0.39. Therefore, as
seen from the trend lines in both figures there is only a marginal increase in
compressive strength as the eccentricity is increased for the eccentricities considered
(neglecting e/d = 0.39). But the actual compressive strength in the model tests was

7 Application Study
7-5
higher because of the higher model unit compressive strength, which is about 57%
higher than the prototype unit strength.
Figure 7.7 shows a comparison of the effect of eccentricity in the prototype and model
scale for the same mortar type. The vertical axis has been made dimensionless by
normalising it with respect to their (both prototype and model) respective compressive
strengths at zero eccentricity. It is seen from the figure that the fitted trend line for the
prototype test is significantly steeper than that for the model test. The ratio of their
gradients is 5.4 which is nearly equal to their scale ratio. From the foregoing it
therefore seems that in the S4 model test for e/d ratios of 0.25 and 0.39 (outside the
middle third of the section), the expected enhancement in compressive strength is not
seen while in the S5 model test strength enhancement does not hold for the e/d of
0.39. However since in the prototype tests the highest eccentricity used was 0.33 it
can still be argued that there is some agreement of the S5 test to the prototype test
since there is strength increase with load eccentricity within their comparable range of
eccentricities. The reason for the greater enhancement in the prototype over the model
scale is not certain, but it could to be due to the elastic instability characterised by the
cracking on the tension side of the model specimens before material failure in the
units. But since the geometries of the test specimens and load eccentricities for the
prototype and model tests are similar, the expectation was for a comparable
enhancement factor in the model test. It therefore seems that there is better agreement
between the failure mechanics of prototype and model specimens in axial
compression than in eccentric loading. This may be because it is difficult to model
mortar at very small scales because of the thinness of the joints. Because as we have
seen in Chapter 6 effects with regards to joint thickness are difficult to model at sixth
scale. The reason for this is not certain but it offers a possible area of further
investigation in the future.
7.6 Conclusions
The application study somewhat agrees with the prototype study for low eccentricities
therefore, strength enhancement is seen over the concentric compressive strength.
However this does not apply at higher eccentricities as specimens were noticed to fail
by elastic instability characterised by tension debonding of the top mortar joint.

7 Application Study
7-6
Mortar W/c ratioType
iv 2.50v 3.12I:1.5:13
Cement:lime:sandProportions
I:2:9
Table 7.1- Mortar proportions
Test Reference e/d Load, N Masonry Strength,N/mm2 Mean, N/mm2 Mortar Strength,Nmm2
S4-A1 0 9812 16.0S4-A2 0 8153 13.3S4-A3 0 6745 11.0S4-A4 0 6573 10.7S4-A5 0 8860 14.5 1.7S4-B1 0.14 4813 14.4S4-B2 0.14 6142 18.4S4-B3 0.14 7105 21.3S4-B4 0.14 5973 17.9S4-B5 0.14 5873 17.6S4-B6 0.14 6563 19.7 3.0S4-C1 0.25 3860 16.9S4-C2 0.25 4298 18.8S4-C3 0.25 3343 14.6S4-C4 0.25 4421 19.4S4-C5 0.25 4022 17.6S4-C6 0.25 2830 12.4 1.9S4-D1 0.39 1565 15.6S4-D2 0.39 1028 10.3S4-D3 0.39 1284 12.8S4-D4 0.39 1589 15.9S4-D5 0.39 1327 13.3S4-D6 0.39 1229 12.3 2.1
13.1(17.2)
18.2(12.6)
16.6(16.0)
13.4(15.9)
Table 7.2 – Test results for specimens made with designation iv mortar, S4, with COV in brackets

7 Application Study
7-7
Test Reference e/d Load, N Masonry Strength,N/mm2 Mean, N/mm2 Mortar Strength,Nmm2
S5-A1 0 7811 12.8S5-A2 0 6361 10.4S5-A3 0 8720 14.2S5-A4 0 8720 14.2S5-A5 0 5780 9.4S5-A6 0 7516 12.3 1.1S5-B1 0.14 7521 12.3S5-B2 0.14 4600 13.8S5-B3 0.14 4990 15.0S5-B4 0.14 5259 15.8S5-B5 0.14 6012 18.0S5-B6 0.14 2822 8.5 0.9S5-C1 0.25 3784 16.6S5-C2 0.25 3276 14.3S5-C3 0.25 2282 10.0S5-C4 0.25 3535 15.5S5-C5 0.25 2240 9.8S5-C6 0.25 5145 22.5 0.8S5-D1 0.39 1168 11.7S5-D2 0.39 638 6.4S5-D3 0.39 1643 16.4S5-D4 0.39 879 8.8S5-D5 0.39 708 7.1 1.1
12.2(16.2)
13.9(23.7)
14.8(32.0)
10.1(40.7)
Table 7.3- Test results for specimens made with designation v mortar, S5, with COV in brackets

7 Application Study
7-8
e
d =35.8
b =1
7.1
L =
60.
4
Figure 7.1- Dimensions of specimens in mm.
d
eP
f m
h
f m
eP
(a) (b)
Figure 7.2- Assumed stress distributions for eccentric loading (a) no tension (b) linear cracked.
0
5
10
15
20
25
0 0.1 0.2 0.3 0.4
e/d
Com
pre
ssiv
e S
tren
gth
,N/m
m2
Figure 7.3-Variation of compressive strength with e/d ratio for prototype test 1
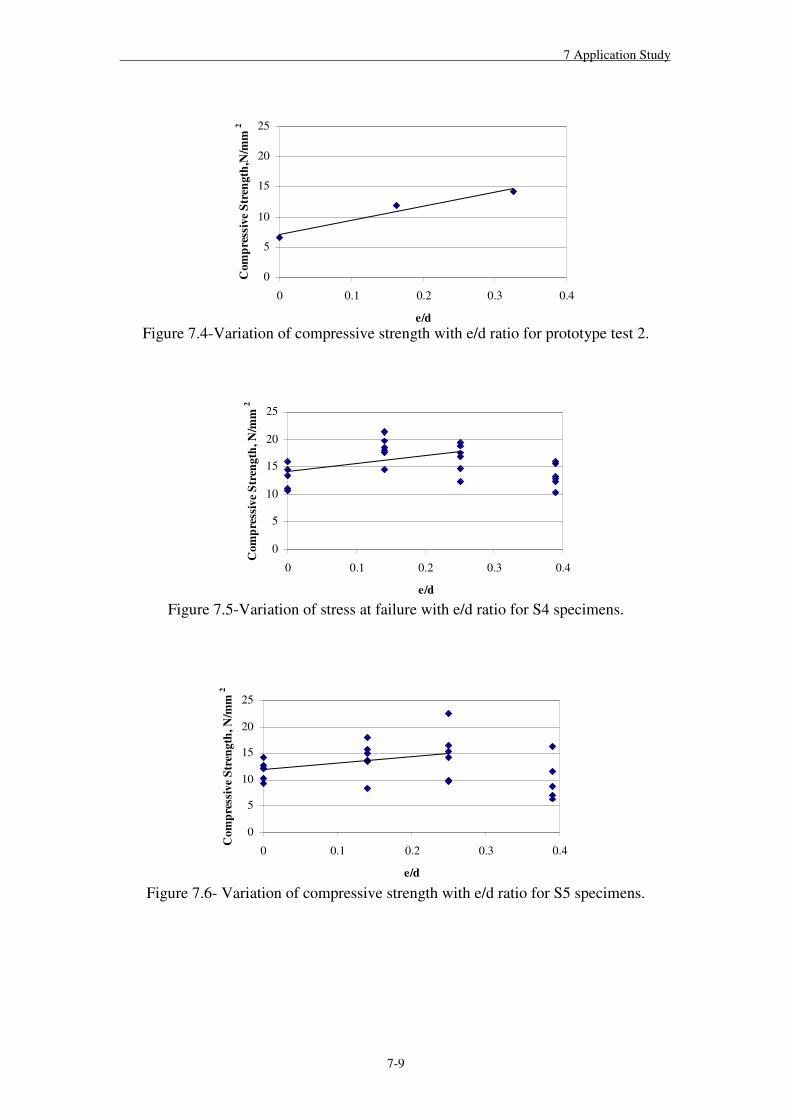
7 Application Study
7-9
0
5
10
15
20
25
0 0.1 0.2 0.3 0.4
e/d
Com
pre
ssiv
e S
tren
gth
,N/m
m2
Figure 7.4-Variation of compressive strength with e/d ratio for prototype test 2.
0
5
10
15
20
25
0 0.1 0.2 0.3 0.4
e/d
Com
pre
ssiv
e S
tren
gth
, N/m
m2
Figure 7.5-Variation of stress at failure with e/d ratio for S4 specimens.
0
5
10
15
20
25
0 0.1 0.2 0.3 0.4
e/d
Com
pre
ssiv
e St
reng
th, N
/mm
2
Figure 7.6- Variation of compressive strength with e/d ratio for S5 specimens.

7 Application Study
7-10
0
1
2
3
4
0 0.1 0.2 0.3 0.4
e/d
Com
pre
ssiv
e S
tren
gth
Rat
io
Model Test S5
Prototype test 1
Figure 7.7- Comparison of the effect of eccentricity in prototype and model test.

7 Application Study
7-11
Plate 7.1- Set up of model test at an eccentricity of 0.25.
Plate 7.2- Typical failure pattern in prototype tests.
Plate 7.3 - Typical failure pattern in model tests.

7 Application Study
7-12
Plate 7.4- Bond failure in top bed joint of model specimen at e/d of 0.39.

8 Conclusions and Recommendations
8-1
8 Conclusions and Recommendations
8.1 Conclusions
A programme of tests has been undertaken at various scales and under various loading
conditions in order to understand the structural behaviour of model masonry by
testing small masonry components with a view to determining the overall structural
behaviour of real masonry structures. Firstly, various standard tests were considered
on masonry at different scales, with a view to understanding masonry behaviour
across the scales considered. Secondly a parametric study of some factors the affect
masonry behaviour at model scale was considered at sixth scale. And finally an
application study was undertaken at model scale in order to compare the results to a
prototype study.
The tests have shown that model scale tests can be carried out in a repeatable manner
using sawn model bricks from the prototype. And some agreement of prototype and
model behaviour has been established.
In the compressive strength test, it was found that the masonry strength was primarily
influenced by the unit compressive strength. And generally the unit compressive
strength in the smallest model scales were higher than in the larger scales, resulting in
higher masonry strength in the smallest scales. There was evidence of anisotropy of
strength in clay brick masonry possibly due to the manufacturing process of extruded
clay units which consequently makes the direction of loading on a cut model brick a
significant factor.
Therefore the increase in the unit compressive strength in the smallest model scales
could be due to strength anisotropy and or the energetic size effect in quasi-brittle
materials like brick masonry. The compressive strength test data was also found to
closely follow the size effect laws of fracture mechanics (MFSL and SEL).
The stiffness of the triplet specimens in the compressive strength in the four scales
test, were similar to each other and no scale effect was observed. The prototype
masonry and model stiffness were in good agreement with the prototype and model
mortar stiffness respectively. This could due to the way the masonry specimens were

8 Conclusions and Recommendations
8-2
constructed, which has effectively negated any differential compaction of the joints
due to the different weight of the unit in the four scales. The good agreement of the
masonry stiffness in the four scales is significant because tests by other researchers
showed a much softer model response to the prototype under uniaxial compression.
In all other masonry tests; shear strength, flexural strength, bond strength, and
diagonal shear strength tests, no significant size effect was observed in the tests. This
may be because in most of the tests, joint failure dominates, and because of the way
the specimens were constructed, the scale effects were effectively cancelled. Another
stronger reason could be that the general scale of the tests was in size range where the
strength criterion applies which implies a zero size effect. The size effect laws were
also found to be applicable to the data from all the tests which suggest a strong reason
for the incorporation of size effect formulae in design codes to aid designers in
predicting strengths of real structures from laboratory specimens.
In the parametric tests conducted at sixth scale to look at the effect of some factors on
the strength of masonry, some of the more important findings were;
No noticeable effect was seen with regards to increasing mortar joint thickness in the
compressive strength test, initial shear strength test, bond strength test and the flexural
strength test, but there was a decrease in the shear strength as the joint thickness was
increased in the diagonal shear strength test. Therefore it could be argued that
different joint thicknesses do not significantly affect the strength of model masonry.
However, increasing mortar strength was found to increase the masonry strength in all
the five tests and for both types of sands. The effect of the different sand gradings for
the tests having mortar with finer grading of sand mainly resulted in a higher masonry
strength in the compressive strength test, initial shear strength test and the bond
strength test but slightly lower masonry strength in the flexural strength and diagonal
tensile strength tests. Because of this mixed picture it is difficult to give a definite
effect of the sand grading on all the tests, perhaps the effect of sand grading is
different for the various tests.
In the application study, there was some agreement in the results for the comparable
range of eccentricities in the prototype and model tests however the effect of
eccentricity was far more significant in the prototype test by a factor of 5.4 which

8 Conclusions and Recommendations
8-3
happens to be somewhat close to the scale factor of 6, between the prototype and sixth
scale model. Most prototype studies in this area have reported a marked increase in
masonry strength with increasing eccentricity. This could be due to the model
masonry developing high tensile stresses that could have resulted in an elastic
instability before failure in the units. This may explain the observed bond failure in
some specimens while there were no visible cracks in the units, in tests with the
highest load to eccentricity ratios.
Overall the study has shown it is possible to model prototype behaviour at model
scales of down to one sixth scale. And, that apart from the compressive strength of
masonry which could be influenced by the energetic scale effect or anisotropy of
units, all other tested strength properties, namely; flexural strength, initial shear
strength, bond strength and shear strength seemed not to be significantly influenced
by scale. The parametric study has also shown encouraging results on the effect of
increasing mortar strength and different grading of sands. Which all suggest that
masonry models can be used to provide useful strength properties that could be used
to simulate structural behaviour of whole masonry structures (for example model
bridges) by using numerical models.
8.2 Recommendations
• Because of constraints in accurately and consistently constructing the masonry,
the horizontal laying technique was used in this case, it is suggested that a future
study should look into specific areas covered in this study but using the normal
way of constructing masonry in carrying out the masonry tests at different scales.
• It is suggested that more tests are carried out in the area of characterisation of
masonry properties using fracture mechanics. Much stands to be gained from the
fracture mechanics properties of masonry in areas like the mechanics of crack
growth in masonry under compression, incorporating of size effect formula in
design codes etc.
• Further research is also suggested into the modelling of concentred loads with
different eccentricities at model scales in order to establish the possible reasons
for the elastic instability of the specimen seen in the application study.

REFRENCES
1. Kerr R. Flood aftermath still being felt. 2006 [cited; Available from: http://news.bbc.co.uk/1/hi/england/cumbria/4583364.stm
2. Caglar A. Earthquake research groups seek lessons from Bam earthquake. 2004[cited; Available from: http://www.parstimes.com/news/archive/2004/washfile/quake_construction_codes.html
3. Taunton PR. Centrifuge modelling of soil/masonry structure interaction [PhD]: Cardiff University, UK; 1997.
4. Burroughs PO. A study of parameters that influence the strength of masonry arch bridges using a geotechnical centrifuge. [PhD]: Cardiff University, UK; 2002.
5. Baralos P. The small scale modelling of repair techniques for masonry arch bridges using a geotechnical centriguge. [PhD]: Cardiff University UK; 2002.
6. Miri M. Modelling of repair techniques for masonry arch bridges [PhD]. Cardiff: Cardiff University; 2005.
7. Sneck T. Dependence of masonry properties on the interaction between masonry units and mortar. Proceedings of the North American masonry Conference. Colorado; 1978. p. 21-1 to -12.
8. Brocken HJP, Spiekman ME, Pel L, Kopinga K, Larbi JA. Water extraction out of moratr during brick laying: A NMR study. Materials and Structures. 1998;31:49-57.
9. Harvey RJ. Creep of concrete masonry. Cardiff: Cardiff University; 1996.
10. Lenczner D. Elements of loadbearing brickwork. Oxford: Pergamon press; 1972.
11. Sahlin S. Structural Masonry. New Jersey: Prentice-Hall; 1971.
12. Harris B, Bunsell AR. Structure and properties of engineering materials. London: Longman; 1977.
13. Moss JB. Properties of Engineering Materials. London: Butterworth; 1971.
14. Hendry AW, Sinha BP, Davies SR. Design of masonry structures. 3rd ed. London: E & FN Spon; 1997.
15. Anderson C, Held LC. The effect of sand grading on mortar properties and the tensile bond of brickwork specimens. Proceedings of the British Masonry Society, No 1; 1986; Stoke on Trent; 1986. p. 1-5.
16. Hilsdorf HK. Investigation into the failure mechanism of brick masonry loaded in axial compression. In: Jonson FB, editor. Designing ,Engineering and Constructing with masonry Products; 1969. p. 34-41.
17. Berto L, Saetta A, Scotta R, Vitaliani R. Failure mechanism of masonry prism loaded in axial compression: computation aspects. Materials and Structures. 2005;38:249-56.

18. McNary WS, Abrams DP. Mechanis of masonry in compression. Journal of Structural Engineering. 1985 857-870;111(4).
19. Hendry AW. Structural Masonry. 2nd ed. London: Macmillan Press; 1998.
20. Francis AJ, Horman CB, Jerrems LE. The effect of joint thickness and other factors on the compressive strength of brickwork. In: West HWH, Speed KH, editors. Proceedings of 2nd International brick masonry conference; 1971; Stoke on Trent, UK; 1971. p. 31-7.
21. Porto Fd, Garbin E, Modena C, Valluzzi MR. Failure modes for in plane loaded masonry walls made with thin layer mortar. 10th Canadian Masonry Symposium 2005; Banff, Canada; 2005. p. 694-703.
22. CEN. Eurocode 6 : Design of Masonry Structures .ENV 1996 -1-1. Brussels: European Committee For Standardisation; 1995.
23. Plowman JM. The modulus of elasticity of brickwork. Proceedings of the British Ceramic Society; 1965; 1965. p. 37-44.
24. Shrive NG, Jessop EL. Anisotropy in extruded clay units and its effect on masonry behaviour. Proceedings of the 2nd canadian masonry Symposium; 1980; Ottawa; 1980. p. 39-50.
25. Jessop EL, Shrive NG, England GL. Elastic and creep properties of masonry. Proceedings of the North American Masonry Conference. Colorado; 1978. p. 12-1 to -7.
26. Brooks JJ, Baker BHA. The modulus of elastcity of masonry. Masonry International. 1998 58-63;12(2).
27. BSI. BS 5628. Code of practice for use of masonry: Part 2: Structural use of unreinforced masonry. British Standards Institution; 1995.
28. Knutsson HH, Nielsen J. On the modulus of elasticity of masonry. Masonry International. 1995;9(2):57-61.
29. Riddington JR, Ghazali MZ. Hypothesis for shear failure in masonry joints. Proceedings Institution of Civil Engineers. 1990;Part 2:89-102.
30. Jukes P, Riddington JR. The failure of brick triplet specimens. Masonry International. 2001;15(1):30-3.
31. BS EN 1052-3:2002 Methods of test for masonry- Part 3: Determination of initial shear strength.: British Standards Institution; 2002.
32. Lourenco PB. A review of out-of-plane behaviour of masonry. Masonry International. 2001;14(3):67-73.
33. Sise A, Shrive NG, Jessop EL. Flexural bond strength of masonry stack prisms. Proceedings of the British Masonry Society, Masonry (2); 1988 April 1988; 1988. p. 103-6.
34. Fried AN, Li S. The influence of unit moisture content on masonry flexural strength. In: Huizer NGSaA, editor. Proceedings of the 10th IB2MAC; 1994; Calgary; 1994. p. 939-45.
35. Taha MMR, Lucero JL, Ross TJ. Examining the significance of mortar and brick unit properties on masonry bond strength using bayesian model screening. 10th Canadian Masonry Symposium; 2005; Banff, Canada; 2005. p. 742-51.

36. Groot CJWP. Aspects of brick-mortar bond. Proceedings of the 8th IB2MaC; 1988; Dublin, Ireland.; 1988. p. 175-81.
37. Shrive NG, Taha MMR. Bond strength of clay masonry prisms constructed with normal and fly ash substituted mortars. Proceedings of the 13th IB2MaC; 2004; Amsterdam; 2004.
38. Jukes P, Riddington JR. A review of masonry tensile bond strength test methods. Masonry International. 1998;12(2):51-7.
39. BSI. BS EN 1052-5:2005: Methods of test for masonry- Determination of bond strength by the bond wrench method.: British Standards Institution; 2005.
40. Janney JR, Breen JE, Geymayer H. Use of models in structural Engineering. Models for concrete structures, ACI SP-24, American Concrete Institue, Detriot. 1970:1-18.
41. Harris GH, Sabnis GM. Structural Modelling and Experimental Techniques. 2nd ed. Florida: CRC Press LLC; 1999.
42. Collins AR. The origins and design of the attack on the German dams. Proceedings of the Institute of civil Engineers; 1982 June; 1982. p. 383-405.
43. Vogt H. Considerations and investigations on the basic principles of model tests for brickwork and masonry structures. Translated from German. Garston: Building Research Station; 1956. Report No.: Library communication No 932,.
44. Hendry AW, Murthy CK. Comparative tests on 1/3 and 1/6 scale model brickwork piers and walls. Proceedings of the British Ceramic Society, No 4; 1965. p. 45-66.
45. Sinha BP, Hendry AW. The effect of brickwork bond on the load bearing capacity of model brickwalls. Proceedings of the British Ceramic Society; 1968; 1968. p. Pp 55-67.
46. Sinha BP, Hendry AW. Further tests on model brickwork and piers. Proceedings of the British Ceramic Society, No 7; 1970 February; 1970. p. 83-95.
47. Khoo CL, Hendry AW. Strength tests on brick and mortar under comple stresses for the development of a failure criterion for brickwork in compression. Proceedings of the British Ceramic Society, Lad bearing brickwork; 1973; 1973. p. 51-6.
48. Samarashinghe W, Hendry AW. The strength of brickwork under biaxial and compressive stresses. Proceedings of the 7th International Symp Load bearing brickwork; 1980; London; 1980. p. 129-39.
49. Samarasinghe W, Page AW, Hendry AW. A finite element model for the in-plane behaviour of brickwork. Proceedings of the Institute of Civil Engineers; 1982 March; London; 1982. p. 171-8.
50. Page AW. The biaxial compressive strenth of brickwork. Proc Instn Civ Engrs; 1981; 1981. p. 893-906.
51. Egermann R, Cook DA, Anzani A. An investigation into the behaviour of scale model brick walls. Proceedings of the 9th International Brick/Block Masonry Conference; 1991; Berlin; 1991. p. 628-35.

52. Hughes TG, Kitching N. Small Scale testing of masonry. Proceedings of the12th International Brick Block Masonry Conference; 2000 25-28 June; Madrid,Spain; 2000. p. 893-202.
53. Murthy CK, Hendry AW. Model experiments in load bearing brickwork. Building Science. 1966;1:289-98.
54. Kalita UC, Hendry AW. An experimental and thoeretical investigation of the stresses and deflections in model cross-wall structures. Proceedings of the International brick masonry conference. Stoke on trent; 1970.
55. Sinha BP, Maurenbrecher AHP, Hendry AW. Model and full cale tests on a five-storey croass-wall structure undwer lateral loading. Proceedings of the second International brick Masonry Conference; 1970; Londom; 1970. p. 201-8.
56. Baker LR. Manufacture and testing of model brickwork wind panels. Structural Models conference,. Sydney , Australia; 1972.
57. Duarte RB, B.P.Sinha. Lateral strength of brickwork panels with openings. Proceedings Institution of Civil Engineers, Structure and Buldings, Vol 94; 1992; 1992. p. 397-402.
58. Lourenco PB, Barros JAO. Size effect on masonry subjected to out of plane loading. 12th International Brick/Block Masonry Conference. Spain; 2000.
59. Suter GT, Keller H. Reinforced brickwork lintel study utilizing small scale bricks. Proceedings of the North American masonry Conference. Colorado; 1978.
60. Daou Y, Hobbs B. An experimental investigation of post-tensioned brickwork in fin walls. Proceedings of the Instituion of Civil Engineers, Structures and Buildings; 1992 Nov 1992; 1992. p. 429-38.
61. Qamaruddin M, B.Chandra, Arya AS. Dynamic testing of brick building models. Proceedings of the Institution of Civil Engineers; 1984; 1984. p. 353-65.
62. Tomazevic M, Weiss P. Seismic behaviour of masonry buildings: reinforced versus unreinforced masonry. Proceedings of the 9th International Brick/Block Conference, Berlin; 1991; Berlin; 1991. p. 552-9.
63. Kwan AKH, Xia JQ. Shake table tests of large-scale shear wall and infilled frame models. Proceedings of the Institute of civil Engineers; 1995; 1995. p. 66-77.
64. Alexandropoulos S. An Experimental investigation of the static and dynamic behaviour of masonry assemblages using small scale models. London: University of London; 1996.
65. Zonta D, Zanardo G, Modena C. Experimental evaluation of the ductility of a reduced scale reinforced masonry building. Materials and Structures. 2001;Vol 34:636-44.
66. Hughes TG, Davies MCR, Taunton PR, Burroughs PO. Centrifuge testing of small scale masonry. Masonry International. 2002;Vol 15(No 3):80-6.
67. Sicilia C. A study of 3D masonry arch structures using centrifuge models and FE analysis.: PhD thesis, Cardiff University, UK; 2001.
68. Bazant ZP. Scaling of structural strength. London: Hermes Penton Ltd; 2002.
69. Sabnis GM. Size effects in material systems and their impact on model studies: A theoritical approach. Proceedings of SECTAM X conference. Knoxville, TN; 1980. p. 649-68.
70. Bazant ZP. Size effect. International Journal of Solids and Structures. 2000;37:69-80.
71. Bazant ZP. Size effect in blunt fracture: concrete, rock, metal. Journal of Engineering Mechanics, ASCE. 1984;110:518-35.
72. Lourenco PB. Two aspects related to the analysis of masonry structures: size effect and parameter sensitivity.: Delft University of Technology Faculty of Civil Engineering
1997. Report No.: 97-NM-R1533.
73. Carpenteri A, Chiaia B. Embrittlement and decrease of apparent strength in large-sized concrete structures. Sadhana. 2002;Part 4(27):425-48.
74. Bazant Z, Yavari A. Is the cause of size effect on structural strength fractal or energetic-statistical.? Engineering fracture mechanics. 2005(72):1-.31.
75. RILEM. RILEM TC QFS - Quasibrittle frcature scaling and size effect- Final report. Materials and Structures. 2004 October 2004;37:547-68.
76. Carpenteri A, Chiaia B. Multifractal scaling law for the fracture energy variation of concrete structures. In: Wittmann FH, editor. Proceedings FRAMCOS-2; 1995; Freiburg, Germany: Aedificatio Publishers; 1995. p. 581-96.
77. Carpenteri A. Fractal nature of material microstructure and size effects on apparent mechanical properties. Mechanics of materials. 1994(18):89-101.
78. Carpenteri A, Ferro G. Size effects on tensile fracture properties: a unified explanation based on disorder and fractality of concrete microstructure. Materails and Structures. 1994(27):563-71.
79. Karihaloo BL. Size effect in shallow and deep notched quasi-brtittle structures. International Journal of fracture. 1999;95:379-90.
80. Abdalla HM. Strength size effect in concrete structures. Cardiff: Cardiff University; 2003.
81. Karihaloo BL, Abdalla HM, Xiao QZ. Size effect in concrete beams. Engineering fracture mechanics. 2003;70:979-93.
82. Bocca P, Carpinteri A, Valente S. Fracture mechanics of brick masonry: size effects and snap-back analysis. Materials and Structures. 1989(22):364-73.
83. Olivito RS, Stumpo P. Fracture mechanics in the characterisation of brick masonry structures. Materials and Structures. 2001;34:217-23.
84. Carpenteri A, Chiaia B, Bocca P. Size dependence of strength and fracture properties of brick masonry. Journal of Engineering Mechanics, ASCE. 1997;123(8).
85. RILEM. FMC 1. Determination of the fracture energy of mortar and concrete by means of three-point bend tests on notched beams. RILEM. London: E & FN Spon; 1994.

86. Lourenco PB. Simulations of size effect in masonry structures. In: Mihasi H, Rokugo K, editors. Proceedings FRAMCOS-3; 1998; Freiburg, Germany; 1998. p. 2001-10.
87. Sabnis GM, Aroni S. Size effect in Material systems- The state of the art. Proceedings of the Southampton 1969 Civil Engineering Materials Conference. Southamptom; 1971. p. 131-42.
88. Shrive NG. The Prism test as a measure of masonry strength. Proceedings of the British Masonry Society, No 1; 1986. p. 117-21.
89. BS EN 1052-1:1999 Methods of test for masonry- Part 1: Determination of compressive strength. London: British Standards Institution; 1999.
90. Fried A, Anderson C. A comparative study of experimental techniques for determing the flexural strength of masonry. Proceedings of the British Masonry Society, Masonry (2); 1988 April 1988; 1988. p. 98-102.
91. BS EN 1052-2:1999 Methods of test for masonry- Part: Determination of flexural strength. British Standards Institution; 1999.
92. Jukes P, Riddington JR. A review of masonry joint shear strength tests methods. Masonry International. 1997;11(2):37-43.
93. RILEM. LUM B6 : Diagonal tensile strength of small wall specimens. RILEM Technical recommendation for the testting and use of construction materials. London: E & FN SPON; 1994. p. 488-9.
94. Lawrence SJ, Page AW. Bond studies in masonry. Proceedings of the 10th IB2MaC; 1994; Calgary, Canada.; 1994. p. 909-17.
95. BS 5628. Code of practice for use of masonry: Part 2: Structural use of unreinforced masonry. British Standards Institution; 1995.
96. BS 4551: Part 1:1998. Methods of testing mortars, screeds and plasters. London: British Standards Institution; 1998.
97. Mohammed A, Hughes TG. Comparison of prototype and 1/6th model scale behaviour under compressive loading. 10th Canadian masonry symposium; 2005 June 8-12, 2005; Banff, Canada; 2005. p. 454-64.
98. Eurocode 6 : Design of Masonry Structures .ENV 1996 -1-1. Brussels: European Committee For Standardisation; 1995.
99. BSI. BS EN 13139:2002. Aggregates for mortar. London: British Standards Institution; 2002.
100. BSI. BS EN 197-1:2000. Cement. Composition, specifications and conformity criteria for common cements. London: British Standards Insititution; 2000.
101. BSI. BS EN 459-1:2001. Building lime. Definitions, specifications and conformity criteria. London: British Standards Institution; 2001.
102. BSI. BS 3921:1985. Specification for clay bricks. London: British Standards Institution; 1985.
103. BSI. BS EN 772-1:2000. Methods of Tests for masonry units- Part 1: Determination of compressive strength. London: British Standards Institution; 2000.

104. RILEM. LUM A2. Flexural Strength of masonry units. RILEM technical recommendations for the testing and use of construction materials. London: E & FN Spon; 1994. p. 459-61.
105. RILEM. LUM A3. Indirect tensile strength of masonry units (splitting test). RILEM Technical Recommendations for the testing and use of construction materials. London: E & FN Spon; 1994. p. 462-4.
106. RILEM. LUM A4. Water absorption and porosity of masonry units. RILEM Technical Recommendations for the testing and use of construction materials. London: E & FN Spon; 1994. p. 465-6.
107. Taha MMR, El-Delb AS, Shrive NG. Sorptivity: A reliable measurement for surface absorption of masonry brick units. Materials and Structures. 2001 August- September;34:438-45.
108. Baker MG. Finite element analysis of masonry with application to arch bridges. [PhD]: University of Wales Cardiff; 1996.
109. Wittmann FH. Fracture mechanics of concrete Amsterdam: Elsevier; 1983.
110. BSI. BS EN 1015-11:1999. Methods of tests for mortar for masonry- Part 11: Determination of flexural and compressive strength of hardened mortar. London: British Standards Institution; 1999.
111. BS EN 13139:2002. Aggregates for mortar. London: British Standards Institution; 2002.
112. BS EN 1015-11:1999. Methods of tests for mortar for masonry- Part 11: Determination of flexural and compressive strength of hardened mortar. London: British Standards Institution; 1999.
113. Karihaloo B. Fracture mechanics and structural concrete. London: Longman; 1995.
114. Barr B, Lee M, Hansen EdP, Dupont D, Erdem E, Schnutgen SSB, et al. Round-robin analysis of the RILEM TC 162-TDF beam bending test: Part 2- Approximation of δ from the CMOD response. Materials and Structures. 2003;36:6221-630.
115. BSI. BS 4551: Part 1:1998. Methods of testing mortars, screeds and plasters. London: British Standards Institution; 1998.
116. RILEM. MR 2. Determination of mortar consistence. RILEM Technical Recommendations for the testing and use of construction materials. London: E & FN Spon; 1994.
117. RILEM. MR 3. Workability, consistence, plasticity of mortars. RILEM Technical Recommendations for the testing and use of construction materials. London: E & FN Spon; 1994.
118. Maurenbrecher AHP. The effect of test procedures on compressive strength of masonry prisms. Proceedings of 2nd Canadian Masonry Symposium; 1980; Ottawa; 1980. p. 119-31.
119. Templeton W, Edgell GJ. The compressive strength of clay bricks ground or mortar capped. Masonry International. 1990;4(2):66-7.

120. Edgell GJ, Vekey RCD, Dukes R. The compressive strength of masonry specimens. In: West HWH, editor. Proceedings of the British Masonry Society 4; 1990; 1990. p. 131-5.
121. RILEM. LUM B3: Bond strength of masonry using the bond wrench method. RILEM: Technical recommendations for the testing and use of construction materials. London: E & FN SPON 1994. p. 481-3.
122. MRSEC. Exploring the nano world with LEGO Bricks. The University of Wisconsin - Madison Materials Research Science and Engineering Center (MRSEC); 2001.
123. Long L, Hamid AA, Drysdale RG. Small-scale modelling of concrte masonry using 1/2 scale units: A preliminary study. 10th Canadian Masonry symposium; 2005; Banff, Canada; 2005. p. 484-93.
124. Edgell GJ, Arora SK, Vekey RCD. Analysis of results of compressive strength testing. Proceedings of the British Masonry Society, No 6; 1994. p. 147-64.
125. BSI. BS EN 1052-1:1999 Methods of test for masonry- Part 1: Determination of compressive strength. London: British Standards Institution; 1999.
126. Khalaf FM, Hendry AW. Masonry unit shape factor from test results. In: West HWH, editor. Proceedings of the British Masonry Society (6). Stoke on Trent; 1994. p. 136-9.
127. Bazant ZP, Frangpool DM. Size effect hidden in excessive dead load factor. Journal of Structural Engineering. 2002;128(1):80-6.
128. Roberts TM, Hughes TG, Dandamudi VR. Progressive damage to masonry arch bridges caused by repeated traffic loading- Phase 2. Cardiff: Cardiff University; 2004.
129. Roberts TM, Hughes TG, Goutis G. Progessive damage to masonry arch bridges caused by repeated traffic loading. Cardiff: Cardiff University; 2003.
130. BD 21/97 Design manual for roads and bridges. Vol 3: Sect 4: Part 3: The assesment of highway bridges and structures.: Department of Transport; 1997.
131. Boothby TE, Domalik DE, Dalal VA. Service load response of masonry arch bridges. Journal of Structural Engineering, ASCE. 1998;124(1):17-23.
132. Hendry AW. Masonry properties for assessing arch bridges.: Transport and Road Research Laboratory; 1990. Report No.: Contractor Report 244.
133. Drysdale RC, Hamid AA. Effect of eccentricity on the compressive strength of brickwork. Journal of Brtitish Ceramic Society. 1982;30:140-48.
134. Martinez JL, Martin-Caro JA, Leon J. Masonry compressive strength enhancement under eccentric axial load. In: Roca P, Molins C, editors. Arch Bridges IV; 2004; Barcelona; 2004. p. 405-12.
135. Arora SK. Performance of masonry walls under concentrated load. Proceedings of the British Masonry Society No 2, Masonry 2; 1988; London; 1988. p. 51-5.
136. Page AW, Hendry AW. Design rules for concentrated loads on masonry. The Structural Engineer. 1988;66(17):273-81.

oDA.
1
Nσ
APPENDIX A
SIZE EFFECT CALCULATIONS FOR COMPRESSIVE STRENGTH TEST
Considering D is the reference structural size, in this case the specimen width as shown in Figure A.1 and Nσ is the nominal load at failure as defined in Equation A.1.
Equation A.1
Where Cn is a dimensionless constant taken as 1 and Pu is the ultimate load at failure.
Also considering that, in section 2.6.3 it has been discussed that the SEL (Equation
2.6) can be represented in terms of Equations 2.7 and 2.8. Where X = D and
2)(
1
N
Yσ
=
Using the data from the compressive strength test as represented in Table A.1, a plot
of Y against X can be made as shown in Figure A1.2.
From which the intercept C and the slope A can be determined and from Equation 2.8
Do = C/A = 7.667
By knowing Do, Boft can then be evaluated from Equation 2.8.
Boft = = 20.85.
from Equation 2.6 can then be calculated, since Boft and Do are now known. The
SEL plot using Equation 2.6 for the compressive strength data is shown in Figure
5.23. A similar procedure was followed for determining the MFSL plot for the
compressive strength test data in Figure 5.23 as well as for the other tests.
2D
PC unN =σ

D N 1/(σN)2
215 5.12 0.038215 3.87 0.067215 4.17 0.058215 4.22 0.056215 4.46 0.05096.8 5.77 0.03096.8 5.61 0.03296.8 4.64 0.04696.8 5.23 0.03796.8 4.89 0.04253.8 12.07 0.00753.8 10.29 0.00953.8 10.56 0.00953.8 11.89 0.00753.8 9.83 0.01035.8 11.40 0.00835.8 9.11 0.01235.8 10.29 0.00935.8 9.12 0.01235.8 8.63 0.013
Table A.1
D
Figure A.1- Triplet compressive strength specimen
y = 0.0003x + 0.0023
0
0.02
0.04
0.06
0.08
0 50 100 150 200 250
D, mm
σσ σσN
-2, (
N/m
m2 )-1
C
A1
Figure A.2- Determination of A and C using the SEL.


![Brickwork 2009 [Compatibility Mode]](https://img.dokumen.tips/doc/110x75/577cde0a1a28ab9e78ae45ec/brickwork-2009-compatibility-mode.jpg)
