Embed Size (px)
Citation preview

Thesis Proposal: Developing a Decision-Theoretic User Model for
Automatic Customization
Bowen Hui
November 14, 2008
1 Overview
This thesis focuses on the development of a decision-theoretic approach to user modeling in the context of
automatic interface customization. The modeling aspects of this work are grounded in artificial intelligence
(AI), while the empirical methodology is grounded in human-computer interaction (HCI). The publications
produced as part of this thesis have focused mostly on developing new models that are populated and
tested with real user data. As such, the contributions of this thesis lie in the intersection of AI and HCI.
1.1 The Problem of Intelligent Customization
Intelligent software customization has become increasingly important as users are faced with larger, more
complex applications. For a variety of reasons, software must be tailored to specific individuals and
circumstances [12]. For example, adaptive interfaces are critical as different users may require different
functionality from multi-purpose software [1], prefer different modes of interaction, or use software on
a variety of hardware devices [4]. Because of this complexity, online and automated help systems are
becoming increasingly prevalent in helping users identify and master different software functions [6]. Such
systems should ideally adapt the help they provide and the decision to interrupt [5] to account for specific
user preferences. In this thesis, we focus on intelligent interface customization where the attributes of
software functionality (e.g., location of functions, presentation features of widgets, ability to ask questions
or make suggestions) automatically adapts to user preferences. We view this work as a way to help users
interact with software more efficiently and seamlessly.
Generally speaking, the objectives of intelligent customization assistance are to minimize user effort
and/or to maximize the ease of interaction during system-user interaction. The majority of the work in
this area, and more broadly in the area of user modeling, focuses on the first objective by predicting the
1

user’s goal and tailoring the application to help the user with that goal. Since there are often multiple
ways to achieve the same goal, some of these approaches use the history of interaction to build a model of
how the user prefers to carry out goals and auto-complete them on the user’s behalf (e.g., [4] in the domain
of interface customization). However, since different people prefer different kinds of help under different
circumstances, we need to account for the influence that a user’s attitudes or traits have on accepting help
from adaptive systems. Likewise, since different modes of adaptation — such as suggesting a toolbar with
icons versus automatically completing the user’s goal in place — have varying benefits and costs. Thus,
adaptive systems need to have a general utility (or reward) model that is suitable for modeling the costs
and benefits of various help actions as perceived by individual users.
Previous literature points to several major obstacles in developing user models for automatic cus-
tomization systems.1 The first problem is the acquisition of model parameters. A typical approach is to
handcraft the model parameters while another is to learn them discriminatively. The former suffers from
the difficulty in modeling real user behaviour. On the other hand, data involving real users is scarce, and
data-driven approaches require an intensive amount of data in order to learn models of a natural size.
Another difficulty is the problem of model evaluation. One reason evaluation is especially difficult here
is that these models describe people. Even if we were able to evaluate the prediction performance of a
user model in a meaningful way, the outcome of the evaluation may not be generalizable since different
people behave differently. Another issue making evaluation a problem is that user models are designed to
be used in some application context. Thus, evaluating user models in isolation is misleading. However,
evaluating user models as part of a larger application could also lead to inaccurate results, since the
evaluation outcome (good or bad) could be due to some software aspects unrelated to the user model.
A third obstacle is the tradeoff involved in creating an appropriate level of complexity, one of practical
use beyond toy domains. Many of the user models in the literature are limited in scope because increased
model complexity often means increased online computational requirements. Systems that interact with
users must respond to user events quickly, thus, they must be able to update the user models without
inducing a noticeable lag.
1.2 Research Objectives
As mentioned in Section 1.1, the goals of intelligent customization are (i) to minimize user effort in task
completion, and/or (ii) to maximize the ease of interaction during application use. In desktop applications,
many kinds of system actions can be implemented to (potentially) achieve these objectives. Examples of
automated system actions include the following: doing mundane work on the user’s behalf (e.g., auto-
1We explain these problems briefly here but provide a subsection in the actual thesis for each obstacle.
2

completion), moving widgets to another location for more convenient selection (e.g., adding, moving,
deleting widgets from the immediate interface), creating one-click shortcuts for common multi-step tasks
(e.g., suggesting macros), changing the delivery of widgets (e.g., via animation), changing the presentation
of widgets (e.g., level of transparency), sending reminders (e.g., hints or explanations in a text balloon),
making suggestions (e.g., icons in a toolbar), asking questions explicitly (e.g., via a dialog box), etc.
However, different actions have different consequences: an adaptive interface that hides unused menu
items may be preferable for one user because it saves him from scanning unnecessary functions, but the
same behaviour may be detrimental to other users who prefer to see all available functions (e.g., have
high tolerance to bloat). Furthermore, system actions have effects beyond their immediate consequences.
For example, a user who likes unused menu items hidden may find it annoying when he needs to use one
of those functions in the future (i.e., cost of re-discovery). Our underlying assumption is that different
people perceive these consequences differently; thus, the consequences have varying impact. If this is true,
we can design intelligent systems that learn individual differences and adapt their behaviour accordingly.
The general objectives of this work are to test this assumption, to develop ways to learn how people may
perceive help differently, and to leverage this knowledge in designing intelligent help systems. Specifically,
we are interested in addressing the following questions:
1. Modeling “individual differences”:
(a) To test our underlying assumption, we want to know if people value automated help and whether
that value differs across users. When presented with automated help, do (some) people use it?
Under what conditions will people make use of automated help? E.g., only when the help is a
perfect match to what they want to do, or will a “partial” match be helpful? Will people use
automated help in simple tasks? Will people use automated help that is not always available
or not always presented in the same way, i.e., in adaptive systems?
(b) All else being equal, what makes some people want to use adaptive help and others not? Can
we propose a set of user characteristics to explain these kinds of individual differences? Can
these characteristics vary within the same person over time? As a starting point, what user
characteristics does the HCI and user modeling literature provide for capturing individual users?
How do these characteristics relate to the concepts of “user profiles”, “user groups”, and “user
types” from the literature?
(c) What kinds of behaviours are indicators for these characteristics? Can we define these be-
haviours using event sequences acquired from standard input devices (i.e., without relying on
eye tracking, gesture/image recognition, etc.)? Can we build a stochastic model to represent
3
the relationship between these behaviours and characteristics? Can we gather empirical data
for this model to approximate the relationship between these behaviours and characteristics
from a sample participant pool?
(d) Using this model, can the characteristics be estimated online efficiently, so that users of a
system employing the model would not notice a lag during task completion?
2. Role of user characteristics in goal recognition:
(a) In order to help users complete tasks more efficiently, the system needs to estimate what the
user’s goal is. What kinds of goals can the system help users with? Do these goals occur
frequently enough for the system to learn them during application use? Do these goals vary
across users, but in a consistent manner that can be parameterized for specific users?
(b) Since some people make use of help that is only a “partial” match to what they want to do, we
need a way to quantify the quality of automated help in order to know what “partial” means.
Specifically, how do we quantify help with respect to the user’s current goal? Also, since the
system can present multiple suggestions (e.g., a toolbar with several icons, each icon may vary
in the quality of help toward the user’s goal), how do we quantify joint quality?
(c) How does the system model user goals? Can we define user-specific parameters for these goals?
Can the system detect user goals unobtrusively? Can these goals be detected early on during
application use and have opportunities to suggest them in the remaining interaction?
(d) As different users carry out tasks in their own (perhaps non-optimal) ways, can we predict user
goals reliably? Can these goals be estimated quickly online?
3. Role of user characteristics in perceiving the value of help:
(a) The HCI and user modeling literature has documented many interaction factors that make
adaptive systems advantageous or problematic for users. As well, the HCI literature also has
proposed some design criteria to make software more usable in general. Among these interaction
factors, which ones are relevant to the development of an adaptive customization system, given
the kinds of system help actions we are interested in?
(b) Can we build a formal, predictive model for each of these relevant interaction factors? What are
the parameters? Can we gather empirical data to learn the models from a sample participant
pool? Is there one model for everyone, or are certain groups of people more accurately modeled
separately?
4

(c) How do we elicit preferences from users for the software customization domain, where users
typically are presented with novel interfaces or novel and adaptive configurations? How can
we design an elicitation procedure that gauges the user’s preferences more realistically, even
if they are unfamiliar with the interface? Since eliciting the user’s full utility function is too
tedious and error-prone, is there an efficient mechanism that can be used for the procedure?
How do these results, elicited offline (i.e., prior to application use), help with online inference
about the users?
(d) What is the relationship between objective benefits and costs of interaction factors (as computed
by the system) versus subjective utility (as elicited from or perceived by users)?
(e) Some customization solutions propose to elicit user preferences a priori and create user-specific
software accordingly. However, as user preferences will change over time (e.g., developing
certain habits over extensive application use), the software will often become out-of-date. How
do we design the system to handle evolving user preferences?
1.3 Outline of Thesis Proposal
The rest of this document outlines the proposed structure of the thesis by including chapter summaries
and reporting the status of each chapter. Lastly, Section 10 lists the publications relating to this thesis.
Appendix A describes the evaluation plan that forms the core of Chapter 7. As will become clearer later,
the major parts of the thesis that are currently incomplete are:
• Chapter sections 5.4.1 and 5.4.4: results from simulation experiments for goal recognition (completely
implemented, but not yet systematically tested or documented)
• Chapter section 7.4: results from usability experiments for the integrated system (completely im-
plemented, but the proposed evaluation method is new and may require changes after this meeting,
and the full set of experiments has not been conducted)
• Chapter 8: conclusions, discussion and future work (none of this has been written)
A few other chapter sections require (relatively minor) editing so they are not listed here.
2 Chapter 1. Introduction
Summary. This chapter describes the problem of intelligent customization and the difficulties involved
in this area. The major problems in this area are: the ability to model individual differences, acquisition
of model parameters, evaluation of the model and of the system in which the model is embedded, and
5

tradeoff issues between model complexity and scalability. This chapter also presents the specific research
objectives of this thesis (as mentioned above), a description of how the thesis is organized, and a summary
of the contributions. The sections in this chapter are:
1.1 Problem of Intelligent Customization
1.1.1 Modeling Individual Differences
1.1.2 Model Acquisition
1.1.3 Evaluation
1.1.4 Practical Scalability versus Model Complexity
1.2 Research Objectives
1.3 Thesis Outline
1.4 Summary of Contributions
Status. Chapter sections 1.1 and 1.2 are written as in Section 1.1 and Section 1.2 above respectively.
Chapter subsections 1.1.1 - 1.1.4 were written in the depth oral report. Chapter section 1.3 has not been
written yet, and 1.4 is written as in Section 10 below.
3 Chapter 2. Background
Summary. This chapter provides a review of two general areas. The first part of the chapter reviews some
background material involved in understanding our decision-theoretic approach, such as basic concepts in
decision theory and a review of the following graphical models: Bayesian networks (BNs) and dynamic
Bayesian networks (DBNs), Markov decision processes (MDPs), and partially observable Markov decision
processes (POMDPs). We will use a simple user modeling problem as the running example and develop
the corresponding graphical model for it, so that the reader can better appreciate the strengths and
complexities involved in these models.
The second part of the chapter reviews a set of relevant literature in the area of user modeling (under
the general umbrella of intelligent assistance). Since the scope of this area is quite large, we focus on
probabilistic and decision-theoretic approaches only (i.e., ignoring heuristic approaches). Where possible,
we will discuss user modeling applications designed for interface customization. When this is not available,
we will discuss user modeling applications designed to facilitate general user interaction. As well, we will
summarize the state-of-the-art in the reviewed literature and the remaining open problems. The sections
in this chapter are:
6

2.1 Decision-Theoretic Planning
2.1.1 Decision Theory
2.1.2 Bayesian Network (BN) and Dynamic Bayesian Network (DBN)
2.1.3 Markov Decision Process (MDP)
2.1.4 Partially Observable Markov Decision Process (POMDP)
2.2 User Modeling
2.2.1 Probabilistic Approaches in User Modeling
2.2.2 Decision-Theoretic Approaches in User Modeling
Status. The majority of this chapter has been written in the depth oral report. However, the first part
of the chapter requires some re-organization, and a few recent user modeling papers need to be added into
the second part of the chapter in order to keep the literature review up-to-date (as of 2008).
4 Chapter 3. Intelligent Assistance as a Decision-Theoretic Plan-
ning Problem
Summary. In designing an automatic customization system, we view the system as an intelligent agent
that reasons about its actions with a user during software use. That is, an agent observes the relevant
domain information and user behaviours, infers the unobservable information about the user (e.g., goals,
attitudes), and executes the best course of action to help the user accomplish his goals. Formally, the
mathematical tool we use to model this reasoning process is a POMDP. First, we identify the different
kinds of information available in a generic interaction scenario and describe the flow of information in
the scenario. We decompose the overall interaction scenario into recurring episodes, where we make
a simplifying assumption that users focus on achieving one goal per episode. Second, based on the
information flow in these episodes, we formalize a general customization assistant as a POMDP that helps
the user with his current goal. At each time step, this POMDP observes the interface state and events
executed by the user, and updates its belief about the user state, user type, and user goal. The POMDP
then uses the updated belief to select the best action. Since this POMDP is defined in terms of episodic
interaction, its parameters (e.g., the set of possible user goals) need to be updated regularly (e.g., at the
end of each episode).
Lastly, to implement this model, we describe a canonical system architecture which consists of two
user modules — predicting user characteristics and user goals — and an action selection component. The
7

two user modules together output the POMDP belief state, and the action selection component takes this
as input and generates a single action. This chapter focuses on the conceptual foundations of the model
and system architecture only. Chapters 4-6 elaborate on the three major components, providing details
on the conceptual aspects as well as the implementation and evaluation details. Chapter 7 presents an
instantiation of the general POMDP assistant, the associated implementation details corresponding to the
canonical system architecture, and an evaluation. The sections in this chapter are:
3.1 Interaction Scenario
3.2 The POMDP Assistant
3.3 Canonical System Architecture
Status. Chapter sections 3.1 and 3.2 have been written in the research proposal (post-mortem) report.
Chapter section 3.3 is written in a separate evaluation plan document (from August 2008).
5 Chapter 4. A Model of Individual Differences
Summary. One of the major components in our model is the user characteristics component. The user
modeling literature has traditionally focused on learning user goals without emphasizing how other user
information may influence observed behaviour and preferences.2 In contrast, we model user character-
istics explicitly and their relationship with patterns of observed user behaviour as well as preferences of
interaction. The main paper that explored these ideas is [9], and some of the ideas are also illustrated
in [8, 11, 13, 10]. This chapter focuses exclusively on the role of user characteristics in intelligent help
systems and the development of this component.
The underlying assumption in this part of our work is that different people have different preferences.
Hence, we believe that certain types of users find value in receiving adaptive help while they are working
on tasks in an application. We explored this assumption in two settings: (i) usability experiments with a
typing task using an unfamiliar keyboard layout3 in a text editor, with word completion as the adaptive
help, and (ii) preference elicitation experiments with a highlighting task in PowerPoint (e.g., changing the
font style of a phrase to red and italics), with macros in a pop-up toolbar as the adaptive help. Without
going into the details here, we found evidence supporting our assumption in both cases, so the rest of the
chapter focuses on modeling individual differences and evaluating such a model.
2Although there are a few exceptions, such as [6], and the recent works by [2, 14].3We used a Dvorak keyboard layout in the typing task to mimic several users groups: users who finger type, users who
are not fluent in the language of the typed text, and users who have motor and/or cognitive deficiencies and do not typequickly.
8

To capture varying preferences, we defined POMDP state variables to model user attitudes (transient)
and traits (static). Based on past literature, we identified and formalized six interaction factors that play
a role in determining the utility of interface customization actions. These factors are4: savings of offering
help, cost of information processing, cost of interruption, cost of disruption, cost of visual occlusion, and
cost of interface bloat. (We report the status of these factors when we describe Chapter 6.) Each of
these factors involve certain user characteristics, thus, giving us a catalogue of characteristics relevant
to interface customization systems. These characteristics are: the user’s frustration level, neediness level
(how much help the user needs with the current task), distractibility level, independence level, expertise
with the layout of the interface, tolerance to interface bloat, and mental model of the interface (e.g., the
location of certain widgets). In order to assess their influence on the system’s adaptive behaviour, we
focused on two sets of user characteristics (based on the associated interaction factors relevant to the test
application). In each case, we modeled and implemented them in separate systems, collected data to learn
model parameters, and evaluated them in simulation and user studies. The sections in this chapter are:
4.1 Do People Have Different Preferences?
4.2 Relevant User Characteristics
4.3 A Bayesian Model of User Characteristics Relevant to Savings
4.3.1 Estimating Model Parameters
4.3.2 Feasibility of Online Inference
4.3.3 Simulation Results
4.3.4 Usability Results
4.4 A Probabilistic Model of the User’s Mental Model in Assessing Disruption
4.4.1 Estimating Model Parameters
4.4.2 Simulation Results
4.4.3 Usability Results
Status. All the materials in this chapter are done and have been written in the associated papers.
Specifically, the assumption that people have varying differences is addressed in Chapter section 4.1 in
two experiments mentioned above. In a pilot usability experiment, we found evidence that people’s
preferences differ and that they also perceive utility in partially correct suggestions when they are needy
4However, only a subset of them may be relevant depending on application-specific details (e.g., interaction mechanismsand implementation details).
9

(i.e., when they find the task is difficult) [9]. In a more systematic study, we found evidence in the
preference elicitation experiment that people’s preferences vary as a function of the quality of help, the
number of suggestions offered by the system, and how needy the user is (based on the difficulty of the
current task) [10]. Since we controlled for the interface and application settings in both experiments, we
would expect users to report similar preferences. But this was not the case in either study. To explain the
variance in user preferences, we conjecture that subjective utility — the utility of help as perceived by the
user — depends on hidden user features (e.g., user attitudes toward the system, general user tendencies)
as well as objective utility — the utility of help that is defined as a function of the system action and the
interface setting. For this reason, we focus on the development of such user features in this chapter.
The literature review used for identifying relevant interaction factors for interface customization, and
hence user characteristics, has been completed. These characteristics are defined as random variables,
which are part of the influence diagrams we use to formalize each of the interaction factors.
Chapter section 4.3 focuses on the characteristics pertaining to the benefits of savings. In particular,
frustration, neediness, distractibility, and independence were modeled as part of a DBN implemented in
the context of an adaptive word prediction system [9]. We conducted a semi-supervised data collection
experiment with conditions that artificially simulated the user’s frustration and neediness levels (and
got them to report their actual frustration and neediness levels at specified intervals). We also created
post-questionnaires which asked users to report their user type (as defined by our variables). With data
from 45 participants, we processed the questionnaire results using factor analysis and estimated the DBN
conditional probabilities using the Expectation-Maximization algorithm. Once we learned the model, we
evaluated the speed of its online inference, the behaviour of the overall adaptive system in simulation,
and the usability of the overall adaptive system in a pilot study with 4 users. We found that online
inference was on average 0.57 second (without using any optimization or approximation techniques). The
simulation results demonstrated that the system is able to adapt its suggestions to different types of
users. For example, the system offers suggestions of high-mid quality to receptive users (e.g., more needy
and dependent) frequently, while the system acts more conservatively (offering no help or offering fewer
suggestions of high quality only) with less receptive users (e.g., more frustratable and independent). In
the pilot usability study, we confirmed our simulation results (for the user types of the 4 participants).
As mentioned above, we also found that users perceive utility from partially correct suggestions, which
supports our approach to estimating utility of assistance.
Through repeated interaction, a user builds a mental model of the application, reflecting the user’s
belief of the knowledge gained through experience. This may include available software functionality, the
locations of functions, effects of those functions, etc. The main bottleneck in building effective adaptive
10

systems is arguably the cost of disruption to the user’s mental model of the application caused by the
system’s adaptive behaviour. Chapter section 4.4 focuses on the user’s mental model. In particular,
we developed a probabilistic mental model of function locations, which we tested with adaptive menus
(i.e., menus that adapt the locations of their items in order to facilitate selection) [13]. A simplifying
assumption was made in the implementation, which was then used in two data collection studies with 48
participants. In the first experiment, we focused on the relationship between mental model strength (i.e.,
how well users know the location of menu items) and conditions defined by two usage (history) variables
— usage frequency of the item and usage frequency of the neighbouring item — and two interface variables
— a line separator above the item and the total number of items in the menu. We processed the data
using factorial ANOVA, and found significance only with the usage variables. Then we applied regression
analysis to determine that mental model strength changes logarithmically as a function of usage frequency
(for all cases of neighbouring usage frequencies). In the second experiment, we conducted a preliminary
study to assess the cost of disruption as a function of mental model strength and 4 adaptive actions.
Using regression analysis, we obtained linear relationships between disruption cost and strength, for each
adaptive action. Finally, our model was evaluated in a simulation experiment and a usability study with 8
participants. In general, our results suggest that our approach is competitive with state-of-the-art adaptive
menus, with the added ability to respect the user’s mental model and adapt to different user preferences.
6 Chapter 5. Personalized Goal Recognition
Summary. The second major component in our customization model is the user goal component. As
we show in the review in Chapter 2, much of user modeling research focuses on domain-specific goal
recognition. In this thesis, we developed a goal recognition component in the context of the PowerPoint
application. Although the details are domain-specific, each section in this chapter outlines the steps
required for building a general goal recognition component. This chapter uses these steps to develop a
recognition model for specific goals in authoring PowerPoint slides.
In order to help the user, the system needs to keep track of completed goals and help the user with
them in the future. Moreover, the more events that are needed to carry out a goal, the more opportunities
a system has to help the user with it. Therefore, in designing intelligent help systems, we are generally
interested in modeling repetitive goals involving reasonably long event sequences. The first part of this
chapter explains this in more detail and illustrates several classes of goals using PowerPoint examples.
Next, we formalize two classes of goals — indentation and highlighting — using non-deterministic finite
state automata (NFA), which uses the observations in the general customization POMDP (from Chapter
11

3) as its input event vocabulary. Each automaton state represents an interface state (e.g., a phrase has
been selected or a phrase has been selected and is red) and a non-deterministic transition takes places
according to the event executed by the user. Each automaton has one or more start states, one accept
state that denotes when the user has achieved a goal, and one reject state that denotes when the observed
event sequence is inconsistent with the represented goal. This formalism allows us to model multiple
ways of achieving a goal by having multiple paths between a start state and the accepting state. Also,
having multiple start states allows us to model when a user changes his mind about a completed goal
(e.g., after highlighting a phrase bold and red, the user goes off to complete some other goals, comes back
and modifies the phrase to be bold, red, and italics).
For each class, we define a template that specifies the syntax of the goal class. By tracing through
the available templates with the observed event sequence, the system accepts a goal if the event sequence
matches the specified syntax and instantiates a finite state machine which is added to the goal library.
Thus, each machine corresponds to a goal, and the goals in the library represents the goals completed by
the user. By tracing through the available machines in the goal library, the system is in effect keeping
track of the set of feasible goals that are consistent with the sequence of observed user events. However,
this does not indicate how much the evidence supports the remaining feasible goals being the user’s true
goal. Thus, we maintain a goal distribution (over the goals in the library) and compute the posterior
distribution given the sequence of observed evidence. (As explained in the research proposal post-mortem
document, this update can be done efficiently and incrementally by using Bayes rule and exploiting
structure independence in the POMDP.) The sections in this chapter are:
5.1 Classes of Goals
5.2 Finite State Models
5.2.1 Templates for the Indentation Goal Class
5.2.2 Templates for the Highlighting Goal Class
5.3 Inferring the User’s Current Goal
5.4 Simulation Experiments
5.4.1 Feasibility of Online Inference
5.4.2 Quantifying the Quality of Goal Prediction
5.4.3 Definition of Accuracy over a Distribution of Goals
5.4.4 Results
12

Status. All the materials in this chapter are done and most of it has been written in the research proposal
and the research proposal post-mortem reports. Specifically, the description of goal classes and the
formalism of indentation and highlighting goals have been written in the two previous documents. Using
the highlighting goals, we have implemented the corresponding NFAs and the aforementioned procedures
for tracing the goal templates, tracing instantiated machines, updating the goal library, and updating the
goal distribution. However, the evaluation for Chapter section 5.4 has only been conducted informally
and none of it has been written up. In this part of the chapter, we will report the speed of online inference
using our procedures, and accuracy results of the inference process. We have defined a way to capture
accuracy, given the target goal. Our definition involves a metric that measures the effort saved between
accepting a predicted goal and the target goal, and considers the fact that our component outputs a
distribution of goals (rather than a single, predicted goal). The work remaining here is a more systematic
simulation experiment to report results for Chapter section 5.4.1 and 5.4.4.
7 Chapter 6. Utility of Intelligent Assistance
Summary. Preference elicitation in interface customization has typically adopted a qualitative approach
that learns preference rankings of outcomes without learning the strength of those preferences [15, 16, 3] 5.
However, given the stochastic nature of goal estimation in an intelligent help system, we require estimates
of utility as well. To do this within our POMDP, we require some means of associating observed user
behaviour with utility functions (i.e., the POMDP reward function). As we proposed in Chapter 4, we
represent the utility function as a function of a set of user features (e.g., user attitudes toward the system,
general user tendencies) and the objective utility of help defined based on the system action and interface
setting. In this way, user features serve as the intermediary between observed user behaviour and the
utility function. While direct online elicitation is not (completely) feasible, offline elicitation can be used
to develop the required models. This chapter focuses on the development of utility functions, which are
embedded in the action selection component of our canonical system architecture.
Recall that the literature reviewed in Chapter 4 resulted in a set of six interaction factors relevant
to interface customization. We formalize these factors using influence diagram notation. Three of these
factors — savings, bloat, disruption — are investigated further. Experiments mentioned before (as they
relate to user characteristics in Chapter 4) are summarized here, and one new experiment is presented in
detail. Lastly, we developed an Experiential elicitation procedure that makes use of incremental elicitation
strategies and tested it with real users. Our objective is to test the feasibility of this procedure and collect
results on user preferences in a customization domain. We conducted an elicitation experiment (with 4
5Although Horvitz et al. [7] uses “willingness to pay” to quantify the cost of interruption.
13

comparison procedures and 38 users in total) in the context of highlighting help in PowerPoint. The system
suggestion varies in terms of quality and quantity, and the task difficulty varies between easy and hard.
Thus, the utility function of interest involves the following variables: length (the number of highlighting
macros provided in a pop-up toolbar), quality (the savings offered by the best macro in the toolbar),
and the user’s neediness level (which is true when the task is difficult and false otherwise). Generally,
the results showed that our approach enables users to better interpret stochastic outcomes and to better
perceive the sequential utility of help. The sections in this chapter are:
6.1 Interaction Factors
6.1.1 The Cost of Interruption
6.1.2 The Cost of Information Processing
6.1.3 The Benefits of Savings
6.1.4 The Cost of Visual Occlusion
6.1.5 The Cost of Interface Bloat
6.1.6 The Cost of Disruption
6.2 Experiments for Bloat
6.2.1 Simulation Results
6.3 Summary of Experiments for Savings
6.4 Summary of Experiments for Disruption
6.5 Eliciting the Subjective Value of Help
6.5.1 Incremental Preference Elicitation
6.5.2 A New Approach Using Experiential Elicitation
6.5.3 Elicitation Experiments
6.5.3.1 Design Conditions
6.5.3.2 Structural Results
6.5.3.3 Methodological Comparisons
6.5.3.4 Quantitative Comparisons
Status. As mentioned in Chapter 4, the literature review on relevant interaction factors have been
conducted, and their formal models have also been completed. A short version of this chapter section
14

was written in [11]. For Chapter section 6.2, we developed an MDP model involving bloat in the context
of an adaptive menu that considers users with different distractibility levels and tolerance for bloat [11].
This model was implemented in a system that adaptively adds and deletes menu items. Overall system
performance was evaluated in simulation experiments, which showed that our adaptive system is sensitive
to the specific user type. Chapter sections 6.3 and 6.4 are summaries of the work completed in Chapter
4. They have not been written.
The work in Chapter section 6.5 is completed and reported in [10]. Overall, we obtained structural
results which provided general trends in the elicited utility functions. Although there was a lot of variation,
we found that the utility functions are monotonically non-decreasing as quality increases and monotonically
non-increasing as length increases. Next, we describe the results of comparing 4 test procedures.
Experiential elicitation is a procedure that we developed by allowing users to experience what they
like and dislike about the test interface via experiential queries. A first experiment with adaptive high-
lighting suggestions in PowerPoint compared the elicitation results between a conventional procedure with
13 participants (which asks users to think about what they like) and our experiential procedure with 8
participants. Using Hotelling’s T2 multivariate test, we found that the two procedures are significantly
different and that users generally reported higher utilities in the experiential setting. Although it seems
that experiential queries enable users to better perceive the value of assistance, the procedure is time con-
suming and tiring for users. Consequently, we developed two efficient variations — Primed and Primed+
— and elicited utility functions from 9 and 8 participants respectively. Again, we found that these pro-
cedures are significantly different from the conventional procedure. Interestingly, by giving users a quick
snapshot of the interface (and potentially the costs involved in the adaptive help which would otherwise
be unknown in the conventional procedure), the Primed procedure resulted in lower reported utilities. On
the other hand, the Primed+ procedure, which started off the elicitation with experiential queries and
finished with conventional queries, resulted in higher utilities that pattern similarly to those in the Expe-
riential elicitation. As a result, Primed+ proved to be an efficient approach of our Experiential elicitation
procedure.
8 Chapter 7. Integrated System and Evaluation
Summary. Most user modeling evaluation takes a comparative approach — the proposed method (e.g., a
new algorithm used in the system, a new model embedded in the system, or a newly developed application)
is compared to an existing one using standard performance metrics (such as prediction accuracy, subjective
usability scores). Although such evaluations enable researchers to see how well a new method performs
15

with respect to one(s) in comparison, these results do not provide insights on how the various aspects of
the methods contribute to overall help utility. In contrast, we propose to evaluate a system’s help utility
as a function of a set of parameters that describe the system. In this way, we can see the degree to which
each system parameter contributes to overall utility.
In this chapter, we first develop the details of this evaluation procedure by specifying the parameters
and metrics needed based on our canonical system architecture in Chapter 3. Specifically, we propose to
use goal accuracy to measure the output of the goal prediction module, user type accuracy to measure
the output of the characteristics prediction module, and system policy to describe the strategy used in
the action selection component.
To demonstrate this evaluation method, we describe what we refer to as the “integrated system”, which
is an instantiation of the general POMDP customization assistant from Chapter 3 for helping users with
highlighting tasks in PowerPoint. We refer to this as the integrated system because, unlike the systems we
developed in other chapters, this one consists of some aspect of all the components in the canonical system
architecture. Once this system and the test domain is presented, we outline the experiment hypotheses
and test conditions of interest. As is mentioned in the research objectives from Chapter 1, the questions
of special interest are the influence of user characteristics and the influence of a decision-theoretic policy
towards the utility of automatic assistance. Experiment results are presented based on how measured
utility changes as a function of changes in the evaluation parameters. The sections in this chapter are:
7.1 A New Approach to Evaluating User Modeling Systems
7.1.1 Evaluation Parameters
7.1.2 Evaluation Metrics
7.2 Test Application: The Integrated System
7.2.1 The Instantiated Model
7.2.2 Application-Specific Definitions of Accuracy
7.3 Understanding the Utility of Assistance
7.3.1 Comparison Policies
7.3.2 Experiment Conditions
7.3.3 Controlling Parameter Settings
7.3.4 Experiment Hypotheses
7.4 Results
16

7.4.1 Utility as a Function of Goal Accuracy
7.4.2 Influence of a User Characteristics Component on Utility
7.4.3 Influence of a Decision-Theoretic Policy on Utility
Status. The first three sections of this chapter has been written in the evaluation plan included as Ap-
pendix A of the current document. Specifically, Chapter section 7.1 has been conceptualized and described
in the appendix. The integrated system was presented as part of the research proposal post-mortem pre-
sentation, and is described in the appendix. Briefly, this system involves two user characteristics (neediness
and distractibility), user-specific highlighting goals in PowerPoint, and suggests the (myopically) optimal
highlighting help w.r.t. the expected user goal and user type. This system has been implemented fully.
The evaluation plan in Appendix A also presents the specific hypotheses and the comparison policies in
this evaluation study. With this information, we defined a set of conditions for the evaluation plan. The
evaluation has not been conducted, but we hope to have the results of a pilot study ready for discussion
at the thesis proposal presentation.
9 Chapter 8. Conclusions
Summary. This chapter summarizes the work in this thesis. Some discussion and future work will be
provided. The sections in this chapter are:
8.1 Discussion
8.2 Future Work
Status. Not written.
10 List of Contributions
The following is a list of publications relating to the work in this thesis.
• B. Hui, S. Liaskos, and J. Mylopoulos. Requirements Analysis for Customizable Software: A
Goals-Skills-Preferences Framework. In Proc. of RE, pages 117–126, 2003.
• B. Hui and C. Boutilier. Who’s Asking for Help? A Bayesian Approach to Intelligent Assistance.
In Proc. of IUI, pages 186–193, 2006.
• B. Hui and C. Boutilier. Modeling the Disruption to the User’s Mental Model. Neural Information
Processing Systems (NIPS), Workshop on User Adaptive Systems, Presentation only, 2006.
17

• B. Hui and C. Boutilier. Toward Eliciting Experienced Utilities for Interface Customization. In
Proc. of UAI, pages 298–305, 2008.
• B. Hui, S. Gustafson, P. Irani, and C. Boutilier. The Need for an Interaction Cost Model. In Proc.
of AVI, pages 458–461, 2008.
• B. Hui, G. Partridge, and C. Boutilier. A Probabilistic Mental Model For Estimating Disruption.
Submitted to Proc. of IUI, 2009.
Appendix A: Evaluation Plan (Chapter 7.1-7.3)
Most user modeling evaluations takes a comparative approach — the proposed method (e.g., a new
algorithm used in the system, a new model embedded in the system, or a newly developed application) is
compared to an existing one using standard performance metrics (such as prediction accuracy, subjective
usability scores). Although such evaluations enable researchers to see how well a new method performs
with respect to one(s) in comparison, these results do not provide insights on how the various aspects of
the methods contribute to overall help utility. In this chapter, we propose to evaluate a system’s help
utility as a function of a set of parameters that describe the system. In this way, we can see the degree
that each system parameter contributes to overall utility.
This chapter develops the evaluation procedure.Using the canonical system architecture from Chapter
3, we first introduce parameters for describing general user modeling systems and metrics for assessing
their performance. Next, we describe the integrated system — an instantiation of our generic POMDP
assistant model from Chapter 3 — as the test application in our evaluation. With this application,
we define the evaluation parameters precisely, as well as how we control for them given the typical use
cases in the domain. Then, we describe the experiment set-up involving comparison policies, the general
experiment design, as well as the specific test hypotheses.6
A.1 A New Approach to Evaluating User Modeling Systems
This section introduces the parameters and metrics we use to evaluate user modeling systems.
A.1.1 Evaluation Parameters
Our objective is to develop a set of parameters that is applicable to general user modeling systems and lets
us capture how each component of the system contributes to overall utility. For these reasons, we use the
canonical system architecture presented in Chapter 3, and define parameters for the major components
6In the actual write-up of Chapter 7, we would also report our experiment results here.
18

in the canonical architecture. Recall that these components are: the goal prediction component, the
characteristics prediction component, and the action selection component. To derive these parameters,
we consider some examples of how different systems decide to help users.
Consider a system with only a goal component that always presents a toolbar with 10 macros whenever
a phrase is selected. How does this system use the output from the goal prediction component to select the
set of macros to display in the toolbar? For instance, its policy may require a ranking of goal candidates
representing their likelihood of being the true goal as output from the prediction component. Intuitively,
this system’s action selection component would choose the top 10 highest ranked candidates and create
their associated macros to be displayed in the toolbar. Thus, the accuracy of the goal prediction component
directly influences the choice of system actions. In another scenario, we consider a system with a heuristic
policy that makes use of both user goal and characteristics components. Here, its policy requires a ranking
of goal candidates as well as the most likely user type as output from the prediction components. For
example, this system’s action selection component would consider each goal candidate in turn, and add
the candidate’s macro to the toolbar if its quality exceeds a pre-defined threshold — which could be set to
a more lenient value for more receptive receptive user types and a stricter value for user types that tend
to reject automated assistance. Here, the accuracy of both prediction components are important to the
overall quality of suggestions made to the user.
We use these scenarios as motivation in developing our evaluation parameters. For the two prediction
components, we measure the accuracy of their output in order to assess how their prediction quality
influences the overall utility. Furthermore, the prediction output is used to choose an appropriate course
of adaptations by the action selection component, so we have to also consider the policy of the system
as well. Although the parameters we choose do not define a system completely or uniquely, we believe
that they are tightly tied to the overall utility of assistance. Generally speaking, the definitions of these
parameters are:
• accG — the accuracy of the output of the user goal component for predicting the correct current
goal. Note that the output is a set of one or more candidates, and each candidate either has an
associated likelihood probability that it is the true goal, or an associated ranking (based on some
metric used within the specific goal component).
• accC — the accuracy of the output of the user characteristics component for predicting the correct
user type. Note that the output is a set of one or more candidates, and each candidate either has
an associated likelihood probability that it is the true user type, or an associated ranking (based on
some metric used within the specific characteristics component).
19

• π〈infoG, infoC〉 — the policy of the action selection component, such as never helping the user, or
suggesting help based on a heuristic threshold, or suggesting help using a decision-theoretic policy
that maximizes suggestion utility in expectation of the belief distribution over user goals and user
types. The policy parameter has two implicit parameters that specify the kind of information
it requires from the goal and characteristics component — infoG and infoC respectively. We
consider two kinds of information — a ranking or a distribution of the output candidates from the
corresponding prediction component.
The precise definitions of the accuracy parameters and how we control for them in an experiment setting
are necessarily tied to the domain application. Therefore, we define them more precisely after describing
the test application in Section A.2. Following that discussion, the comparison policies we use in the
evaluation are defined along with the experiment design in Section A.3.
A.1.2 Evaluation Metrics
To assess overall utility of assistance, we measure a set of objective and subjective metrics in the user
experiment. Objective measures are collected passively during the experiment, while subjective measures
are collected using a post-questionnaire. To get a sense of the kind of users who participated in our
experiments, we can plot their user types (reported via a pre-questionnaire (cf. [9])) as follows:
• for the entire participant pool, a histogram of (self-reported) user types
To assess the user’s general behaviour during the interaction with a particular system, we define the
following objective measures:
• task completion time
• “quality of task completions”: percentage of task completions that did not match the target exactly
and how far off they are from actual target (i.e., number of events needed to fix it in order to match
the target)
• in a system that offers help, the time it takes the user to accept or reject help (i.e., the time starting
when the toolbar appears on the interface to the time when either the user accepts one of the
suggested macros or when the user continues with the current task)
To assess the behaviour of the system, we define these measures:
• for systems that offer help, a histogram of the parameters relevant to system suggestions (e.g., the
length and quality of a suggestion toolbar)
20

• for adaptive systems, the percentage of times help the system decided not to offer help even though
potential candidates are known in the system goal library
Lastly, we define the following objective measures to assess the kind of help that users accept from systems
that offer help:
• the percentage of times the user accepts system suggestion when offered
– among these, the percentage of times the accepted suggestions did not match the goal exactly
∗ among the times when imperfect suggestions were accepted, the percentage of times the
perfect suggestion was also presented (but the user did not choose it)
∗ among the times when imperfect suggestions were accepted, the time and the number of
events executed in order to correct the imperfect suggestion
At the end of the experiment, the participant answers a post-questionnaire which assesses the subjective
utility of each system policy. The questions we use are:
• How frustrating is it when you were using this system?
Answer on a scale from 1 (Not Frustrating) to 5 (Very Frustrating).
• How easy is this system to use?
Answer on a scale from 1 (Very Difficult to Use) to 5 (Very Easy to Use).
• How helpful are the suggestions provided by this system?
Answer on a scale from 1 (Not Helpful) to 5 (Very Helpful).
• How easy is it to predict the way this system provides suggestions?
Answer on a scale from 1 (Very Easy to Predict) to 5 (Very Difficult to Predict).
A.2 Test Application: The Integrated System
To demonstrate this evaluation method, we describe what we refer to as the “integrated system”, which
is an instantiation of the general POMDP customization assistant from Chapter 3 for helping users with
highlighting tasks in PowerPoint. We refer to this as the integrated system because, unlike the systems
we developed in other chapters, this one consists of some aspect of all the components in the canonical
system architecture.
A.2.1 The Instantiated Model
The specific POMDP model is shown in Figure 1(a) and the corresponding system architecture is shown
in Figure 1(b). This integrated system was presented during the presentation of the research proposal.
21
We explain the integrated system in order to understand which aspects are involved and how we design
user experiments with it in the evaluation.
t+1
HighlightingToolbar of
Macros
ProcessingOcclusion
Savings
TN, TD
N, DN, D
SliderLen
Qual
SliderLen
Qual
PrevEventMachine state
PrevEventMachine state
HighlightingGoals
(Behaviouraland Reactionsto Help Actions)
Events(Behaviouraland Reactionsto Help Actions)
Events
t
(a) POMDP
Pr(Highlighting Goals)
over user states
Aggregate Events
User
Tendency to be Distracted (TD)Tendency to be Needy (TN)
Highlighting GoalsToolbarAction
includes: Slider, Len, Qual
Model of UserCharacteristics User Goals
Model ofToolbarAction
Selection
Interaction Factors:Savings, Processing, Occlusion
Application Interface
Event
Toolbar Action
Pr(Neediness,Distracted)
Observation
Belief distribution
(b) Architecture
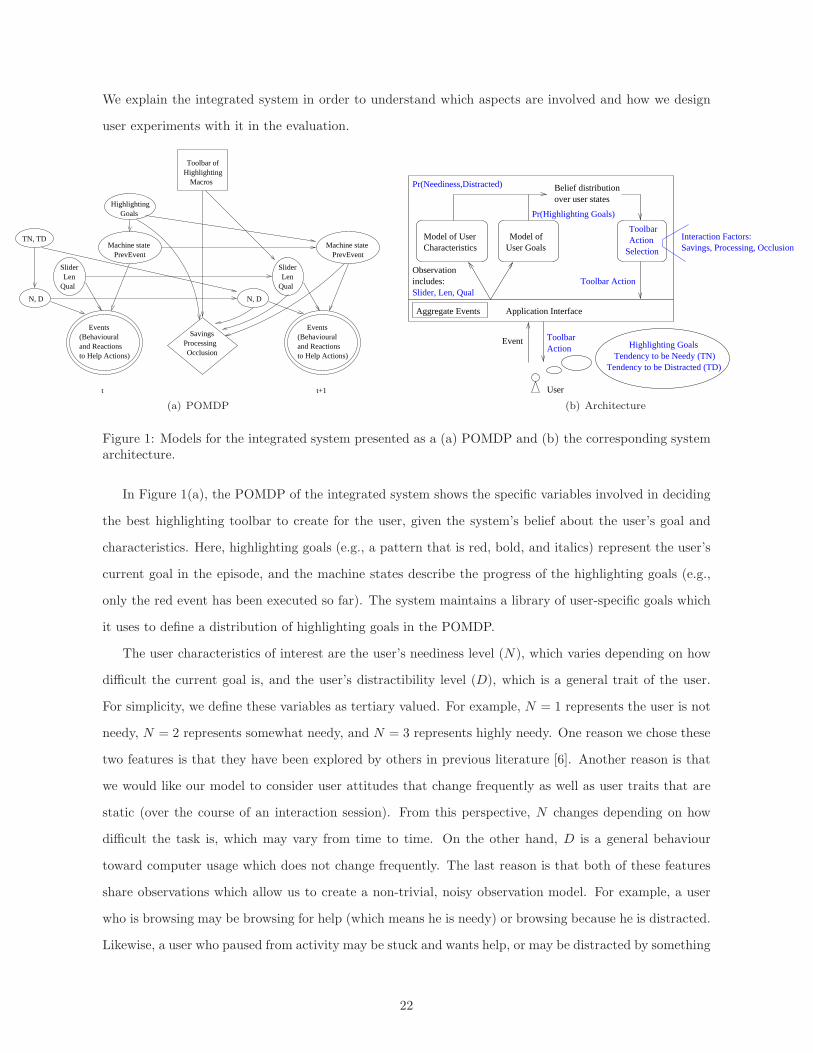
Figure 1: Models for the integrated system presented as a (a) POMDP and (b) the corresponding systemarchitecture.
In Figure 1(a), the POMDP of the integrated system shows the specific variables involved in deciding
the best highlighting toolbar to create for the user, given the system’s belief about the user’s goal and
characteristics. Here, highlighting goals (e.g., a pattern that is red, bold, and italics) represent the user’s
current goal in the episode, and the machine states describe the progress of the highlighting goals (e.g.,
only the red event has been executed so far). The system maintains a library of user-specific goals which
it uses to define a distribution of highlighting goals in the POMDP.
The user characteristics of interest are the user’s neediness level (N), which varies depending on how
difficult the current goal is, and the user’s distractibility level (D), which is a general trait of the user.
For simplicity, we define these variables as tertiary valued. For example, N = 1 represents the user is not
needy, N = 2 represents somewhat needy, and N = 3 represents highly needy. One reason we chose these
two features is that they have been explored by others in previous literature [6]. Another reason is that
we would like our model to consider user attitudes that change frequently as well as user traits that are
static (over the course of an interaction session). From this perspective, N changes depending on how
difficult the task is, which may vary from time to time. On the other hand, D is a general behaviour
toward computer usage which does not change frequently. The last reason is that both of these features
share observations which allow us to create a non-trivial, noisy observation model. For example, a user
who is browsing may be browsing for help (which means he is needy) or browsing because he is distracted.
Likewise, a user who paused from activity may be stuck and wants help, or may be distracted by something
22

else. This commonality has been documented by others as well [6].
Using these two characteristics features, we define the user’s type based on the user’s tendency to be
needy (TN) and tendency to be easily distracted (TD). For simplicity, we define them as binary features,
so we consider a possibility of 4 user types. The user’s type dictates how the user characteristics evolve
over time in our POMDP model. For example, a user whose type tends to be needy and tends to be
distracted (TN = 1, TD = 1) will actually be highly needy and highly distracted (N = 3 and D = 3)
more often than a user whose type tends to be not needy and not distracted (TN = 0, TD = 0).
The POMDP model also defines a set of interface variables that describe the kind of help offered to
the user. In particular, a toolbar of macros may vary in length (i.e., the number of macros in it) and
quality (i.e., how well the suggested macro matches the true goal). Furthermore, the application may
have additional interface widgets that allow the user to express his attitudes explicitly. In our case, we
implement a slider widget which enables the user to indicate whether they want more or less help from
the system.
Since this POMDP focuses on toolbar suggestions in highlighting tasks, the relevant interaction factors
we use to define the reward model are savings — the amount of savings offered to the user in the system
action, information processing — the cost required for the user to interpret and accept/reject the system
action, and occlusion — the cost of displaying a toolbar of a certain size near the user’s immediate focus.
Other interaction factors we investigated in our papers (i.e., disruption and bloat) are not chosen because
they do not pertain to the presentation aspects of suggesting a highlighting toolbar.
In Figure 1(b), the architecture of the integrated system shows which components handle the various
variables in the POMDP. As the user interacts with the system and executes events, the system aggregates
them into an observation (which includes the interface variables) and is then passed to the prediction
components. These components use the incoming observation to update their beliefs about the user. The
updated belief distributions are passed to the action selection component. This component computes the
utility of each set of macro suggestions, based on the relevant interaction factors and in expectation of
the user distributions. The best toolbar action is then presented to the user. This interaction repeats.
A screenshot of the integrated system as an augmented PowerPoint application with highlighting help
is shown in Figure 2. In this implementation, whenever a phrase is selected (via mouse or keyboard
events), a toolbar of suggestion macros varying in length and quality appears above the selected phrase.
A.2.2 Application-Specific Definitions of Accuracy
This section defines the two accuracy parameters in the context of the augmented PowerPoint and discusses
how we control their values in the experiment. First, we focus on accC , which ranges between 0% to 100%
23

Figure 2: Screenshot of the integrated system implemented in the PowerPoint interface.
(or equivalently, [0, 1]). In the first case, the characteristics component outputs a distribution of L user
types 〈t, p〉1, .., 〈t, p〉L, where t is a user type and p is the probability of it being true. A user type is either
correct or not, so the accuracy of this output is simply the probability of the true type. In other words,
we have:
accC = p∗
where p∗ is the probability of the candidate type matching the true user type. In the second case, the
characteristics component outputs a ranking of L user types 〈t, r〉1, .., 〈t, r〉L, where t is a user type and
r is the rank of it relative to other candidates (with 1 being the highest rank). Here, we have no way of
knowing how likely one candidate is relative to another. Also, we do not know how the output is to be
utilized by the action selection component (e.g., if the policy only cares about the most likely type or if it
makes use of a few candidates etc.). Thus, we define the accuracy of ranked output as:
accC =
0 if no rank 1 candidates is the true user type
1/J o/w, for J rank 1 candidates
Next, we focus on accG, which also ranges between 0% to 100% (or equivalently, [0, 1]). Unlike user
type prediction which is either correct or not, we assign partial credit to prediction output if it is partially
correct. We do this by introducing a quality measure for a system suggestion. Specifically, we define
Q(m|g∗, pfx) as the quality of a suggestion macro m, given the true goal g∗ and a common prefix pfx,
where m, g∗, and pfx all are defined as part of the system’s interface state (recall how we learn user
goals using finite state machines in Chapter 5). For example, if the user selects a word that is already
red and wants to additionally make it bold and italics, then pfx is indicated by the state red, and g∗
is indicated by the state red, bold, and italics. Given the same prefix, we count the number of events
24

needed to execute in order to get from pfx to g∗. Without automated help, this is the effort the user
needs to exert in order to achieve g∗. Thus, this quality is the effort that m can save the user during this
task completion. Specifically, Q(m|g∗, pfx) is the number of events m and g∗ have in common, minus the
number of events they differ in, minus the number of events needed to minimally change m to g∗ (i.e.,
to fix the suggestion afterwards if it were accepted by the user). In the best case, m matches g∗ exactly.
Thus, the relative quality of a single macro is RelQual(m|g∗, pfx) = Q(m|g∗, pfx)/Q(g∗|g∗, pfx).
To define accG in the first case, the goal component outputs a distribution of N goal candidates
〈c, p〉1, .., 〈c, p〉N , where c is a goal and p is the probability of it being true. Allowing for partial credit in
the prediction, we define accuracy as the relative quality of the output in expectation of their probabilities:
accG =
N∑
i=1
RelQual(ci|g∗, pfx)pi
In the second case, the goal component outputs a ranking of N candidates 〈c, r〉1, .., 〈c, r〉N , where c is a
goal candidate and r is the rank of it relative to other candidates (with 1 being the highest rank). Allowing
for tied ranks, suppose we have J candidates of rank 1. Again, we consider the correctness of candidates
with rank 1 only. We define accuracy as:
accG = maxcjRelQual(cj|g
∗, pfx)
where there are c1, ..., cJ candidates of rank 1. In the next section, we describe the rest of the evaluation
procedure, including the policy used by the integrated system, other comparison policies, and how we
control for these accuracy parameters in the experiment.
A.3 Understanding the Utility of Intelligent Assistance
Using the evaluation parameters and metrics outlined in A.1 and the integrated system as our test appli-
cation as proposed in A.2, we describe the specific experiment set-up in this section. First, we discuss the
general objectives of our evaluation. While all three major components in the canonical system architec-
ture contribute to overall utility in some way, the purpose of our evaluation is to investigate how utility
changes as a function of the parameters that define the system. In this experiment, we focus specifically
on two questions:
• What is the impact of the user characteristics component on overall utility?
• What is the impact of a decision-theoretic (DT) policy in comparison to alternative policies?
25

To address these two questions, we compare intelligent customization systems that make use of a charac-
teristics component to one that does not, and systems that make use of a DT policy to one that does not.
The specific system policies we propose to use are described in Section A.3.1.
In general, we design a controlled experiment with specific settings for the three parameters accG,
accC , and π. The accuracy parameters are controlled in a way so that the system knows the participant’s
true user type and user goals. This is done by using a pre-questionnaire and asking participants to carry
out a series of tasks on a set of slides using the augmented PowerPoint application above. In the pre-
questionnaire, we ask some questions to identify the participant’s general attitudes toward neediness and
distractibility in the specific application context (such as those used in [9]). We analyze the responses
immediately to determine the participant’s actual user type. This result is then input to the test system.
For the rest of the experiment, the participant is instructed to complete highlighting tasks on each slide
by changing the font stylization of some of the words in each slide. An example of such a slide is shown
in Figure 2, where two sentences are presented to the participant and the task is to change the style of
a phrase in the second sentence to match that of the top sentence. In order to control for the actual
font styles chosen, we provide the target styles for each set of words the participant is to complete (such
as the target style in the top sentence in Figure 2). These target styles serve as the actual user goals
which we control in the experiment. While the subject is carrying out the task, the system may offer task
completion help in a pop-up toolbar (depending on the test policy) as in the one shown in Figure 2. This
set-up enables the system to know the true user type and user goal during the experiment.
Finally, given the various parameter settings, we explain the range of experiment conditions involved
in A.3.2 and how we control for the different parameter settings in A.3.3. Lastly, we formulate the specific
experiment hypotheses in A.3.4.
A.3.1 Comparison Policies
Based on the above evaluation questions, we create policies that make use of the characteristics component
versus one that does not (i.e., only uses the goal component), and policies that are decision-theoretic versus
heuristic. Roughly speaking, this gives us a combination of four policies: DT-G (a DT policy using only
the goal component), DT-GC (a DT policy using both goal and characteristics components), Heur-G (a
heuristic policy using only the goal component), and Heur-GC (a heuristic policy using both goal and
characteristics components). In addition, we create policies that give baseline performance comparisons.
These two policies are to always provide help, and to never provide help. We define each of these six
policies more specifically.
• Never — never suggest help. Its system architecture only has the action selection component.
26
• Always — always suggest help using the 10 highest ranked goals. Its architecture consists of the
goal prediction and action selection components.
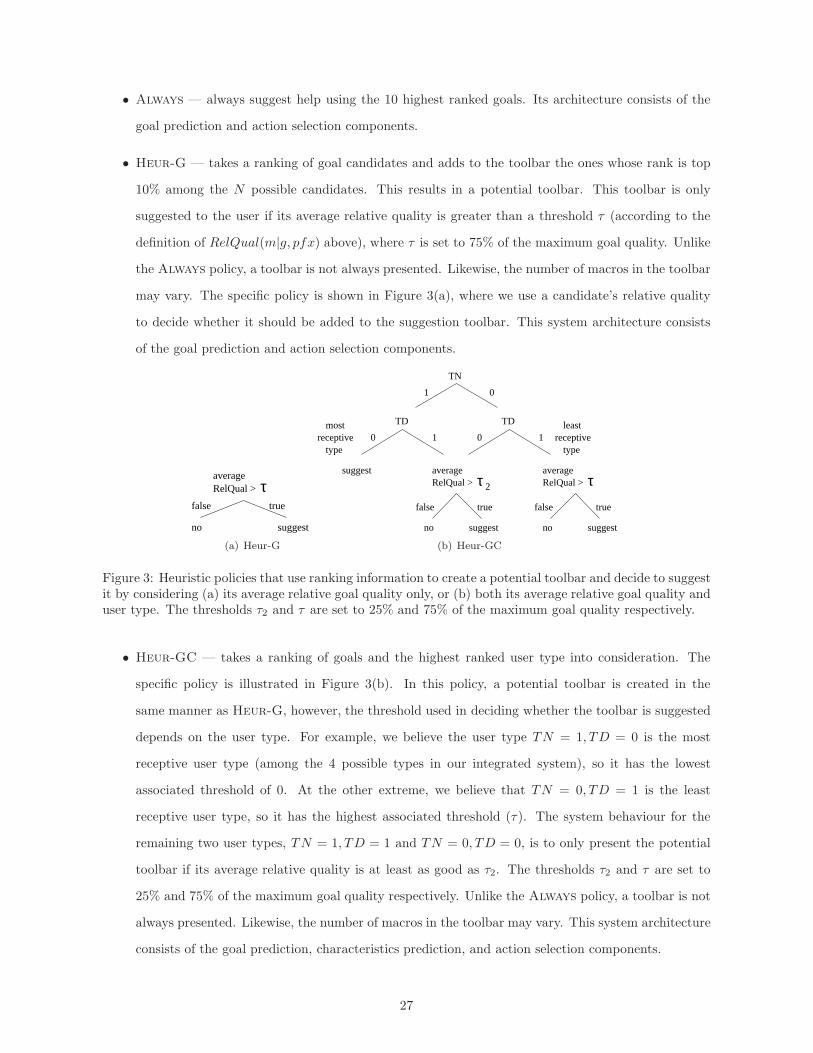
• Heur-G — takes a ranking of goal candidates and adds to the toolbar the ones whose rank is top
10% among the N possible candidates. This results in a potential toolbar. This toolbar is only
suggested to the user if its average relative quality is greater than a threshold τ (according to the
definition of RelQual(m|g, pfx) above), where τ is set to 75% of the maximum goal quality. Unlike
the Always policy, a toolbar is not always presented. Likewise, the number of macros in the toolbar
may vary. The specific policy is shown in Figure 3(a), where we use a candidate’s relative quality
to decide whether it should be added to the suggestion toolbar. This system architecture consists
of the goal prediction and action selection components.
average
suggestno
truefalse
τRelQual >
(a) Heur-G
suggest
TN
01
averageRelQual >
averageRelQual > τ 2
receptivemost
typereceptive
least
type
false true
suggestno
false true
suggestno
τ
TD
10
TD
0 1
(b) Heur-GC
Figure 3: Heuristic policies that use ranking information to create a potential toolbar and decide to suggestit by considering (a) its average relative goal quality only, or (b) both its average relative goal quality anduser type. The thresholds τ2 and τ are set to 25% and 75% of the maximum goal quality respectively.
• Heur-GC — takes a ranking of goals and the highest ranked user type into consideration. The
specific policy is illustrated in Figure 3(b). In this policy, a potential toolbar is created in the
same manner as Heur-G, however, the threshold used in deciding whether the toolbar is suggested
depends on the user type. For example, we believe the user type TN = 1, TD = 0 is the most
receptive user type (among the 4 possible types in our integrated system), so it has the lowest
associated threshold of 0. At the other extreme, we believe that TN = 0, TD = 1 is the least
receptive user type, so it has the highest associated threshold (τ). The system behaviour for the
remaining two user types, TN = 1, TD = 1 and TN = 0, TD = 0, is to only present the potential
toolbar if its average relative quality is at least as good as τ2. The thresholds τ2 and τ are set to
25% and 75% of the maximum goal quality respectively. Unlike the Always policy, a toolbar is not
always presented. Likewise, the number of macros in the toolbar may vary. This system architecture
consists of the goal prediction, characteristics prediction, and action selection components.
27

• DT-G — create a toolbar consisting of candidates whose expected quality (based on user goal
prediction only) is greater than that of the null action. Using the relative quality definition and
associated notation from above, a candidate’s expected quality is defined as RelQual(ci|g∗, pfx)pi,
where ci is the candidate and pi is its probability of being the true goal g∗ after the prefix pfx has
been executed. Unlike the Always policy, when no candidates qualify, the system does not present
a toolbar. Likewise, the number of macros in the toolbar may vary. We expect this policy to behave
differently from Heur-G because this one considers how likely each candidate is to be the true
goal, while Heur-G only considers the relative quality of the candidates. This system architecture
consists of the goal prediction and action selection components.
• DT-GC — create a toolbar consisting of candidates whose expected quality (based on user goal
and user type prediction) is greater than that of the null action. Here, we modify relative quality
by a utility function that describes how certain types of user perceive help differently. For conve-
nience, we define ERQ = RelQual(ci|g∗, pfx)pi. Then, we define expected quality in this policy as
U(type, ERQ)pT , where U is the utility function and pT is the probability that type is the true user
type. Unlike the Always policy, when no candidates qualify, the system does not present a toolbar.
Likewise, the number of macros in the toolbar may vary. This system policy is different from DT-G
because this one considers how different types of users perceive the same help (as quantified by
the utility function). We expect this policy to behave differently from Heur-GC because this one
considers how likely each candidate and each type are true, while Heur-GC only considers the can-
didates’ relative quality and the most likely user type (which could be wrong when the characteristics
component is not accurate). This policy is used by the integrated system. This system architecture
consists of the goal prediction, characteristics prediction, and action selection components.
When a suggestion toolbar is presented, the maximum number of macros in it is limited to 10 for imple-
mentation convenience.
A.3.2 Experiment Conditions
In order to limit the scope of the experiment, we consider values of the accuracy parameters at 50%
and 100% only. Given a specific policy, we vary accuracy and measure the change in assistance utility (as
measured by the objective and subjective metrics proposed above). The table shows that we vary accuracy
in three ways. For example, all the conditions in the first row have both accG and accC set to 100%, while
those in the second row have accG set to 50% and accC to 100%, and those in the third row have accG
set to 100% and accC to 50%. With two settings for accuracy parameters at 50% and 100% and the set
of test policies, we have 13 distinct experiment conditions illustrated in Table 1. Some combinations of
28

these settings are not unique, so they are labeled with square brackets using the condition number that
they are identical to. For example, Never does not offer any suggestions no matter what the accuracy
settings are, so C4 is used for all three rows in the table.
accG (%) accC (%) Always DT-G DT-GC Never Heur-G Heur-GC
100 100 C1 C2 C3 C4 C5 C650 100 C7 C8 C9 [C4] C10 C11100 50 [C1] [C2] C12 [C4] [C5] C13
Table 1: Each cell in the table denotes an experimental condition, with unique conditions labeled asC1-C13. Other accuracy parameters not mentioned are set to 100%.
In an experiment, each condition would correspond to a system (of a particular policy and accuracy
setting) that participants can try with the test application. Ideally, we would have a within-subjects
experiment where one participant experiences all 13 conditions so we can evaluate how each system
performs relative to each other. However, it is logistically infeasible to expect anyone to remember how
well the systems performed (subjectively) after testing 13 of them. Another constraint is that most people
are only willing to attend one experiment session (as opposed to multiple sessions) of at most approximately
60 minutes long. Even if we discard the subjective measures and only consider the objective ones, users
would not have enough time to develop a general behaviour pattern with any one system if an experiment
consisted of 13 different systems. Therefore, we need a way to break down the comparisons.
An alternative design is a cross-subjects experiment where each participant experiences one condition
only, and we compare the results across subjects. In order to obtain significance, cross-subjects experiments
tend to require more data points than within-subject experiments. Suppose on average, participants
could complete 2 tasks per minute. Leaving sometime aside for questionnaires, breaks, etc., suppose each
participant completes about 100 tasks per session. With 10 participants per condition7, that yields 1000
tasks per condition (which means 1000 points for objective measures but only 10 points for subjective
responses). However, this still means 130 participants in total, which is too many for our purposes.
To simplify our set-up, we make a few assumptions. First, we assume that lower values of accC yields
lower overall utility. Since we are interested in what the characteristics component contributes to overall
utility, we only consider the best scenario (perfect accuracy) and omit the conditions in the third row of
Table 1. Second, we assume that the output of the characteristics component is best utilized in a decision-
theoretic setting (as supposed to a heuristic setting). For this reason, we omit the conditions involving the
policy Heur-GC. To address the first experiment question from A.3.1, we can compare the performance
between DT-G and DT-GC by varying goal accuracy. This comparison corresponds to using conditions
C1 to C4 for accG=100% and C4,C7,C8,C9 for accG=50%. To address the second experiment question
7Without knowing how much variance is in the data, we cannot calculate the sample size required to obtain significance.
29

from A.3.1, we can compare the performance between DT-G and Heur-G by varying goal accuracy.
This comparison corresponds to using conditions C2,C4,C5,C7 for accG=100% and C4,C7,C8,C10 for
accG=50%. With these two assumptions, we have 9 conditions remaining. Unless one of the experiment
questions is dropped, there is no obvious way of reducing the number of conditions any further.
A.3.3 Controlling Parameter Settings
To create different accuracy settings, we control the output of the prediction components. First, we
discuss how we control accC . Since we focus on conditions C1-C9, we omit the discussion of controlling
accC = 50% here. As mentioned above, we use a pre-questionnaire to elicit the true user type at the
beginning of an experiment. Setting accC = 100% means the characteristics component predicts the true
type at each time step. Recall that we consider two kinds of prediction output — a distribution of user
types versus a ranking of user types. In the distributional case, this means the true type has probability
1.0, while the other types consequently have probability 0. In the ranking case, this means the true type
has rank 1, while the other types are set to rank 2.
Next, we discuss how we control accG. As illustrated in Figure 2, we create slides showing the user’s
task, and thereby controlling and knowing the user’s true goal in each task. Setting accG = 100% means
that the goal component is able to predict the true goal (even at the beginning of a task). Recall that
we consider two kinds of prediction output — a distribution versus a ranking of goal candidates. In
the distributional case, this means the true goal has probability 1.0, while the others consequently have
probability 0. In the latter case, this means the true goal has rank 1, while the other ranks are set to 2.
These two tweaks comply with the accuracy definitions provided in A.2.
Setting accG = 50% means that, on average, the goal component predicts candidates with a relative
quality of 50% correct in comparison to the true goal. According to the definition of accC for the distri-
butional case, this means the expected relative quality of all non-zero probability candidates is 0.5. The
simplest way to achieve this is to make sure each candidate has a relative quality of 0.5. (This means
setting the probability of the candidates with other values of relative quality to zero.) In the ranking case,
the definition of accC means that all ranked 1 candidates has at most 0.5 relative quality. Again, the
simplest way to achieve this is to make sure each ranked 1 candidate has a relative quality of 0.5. (This
means setting the ranks of the candidates with other values of relative quality to a low rank.) Furthermore,
we will set the rank of the true goal to be N/2, where N is the total number of goal candidates.
Lastly, we discuss how we control π by explaining how the corresponding systems are designed. First,
Never does not make suggestions, so it is the same as the regular PowerPoint application. Next, the
remaining 4 policies all make use of the goal prediction output, so we explain how the goal component
30

is implemented. Recall from Chapter 5 that we use finite state machines to track the user’s goal and
compute the system’s belief of goals. This is the method used for policies DT-G and DT-GC. As for
policies Always and Heur-G, we use the same approach, but we need to further convert the output goal
probabilities into ranks. Finally, the only system policy that makes use of the characteristics component
is DT-GC. One approach is to use probabilistic inference as described in Chapter 4. However, since our
evaluation always sets the prediction output to accC = 100%, no inference is necessary.
A.3.4 Experiment Hypotheses
We first check for the intuitive scenario where we expect decreasing goal accuracy to yield lower overall
utility. We define the following hypotheses:
H1: the mean utility of a help system is different when accG=100% and accC=100% than the mean
utility of it when accG=50% and accC=100%
H1.a: when the system policy is Always
H1.b: when the system policy is Heur-G
H1.c: when the system policy is DT-G
H1.d: when the system policy is DT-GC
Corresponding to the two questions to explore the impact of the characteristics component and the impact
of a DT policy in intelligent help systems, we formulate these hypotheses:
H2: the mean utility of an adaptive help system with a characteristics component is different than the
mean utility of an adaptive help system without one (i.e., comparing policies DT-GC and DT-G)
H2.a: when accG=100% and accC=100%
H2.b: when accG=50% and accC=100%
H3: the mean utility of an adaptive help system with a DT policy is different than the mean utility of
an adaptive help system with a heuristic policy (i.e., comparing policies DT-G and Heur-G)
H3.a: when accG=100% and accC=100%
H3.b: when accG=50% and accC=100%
References
[1] A. Bunt, C. Conati, and J. McGrenere. What role can adaptive support play in an adaptable system?
In Proc. of IUI, pages 117–124, 2004.
31

[2] C. Conati and H. Mclaren. Data-driven refinement of a probabilistic model of user affect. In Proc.
of UM, pages 40–49, 2005.
[3] K.Z. Gajos and D. Weld. Preference elicitation for interface optimization. In Proc. of UIST, 2005.
[4] K.Z. Gajos and D.S. Weld. SUPPLE: automatically generating user interfaces. In Proc. of IUI, pages
93–100, 2004.
[5] E. Horvitz and J. Apacible. Learning and reasoning about interruption. In Proc. of ICMI, pages
20–27, 2003.
[6] E. Horvitz, J. Breese, D. Heckerman, D. Hovel, and K. Rommelse. The Lumiere Project: Bayesian
User Modeling for Inferring the Goals and Needs of Software Users. In Proc. of UAI, pages 256–265,
1998.
[7] E. Horvitz, P. Koch, and J. Apacible. Busybody: Creating and fielding personalized models of the
cost of interruption. In Proc. of CSCW, 2004.
[8] B. Hui and C. Boutilier. Modeling the Disruption to the User’s Mental Model. Neural Information
Processing Systems (NIPS), Workshop on User Adaptive Systems, 2006.
[9] B. Hui and C. Boutilier. Who’s Asking for Help? A Bayesian Approach to Intelligent Assistance. In
Proc. of IUI, pages 186–193, 2006.
[10] B. Hui and C. Boutilier. Toward Eliciting Experienced Utilities for Interface Customization. In Proc.
of UAI, pages 298–305, 2008.
[11] B. Hui, S. Gustafson, P. Irani, and C. Boutilier. The Need for an Interaction Cost Model. In Proc.
of AVI, pages 458–461, 2008.
[12] B. Hui, S. Liaskos, and J. Mylopoulos. Requirements Analysis for Customizable Software: A Goals-
Skills-Preferences Framework. In Proc. of RE, pages 117–126, 2003.
[13] B. Hui, G. Partridge, and C. Boutilier. A Probabilistic Mental Model For Estimating Disruption. In
Proc. of IUI, page submitted, 2009.
[14] A. Kapoor, W. Burleson, and R.W. Picard. Automatic prediction of frustration. International Journal
of Human-Computer Studies, 65(8):724–736, 2007.
[15] G. Linden, S. Hanks, and N. Lesh. Interactive assessment of user preference models: The automated
travel assistant. In Proc. of UM, 1997.
32

[16] P. Pu, B. Faltings, and M. Torrens. User-involved preference elicitation. In IJCAI Workshop on
Configuration, 2003.
33