Embed Size (px)
Citation preview

CHAPTER ONE
INTRODUCTION
1.1 Background to the Study
Since Nigeria attained independence in 1960, considerable efforts have been directed towards
industrial development. The initial efforts were government-led through the vehicle of large
industry, but lately, emphasis has shifted to Small and Medium Scale Enterprises (SMEs)
following the lessons learnt from the success of SMEs in the economic growth of Asian
countries (Ojo, 2003). Thus, the recent industrial development drive in Nigeria has focused on
sustainable development through small business development. Prior to this time, particularly
judging from the objectives of the past National Development Plans, 1962-68, 1970-75, 1976-80
and 1981-85, emphasis had been on government-led industrialization, hinged on import-
substitution strategy.
Since 1986, government had reduced its role as the major driving force of the economy through
the process of economic liberalization entrenched in the IMF pill of Structural Adjustment
Programme. Emphasis, therefore, has shifted from large-scale industries to small and medium-
scale industries, which have the potentials for developing domestic linkages for rapid and
sustainable industrial development. Attention was focused on the organized private sector to
spearhead subsequent industrialization programmes. The incentives given to encourage increased
participation in these sectors were directed at solving and/or alleviating the problems
encountered by industrialists in the country, thereby giving them opportunity to increase their
contribution to the Gross Domestic Product (GDP).
The contribution of Micro, Small & Medium Enterprises (MSMEs) to economic growth and
sustainable development is globally acknowledged (CBN, 2004). There is an increasing
recognition of its pivotal role in employment generation, income redistribution and wealth
creation (NISER, 2004). The micro, small and medium enterprises (MSMEs) represent about 87
per cent of all firms operating in Nigeria (USAID, 2005). Non-farm micro, small and medium
enterprises account for over 25 per cent of total employment and 20 percent of the GDP
1

(SMEDAN, 2007) compared to the cases of countries like Indonesia, Thailand and India where
Micro, Small and Medium Enterprises (MSMEs) contribute almost 40 percent of the GDP (IFC,
2002).
Whilst MSMEs are an important part of the business landscape in any country, they are faced
with significant challenges that inhibit their ability to function and contribute optimally to the
economic development of many African countries. The position in Nigeria is not different from
this generalized position (NIPC, 2009).
Realizing the importance of small businesses as the engine of growth in the Nigerian economy,
the government took some steps towards addressing the conditions that hinder their growth and
survival. However, as argued by Ojo (2003), all these SME assistance programmes have failed to
promote the development of SMEs. This was echoed by Yumkella (2003) who observes that all
these programmes could not achieve their expected goals due largely to abuses, poor project
evaluation and monitoring as well as moral hazards involved in using public funds for the
purpose of promoting private sector enterprises. Thus, when compared with other developing
countries, Variyam and Kraybill (1994) observed that many programmes for assisting small
businesses implemented in many Sub-Saharan African (SSA) countries through cooperative
services, mutual aid groups, business planning, product and market development, and the
adoption of technology, failed to realize sustained growth and development in these small
enterprises. Among the reasons given were that the small-sized enterprises are quite vulnerable
to economic failure arising from problems related to business and managerial skills, access to
finance and macroeconomic policy.
Despite MSME’s important contributions to economic growth, small enterprises are plagued by
many problems including stagnation and failure in most sub-Saharan African countries (Bekele,
2008). In Nigeria, the problem is not limited to lack of long-term financing and inadequate
management skills and entrepreneurial capacity alone, but also, includes the combined effect of
low market access, poor information flow, discriminatory legislation, poor access to land, weak
linkage among different segments of the operations in the sector, weak operating capacities in
terms of skills, knowledge and attitudes, as well as lack of infrastructure and an unfavourable
economic climate.
2

Lack of access to finance has been identified as one of the major constraints to small business
growth (Owualah, 1999; Carpenter, 2001; Anyawu, 2003; Lawson, 2007). The reason is that
provision of financial services is an important means for mobilizing resources for more
productive use (Watson and Everett, 1999). The extent to which small enterprises can access
fund determines the extent to which small firms can save and accumulate their own capital for
further investment (Hossain, 1988), but small business enterprises in Nigeria find it difficult to
gain access to formal financial institutions such as commercial banks for funds. The inability of
the MSEs to meet the conditionalities of the formal financial institutions for loan consideration
provided a platform for attempt by informal institutions to fill the gap usually based on informal
social networks; this is what gave birth to micro-financing. In many countries, people have relied
on the mutually supportive and benefit-sharing nature of the social networking of these sectors
for the fulfilment of economic, social and cultural needs and the improvement of quality of life
(Portes, 1998). Networks based on social capital exist in developed as well as developing
countries including Nigeria.
The reluctance of formal financial institutions to introduce innovative ways of providing
meaningful financial assistance to the MSEs is attributed to lack of competition among financial
service providers, in the sense that none of financial service providers came up with an
innovative way of financing small businesses. In order to enhance the flow of financial services
to the MSME subsector, Government had, in the past, initiated a series of programmes and
policies targeted at the MSMEs. Notable among such programmes were the establishment of
Industrial Development Centres across the country (1960-70), the Small Scale Industries Credit
Guarantee Scheme (SSICS) 1971, specialized financial schemes through development financial
institutions such as the Nigerian Industrial Development Bank (NIDB) 1964, Nigerian Bank for
Commerce and Industry (NBCI) 1973, and the National Economic Recovery Fund (NERFUND)
1989. All of these institutions merged to form the Bank of Industry (BOI) in 2000. In the same
year, Government also merged the Nigeria Agricultural Cooperative Bank (NACB), the People’s
Bank of Nigeria (PBN) and Family Economic Advancement Programme (FEAP) to form the
Nigerian Agricultural Cooperative and Rural Development Bank Limited (NACRDB). The Bank
was set up to enhance the provision of finance to the agricultural and rural sector. Government
3

also facilitated and guaranteed external finance by the World Bank (including the SME I and
SME II loan scheme) in 1989, and established the National Directorate of Employment (NDE) in
1986.
In 2003, the Small and Medium Enterprise Development Agency of Nigeria (SMEDAN), an
umbrella agency to coordinate the development of the SME sector was established. In the same
year, the National Credit Guarantee Scheme for SMEs to facilitate its access to credit without
stringent collateral requirements was reorganised and the Entrepreneurship Development
Programme was revived. In terms of financing, an innovative form of financing that is peculiar
to Nigeria came in the form of intervention from the deposit-money banks. The deposit money
banks through its representatives, ‘the Banker's Committee’, at its 246 th meeting held on
December 21, 1999. The deposit-money banks agreed to set aside 10% of their profit before tax
(PBT) annually for equity investment in small and medium scale industries. The scheme aimed,
among other things, to assist the establishment of new, viable SMI projects; thereby stimulating
economic growth, and development of local technology, promoting indigenous entrepreneurship
and generating employment. Timing of investment exit was fixed at minimum of three years, that
is, banks shall remain equity partners in the business enterprises for a minimum of three years
after which they may exit anytime. By the end of 2001, the amount set aside under the scheme
was in excess of six billion naira, which then rose to over N13 billion and N41.4 billion by the
end of 2002 and 2005 respectively.
The modality for the implementation of the fund is such that the fund set aside is to be invested
within 18 months in the first instance and 12 months thereafter. After the grace period, the CBN
is required to debit the banks that fail to invest the fund set aside and invest same in treasury bills
for 6 months. Thereafter, the un-invested fund would be bidded for by successful investors under
the scheme. The fund set aside by the banks under the scheme decreased from N41.4 billion in
2005 to N38.2billion in 2006. This was as a result of N2.5billion and N25.3 million set aside
from failed banks and liquidated banks respectively, which were netted out after the bank
consolidation exercise. Actual investment during the period grew from N12 billion in December
2005 to N17 billion in 2006, representing only 29.1 percent of the total fund set aside. In 2007,
total amount set aside decreased further to N37.4 billion, while total investment stood at N21.1
4

billion representing 56 percent of the total sum set aside. The number of projects that benefitted
from the scheme also increased to 302 projects in 2007, from 248 in 2006 (CBN, 2007).
The CBN found the reasons for the slow pace in utilization of the SMIEIS fund to include: the
desire of the Banks to acquire controlling shares in the funded enterprises and the entrepreneurs’
resistance to submit control; inability of the banks to adapt equity investment which is quite
different from what the banks are familiar with in credit appraisal and management, and lack of
proper structure for effective administration of the scheme when it took off among other factors.
Responding to the findings, the Bankers’ Committee took a policy decision to extend funding
under the scheme to all business activities including even non-industrial enterprises, except for
general commerce and financial services. The name of the scheme was changed from SMIEIS to
Small and Medium Enterprises Equity Investment Scheme (SMEEIS) to reflect the expanded
focus. Also, the limit of banks’ equity investment in a single enterprise was increased from N200
million to N500 million, making room for medium size industries.
Despite all these efforts, the contribution of SMEs in the industrial sector to the Nation’s GDP
was estimated to be 37% compared to other countries like India, Japan and Sri Lanka and
Thailand where SMEs contributed 40%, 52% 55% and 47.5% respectively to the GDP in 2003,
(UNCTAD, 2003), hence the need for alternative funding window. In 2005, the Federal
Government of Nigeria adopted microfinance as the main financing window for micro, small and
medium enterprises in Nigeria. The Microfinance Policy Regulatory and Supervisory Framework
(MPRSF) was launched in 2005. The policy, among other things, addresses the problem of lack
of access to credit by small business operators who do not have access to regular bank credits. It
is also meant to strengthen the weak capacity of such entrepreneurs, and raise the capital base of
microfinance institutions. The objective of the microfinance policy is to make financial services
accessible to a large segment of the potentially productive Nigerian population, which have had
little or no access to financial services and empower them to contribute to economic
development of the country.
The microfinance arrangement makes it possible for MSEs to secure credit from Microfinance
Banks (MFBs) and other Microfinance Institutions (MFIs) on more liberal terms. It is on this
5

platform that we intend to examine the impact of microfinance on small business growth,
survival, as well as business performance of MSEs operators.
1.2 Statement of Research Problems
Majority of the micro and small enterprises (MSEs) in Nigeria are still at a low level of
development, especially in terms of number of jobs, wealth and value creation. This is because
65% of the active population, who are majorly entrepreneurs, remain unserved by the formal
financial institutions. The microfinance institutions available in the country prior to 2005 were
not able to adequately address the gap in terms of credit, savings and other financial services. As
reported by the CBN, the share of micro credit as a percentage of total credit was 0.9%, while its
contribution to GDP was a mere 0.2% (CBN, 2005). The CBN in 2005 identified the
unwillingness of conventional banks to support micro-enterprises, paucity of loanable funds,
absence of support institutions in the sector, as well as weak institutional and managerial
capacity of existing microfinance institutions among other reasons as the major reasons for the
failure of past microfinance initiatives in the country. To address the situation, the Microfinance
Policy, Regulatory and Supervisory Framework (MPRSF) for Nigeria was launched by CBN in
2005 to provide sustainable financial services to micro entrepreneurs. This initiated an important
turning point in the microfinance industry with the establishment of the Microfinance Bank
(MFB) as an institutional vehicle for privately owned, deposit taking Microfinance Institutions
(MFIs). The framework is designed to unite the best of the NGO credit organizations, and new
MFI initiatives under a common legal, regulatory and supervisory regime. Five years down the
line, though microfinance has proven to be one of the ways of bridging the resource gap created
in the Nigerian economy, there are still some undesirable problems experienced against its
proper execution. The lack of documentation of the practice of microfinancing in Nigeria has
made it difficult to formulate supportive programmes for the growth of the sector.
Despite the potential importance of MSMEs in any economy, high mortality rate among
established MSMEs is a matter of major concern in developing economies. International Finance
Corporation (IFC) reported in 2002 that only 2 out of every 10 newly established businesses
survive up to the fifth year in Nigeria. The report was corroborated by Small and Medium
Enterprise Development Agency of Nigeria (SMEDAN) that only 15% of newly established
businesses survive the first five years in Nigeria. This is a pointer to the fact that there is a
6

problem. The indispensable role of finance to the growth and survival of MSMEs and the
adoption of microfinance as the main source of financing MSMEs in Nigeria therefore makes it
imperative to study the extent to which microfinance can enhance small business survival.
The impact of micro-financing majorly should be seen in the multiplication of MSEs across
Nigeria. The survival of these MSEs should reflect in employment generation, engagement of
available local resources, local technology utilization, improved standard of living and growing
gross domestic product (GDP). However, despite MSEs representing about 87% of all firms
operating in Nigeria (USAID, 2005), they only account for 10% of total manufacturing output,
25% of total employment in the productive sector and 37% of GDP (Investment Climate
Assessment (ICA) survey, 2009). A common problem for the Nigerian small business sector is
that, the high rates of formation of new businesses evidenced in Corporate Affairs Commission
(CAC) annual report have not yet translated into comparable high rates of small firm growth.
New firms are being started but few grow rapidly to become significant international
competitors. For the great majority of micro and small enterprise in Nigeria long term growth
remains uncertain and bleak. The question is how many of these small businesses are
transforming from the subsistence level at start-up to the stage of maturity and later expansion
where they will have to employ more hands? Total productive output is also low compared to
other emerging economies like India, Sri Lanka and Thailand where SMEs contribute 40%, 55%
and 47% respectively in 2002 into the productive sectors of the economy (UNCTAD, 2003).
It is not uncommon to find in many microfinance programmes non-financial services such as
advisory services, managerial and technical training, weekly meetings and pre-loan training to
mention only a few, rendered as support services to MSMEs. These services that are poorly
provided in Nigeria are mostly very costly to deliver (McKernan, 2002), yet many microfinance
programmes consider them an integral part of the success of their programmes. Though the
contribution of such non-financial services is not in doubt, the extent of the contributions is yet
to be ascertained in Nigeria.
1.3 Research QuestionsThe study attempts to answer the following research questions:
1. To what extent does micro financing enhance the survival of MSEs in Nigeria?
7

2. To what extent is the growth of small businesses influenced by the financing capacity of
Microfinance Banks?
3. How does the injection of microfinance funds into small business operations affect the
productivity of MSEs in Nigeria?
4. What role(s) does the incorporation of non-financial services of microfinance banks play
in enhancing the business performance of MSEs in Nigeria?
5. What is the nature, mode of operation and process of micro financing in Nigeria?
1.4 Objectives of the StudyThe aim of this study is to estimate the effects of microfinancing on business performance of MSEs
in Nigeria.
The primary objectives are to:
1. assess the contributions of microfinancing to the survival of MSEs in Nigeria.
2. analyse the effects of microfinancing on MSE growth and expansion capacity in Nigeria.
3. ascertain the effects of microfinance on the productivity of MSEs operators in Nigeria.
4. examine the effects of non-financial services of microfinance institutions on MSEs
business performance in Nigeria.
5. document the operations and processes of microfinancing activities in Nigeria.
1.5 Statement of Hypotheses1. Ho – Microfinancing makes no significant contribution to the survival of MSEs in
Nigeria.
2. Ho – Microfinancing does not have the capability to influence the expansion capacity of
MSEs in Nigeria.
3. Ho – Microfinance has no significant effect on the level of productivity of MSEs in
Nigeria.
4. Ho – The provision of non-financial services (training and advisory services) by micro
finance institutions does not enhance the performance of MSEs in Nigeria.
8

1.6 Significance of the StudyA significant amount of empirical research has been carried out both within and outside the
country on the relationship between microfinance and microenterprise development (See Kotir
and Obeg-odom, 2009; Ogunrinola and Alege, 2007; Pronyk, Hargreaves and Morduch, 2007;
Matouv, 2006; Khandker, 2005; Morduch and Haley, 2002). It has been observed from the
literature, that most research works treated microfinance as a solution to poverty. To the best of
our knowledge, the impact of microfinance on Micro and Small Enterprise survival and growth
has not been empirically tested in the literature, especially in Nigeria. Most researchers in
Nigeria have also not taken time to document the nature, mode of operation and processes
involved in microfinancing. This study therefore becomes significant in filling this observed gap
by testing empirically the impact of both the financial and non-financial services offered by
Microfinance Banks on small business growth/survival and by examining the capability of
Microfinance institutions in enhancing the expansion capacity of small businesses in Nigeria.
The study also contributes to the literature on microfinance and small business survival.
Successive governments in Nigeria have always had a policy programme for SMEs, but most of
the programmes have failed to achieve sustainable growth in the SMEs sub-sector. Most of the
government assisted-programmes have themselves become failures. The findings of this study is
expected to inform policy makers regarding the direction of further research into interventionist
programmes for MSEs in Nigeria. The study is also of great importance to Microfinance
Institutions, in the sense that it is expected to assist the microfinance institutions in assessing the
effectiveness of their programmes and to know which variables contribute most to small business
growth and survival. The study is expected to assist the microfinance institutions in their credit
policy formulation strategies. For owners and managers of micro and small businesses, access to
a study like this can aid their understanding of current challenges and reveal the essential factors
that promote small business growth and survival and thus enable them to focus on the relevant
ones in an attempt to enhance their growth and performance. The study is expected to help the
government to validate or reject the choice of microfinance as the main source of financing
MSEs in Nigeria and also suggest ways of improving the existing financing arrangements, if
need be.
9

1.7 Scope of the studyThe study provides insight into microfinance and small business survival and growth, as well as
provides a measure of the effects of microfinancing on small business performance and
productivity in Nigeria. It covers MSEs that have access to microfinance for a period of at least
five years (2004 – 2008). The population for the study includes the clients of the selected
Microfinance Banks, that is, the 169 Microfinance Banks in the South-West geopolitical zone
that have obtained their final operating licenses as of the year 2009. These includes microfinance
banks that metamorphosed from community Banks into MFBs in 2005. They are spread across
both rural and urban areas of the South-West geographical zone. The microfinance clients are
selected based on the following criteria:
1. The client that has stayed for a minimum of 5 years with the Microfinance Banks, i.e
from the period 2004 to 2008.
2. The client operates/manages a small or micro business enterprise.
Five years is often used as a yardstick for survival by demographers (Alexander, Davern and
Stevenson, 2010) to permit greater balancing of statistical power of test.
1.8 Limitation of the studyThe main limitation of the study is the reliance on information supplied by micro and small
business operators who normally do not want to make a full disclosure of their businesses to an
unknown person for fear of being subjected to tax payment. In the same vein, most of the small
business operators lack proper record keeping practices and do not adhere to standard book
keeping and accounting procedures. Some of them do not have the necessary skills needed for
sound book keeping, auditing and tax assessment; neither do they employ qualified personnel to
undertake such tasks for them. The oath of secrecy between the bank and its customers is
another area of constraint in this study. Factors such as economic environment, political
instability and government policy on MSEs are considered to have strong effects on MSE
performance but are not readily available and so constitute a constraint to the study. However,
we rely on scientific methods to obtain the data and the analysis is based on superior analytical
techniques, which we believe allow us to generalize our findings.
10

1.10 Definition of Terms Micro enterprise: Micro- enterprise is the informally organized business activity
undertaken by entrepreneurs; excluding crop production by convention, employing less
than ten people and having assets less than N5 million excluding land and building.
Small enterprise: Small enterprise is any enterprise that employs between ten (10) to
forty-nine (49) people and has asset worth (excluding land and building) between N5
million and N50 million.
Medium enterprise: Medium enterprise is any enterprise that employs between fifty (50)
and one hundred and ninety–nine (199) people and has assets worth (excluding land and
building) between N50 million and N500 million (SMEDAN, 2007).
Microfinance Banks: Microfinance Banks are licensed financial institutions meant to
serve the un-served, but economically active clients in the rural and peri-urban areas by
providing diversified, affordable and dependable financial services to the active poor, in a
timely and competitive manner, which would enable them to undertake and develop long-
term, sustainable entrepreneurial activities and mobilize savings for intermediation
(CBN, 2005).
Microfinance Institutions: Microfinance Institutions are organizations whose activities
consist wholly or in significant part, of the provision of financial services to micro
entrepreneurs.
Microfinance: Microfinance denotes the provision of financial services adapted to the
needs of low income people such as micro-entrepreneurs, especially the provision of
small loans, acceptance of small savings deposits and simple payment services needed by
micro-entrepreneurs and other poor people (USAID, 2005).
Microcredit: Microcredit is commonly defined in terms of loan amount as a percentage
of average per capita income (USAID, 2005). In the context of Nigeria, with a GDP per
capita of N42,000 (about $300) in 2003, loans up to N50,000 (around $350) will be
regarded as micro loans. GDP per capital (PPP U$) in 2007 was U$1,969 (UNDP – HD
Report, 2009).
Microsavings: Microsavings are defined as savings accounts with a balance of less than
N8,400 (about $50), that is less than 20% of the average annual income per capita.
11

CHAPTER TWO
LITERATURE REVIEW2.1 Introduction
In this chapter, the literature on microfinance and small business survival, growth and
performance is reviewed. Also included is the conceptual and theoretical framework of
microfinance and MSMEs in Nigeria. Also included is the result of past impact assessment
studies of microfinance in Nigeria and other countries of the world.
2.2 Review of Conceptual Issues
2.2.1 Concepts of Micro, Small and Medium Enterprises and Microfinance
Defining small business has always been very difficult and controversial. The term ‘small
business’ covers a variety of firms (Hertz, 1982; Nguyen and Bellehumeur, 1983) and it is used
loosely in most of the literature. According to Peterson, Albaum and Kozmetsky (1986), a small
business is one which is independently owned and operated and which is not dominant in its field
of operation. Researchers and other interested parties have used specific criteria to operationalize
the small business, from the perspective of value added, value of assets, annual sales, and
number of employees. Annual sales and number of employees are most often used to delimit the
category. The problem of definition confronts all researchers as well as operators in the field.
A review of the literature on Micro, Small and Medium Enterprises (MSMEs) shows that the
definition of MSMEs significantly varies from country to country depending on factors such as
the country’s state of economic development, the strength of the industrial and business sectors,
the size of MSMEs and the particular problems experienced by MSMEs (Harabi, 2003). Hence,
there is no uniform or universally accepted definition of MSMEs (Investment Climate
Assessment (ICA), 2009). In Nigeria, parameters such as asset base (excluding land), the number
of workers employed and the annual turnover are used for the classification of MSMEs.
Carpenter (2001) maintains that there is no one definition for SMEs; they are defined in Nigeria
and other countries based on one or all of the following: the size or amount invested in assets
excluding real estate; the annual turnover and the number of employees. The 1992 review by the National Council on Industrial Standards (NCIS) defined small and medium scale enterprises (SMEs) as
enterprises with total cost (including working capital but excluding cost of land) of more than
12

N31m, but not exceeding N3,150million, with a labour size of between 11 and 100 employees.
There is, however, a consensus of opinions when it comes to defining SMEs in terms of asset
base than on any other parameter. This is because in case of an economic depression, the impact
on turnover and employment base would be greater than the impact on asset base. For instance,
during a depression, there is a tendency for turnover and the number of people employed to fall
substantially, while the asset base may be unaffected (NCIS,1992).
MSMEs can be divided into micro, small and medium enterprises. The Federal Ministry of
Industries defines a medium-scale enterprise as any company with operating assets less than
N200 million, and employing less than 300 persons. A small-scale enterprise on the other hand,
is one that has total assets of less than N50 million, with less than 100 employees. Annual
turnover is not considered in the definition of an SME. The National Economic Reconstruction
Fund (NERFUND) defines an SSE as one whose total assets are less than N10 million, but
makes no reference either to its annual turnover or the number of employees. These and other
definitions of the National Association of Small Scale Industries (NASSI), the National
Association of Small and Medium Enterprises (NASME), the Central Bank of Nigeria (CBN)
and other institutions are shown in the Table below.
Table 2.1 Definition of SME by Nigerian Institutions
Parameters Total Assets ( N’m) Annual Turnover (N’m) No of Employees
Nigerian Institution MSE SSE ME MSE SSE ME MSE SSE ME
Fed. Min. of Industries. <200 <50 n.a. n.a. n.a. n.a. <300 <100 <10
Central Bank <150 <1 n.a. <150 <1 n.a. <100 <50 n.a.
NERFUND n.a. <10 n.a. n.a. n.a. n.a. n.a. n.a. n.a.
NASSI n.a. <40 <1 n.a. <40 n.a. n.a. 3 - 35
n.a.
NASME <150 <50 <1 <500 <100 <10 <100 <50 <10
Nigeria Industrial Policy
n.a < 2m <.1 n.a n.a n.a n.a n.a n.a
Source: World Bank, SME Country Mapping 2001
13

The World Bank Group prescribed the following definition based on number of employees, total
assets and turnover. The body defined MSMEs as follows;
Micro-enterprise: Employs 10 or less, with total assets of $100,000 or less, and turnover
of $100,000 or less.
Small enterprise: Employs between 11 – 50 people, with total assets of $100,000.00 -
$3m, and turnover of $100,000.00 - $3m.
Medium enterprise: Employs 51 – 300 staff, total assets of $3m - $15m, and turnover of
$3m - $15m.
The Nigerian Industrial Policy (1989), defined MSMEs as those with total investment of between
$13,000 and $260,000 (N100,000 and N2m) excluding land and working capital, while micro
enterprises and cottage industries were defined as those with investments not exceeding $13,000
(N100,000) excluding land but including working capital (Naira/Dollar exchange rate 1989 is
N7.6/$1, CBN Statistical Bulletin, 2005).
The MSMEs of the World Bank Group proposed the following definitions: Micro Enterprises:
Employment, 10 or less, Total assets; $100,000 or less, and Turnover; $100,000 or less. Small
Enterprises: Employment, 10 – 50, Total Assets; $100,000 - $3m, and Turnover; of $100,000 -
$3m. Medium Enterprises: Employment; 50 – 300 staff, total assets; of $3m - $15m, and
Turnover; $3m - $15m (World Bank, 2007).
Small and Medium Enterprise Equity Investment Scheme (SMEEIS), a private initiative by the
Bankers’ Committee defined MSME as enterprises with an asset base not exceeding $3.85
million (N500 million) excluding land and working capital with staff strength of not less than 10
and not more than 300 (Sanusi, 2003).
A common feature of these definitions is that MSMEs are usually small, owner or family
managed businesses with basic goods and services. MSMEs also tend to lack the organizational
and management structures, which characterize large-scale enterprise. Urban MSMEs tend to be
more structured than their rural counterparts.
14

The National Policy on MSMEs adopts a classification based on the dual criteria: of employment
and assets (excluding land and buildings), as follows:
Table 2.2 Classification Adopted by SMEDAN for National Policy on MSMEs
SIZE CATEGORY EMPLOYMENT ASSETS (N million)
(excluding land and buildings)
1 Micro enterprises Less than 10 Less than 5
2 Small enterprises 10-49 5 – less than 50
3 Medium enterprises 50-199 50- less than 500
Source: SMEDAN, 2007
Where there exists a conflict in classification between employment and assets criteria (for
example, if an enterprise has assets worth seven million naira (N7m) but employs 7 persons), the
employment-based classification would take precedence and the enterprise would be regarded as
micro. Employment-based classification tends to be relatively a more stable definition, given
that inflationary pressures may compromise the asset-based definition. In choosing these
definitions, cognizance was taken of all possible factors, including international comparisons and
peculiarities of the various sub-sectors/enterprises (SMEDAN,2007).
It is obvious that there is no universal definition of MSMEs. Some countries define MSMEs
according to number of employees; others define them based on the level of assets or turnover or
both. However, most definitions are based on a mix of the above parameters. This creates a
definite problem for MSME operators. Lack of proper definition makes it difficult for them to
take advantage of government-assisted programmes meant for them.
Concepts in Microfinance
Microfinance is the provision of financial services adapted to the needs of low income people
such as micro-entrepreneurs, especially the provision of small loans, acceptance of small savings
deposits, and simple payments services needed by micro-entrepreneurs and other poor people
(USAID, 2000). It is the provision of financial services to the economically active poor who are
hitherto un-served by the mainstream financial service provider. Microcredit is commonly
defined in terms of loan amount as a percentage of average per capita income. In the context of
15

Nigeria, with a per capita GDP of N42,000 (about $300) in 2003, loans up to N50,000
(about/approximately $350) would be regarded as micro loans, while micro savings are defined
as savings accounts with a balance of less than N8,400 (about $50), that is less than 20% of the
average annual income per capita (USAID, 2004).
The Central Bank of Nigeria (CBN, 2005) defines microfinance as the provision of financial
services to the economically active poor and low income households. These services include
credit, savings, micro-leasing, micro-insurance and payment transfer, to enable them to engage in
income generating activities. The Microfinance Policy defines the framework for the delivery of
these financial services on sustainable basis to the Micro, Small and Medium Enterprises
(MSMEs) through privately-owned Microfinance Banks.
In another contribution, Ojo (2007) defined microfinance as small scale financial services that
are provided to rural/informal small scale operators for farming, fishing, trading, and building of
houses and to engage in any other productive and distributive activities. Microfinance and micro
financial institutions are intended to fill a definite gap in the finance market and the financial
system respectively, to assist the financing requirements of some neglected groups who may be
unable to obtain finance from the formal financial system. These neglected groups that constitute
the target users of such microfinance are mainly in the informal sector of the economy and are
predominantly engaged in small scale farming, commercial/trading and industrial activities.
Mosley (2001) defined microfinance as financial services for poor and low-income clients. In
practice, the term is often used more narrowly to refer to loans and other services from providers
that identify themselves as “microfinance institutions” (MFIs). These institutions commonly tend
to use new methods developed over the last 30 years to deliver very small loans to unsalaried
borrowers, taking little or no collateral. These methods include group lending and liability, pre-
loan savings requirements, gradually increasing loan sizes, and an implicit guarantee of ready
access to future loans if present loans are repaid fully and promptly. According to Gupta (1996),
microfinance is a movement that envisions a world in which low-income households has
permanent access to a range of high quality financial services to finance their income-producing
activities, build assets, stabilize consumption and protect against minor investment risks. These
services are not limited to credit, but include savings, insurance, and money transfers.
16

Yunus (2006) describes microfinance as an amazingly simple approach that has been proved to
empower very poor people around the world to pull them out of poverty. It is a financial system
that relies on the traditional skills and entrepreneurial instincts of the active poor people, mostly
women, using small loans (usually less than US$200), other financial services, and support from
local organizations called microfinance institutions (MFIs) to start, establish, sustain, or expand
very small, self-supporting businesses. A key to microfinance is the recycling of loan. As each
loan is repaid—usually within six months to a year—the money is recycled as another loan, thus
multiplying the value of each loan in defeating global poverty and changing lives and
communities. He further explains that microcredit refers specifically to loans and the credit needs
of clients, while microfinance covers a broader range of financial services that create a wider
range of opportunities for success. Examples of these additional financial services include
savings, insurance, housing loans and remittance transfers. The local MFI might also offer
microfinance in addition to activities such as entrepreneurial and life skills training, and advice
on topics like health and nutrition, sanitation, improving living conditions and the importance of
educating children.
Gert van Maanen (2004), describes microfinance as ‘‘banking the unbankables, bringing credit,
savings and other essential financial services within the reach of millions of people who are too
poor to be served by regular banks, due to lack of sufficient collateral." Corroborating this
position, Yunus (2003) opines that microcredit is based on the premise that the poor have skills
which remain unutilized or underutilized and that it is not the lack of skills that makes poor
people poor. . . Charity is not the answer to poverty. It only helps poverty to continue. It creates
dependency and takes away the individual's initiative to break through the wall of poverty,
therefore, the solution to poverty is to unleash financial energy and help individual develop their
creative capacity.
Following these views, microloan may be seen as a new tool, a machine, or a shop in the
marketplace. Millions of the world’s poor and low-income people have taken advantage of small
loans to improve their lives. Over the past three decades, people have used small loans, known as
microcredit, to launch new enterprises, create jobs and help economies to flourish. Poor people
have proved time and again that they are able to repay these loans in time (United Nations,
2005). Yunus (2003) also observes that these loans are character-based rather than collateral-
17

based. Five women group all vouch for one another to get a loan, the women are not only
individually responsible, but their group is also liable for the loan. Just as important as making
microloans available so is providing business training and life skills classes where borrowers will
acquire the skills they need to succeed (Adelante, 2006).
Consultative Group to Assist the Poor (CGAP) reiterated that, microfinance allows poor people
to protect, diversify, and increase their sources of income. Microfinance helps to cushion poor
households against the extreme vulnerability that is a feature of their everyday existence and
which can push a family into destitution. Loans, savings, transfers, and insurance help to smooth
out income fluctuations and maintain consumption even during lean periods and emergencies.
Microfinance is thus reported to be capable of giving more people more options, empowering
them to make their own choices and build their own way out of poverty (CGAP, 2009).
Costa (2007) explains microfinance as a field that focuses on providing a variety of financial
services to the poor. Typically, individuals with very little income experience great difficulty in
taking advantage of things like savings opportunities and insurance products. Often, low incomes
go hand-in-hand with a lack of collateral and credit, making it difficult for the poor to obtain
loans, invest and enjoy insurance protection. Microfinance seeks to eliminate this problem,
providing microinsurance, microloans, and other financial services to low-income people. Often,
microfinance services are aimed at helping people to start their own businesses thus creating the
opportunity for increased income and greater financial independence. For example, a
microfinance loan of less than $100 United States Dollars (USD) could help an individual start a
business, creating a new income stream for him and maybe even providing new job opportunities
for others. Such a small loan could benefit the borrower in many ways, setting him up to provide
food, shelter, and education for his dependents. That microfinance loan could even help the
borrower to afford important medicines.
Barnes (2000) explains that microfinance is aimed at providing financial services in small
amounts. For example, it is possible for a person to benefit greatly from a loan of just $50 USD.
A bank would probably be uninterested in granting such a small loan and a low-income person
could have great difficulty in securing the loan of a larger amount. In such a case, a needy
18

individual might seek a loan from an unsafe source, accepting incredibly high rates and suffering
from unfair lending practices. With help from a microfinance institution, however, the individual
could secure a loan at a reasonable rate, without suffering unfortunate consequences.
The Economic and Social Commission of Western Asia (ESCWA, 2002) describes
microfinancing as a financial system that enables poor micro entrepreneurs to raise income
through productive activities and viable businesses. Its operations and its success depend on the
support it gets from the government, the civil society and from the financial institutions. The
country’s investment policy, its economic management, the policy of the financial institutions
and the role played by international organizations and NGOs in the country determine the
environment in which it operates.
.
Lack of work opportunities are, however, amongst the primary concerns of those in both rural
and urban areas. Few people in developing countries have salaried, formal employment. The
majority depend overwhelmingly upon earnings from occasional, low-paid labour or
employment in small and medium enterprises or in running micro enterprises themselves. Micro
enterprises are usually run from the home and can involve any type of income-generating work
such as street-trading, dairy farming and carpentry. To set up or develop such micro enterprises,
some amount of capital is required and for about 90% of people living in poverty, the only way
is to borrow money from their family, friends or moneylenders. Commercial banks do not
usually lend to small business owners because such loans are considered insecure, or
unprofitable. Local moneylenders charge high interest rates sometimes between 10% and 100% a
month and sometimes more (Opportunity international, 2002).
Microfinance institutions (MFIs) provide an alternative means for poor people to access basic
financial services in a way that seeks to help them to improve their lives. The term
‘microfinance’ covers a range of financial services offered to poor people. Microcredit involves
making small loans to people who do not have the necessary collateral to obtain credit from the
formal banking sector. Microcredit is sometimes supported with training and advice to help
micro-entrepreneurs to run successful businesses. Micro-savings are crucial to poor and low-
income families in order to meet both planned and unexpected needs that may arise. Micro-
19

insurance services can help to provide those living in poverty with a means of tackling costs that
might otherwise result in their becoming destitute. Micro leasing is a facility in which the leasee
is allowed to make periodic payment on an asset while he takes full possession of the asset.
2.2.2 Impact Assessment of Microfinance
Garmaise and Natiridada (2010) provide direct evidence on the impact of asymmetric
information on both financing and operating activities through a study of credit evaluations of
microfinance institutions (MFIs). They employ a regression discontinuity model that exploits the
eligibility criteria of an evaluation subsidy offered by a non-profit consortium. The evaluations
dramatically cut the cost of financing and found the effect strongest for commercial lenders and
for short-term MFI–lender relationships. The impact of evaluations on the supply of finance is
mixed. Evaluated MFIs lend more efficiently, extending more loans per employee.
Kotir and Obeg – Odoom (2009), in a study of 139 households in one rural area of the Upper
West Region of Ghana, found that, (a) Beneficiaries of micro-credit divert a significant portion of
such loans into household consumption – albeit with moderate impact on household productivity
and welfare and (b) Micro-credit has modest impact on rural community development.
Matovu (2006), using pooled data from Uganda, concludes that all the women clients reported
increase in their incomes which has improved their standard of living, enabled them to send their
children to school; pay their medical bills, feed their families, and cope with future crises using
their savings; the women have been empowered economically. He also notes that well
functioning market, entrepreneurial skills and other infrastructure support microfinance to
achieve results. However, some of the findings may not be conclusive; one should therefore be
careful in drawing conclusions there from.
Khandker (2005) observes microfinance supports mainly informal activities that often have a low
return and low market demand. It may therefore be hypothesized that the aggregate poverty
impact of microfinance is modest or even nonexistent. If true, the poverty impact of microfinance
observed at the participant level represents either income redistribution or short-run income
generation from the microfinance intervention. Khander’s article examines the effects of
microfinance on poverty reduction at both the participant and the aggregate levels using panel
20

data from Bangladesh. The results suggest that access to microfinance contributes to poverty
reduction, especially for female participants and to overall poverty reduction at the village level.
Microfinance thus helps not only poor participants but also the local economy.
Impact Studies of Microfinance on Income
The impact of microfinance on income has been analyzed at the individual, household and
enterprise levels. Hulme and Mosley (1996), conducted various studies on different microfinance
programmes in numerous countries and found strong evidence of the positive relationship
between access to a credit and the borrower’s level of income. The authors indicated that the
middle and upper poor received more benefits from income-generating credit initiatives than the
poorest. McKernan (2002) evaluated three significant microcredit programmes in Bangladesh
and discovered that the profit for self-employed activities of households could be increased by
programme participation. These programmes were also examined at the village-level, Khandker
et al (1998), showed that microloan have a positive impact on average households’ annual
income, especially in the rural non-farm sector. Copestake et al (2001) estimated the effect of an
urban credit programme – a group-based microcredit programme in Zambia- and found that
microcredit has a significant impact on the growth in enterprise profit and household income in
the case of borrowers who have received a second loan.
Sichanthongthip’s study (2004) also points to a positive impact of microcredit on the income
level of individual borrowers. This can be seen from the higher monthly income earned after the
member accessed credit. Shaw (2000) studied two microfinance institutions (MFIs) in
Southeastern Sri Lanka and showed that the less poor clients’ micro-business owner that
accessed loans from microfinance programmes could earn more income than those of the poor
could. Mosley (2001) evaluated the impact of loans provided by two urban and two rural MFIs
on poverty in Bolivia. He found that the net impact of microfinance from all institutions, at the
average level, was positive in relation to borrowers’ income, even though the net impact for
poorer borrowers might be less than the net impact on richer borrowers. Copestake (2002)
conducted a case study of the Zambian Copperbelt, applying the village bank model to
investigate the effect on income distribution at the household and enterprise levels. The study
showed that the impact on income distribution depends on who obtains the loan, who moves on
21

to larger loans and who exits the programme: group dynamics was also an important factor. He
notes, “Some initial levelling up of business incomes was found, but the more marked overall
effect among borrowers was of income polarization”(Copestake, 2002).
Impact Studies of Microfinance on Expenditure
Expenditure is another indicator used to measure the impact of microfinance. Pitt and Khandker
(1996 and 1998) estimated the effect of microcredit obtained by both male and female clients of
Grameen Bank and two other group-based microcredit programmes in Bangladesh on various
indicators such as expenditure on household consumption, health, education and welfare. They
showed that the clients of the programmes could gain from participating in microfinance
programmes in many ways. It was clear that per capita consumption could be increased by
accessing a loan from a microcredit programme such as the Grameen Bank. Khandker (2003)
also conducted research on the long-run impacts of microfinance on household consumption and
poverty in Bangladesh by identifying types of impact in six household outcomes as outlined
below: per capita total expenditure; per capita food expenditure; per capita non-food expenditure;
the incidence of moderate and extreme poverty; household non-land assets. The author found
that the microfinance effects on male borrower were much weaker than the impact effect on
female borrower and there was a decrease in return to borrowing all the time. Moreover, he noted
that the impact on food expenditure was less pronounced than that on non-food expenditure.
Besides, he showed that the poorest gained benefits from microfinance and that microfinance had
a sustainable impact in terms of poverty reduction among programme participants. In addition,
the author discovered that there was a spillover effect of microfinance to reduce poverty at the
village level. In contrast, the impact was less noticeable in reducing moderate rather than
extreme poverty. Morduch (1998) however, argues that the eligible households that participated
in these three microfinance programmes had strikingly less consumption levels than the eligible
households living in villages without the programmes.
In another study, Pitt and Khandker (1998) found that the behaviour of poor households was
significantly changed in the case of women’s participation in the micro credit programme. In
Bangladesh for example, it became clear that every 100 additional taka credit provided to women
by the microcredit programmes, namely the Grameen Bank, BRAC and BRDB, increased yearly
22

expenditure for household consumption by 18 taka, whereas that provided to men from the same
programmes raised yearly household consumption expenditure by 11 taka. However, there exists
a counter argument that microcredit programmes inflicted extreme pressure on women by
forcing them to meet difficult loan repayment schedules (Goetz and Gupta, 1996).
Impact Studies of Microfinance on Wealth
A further indicator of the impact of microfinance is wealth. Montgomery et al. (1996) examined
the performance and impact of two microfinance programmes in Bangladesh. They found that
there were positive impacts of a microcredit programme on both enterprise and household assets.
Clearly, even though total value of household assets had a slight increase after the borrowers
obtained their last loans, they had a significant increase in the value of productive assets. Pitt and
Khandker (1996 and 1998) also noted that the microcredit had a positive impact on women’s
non-land assets. Mosley (2001) also observed that there was a positive impact of microfinance
on asset levels. He points out that accumulation of asset and income status are generally highly
correlated, leading to an extreme correlation between income poverty and asset poverty.
Coleman (1999) investigated the impact of a village bank on borrower welfare in Northeast
Thailand. He found that there was a slight impact of programme loans on clients’ welfare.
However, he discovered that the village bank had a positive and significant impact on the
accumulation of women’s wealth, particularly landed wealth but this result included bias from
measured impact (discussed in methodology below). On the contrary, Mckernan (2002) found an
inverse relationship between participation in programme and household assets.
Besides, the microfinance impact on the indicators mentioned above, one study tried to examine
how the savings group in Laos affects the behaviour of members of a village savings group. It
showed that the behaviour of the village savings group members was changed as a result of
participating in a programme. While savings were previously kept in the form of gold, livestock,
jewelry, deposits in the bank, and savings at home, members now saved in the savings group
(Kyophilavong and Chaleunsinh, 2005).
23

Impact Studies of Microfinance on Educational Status
Many impact studies of microfinance have focused on educational status. Chowdhury and
Bhuiya (2004) studied the impact of a microfinance programme, Bangladesh Rural Advancement
Committee (BRAC) poverty alleviation programme, in Bangladesh and found that both member
and non-member groups of BRAC had improved educational performance. However, the BRAC
member households benefited much more than poor non-member households. Furthermore, girls
gained more than boys. Holvoet (2004) investigated the effects of microfinance on childhood
education by examining two microfinance programmes in South India – one with direct bank-
borrower credit, the other with group-mediated credit. The author showed that loans to women,
through women’s groups, had a significant positive impact on schooling and literacy for girls,
whereas it remained mainly unchangeable in the case of boys. However, in the case of direct
individual bank-borrower lending, there was no improvement in educational inputs and outputs
for children. Pitt and Khandker (1996) found that a credit to the participants provided by a
microfinance institution like the Grameen Bank, could increase school enrolment of children.
They found, for example, that in the case of the Grameen Bank and Bangladesh Rural
Development Board’s (BRDB) Rural Development RD-12 programme, credit lending to women
had a significantly positive impact on schooling for boys (Pitt and Khandker, 1998).
Impact Studies of Microfinance on Health
Indicators-related health issues are also applied as proxies to examine the impact of
microfinance. Chowdhury and Bhuiya (2004) found that microfinance programmes led to a good
improvement in child survival and nutritional status. Pitt and Khandker (1996) also noted that
there was a rise in contraceptive use and decrease in fertility in the case of the participants
obtaining a credit provided by the Grameen Bank. However, there was no evidence to prove that
an increase in contraceptive use or a decrease in fertility resulted from the participation of
women in group-based credit programmes. But fertility reduction was observed and
contraceptive use slightly increased in the case of men’s participation (Pitt et al., 1999).
Impact Studies of Microfinance on Empowerment
Microfinance also leads to the empowerment of women. Hashemi et al. (1996) studied two main
microfinance programmes in Bangladesh, the Grameen Bank and the Bangladesh Rural
24

Advancement Committee (BRAC). They noted that the participation of the programmes had
important positive effects on eight different dimensions of women’s empowerment: Mobility,
Economic security, Ability to make small purchases, Ability to make larger purchases,
Involvement in major household decisions, Relative freedom from domination as a result of
ownership of productive asset, Political and legal awareness, Participation in public protest and
political campaigning. Different methodologies have been adopted to analyze the impact of
microfinance programmes.
2.2.3 Methods of Data Analysis Found in Literature
Empirical studies on the impact of microfinance can be categorized into two main groups: those
that were not concerned with the selection bias problem and those that were. A large number of
impact studies of microfinance programmes did not take into account selection bias. According
to Chen’ s review of 11 impact studies of the Grameen Bank in Bangladesh, no study corrected
the selection bias (Chen, 1992 cited in Coleman 1999). Shaw (2004) also studied two
microfinance programmes in Sri Lanka, and used a questionnaire and conducted interviews in
one semi-urban and two rural groups. The author presented only median comparisons of client
incomes among four household income groups (extreme poor, poor, near-poor and non-poor), at
the time of the clients’ first loan (June, 1994) and at the time the research was conducted (June,
1999). However, he did not take into account selection bias. Sichanthongthip (2004) evaluated
the impact of a microfinance programme of the village savings group in a semi-urban area of
Laos and used a questionnaire to collect primary household data from members of the
microfinance programme at two points of time (before and after borrowing). He reported the
results of the impact on income by applying econometric analysis. On the other hand, he also did
not control for selection bias. Another study which also did not take into account such bias is the
one by Kyophilavong and Chaleunsinh (2005) who estimated the impact of a village savings
group in a semi-urban area of Laos through a survey of both members and non-members of
village savings groups. They presented only a comparison of the mean values of many impact
indicators for both members and non-members.
A number of researchers, however, have attempted to correct the selection bias. Hashemi et al.
(1996) evaluated the effect of rural credit programmes in Bangladesh by undertaking
25

ethnographic research in six villages during the period 1991-94 and conducting a survey in late
1992. The authors classified their sample into four groups consisting of Grameen Bank members,
BRAC members, Non-members living in the Grameen Bank villages (who would have been
eligible to join either BRAC or Grameen Bank), a comparison group living in villages without
the Grameen Bank or BRAC programmes but who would have qualified to join the credit
programmes.
They also tried to address the possibility of selection bias by including non-participants and
participants in Grameen Bank villages and comparing them with women living in villages
without microcredit programmes. However, Hashemi et al. (1996) did not control for the
possibility of endogenous programme placement, even though, the authors presented the effects
of credit programmes on eight dimensions of empowerment by applying logistic regression
models. Hulme and Mosley (1996) also tried to solve the selection bias by studying different
credit programmes in a number of countries. In their study, they included eight microfinance
institutions which provide group lending. Of these eight institutions, two were used as a control
group in case a loan had been approved for participants, but had not yet been received by any of
them. However, only the means of different outcome variables for both treatment and control
groups were introduced. There were no statistical analyses of the differences between the two
groups. In addition, the possibility of endogenous programme placement could not be controlled
with their available data (Coleman, 1999). Recently, many papers on the evaluation of
microfinance programmes have adopted an econometric approach and taken account of both the
selection bias and non-random programme placement (Pitt and Khandker 1996, 1998; Pitt et al.,
1999; Coleman, 1999 & 2002; Khandker, 2003; Khandker et al.,1998; McKernan, 2002;
Morduch, 1998).
Pitt and Khandker (1996) used survey data of the Grameen Bank and two other group lending
programmes in Bangladesh (the Bangladesh Institute of Development Studies (BIDS) and the
World Bank). They conducted a quasi-experimental household survey of 87 villages in 29 towns.
They sampled randomly for both members and non-members from villages that had a
microfinance programme. They also randomly chose households from villages without a
programme. In this case, credit programme availability was applied as an identifying variable.
26

The authors, however, identified that systematic variation will occur between the two kinds of
villages because of the possibility of endogenous programme placement. Thus, village-fixed
effects estimation was applied to control for unobserved variation between villages.
Nevertheless, households living in programme villages, which are exogenously excluded from
the programme by programme rules which restrict participation for household with more than 0.5
acres of land were principally excluded from membership consideration by any of the three
programmes, that were sampled for the survey. This might have resulted from the possibility of
collinearity between the village-specific dummy variables, identifying fixed effect, and the
availability of the programme. Many impact studies then applied a similar methodology as can
be seen from the studies by Pitt et al. (1999), Khandker (2003), Khandker et al.(1998),
McKernan (2002); and Morduch (1998). But, Khandker (2003) did some further interesting work
on the data set. He used the same data set as Pitt and Khandker (1996) and then did a follow-up
survey of the same households in 1998/99 to come up with panel data. However, according to
Coleman’s (1999) claim for the eligibility criteria for membership consideration, “most group
lending programmes…do not impose such eligibility criteria. Rather, they attempt to attract the
relatively poor and dissuade the relatively rich from participating by the small size of loans, the
high frequency of meetings, and the stigma of belonging to a poor person’s credit programme.
Hence, the method of Pitt and Khandker could not be implemented in most group lending
programmes. Moreover, even in the context of the three Bangladesh programmes they studied,
their survey found that some 18-34% of programme participants in fact had wealth that should
have excluded them from participating. Hence, the use of this eligibility criterion as a key
exclusion restriction may not be appropriate” (Coleman, 1999).
The methodology applied by Coleman (1999) did not require the existence and enforcement of
exogenously imposed membership criteria to identify programme impact. As part of his study, a
unique survey which allows for the use of relatively straightforward estimation techniques was
applied for data collection. Then, the survey was done four times over the course of a year,
during 1995-1996, for both members and non-members of the village bank in 14 villages in
Northeast Thailand. Six of those villages were identified as “control” villages that were
recognized to receive NGO support for village bank within one year after the identification. It
means that there was self-selection for villagers in six control villages as participants had already
27

decided whether or not they wanted to be members of the village bank. The rest of the eight
villages were “treatment” villages of which seven villages had a village bank for two to four
years and one village started its village bank suddenly after the first survey. The comparison
between the “old” village bank members in the eight treatment villages and the “new” village
bank members in the six “control” villages could be undertaken. In addition, the author identified
precise impact estimator as a variation of the length of time for the programme availability in the
treatment villages. When nonmembers in all villages were included in the sample, this allowed
for the use of village fixed effect estimation to control the possibility that the order in which
these 14 villages received programme support is endogenous. Based on empirical evidence, most
studies showed positive impact of microfinance on different dimensions of outcomes at different
levels, even though they applied various methodologies.
2.2.4 Measurement of Microfinance Impact
Several complementary approaches were found in literature used in measuring the impact of
microfinance on enterprise performance and other microfinance related variables. Most
commonly used is the econometric approach which attempt to measure specific impact value.
McKernan (1996) estimated profit equation using logit regression analysis and found that
programme participation can exert a large positive impact on self-employment profits, while Pitt
and Khandker (1998) using fixed effect regression analysis found that programme credit has a
significant impact on the well-being of poor households and that this impact is greater when
credit is targeted at women. Khan and Rahaman (2007) using Analysis of variance and multiple
regression analysis revealed that microfinance schemes are highly associated to build up of
social and economic empowerment. Seven other studies in Bangladesh (Hashemi et al. used
descriptive analysis and logit regression analysis (1996); Goetz and Gupta (1996) used
descriptive analysis and chi-square statistical technique; Schuler and Hashemi (1994) used logit
and OLS regression; Hashemi and Riley (1996) used descriptive statistics and multiple
regression analysis of the ordinary least square (OLS) ; Schuler et al. (1997) used logit regression
and OLS regression analysis; Schuler et al. (1998) used analysis of variance and fixed effect
regression analysis (1998); Steele et al. (2001) used Chi-square and logit regression analysis
focused on the question of female empowerment.
28

All but one found evidence that microfinance programme participation exerts a statistically
significant impact on one or more aspect of female empowerment, such as contraceptive usage or
intra household decision-making. The sole Bangladesh impact study failing to find significant
impacts is Goetz and Gupta who find that significant portions of the women’s loans were
controlled by male relatives, thereby limiting the women’s ability to develop meaningful control
over their investment activities.
Outside of Bangladesh, published studies on assessement of microfinance programmes are many:
In Bolivia, Mosley, (2001) used Analysis of Variance (ANOVA) to measure assessment impact.
In China, Park and Ren (2001) used sensitivity analysis and multiple regression analysis, to
measure the impact of microfinance programe on household income of clients. In Ecuador
Woller and Parson (2002) used descriptive analysis and regression analysis. Ghana and South
Africa, Afrane (2002) used descriptive statistics and multiple regression analysis also to measure
the impact of microfinance programme on business income, and women empowerment. In
Guatemala, Kevane and Wydick (2001) used logit regression analysis and Ordinary least square
regression analysis; Wydick (2002) used chow test and ordinary regression analysis (OLS), in
Honduras and Ecuador Smith (2002) used fixed effect regression analysis, in Peru Dunn (2001)
used several complementary approaches, combining t-test and gain score analysis which were
treated as part of descriptive analysis. Conclusions on impact were derived using Analysis of
covariance (ANCOVA), Mosley used chi-square to test for differences in the distribution of
categorical data. In his study on Thailand Coleman (1999) used weighted logit regression
analysis, while for Uganda Barnes et al. (1999) used chi-square technique, t-test, and the analysis
of variance. The impact variables were subjected to analysis of covariance (ANCOVA) using
multiple covariant. For Zambia Copestake et al. (2001) used multiple regression analysis. For
many countries Mosely and Hulme (1998) and Anderson et al. (2002) used descriptive statistics
and chi-square technique. The findings vary considerably from study to study, suggesting that
impacts are highly context specific.
Analyzing four programmes in Bolivia, Mosley (2001) shows that MFI services may increase
vulnerability, if borrowers over-leverage. Bolnick and Nelson (1990) found that MFI
participation had a positive impact on enterprises that were typically small, labour intensive and
29

growing, although the impact was far from uniform across sectors and target variables.
Copestake et al. (2001) found that borrowers who were able to obtain two loans experienced high
growth in profits and household income compared to a control sample, but borrowers who never
qualified for the second loan were actually worse off due to MFI collection mechanisms. Wydick
(2002) found that upward class structure mobility increases significantly with access to credit.
Using the same Guatemala data set in a subsequent study (2002), Wydick also found that rapid
gains in job creation after initial credit access were followed by prolonged periods of stagnant
job creation. Dunn (2001) found that programme clients’ enterprises performed better than non-
client enterprises in terms of profits, fixed assets, and employment. Finally, Anderson et al.
(2002) analysed 147 MFIs and found that microfinance participation increased environmental
awareness and common pool resource stewardship.
2.2.5 Enterprise Survival Predictions and Survival Analysis
SA has not yet become as popular in BFP as DA and LA, but it is considered to be a popular
alternative to these main techniques. The pioneering paper on SA applied to BFP is by Lane et
al. (1986), who used the Cox model to predict bank failure. Lane et al. created their model based
on a selection of 334 successful and 130 failed banks from the period 1979 to 1983. The model
was then tested on a hold-out sample with one and two year predictions, in which the cut-off
value was set at the proportion of failed banks in the sample. The prediction accuracy of the Cox
model was found to be comparable with DA on the initial and hold-out data, but the Cox model
produced lower Type I Errors. Also, Crapp and Stevenson (1987) applied a Cox model to some
Australian credit unions with similar encouraging results.
Laitinen and Luoma (1991) again applied the Cox model to business failure. The study was
significant because it was the first to critically present the advantages and disadvantages of using
SA to predict business failure. Laitinen and Luoma also empirically compared the classification
accuracy of the Cox model with DA and LA using 36 failed Finnish limited companies and 36
successful counterparts. Their predictions were made by dividing the businesses into two groups
based on their hazard ratios, according to the ratio of failed and successful businesses in the
original sample (equal groups in this case). Businesses in the group with the higher and lower
hazard ratios were then predicted to fail or succeed respectively. Although the techniques were
30

comparable, DA and LA were found to be slightly superior predictors to the Cox model.
Nevertheless, Laitinen and Luoma argued that the SA approach was more natural, appropriate
and flexible, and used more information. It was also stated that the empirical underperformance
could have been due to the small sample or sample bias inadvertently caused by the authors.
Hence, it was the authors’ belief that further research into SA as a BFP tool would result in SA
models becoming superior to traditional models. Another support was also given by Keasey et al.
(1990) and Ogg (1988) who recommended that SA techniques be used in BFP.
Kauffman and Wang (2001, 2003) used SA techniques to examine the drivers behind the
survival of Internet businesses. The data set comprised quarterly data on 100 Internet businesses
from the period of 1996 to 2001. Six explanatory variables were used: one industry specific, two
business specific, two e-commerce specific and one macroeconomic variable. Two SA
techniques were applied to the data: a Kaplan-Meier model was used to perform a descriptive
analysis and the Cox model was used to explore the relative strengths of explanatory variables.
Useful conclusions, such as businesses targeting both commercial and consumer groups are less
likely to fail, were drawn from both of the SA techniques applied. Although this work did not
develop an SA model for predicting business failure, it demonstrated the usefulness of SA
techniques for researching the business failure process.
Shumway (2001) applied the first SA model to a data set of significant size. The model was
formed using various financial ratios and market-driven variables for over 2000 companies from
the NYSE and AMEX over 31 years. This was the pioneering use of a multiperiod logit model to
estimate the SA model coefficients. This allowed Shumway to estimate an accelerated failure
time (AFT) SA model, which had not been previously applied to BFP. Consistent with previous
studies, Shumway noted the theoretical superiority of SA techniques over the more popular
techniques (DA and LA). In addition, Shumway’s SA model was shown to empirically
outperform both DA and LA in hold-out predictions. However, less than 10% of the businesses
in the data set were failed, which is much lower than the percentage in the real world. In
addition, Shumway only considered Type I Error.
31

Laitinen and Kankaanpää (1999) presented a comparative study, in which the Cox model along
with DA, LA, RPA (a decision tree approach), ANN and HIP were analyzed. The six techniques
were empirically compared for their 1- 2 -and 3- year prediction accuracy using a data set
containing three explanatory variables from 76 Finnish companies (with an equal number of
successes and failures). Their analysis showed that SA had superior predictive power for 2- and
3- year predictions. However, they concluded that there were no statistically significant
differences in the predictive power of any of the six models, except for LA being slightly
superior to SA for one-year predictions.
Overall, there have been few studies on the application of SA to BFP, and most of the previous
research has used Cox’s model. Although Lane et al. (1986), Laitinen and Luoma (1991) and
many more have indicated that the Cox model was very appropriate for use in BFP, it has not
been consistently shown to be superior to traditional techniques. Lane et al. (1986) found the
Cox model to slightly empirically outperform DA, but Laitinen and Kankaanpää (1999) found no
overall statistical difference between the empirical performance of DA and LA, while Laitinen
and Luoma (1991) found both DA and LA empirically superior to SA. Therefore, it would be
valuable research to apply the Cox model to a large set of data and compare it to both DA and
LA again. Highlighting a financing method and relating it to a small business survival has never
been done with Nigerian data.
Using the technique of survival analyses, Audretsch and Mahmood (1995) found that new
business success relates to both industry and firm-specific characteristics. First, new
establishments are more likely to survive in industries characterized by an entrepreneurial
regime, where new entrants to the market have advantages with technological innovation over
the existing companies (Audretsch, 1991; Audretsch and Mahmood, 1995). On the other hand, in
an industry that has a routinized technological regime, where existing firms possess advantages
as innovators, it is more difficult for new startups to survive. Second, firm-specific
characteristics such as start-up size and ownership structure can also influence the survivability
of a business. Firms with a large start-up size are more likely to survive. Audretsch and
Mahmood (1995) also find that new independent firms tend to have higher hazard rates (i.e.,
greater likelihoods of failing over time) than the new branches of existing firms. Similarly,
32

Agarwal and Gort (1996) find that survival rates for new start-ups are industry specific, but also
depend on the development stage of the market. Their results suggest new firms endure higher
hazard rates when a market is in its early stages.
Hensler, Rutherford and Springer (1997) analyze survival time for initial public offerings (IPOs)
of stock. They find that factors such as firm size, the age of the firm at the offering, the initial
return on investment in the stock issue, the number of IPOs co-occurring in the market, and the
percentage of the firm owned by insiders can enhance the survival time for IPO firms. In
contrast, a higher average price level in the stock market at the time of IPO and a higher number
of risk characteristics associated with the firm lead to reduced survival time. Hensler et al. (1998)
also find an industry effect in their results, with IPOs in the computer and data, wholesale,
restaurant, and airline industries having a shorter survival time but firms in the optical or
pharmaceutical industries enjoying a longer survival time.
Honjo (2000) conducted two studies on the failure of new manufacturing firms in Japan from
1986 to 1994, one based on the age of the firm and the other on the calendar time of business
operation. He notes that while financial capital and firm size are both significant predictors of
business failure when they are incorporated into the model independently, only financial capital
is significant when they are simultaneously added into the model. Honjo concludes that previous
research that found significant effects associated with firm size, might have, captured the impact
of the financial capital. His results also indicate that firms founded just before a crash or market
bubble or just after a market crash are more likely to fail. In the analysis based on calendar time,
Honjo found a positive relationship between age and failure, and a negative relationship between
age-squared and business failure. In addition, his results indicate that a higher entry rate and
higher geographical concentration in an industry lead to a higher hazard rate for firms.
Even though the above research mentioned indicates that firms with large start-up size and large
post entry size are more likely to survive, there are also contradictory findings. For example, Das
and Srinivasan (1997) find that firms with a larger start-up size are more likely to exit.
Ghemawat and Nalebuff (1985) analyze an oligopoly scenario in a declining industry and show
that large firms are more likely to exit. Lieberman (1990) empirically tests this relationship. Even
33

though he does not find any evidence of a higher exit rate for large firms, Lieberman’s results
indicate that, in declining industries, large firms are more likely to close individual plants.
Researchers in the field of accounting and finance have used various accounting ratios and funds
flow components to predict business bankruptcy. Among these, there are models based on the
discounted cash flow analysis in finance. This analysis argues that a firm’s value equals the sum
of its future net cash flows discounted at its cost of capital. Using techniques such as multiple
discriminant analyses, and probit and logit models, Gentry, Newbold and Whitford (1985a,
1985b, 1987) identified twelve cash flow components and found three variables: dividends,
investment and receivables relate significantly to business bankruptcy. However, there are also
contradictory findings. Casey and Bartczak (1985) and Gombola et al. (1987) found that cash
flow from operations did not significantly relate to corporate bankruptcy. Mossman et al. (1998)
discovered that the predictive accuracy of the cash flow model is better during the last two to
three years before bankruptcy.
Bekele and Zeleke (2008), using survival analysis, identifies key predictors of survival and
failure in small businesses and enterprises. They observes that: (a) the majority (79%) of
MSMEs have difficulty in securing loans from formal financial institutions; (b) 64% of MSMEs
raise finance from iqqub schemes (a microfinance institution) at least twice over the 6-year study
period; (c) conversion of savings into investment promotes the growth of firms by a factor of
5.25; (d ) prior bankruptcy increases the likelihood of failure by a factor of 3.65; and (e) regular
participation in iqqub schemes increases the likelihood of survival by a factor of 3.25.
2.2.6 Model Generation for Microfinance and MSEs Survival
Despite abundant literature on the impact assessment of microfinance, most empirical studies on
microfinance look at microfinance in relation to entrepreneur welfare and income. Only few
studies relate financing method to enterprise survival. Using the survival analysis technique,
Kauffman and Wang (2003) identified industry-specific characteristics, firm-specific
characteristics and e-commerce specific characteristics (because their study is on dotcom
enterprise) as key predictor of survival rate of a firm. The industry-specific characteristics
include the rate of new firm entry, industry growth as measured by price-cost margins, and the
technological regime of the industry. Firm-specific characteristics include financial capital, cash
34

flow components, start-up size, post-entry firm size, founding time, insider ownership and
whether the company is an independent start-up or the online versions of existing companies. E-
commerce-specific characteristics are a critical mass of customers and the business model.
Bekele and Zeleke (2008) as cited earlier, reveals that factors affecting long-term survival and
viability of MSMEs are categorized into 4 broad categories. These they presents as (i) macro
economic factors, (ii) factors that affect access to social capital, (iii) factors that affect the
internal efficiency of small businesses and enterprises, and (iv) factors that affect access to micro
credit. The macro economic factors include variables related to economic policy that are
essential for promoting private investment in MSMEs, they are; legal and regulatory issues, the
assessment of tax, backward and forward linkages with large enterprise, access to credit, the
degree of competition at the local market and local demand for goods and services produced by
MSMEs.
Factors related to internal efficiency refer to business related decision made by owners/
managers, trends in net income, conversion of profit back into investment, demographic
conditions, level of education, prior business experience, managerial ability, motivation for
working in the sector, number of working hours, level of technical skill, business training
received, etc. Factors that affect access to micro credit include, availability of credit, access to
credit finance, sources and amount of initial start- up capital, terms / or conditions of loan
repayment, and the extent of effective utilization of credit. Lastly, factors that are related to
social capital include, participation in microfinance scheme, access to free family labour at work
and networking with other businesses and enterprises as a result of participation in microfinance
scheme. He applied backward stepwise procedure to eliminate “useless variables”. Six predictor
variables that emerged for the study are: ability to convert profit back into investment, past
bankruptcy, level of education, regular participation in microfinance, ability to make profit, and
managerial ability.
Researchers in the field of Accounting and finance have used various accounting ratios and funds
flow components to predict business failure using Cox regression analysis. Gepp and Kumar
(2008) in an empirical study on Australian firms, specify key predictors of firm survival as:
financial leverage; long-term loan to total asset, profitability; operating income to total asset,
managerial efficiency; receivables to current asset, liquidity; current asset to current liability,
35

business size; natural log of sales growth, liquidity (2); quick asset to current asset, market
structure; market value of equity to total value of the firm, and lastly, business size (2); natural
log total number of employees.
On the basis of our review, we are inclined more to adapt Bekele’s (2008) variable for the
survival analysis because it is more related to our study.
Preliminary Conceptual Model
Overall, our survey of the literature leads us to the following preliminary conceptual model.
(See Figure 1 below.) The model emphasizes clusters of factors that predict MSEs survival as
identified in Bekele (2008) to include macroeconomic factors, factors related to internal
efficiency, factors that affect microcredit, and factors related to social capital. This initial
conceptual model is subject to change and refinement.
36

Adapted from Bekele and Zeleke, 2008
Figure 2.1 Conceptual Model for Microfinance and MSEs Survival
37
Macroeconomic Factors
Microcredit Factors
Internal Efficiency Factors
Social Capital Factors
Survival
Regulatory framework
Tax Issues
Local demand for goods
Backward & Forward Linkages Terms of loan
repayment.
Sources and amount
of start-up capital
Extent of utilization of credit
Availability
of credit
Group liability
Pre- loan training
Networking
Participation in Microfinance
Managerial Ability
Level of Education
Location of Business
Ability to make profit
Number of hours worked
Technical & Business training received
MICROFINANCING
Participation Credit/Savings Empowerment
Institutional Factors-Legal Issues

2.3 Theoretical framework
2.3.1 Financial Growth Theory
Berger and Udell (1998) propose a financial growth theory for small businesses where the
financial needs and financing options change as the business grows, becomes more experienced
and less informationally opaque. They further suggest that firms lie on a size/age/information
continuum where the smaller/younger/more opaque firms lie near the left end of the continuum
indicating that they must rely on initial insider finance, trade credit and/or angel finance. The
growth cycle model predicts that as firm grows, it will gain access to venture capital (VC) as a
source of intermediate equity and mid-term loans as a source of intermediate debt. At the final
stage of the growth paradigm, as the firm becomes older, more experienced and more
informationally transparent, it will likely gain access to public equity (PE) or long-term debt.
Problems related to financing are dominant in the literature with regard to small firms. There are
numerous empirical studies describing inadequate financing as the primary cause of MSMEs’
failure (Jones, 1979; Wucinich, 1979; Welsch and White, 1981; Gaskil and Van Auken, 1993;
Van Auken and Neeley, 1996; Coleman, 2000; Owualah, 2007). The capital structure of smalls
firm differs significantly from larger firms because small firms rely more on informal financial
market which limits the type of financing they can receive. The small firm’s initial use of
internal financing creates a unique situation in which capital structure decisions are made based
on limited financing options. It is widely accepted that small firms have different optimal capital
structures and are financed by various sources at different stages of their organizational lives
(Berger and Udell, 1998). Researchers have found that certain attributes of small firms influence
the type of funds available to finance the firm’s operations (Van Auken and Neeley, 1996; Hall
et al., 2000, Romano et al.,2001;).
38

Table 2.3: Financial Growth Cycle
Very small firms, possibly
with no collateral and no
track record.
↓
Medium –Sized Firms.
Some track records.
Collateral available, if
necessary.
↓
Large firms of known risk
and track record.
↓
Initial Insider Financing Venture Capital Public Equity
↓ ↓ ↓
Angel Medium - term financial
Institutions.
Long term financial
institutions.Model adapted from Berger and Udell (1998).
Angel financing is a type of microfinance where an individual or a corporate organization raises
limited amount of capital for a micro entrepreneur at start up or for expansion with less stringent
conditions for repayment. The expected rate of return on investment is usually very low but high
enough to offset risk.
2.3.2 Pecking Order Theory
Another financing theory that is very familiar with the operations of the small business is the
pecking order theory, proposed by Myers (1984). It sheds light on the incentives that drive SMEs
capital structure decisions. This theory proposes that firms prefer to use internal sources of
capital first and will resort to external sources only if internal sources are inadequate. This theory
has been found to be relevant to the financing of SMEs. Most SMEs start with internal financing
before looking for external sources. Older firms, by definition, have had more opportunities to
accumulate retained earnings than younger companies and thus more funds are available to
finance operational growth. Pecking order theory suggests that those funds should be used before
external capital sources are tapped. Holmes and Kent (1991) found that small businesses
39

experience a more intense version of pecking order in their decisions because access to
appropriate external sources of capital is limited. It has been noted that small businesses’ differ
in their capital structure but their intense reliance on pecking order is only one of the variables
that make small businesses financing decision unique. Small businesses’ rely on private capital
markets, while larger firms are financed through public market. Information on small businesses
is much less readily available than information on larger firms which can be picked up in the
annual reports. Small businesses reliance on private markets limits the types of financing that
they can receive; most small businesses rely on commercial banks and finance companies to
provide capital (Berger and Udell, 1998). In most cases, the cost of capital for small businesses is
usually higher than it is for larger firms. The size of the loan and lack of information on the
quality of operation of the small firms force lenders to protect their investment by demanding
higher rates of return, which come in the form of high interest rate and high cost of capital for the
small firm. In an attempt to avoid higher cost of capital, smaller firms are then forced to use
more short-term debt, which carries lower costs but raises the firm’s risk (Chittenden et al.,
1996). When loaning to small businesses, most financial institutions require the owners of the
small businesses to personally guarantee the loan. These personal guarantees allow the institution
recourse against the personal wealth of the small businesses owner in the event of default
(Berger and Udell, 1998). These restrictions on the type of finance available to SMEs coupled
with the small firm’s insistence on first using internal sources of capital (Holmes and Kent,
1991), creates a unique structure for small business. Romano, et al., (2001) describe the situation
as ‘‘a complex array of factors that influence small –to – medium size enterprises (SME) owner-
manager’s financing decisions’’. This is supported by Hall et al. (2000) who found that firm’s
size is positively related to long-term debt and negatively related to short-term debt. In further
support, Chittenden et al. (1996) suggest that a firm’s size is correlated with the firm’s reliance
on pecking order theory in capital structure decisions. Thus, smaller firms are more likely to rely
on internal funds. Romano et al. (2001) found a significant relationship between the size of the
firm and the use of debt. Again, these results are consistent with pecking order theory and the
Berger and Udell (1998) model.
Availability of information is another factor that limits the financing ability of the small firm.
Small firms often do not have audited financial statements. Larger firms, on the other hand, must
40

disclose a large amount of information about their financial standing on a systematic basis. As a
result of this information void, the investor in small firms is unable to distinguish between high-
quality and low-quality companies and therefore raises the firm’s cost of funding to compensate
for risk. The investor will require a high rate of return in exchange for investing in a firm without
all of the proper information. The investor requires this higher rate of return because the
information is not available to establish the extent to which the small firm is likely to default.
This actually limits small firms in accessing external fund (Weinberg, 1994).
2.3.3 Contract Theory
In contract theory, asymmetric information arises when one of two parties engaged in a business transaction happens to have more or different information than the other. In such a situation, one party often does not know enough about the other party and fails to make an accurate decision. This circumstance leads to a potential adverse selection and moral hazard problems in the credit market. Adverse selection is a problem arising from asymmetric information which occurs before a transaction is entered into. A lender may decide not to lend money although the borrower is worthy of the loan and has the potential to make loan repayments as expected. Moral hazard is a problem of asymmetric information that arises after transition has occurred. The borrower might engage in activities that are undesirable from the lender’s point of view, and this makes it less likely that the loan will be paid back. For these reasons, formal financial institutions insist on collaterals as a prerequisite for providing loan money to small enterprises. The disbursement of loan money without securing adequate collateral is considered too risky. Stigilitz and Weiss (1981) have pointed out that information asymmetry is one major cause of credit constraint in small businesses and enterprises. According to the authors, capital does not always flow to small firms because of adverse selection and moral hazard, two factors that are known to have a devastating negative impact on small enterprises.
41

2.4 Entrepreneurship and Growth
2.4.1 The Firm and the Entrepreneur
Lucas (1978) introduced static theories of competitive equilibrium. He explains that the size of
the firm is determined by the efficient allocation of given resources; part of these resources
includes entrepreneurial resources. Under given technologies, an observed firm size is the
efficient size, in the sense that long-run costs are minimized at that point. The growth of a firm is
assumed following its profit-maximizing behaviour and the shape of its cost functions. A firm
will reach its maximum growth where its long-run marginal costs equal its price; this is referred
to as the "optimum" size of the firm.
He equates the firm with the entrepreneur or manager and he assumes that a firm's output is a
function of managerial ability as well as capital and labour. Managers with higher abilities (i.e.
higher efficiency levels) will have lower marginal costs and therefore will produce larger
outputs. However, firm expansion will be limited due to decreasing effectiveness of the manager
as the scale of the firm increases. An implication of the Lucas model is that, for a small business
to grow, the small business owner must be willing and able to relinquish many day-to-day
control functions and delegate those tasks to an enlarged, specialized management team, which is
rarely available in small businesses. According to Lucas, the variation in levels of business
acumen is the major determinant of business growth (as well as of business formation and
dissolution).
Kihlstrom and Laffont (1979) attribute the major determinant of business growth to differing
taste for risk among individuals. They assume that production technology is risky, and that
entrepreneurs who have the ability or propensity for taking risk in the face of uncertainty will
produce more. Firm size is therefore limited by the entrepreneur's willingness to take risk.
The theories discussed above are static in the sense that they say little about how an industry and
the firms within it evolve over time and they ignore the fact that individuals can acquire their
business acumen by operating businesses over time.
2.4.2 Firm life cycle
42

Jovanovic (1982) addresses these deficiencies by developing a model of the firm life cycle based
on learning. According to Jovanovic's life cycle model, individuals differ in their entrepreneurial
abilities, but they are unsure of their abilities until they manage a business. Though, production
technology is risky, individuals are uncertain about their abilities to manage a business because
they lack prior knowledge and partly because production is inherently risky. In his model, he
assumes that individuals learn about their abilities over time by observing how well they perform
in a tough business world. Individuals who find out that they have underestimated their abilities
in one period will expand output in the next, while those that overestimated their abilities will
probably dissolve their business and start all over again.
The implication of Jovanovic's model is that young firms have less information than older firms
on their managerial abilities. As a result, younger firms have more variable growth rates than
older firms because they have less precise estimates of their true abilities since they have limited
past experience. For this reason there will be more exits among younger firms, but the ones that
survive will grow faster than older firms and have more variable growth rates.
2.4.3 Organizational Capabilities
Organizational capabilities refer to the skills, experience, and abilities of the individuals within
an organization. Capabilities also include decision making practices (Orser et al., 2000),
‘‘competencies’’ (Julien and Ramangalahy, 2003) and ‘‘managerial capacity’’. This theory on
organizational capabilities suggests that small firm development depends on the abilities of the
firm owner’s managers and employees to plan for and adapt to the business environment in
which they operate. Successful small firms have been associated with greater skills in
organizational learning (Chaston et al, 2001) and strategy development (Julien and
Ramangalahy, 2003). Smallbone et al. (1995) document an association of a homogeneous set of
organizational competencies with small businesses that have achieved high growth rate. Sadler–
Smith et al (2003) identify a positive relationship between a homogeneous collection of
organizational capabilities and small business performance, as well as a more heterogeneous set
of practices associated with average performance of small firms.
43

2.4.4 Stages of Small Business Development
The pioneering work of Grainer (1972) on theory on firm development (evolutionary and
revolutionary) concluded that growing organizations must of necessity go through five
distinguishable stages of development. Each phase is characterized with relative calmness at the
beginning and usually ends up managing crisis. The five stages are described as: i- growth
through creativity, followed by crisis of leadership; ii- growth through direction followed by
crisis of autonomy, iii- growth through delegation followed by crisis of control; iv- growth
through coordination followed by a crisis of red tape and v- growth through collaboration
followed by crisis of psychological saturation among employees. This, he says, can be solved by
allowing the employees a time of holiday to rest, reflect and revitalize themselves.
Since this pioneering work in 1972, a lot has been done in the area of firm development to date.
Different factors have been attributed to development stages of firm. Lavoie and Gulbert (1978)
reviewing many theories, emphasize the important role of the human factor in the development
of an organization. According to them, organizational development is tied to progressively
mature reasoning processes that characterize managers working at increasingly higher stages of
the organization’s evolution. Valid organizational change and development basically address the
problem of getting managers and their employees to upgrade the values and logic underlying
their patterns of decision-making.
Adizes (1979) concludes that the future oriented management of the attitudes and style of an
organization’s managers may provide a means for ensuring a long and effective life for an
organization. At every life cycle passage, a typical pattern of behaviour emerges. At the
courtship stage, the most pronounced role is that of selling the idea to others and reinforcing
one’s own commitment. At the next stage, risk becomes an issue due to the significant expenses
involved. A significant change in behaviour is needed, as production is crucial. The following
stage calls for vision and administrative systems of increasing importance. At the adolescent
stage, more time should be spent on planning and coordinating. If the organization sails safely
through adolescence, it may enter the prime stage of the organizational life cycle. An
organization in its prime is result-oriented, has plans and procedures to achieve efficiency and
44

keeps an open eye on its environment. The mature stage is characterized by institutionalized
systems, that is procedures and policies (systems) for accomplishing tasks.
Quinn and Cameron (1983) identified and combined nine models of organizational life cycles
into one theoretical summary model. All nine models suggest progress through similar life cycle
stages. Each of the models contains an entrepreneur stage (early innovation, niche formation,
creativity), a collectivity stage (high cohesion, commitment), a formalization and control stage
(stability and institutionalization), and a structure elaboration and adaption stage. There is a
consistent over time, and organizational activities and structures at one stage are not the same as
those at another. Thus, the criteria used to evaluate an organization’s success at one stage of
development may well be different from those used to evaluate success during another
developmental stage.
Churchill and Lewis (1983) see growth as part of the natural evolution of a firm. They start by
stating emphatically, that the traditional development frameworks are inappropriate for small
businesses as the traditional model states that a company must grow and pass through all stages
of development or expire in the process. They are of the view that this is not necessarily so for
small business because the traditional model fails to recognize important stages in a company’s
origin and growth while emphasizing sales and employment as well as ignoring issues such as
value added, number of locations and the complexity of the product line. They identify five
stages of growth: existence, survival, success, take-off and resource maturity. Each stage is
characterized by size, diversity, complexity and the following management factors: managerial
style, organizational structure; extent of formal system; major strategic goal; and owner
involvement. At the existence stage, the main problems are obtaining customers and delivering
the product contracted for by them. At the survival stage, the firm has enough customers and is
able to satisfy them. The main problem at this stage is managing the revenue and expenses of the
organization to achieve a breakeven point. The organization is still simple at this stage; most of
the supervision is carried out by the salesman or the foreman and not the entrepreneur any more.
The success stage is characterized by two possibilities: disengagement or growth. At the
disengagement stage, the company is healthy, but ceases to grow. The professional staff comes
on board. This can be the last development stage and may last long. The other possibility is to
45

strive towards growth: at the success-growth stage, the entrepreneur marshals resources for
growth. It becomes important to train managers to meet the need of the growing business. Once
it has successfully passed through this stage, the company proceeds to the take-off stage, and the
main focus then is on how to grow rapidly and how to finance that growth. The main concern at
this stage borders on delegation, transferring responsibility and controls from the entrepreneur to
others in order to improve managerial effectiveness. At the resource-maturity stage, the
management is decentralized and the organization is adequately staffed. Systems are extensive
and well developed. After this stage, two clear possibilities emerge: continued performance or
suffocation.
In the same light, Scott and Bruce (1987) following Grainer (1972) identify growth stage which
they call inception, survival, growth, expansion, and maturity. At the inception stage, growth is
driven by creativity and halted by a crisis of leadership. Top management has direct supervision
and the management style is strictly entrepreneurial. No product or market research is conducted
and the product market combination falls within a single line with limited channels and markets.
At the survival stage, where growth is incepted by direction, a crisis of autonomy occurs,
supervision is indirect. The growth stage, which is characterized by delegation ends with a crisis
of control. The expansion stage, which is made possible by growth through coordination,
delegation and an extended range of product market, always ends with a crisis of red tapism.
The final stage, which is the maturity stage, takes place, with and important role for formal
control systems, management by objectives, contained product lines and more markets.
Some researchers on the developmental stages of small business also focus on manufacturing
business alone. Miltra and Pingali (1999) empirically identify: High growth → existence →
survival → growth-disengagement → resource maturity and underscore the existence of
alternative growth pattern for small manufacturing business. Chowdhury and Lang (1993) stress
the difference between gradual decline and crisis. Decline is a relatively smooth trend, whereas
crisis involves a sudden performance drop. They therefore opine that crises are more perceptible,
more rapid, and appear to be more threatening to the firm. This distinction may have
implications for the ability of a firm’s management to effect a turn around. Hisrich and Peters
(1998) in their theoretical model, identify start-up → early growth → rapid growth → maturity.
46

They, however, conclude that not all firms go through all the stages. Hanks et al (1993) also
identify start-up → expansion → maturity → early diversification in the high tech sector.
Mount et al. (1993) analyze small business development in terms of transitional phases that link
phases of comparative stability; however not all small businesses pass through all phases.
O’Farrell and Hichens (1988) argue that most small business models place little or no emphasis
on external factors that greatly influence the sustainability of the firm such as meeting
competition in the market place. Rather, most efforts in developing a theory for the small
business focus on the internal dynamics of the firm. Dodge et al. (1994) show that changes
within an organization follow a predictable pattern characterized by development stages: the
sequence of events that describes how things change over time; the hierarchical progression that
is not easily reversed; and finally, the composite of a broad range of organizational activities and
structures. In an earlier research on small business developmental stage, Dodge and Robbins
(1992) emphasized that the major problems faced by small businesses differed according to the
stage of their current organizational life cycles. According to them, the organizational life cycles
progress in the following sequence: formation → early growth → late growth → stability. The
firm, in their empirical study, had fewer management and financial problems, but more
marketing problems, as they progressed from stage to stage. Different development stages
require different approaches. Hillidge (1990) identified different strategies for different stages of
a specific enterprise. Pavia (1990) suggested that at the early evolutionary stage of small firms,
when customer needs and product characterization are still changing, it may be best to maintain a
broad, flexible strategy with an emphasis on short range market responsiveness. On the other
hand, a firm may gain a competitive advantage by adopting a long-range strategic outlook.
In a more recent study Brau and Osteryoung (2001) note that business life cycle stages in general
are relevant to initial public offerings. Beverland and Lockshin (2001) found support for the
application of the life cycle theory to New Zealand’s wine industry.
Fullerton and Dodge (1994) do not entirely agree on stages of organizational life cycle as
described in the literature for most small businesses. They are of the opinion that small
47

businesses adapt and change in order to survive rather than grow. They identified competition as
the dominant factor that impedes growth in small businesses.
It is obvious from the literature that all the authors recognize that there seems to be a life cycle
for firms similar to the classic product life cycle approach. The life cycle theory has an element
of start, growth, maturity, and decline in all the studies. However, development in MSME sector
differs a little. Though the life cycle approach is relevant to MSME, it is not always applicable.
Research in this direction has been inconclusive in the last few years. However, since the focus
of this study is on micro-financing and small business development, we focus more on financial
growth cycle theory of small firm financing.
Figure 2:2 Stages of Small Business Growth CharacteristicsChurchill and Lewis (1983)
Churchill and Lewis (1983), explained submission on evolution of small business, they went further to show that even old businesses are susceptible to failure when they lack innovative decision and avoid risk.
48

Figure 2.3 Diagram Depicting the Framework Evolution Stages and Failure & Exit modes Source: Churchill and Lewis, (1983)
In the above framework, there are 5 stages of business evolution and 5 characteristics that define
each stage. According to Churchill and Lewis (1983), businesses with DNA that are suited to the
environment and are competitive are “rewarded” by the sheer pleasure of reaching the next stage
of the evolution. Those small businesses, in their evolutionary journey, that are not suited and not
adaptable to the environment, and are not competitive in an industry segment are “discarded”.
Only the strong survive.
In the model there are five stages of business evolution. They are Existence, Survival, Success
(leading to a choice of disengagement or growth based on owner “psychology”), Take-off (rapid
growth), Resource Maturity and Ossification (Decline).
Each stage is characterized along the dimensions of: management style, organization, extent of
formal systems and major strategy. At each of the 5 stages of small business evolution, there are
challenges which must be overcome. Successful progression along the evolutionary path requires
adaptation and specific changes to the 5 characteristics cited above. Failure of a business
enterprise to adapt and makes those changes results in the death of the business. The interesting
question is; what happens to the owner when a business fails? Is that the end of the line? Or
does he/she learn from the past and try again?
49

The main focus of the work of Churchill and Lewis (1983) is in explaining further the success
stage. At the success stage one of two things can happen; the owner/manager may maintain the
present profit status quo by relying on internally generated fund for investment and essentially,
maintain the status quo, or the owner manager may decide to grow the business; the owner
consolidates the company and marshals resources for growth through the borrowing power of the
company. In order words, he seeks for external loan in order to grow the company. Managers
must be hired with a focus on the company’s future rather than maintaining its current condition
and status quo.
2.4.5 Small Business Development
D’Amboise and Muldowney (1988) identify three distinct dimensions according to which any
organisation can be analyzed; they are: the task environment, organizational configuration, and
managerial characteristics. The task environment, as defined by Dill (1958) and later developed
by Thompson (1967) connotes ‘‘those parts of the environment which are relevant or potentially
relevant to goal setting or goal attainment’’. It is composed of customers, suppliers, competitors
and regulatory bodies. The small business is, in general, vulnerable to the effects of the
environment. Given its limited financial and human resources, it spends more time adjusting to
turbulent environment than predicting or controlling it. Organizational configuration refers to the
formal and informal structure of the organization. In small businesses, hierarchy is often
contracted and decision making centralized. A small business organizational chart is rarely
formalized, but it usually includes three to four levels, particularly in manufacturing (D’Amboise
and Gasse, 1984). Because of size, in small business firms, there is less interpersonal and
structural differentiation in response to task diversity; departmental interdependencies are
therefore often more personalized than in large firms. Managerial characteristics involve the
motivations, goals, objectives and actions of the owner manager. Deeks (1973) describes the
manager-entrepreneur as a skilled craftsperson who is primarily concerned with quality and
reputation. The importance of the owner manager in the small business cannot be
overemphasized.
Given the vulnerability of a small firm to changes in the environment, its survival depends to a
large extent on how it interacts with its environment. Preston (1977) divides small businesses
50

into five categories: the rare successes that have evolved from the small business and are still
operated by the owner-manager; firms in small business industries in which the firm's optimum
scale is small; firms built on successful specialization that is based on innovation and patent
control; satellite firms that are dependent on either a single large firm or a group of large firms in
a major industry; and turnover firms that operate in sectors in which entry and exit are relatively
easy. He concludes that the success of each category depends on how it manages its interaction
within the environment where it operates.
Welsch and Young (1982) associate various traits (internal locus of control, openness to
innovation, risk taking, self-esteem, rigidity, and economic optimism) with several sources of
information (professional, written, personal, electronic, and institutional) in order to establish a
cause-effect pattern in small business development. Dollinger’s (1983) research shows that
personal characteristics of the owner-operator affect the relationship between boundary spanning
activities and performance of small businesses. Gasse (1977a) examines certain hypotheses
concerning the extent to which the environment imposes itself on managers, forcing them to
adopt certain practices. In terms of minimizing uncertainty, Pearce et al. (1982) suggest an
approach for environmental scanning especially for small business as a preliminary step to
planning.
Deeks (1973) identifies three types of structure in terms of the source of company policy
making: monocratic, in which overall company policy is in the hands of a majority shareholder
who is supported by an average of two "specialist managers"; oligarchic, in which overall
company policy is in the hands of two or more owner-managers, each of whom performs some
specialized function; and patrician, in which owner-managers or family members do not
participate in the formulation of company policy.
Filley and Aldag (1978) identify three patterns of organization (which have been incorporated
into a global model): craft firms, promotion firms, and administrative firms. Barry (1978)
proposes two simple distinctions: the traditional family business that is controlled by descendents
of the founder and is marked by two social systems; the family and the business, and the
entrepreneurial firm that is still controlled by the entrepreneur, the founder.
51

In determining the impact of the managerial characteristics on small business development, a
distinction should be made between the owner manager and the entrepreneur. Toulouse (1979)
defines entrepreneurship in relation to three axes: values, risk taking and action; the entrepreneur
is individualistic, has a tendency to take considerable but calculated risk and leans towards
developing activities within the firm. The entrepreneur is characterized as a person with high
need for achievement.
Deeks (1973) considers it important to distinguish the owner operator of the small business from
the owner-manager of the small business, shareholding manager from non-shareholding
managers, and hereditary owner-manager from founders. Smith and Miner (1983) identify two
types of entrepreneurs. One is made up of craftsmen entrepreneurs, who are characterized by
narrowness of education and training, low social awareness and involvement, a feeling of
incompetence in dealing with the social environment, and a limited time horizon. The second
consists of opportunistic entrepreneurs; those who are characterized by a certain degree of
education and training, high social awareness and involvement, confident in their ability to deal
with the social environment, and an orientation towards the future. Carland (1984) make the
following distinction between the entrepreneur and the owner of the small business: The
entrepreneur establishes and manages a business for the principal purpose of profit and growth.
He is basically characterized by innovative behaviour and will employ strategic management
practices in the business. The owner of a small business establishes and manages a business for
the principal purpose of furthering personal goals. The entrepreneur considers the business as a
primary source of income, and it will consume most of his or her time and resources. The owner
perceives the business as an extension of his or her personality; it is intricately bound-up with
family needs and desires.
Inspired by the work of Miller and Friesen (1982), D'Amboise (1983) supported the existence of
two types of firms – the conservative and entrepreneurial. The predominant characteristic of the
firm determines the extent to which it will take initiatives toward making new products or using
new methods of production. Paolillo (1984)' using Mintzberg's (1975) managerial roles,
concludes that the manager of the large firm is a negotiator, disturbance handler, liaison, and
52

resource allocator, whereas the manager of a small firm is a figurehead, entrepreneur,
spokesperson, and leader. Gasse (1979) shows that open-minded, as opposed to close-minded,
owner-managers have more managerially-oriented business ideologies, more sophisticated
attitudes, and more abstract concepts of small business; their approaches are more rational, and
they place less emphasis on security and the short-term.
D’Amboise (1974), D'Amboise and Gasse (1980), Rice and Hamilton (1979) show that often the
goals of the small business person are vague, inadequately defined, pragmatic, and short-ranged.
Moreover, Rice and Hamilton note that Simon's (1955) concept of satisfying is a predominant
factor in decision making; for the manager of the small business "the rational model seems to be
much too ambitious an undertaking". Bamberger (1983) asserts that, generally, objectives are
formulated at the highest level of the hierarchy, and they are strongly influenced by economic
conditions. England and Lee (1973) and Bamberger (1983) found that small firms attach greater
importance to employee wellbeing than large firms; however, the importance of productivity,
profits, growth, and, to a lesser degree, leadership and efficiency increase with size. Sexton and
Van Auken (1985) observed that only a minority of small businesses use strategic planning and
for those that do, it is difficult to sustain over time. Robinson and Pearce (1984) attributed the
non-use of strategic planning to lack of time, limited knowledge of the planning process, lack of
expertise, and lack of trust and openness. According to Jauch and Osborn (1981), strategic
actions are likely to be ratified to the extent that they fit management philosophy. An empirical
study by Chevalier and Leynaud (1983) showed that firms that exhibit a good balance between
the manager's competence and the product portfolio in terms of "stability, danger, and hope"
develop rapidly. Robinson, Pearce, Vozikis, and Mescon (1984) empirically demonstrated that
basic planning has a positive impact on the performance of the small firm.
The success of any organization requires a preoccupation with the financial situation of the firm.
Welsch and White (1981), concentrating on financial problems and financial analysis models
particular to the small business, pinpointed the principal concern such as cash flow. Kao (1982)
emphasized the importance of budget planning, the contribution approach, performance
measurement, and an investigative attitude that leads the manager to inquire into discrepancies
between the budget and operations. In an empirical study, Khan and Rocha (1982) identified four
53

problem areas for small business, they are: marketing, accounting, inventory, and cash flow.
Chaganti and Chaganti (1983) studied the profile of the profitable business as opposed to the
"not-so-profitable" one; again, a key factor for success is good cash management. An area of
concern directly related to the issue of success-failure is the evaluation criteria for the firm's
performance. Khan and Rocha (1982) identified four variables that affect performance as type of
ownership, age of the company, annual sales, and worth of assets. Robinson (1983) identified
four criteria for evaluating effectiveness of a firm as community involvement, customer
satisfaction, owner return, and employee satisfaction. In addition, he recognized the importance
of short-term profitability as measured by return on sales.
In terms of business failure, Dun and Bradstreet (1986), among others, attribute small business
failure to "lack of managerial experience". Edmunds (1997) observed that this perception is
shared by lenders, bankers, credit agencies, and the Small Business Administration because their
criterion for lending is managerial expertise. Baumback and Lawyer (1999) stressed that
"unsuccessful business owners . . . attribute their failure to many causes, rarely personal defect . .
. few business owners will admit that they are bad managers". Edmunds points out that the small
business person blames unfair competition and government intervention. Some businesses are
strictly parallel activities or hobbies; the failure of such businesses cannot be evaluated in the
same vein. Although, few studies have been conducted on strategies for the turnaround of a small
business, and little has been written on the social implications of bankruptcy, quite a lot of effort
has been made to examine the model of a small business.
Growth patterns in small businesses can be classified using two of the four models presented by
Filley, House, and Kerr (1976) that were derived from Starbuck (1965): cell division and
metamorphosis. The cell division model draws a parallel between organizational growth and the
growth of an organism through cell division. McGuire (1976) cites Haire's (1959) square-cube
law as an example of this biological analogy. According to him, organizations must "alter their
shapes as their mass expands . . . thus as the mass of an organization is enlarged, it is essential to
bolster its organizational surface at crucial pressure points by adding, for example, more staff or
more clerical help; increase operational efficiency resulting in higher profit; expansion of asset,
recognition in area of dominance resulting in higher market share and gaining shareholder trust’’.
54

Rhenman (1973) questions the use of biological models given that the organization has none of
the vital processes of the biological individual and no life cycle. Greiner (1972) proposes a
general growth model involving a period of growth maintenance, followed by a period of
evolution, and then by a period of turbulence. Each solution eventually becomes the root of a
problem followed by a crisis and change. Vargas (1984) adopts the same model, but advocates
planned growth and the establishment of a mission. In order to reduce uncertainty, he proposes
three analytical subsystems: operational objectives; structuring, integration and differentiation;
and human resource management. The management process is dynamic, especially in small,
rapidly growing firms; appropriate management practices depend on the stage of growth, the size
and age of the firm, and the expertise of the entrepreneur or owner-manager. Churchill and
Lewis (1983) discuss some of the limitations of growth models and question the assumption that
a firm must grow and pass through all the stages.
In terms of managerial and organizational requirements for growth, De Carlo and Lyons (1980)
question whether the creator-entrepreneur is capable of moving through the stages of
development to the delegation stage. Park (1983), recognizing the need for developing
management techniques and changing management as the firm grows, recommends that the
owner-manager hire an experienced manager. Cuba and Milbourn (1982) focus on the problem
of delegation, its importance and merits to organizational growth.
McGuire (1976) focuses on the limitations to growth, emphasizing that the constraints on the
growth of small firms are different from those of large organizations. He identifies
entrepreneurial expertise as the crucial factor that both permits and limits growth. In addition, the
process that permits growth is identified as amplification, the effort to widen the range and
capacity of managerial expertise through education, external advice and specialized personnel.
McKenna and Oritt (1981) discuss the problem of uncontrolled growth, cases of rapid growth,
and the various benefits and drawbacks of growth.
55

2.4.6 Role of the Entrepreneur in Business Formation and Growth.
These theories consider differences in attitudes and abilities among individuals as critical issues
in determining why some small firms grow and others do not. Two schools of thought, the
Austrian School and the Classical Economist were the first to acknowledge the role of the
entrepreneur in small business development; they recognize the entrepreneur as an individual
with special characteristics. Knight (1921) describes an entrepreneur as someone that has the
willingness and superior ability to make decisions, raise capital and assume the risk of failure. In
the same vein, Schumpeter (1939) adds among other things, that an entrepreneur has the superior
ability to perceive new market opportunities. He sees the entrepreneur as an innovator.
According to the Austrian School, people have certain characteristics that are associated with
productivity for entrepreneurship. Individuals who have more of these characteristics are more
likely to become entrepreneurs than those who have fewer. An individual chooses to create a
new business so as to maximize his expected utility. This utility is a function of entrepreneurial
activity or wage income and of attitudes that affect the utility that the person derives from
entrepreneurial activity, such as one's taste for work, effort, risk, independence, working- close-
to- customers, etc. Income, in turn, depends on the individual's ability to generate profit, such as
managerial abilities to raise capital, and abilities to perceive new market opportunities and to
innovate (Papadaki and Chami, 2002).
The Classical School, has extended analysis of the decision to start a business to that of the
decision to grow the business. According to Davidson (1989, 1991), firm growth is an indication
of continued entrepreneurship. Davidson notes that economic theories take the willingness to
grow a business for granted, by assuming profit maximization. However, empirical evidence
suggests that small business owners are reluctant to grow even if there is room for profitable
expansion and that profitable firms of different sizes co-exist within industries. Thus, Davidson
(1991) argues that growth is a choice of the owner-manager and that profit maximization is only
one of the possible motives for business growth. Davidson (1991) draws from psychological
theories of motivation, which recognize that individuals differ in their motivational make-up.
According to the "Need for Achievement" motivation theory, individuals differ in the degree
they strive for achievement satisfaction. If profit is used as a measure of success, then the
56

striving for achievement coincides with the behaviour predicted by profit maximization, but he
stresses that the latter is neither the sole nor the dominant motive for growth.
In empirical models of small firm growth, the characteristics of founders of businesses were
linked to their growth aspirations (Davidson, 1989; Kolvereid, 1990; Gundry and Welsch, 1997),
and the growth performance of their ventures (Kimberly, 1979; Cooper et al., 1994). As noted,
small business owners have been found to have many different motives for starting and operating
their businesses (Orser et al, 2000). One major distinction in these motivations is between firms
whose owners want to achieve high growth and those who do not. Those in the latter category
have also been referred to as ‘‘lifestyle’’ businesses (Churchill and Lewis, 1983). This
distinction captures the idea that growth is not always an outcome desired by all business owners
(Orser et al, 2000). Competition is another factor that has been found to influence the owner-
entrepreneur’s decision whether or not to make sustainable growth a priority (Roper, 1998;
Dodge et al., 1994).
According to Papadaki and Chami (2002), theories on small business growth and development
view business growth from an organizational life cycle perspective, which sees growth as a
natural phenomenon in the evolution of the firm; another perspective sees growth as a
consequence of strategic choice. It is obvious that attributes of the business owner,
organizational resources and environmental opportunity are crucial in expanding the firm and in
overcoming the barriers to the evolution of the firm from one stage to the next. Sexton and
Smilor (1997), Carland et al., 1984 distinguish between a business owner and an entrepreneur.
According to them, an entrepreneur is committed to the growth of the business. Growth is the
very essence of entrepreneurship, and commitment to growth is what primarily distinguishes
small business owners and entrepreneurs.
2.4.7 SMEs and Growth
It is evident from the literature that not all small businesses are growth oriented and for certain
firms growth is not a voluntary choice (Masurel and Montfort, 2006). An empirical study of
SMEs growth pattern by Kolvereid and Bullvag (1996) concluds that growth intentions may be
used to predict actual growth, that past intentions are related to later intentions, and that change
in growth intentions are associated with changes in growth patterns. Arbaurgh and Sexton (1996)
57

provide empirical evidence that most new firms do not grow into large ones and that there is no
relationship between the age of a firm and its size. Chaston and Mangles (1997) opine that there
is no single strategy to firm growth. Hence, the probability of achieving growth is increased by
avoiding excessive emphasis on single–strategy transformation initiatives, and by giving
different capabilities priority depending upon the development stage of the firm. They identify
three factors that can limit the growth of small business; namely ability, need and opportunity.
Kolveired (1992) concluded that small business entrepreneurs who want their firms to grow start
their business in order to achieve just that. The process of mutual adjustment between proprietors
and their employees was identified by Goffee and Scase (1995) as a major limiting factor of
small business growth. Crises in small high tech firms is usually caused by poor financial
records, weak general management, product competition, diversification and acquisition,
changing capital demand, high overhead structure, manufacturing and operating problems,
cancelation or delay of major contracts, poor marketing and price competition.
2.4.8 MSMEs and Economic Development in Nigeria
Even if there are controversies on definitions, what is not contestable is the contribution that
MSMEs are making to the Nigerian economy. A cursory glance at the structure of MSMEs in
Nigeria reveals that 50% are engaged in distributive trade, 10% in manufacturing, 30% in
agriculture and the remaining 10% in other services. About 10% of the total manufacturing
output and 70% of industrial employment are MSMES. MSMES also promote industrial and
economic development through the utilization of local resources, production of intermediate
goods and the transfer/transformation of rural technology. In fact MSMEs are generally regarded
as the engine driving the growth of this and other economies and provide the best opportunity for
job creation, redistributing income and rural development (SMEDAN, 2007)
In Nigeria, the Small and Medium Scale Enterprises (SMEs) constitute an important backbone of
the Nigerian economy. Economically, this sector holds the key to sustainable development of the
country. The importance of SMEs can be put in proper perspective in relation to the structure of
the Nigerian economy. In spite of the importance of petroleum oil, agriculture remains the key
sector, providing gainful employment for about 70% of the Nigerian population. Available
reports indicate that the agricultural sector accounts for about 35% of the nation’s gross domestic
58

product (GDP). Most of the operators in the agricultural sector are cottage type or small-scale
self-employed individuals engaged in agro-allied processing. Activities in the agro-allied
processing sub-sector also have some consequences for the role of small scale manufacturing
enterprises in Nigeria. For example, small-scale industrial fabricators constitute the main source
of machinery supply to agro-allied processors. These fabricators abound all over the country and
when added to the output of the SMEs in the agricultural sector, the combined contribution of
SMEs cannot be less than 60% of the GDP. A recent study also indicates that both agricultural
and the informal sector contribute up to 75% of the nation’s GDP. It is safe to say that both
sectors constitute the domain of SMEs in Nigeria.
Attention has been focused on small scale enterprises by government because it is perceived that
they have the potentials of realizing the multiple goals of employment generation and poverty
reduction. It is against this background that one needs to emphasize the desirability of doing all
that is possible to enhance the orderly growth and development of SMEs in Nigeria. However,
the realization of the potentials of SMEs at making the desired impact on the nation remains
elusive. This has been attributed to several factors ranging from; lack of understanding of SMEs,
Government’s inability to evolve, implement and monitor policies that would enhance SME
growth, poor operating environment typified by inadequate and/or dilapidated infrastructure, the
innate structural deficiencies of the SMEs engendering a lot of incapability, inadequate capital
particularly long-term capital, lack of access to adequate information on viable projects (OAU
Consultancy Services, 2004).
The importance of Micro, Small and Medium Enterprises (MSMEs) in employment generation,
economic empowerment, poverty alleviation and even distribution of development has long been
recognized. A study of Nigeria’s informal sector put the estimated number of non-agricultural
micro enterprises at 6.49 million with a total employment of 8.97 million. This group is
dominated by wholesale and retail trade which accounts for about 49% of employment;
manufacturing accounts for (30%). Other numerically significant sectors include repair of
vehicles (3.2%), transport (2.9%), hotels and restaurants (2.6%) and building and construction
(1.8%). Manufacturing is dominated by food processing (18.7%), textiles, clothing and leather
goods (3.8%), wood and wood furniture (3.3%) and metals & metal products (1.1%). Non-farm
micro, small and medium enterprises account for over 25 per cent of total employment and 20
59

percent of GDP. By global standards, large enterprises are very few in Nigeria. They account for
a disproportionately large share of the GDP. Because their links with the rest of the economy are
weak, their impact on economic growth has been limited and often distorted (SME National
Policy, 2007).
The importance of micro and small enterprises (MSEs) to the socio-economic development of
low and middle-income economies is well documented (Daniels, 2003; UNIDO, 2003; ILO,
2002; King & McGrath, 1999; Daniels & Mead, 1998). In the poorest economies, MSEs, and
microenterprises in particular, are a major source of employment and income (Mead &
Liedholm, 1998), especially for the poorest members of society. Thus, there is a great deal of
interest in the performance of firms in the microenterprise sector and its scope is to generate
employment, both through new business start-ups and the expansion of existing businesses. Most
microenterprises are characterized by low productive capacity which is manifested in low rates
of growth and high mortality rate (ILO, 2002; Daniels & Mead, 1998; Mead & Liedholm, 1998;
UNIDO, 2003).
2.4.9 MICROCREDIT AND MICRO ENTERPRISE
Fasoranti, Akinrinola and Ajibefun (2006) examined the impact of microcredit and training on
the efficiency of small scale entrepreneurs in Ondo State. They identified technical efficiency of
entrepreneurs to be influenced by human capital variables (which are characterized by level of
education, business experience and age) and socio-economic/institutional variables
(characterized by loan interest, loan size, contact with lender, training programme and training
experience). This they estimated using stochastic production function frontier also called the
composed error model of Aigner and ordinary least square. The study is premised on
determining the link between access to credit, training and technical efficiency and highlighting
other significant factors that influence the level of efficiency in the baking, furniture making, and
burn brick making micro-enterprises. The result obtained showed initial outlay and man hour to
be the most significant factors influencing value of output for bakers, while capital outlay, man
hour worked and expenditure on equipment in that order to be significant factor influencing
value of output for furniture makers. For the burnt brick firms, capital outlay and labour were
found to be the most important factors influencing the value of output. The study concluded by
60

showing that the significant determinants of technical efficiencies of bakers, furniture makers
and burnt brick makers were age of operators, business experience, level of education, training
experience, credit access, working capital and initial capital outlay. Well-structured
entrepreneurship training programmes complemented with easy credit access can facilitate the
desired improvement in the efficiency of small scale business people in the State.
Ogunrinola and Alege (2008), found the operation of UNDP- sponsored MFI to be beneficial to
micro businesses in the rural based areas of Lagos State. Forty-two (42) of the enterprises that
received microcredit reported business success as a result of the application of the loan received.
Micro-entrepreneurs in the study achieved a very high loan repayment rate of 96 per cent and
reduced rate of business failure and also restricted rural–urban migration.
Karlan & Gine (2007) in a field experiment, where, neither group nor individual liability loans
are backed by any form of physical collateral, so that the same borrowers can be subject to one
or the other form of liability, used randomized control trial to evaluate the impact of group
liability on the performance of clients and the profitability for a lending institution in Philippines.
The result showed that, one, individual liability compared to group liability leads to no change in
repayment but is better at attracting new clients and keeping existing ones. Two, there is a
statistically significant evidence of some of the mechanisms discussed in the group liability
literature, such as screening and monitoring, but they did not find that it adds up in an
economically meaningful way to higher (or lower) default.
Hartarska and Nadolnyak (2008) used the financing constraints approach to study the impact of
microfinance on access to credit for microenterprises in Bosnia and Herzegovina. Using
sensitivity analysis and multiple regression analysis, the data and method employed produced
results consistent with more traditional impact studies on Bosnia for the same period. They show
that MFIs improved access to credit in municipalities where two or more MFIs offered financial
products because investment in local microenterprises was less sensitive to availability of
internal funds than was investment in microenterprises in municipalities where microfinance
activities were limited or non-existent and where micro entrepreneurs had to rely more on
internal funds for investment. The methodology is appropriate for other countries where Living
61

Standard Measurement Surveys or similar large scale household surveys are conducted and
where data on geographic distribution of MFIs branches can be assembled. The popularity of
microfinance forces MFIs to be more transparent and decreases the cost of assembling a database
with MFIs branch distribution, therefore making the financing constraints approach more
attractive for use in the future.
Masakure, Cranfield and Henson (2008), present a detailed analysis of the variation in
performance of microenterprise in Ghana using data from the 1998/1999 Ghana living standards
Survey (GLSS 4). They model the determinants of enterprise profitability using probit, OLS and
quartile regression models to account for both the incidence and diversity in performance across
the conditional mean distribution of profits. The results suggest that both the incidence and
intensity of performance vary considerably across sub-sectors. For example, across
microenterprises, activities related to trading and manufacturing are both associated with a
higher chance of profitability and larger profits, while the opposite is true of the construction
sub-sector. There is even greater variation across firms within each sub-sector. While a wide
range of entrepreneur (level of education and religion) and firm-specific factors (most notably
months of operation, use of hired and/or employment of apprenticeship labour, sources of credit,
value of assets, rurality, and regional location) influence the probability and magnitude of profits,
it is notable that the impact of any one of these factors varies. According to the authors, the use
of hired labour significantly affects the probability of being profitable in the trading sub-sector,
but it is insignificant in the manufacturing, community, personal and social services, and
construction sub-sectors. Because the significance and impact of each of these variables on the
probability of an enterprise being profitable varies widely across the four sub-sectors, it is
difficult to draw general and definite conclusions as to the impact of any one factor. However, if
we consider the variation in impact of these factors on the intensity of microenterprise profits
across the quartiles within any one sub-sector, it is possible to define a common series of critical
factors for sub-sets of firms. For example, while firms in the trading and manufacturing sub-
sectors are highly profitable, there is also considerable variation in profits within these sub-
sectors, due to months of operation, the use of hired labor and forms of credit. This suggests that
policies aimed at promoting the performance of microenterprises should adopt a sectoral
approach and, within that, address specific issues that affect enterprises at the lower and upper
62

ends of the spectrum of performance. Thus, approaches and resources should address the most
critical determinants of performance in focal sub-sectors aiming to augment access to critical
resources and, perhaps, overcome the disadvantages of location for example that cannot by itself
be varied.
They observed a weakness in the study and in the extant literature of some of the widely used
measures of skill and knowledge acquisition to explain microenterprise performance. While the
literature argues that apprenticeships positively influence on firm performance such that former
apprentices transfer the knowledge they acquire to their own businesses, the result obtained by
these authors fails to support that view. Although the majority of entrepreneurs in
microenterprises in Ghana do not have apprenticeship training, those that do often end up
operating in sectors outside of that in which their apprenticeship was served. They, therefore,
argue that the weak explanatory power of having completed an apprenticeship is an artifact of
the variables themselves, which prove to be poor proxies for the entrepreneurs’ knowledge base
and management skills in the context of their current enterprise. The real world situation is
clearly more complex; for example, the need to know not only the level of education and/or
training entrepreneurs have received, but also the relevance of the skills they have acquired for
their business. The strategic management literature offers some insights that may help to
determine the importance of the entrepreneur’s tacit knowledge and impacts on enterprise
performance.
Methodologically, the findings of this study demonstrate the utility of employing quartile
regression QR in order to uncover the heterogeneous nature of microenterprise performance.
Indeed, the results highlight a fundamental weakness in previous analyses of microenterprise
performance, in that they implicitly assume that a common set of factors is the determinant of
enterprise performance and that these factors do not change as an enterprise performs
better/worse. Perhaps of the greatest importance, however, is the fact that the parameters
estimates indicate how the critical constraints faced by microenterprises, and their
responsiveness to particular determining factors, differ according to the prevailing level of
performance of the enterprise. This facet of microenterprise performance has hitherto received
scant attention in the literature.
63

Niskanen and Niskanen (2007) investigated the determinants of growth in a sample of small and
Finnish micro firms. Firm growth is examined on the basis of a number of firm-specific and
relationship lending characteristics. The data set provides an excellent opportunity for investigating
the effects that firm-specific factors have on firm growth. The study investigated the relationship
between firm growth and relationship lending variables, and was also able to provide new
information on the role that legal form has on firm growth by using more detailed ownership
variables. The result on relationship lending effects suggest that an increase in the number of lending
banks decreases growth rates in the larger firms and that an increase in the number of banks
operating in the county where the firm is located promotes the growth of the larger firms and limits
the growth rates of the smaller firms. It may, therefore, be argued that close lending relationships
enhance growth for all firms, but that only the larger firms in the sample benefit from more
competitive banking markets. Differentiating between manufacturing and non-manufacturing firms,
they observe that close bank/borrower relationship enhances growth only for non-manufacturing
firms. This implies that it is easier for banks to monitor manufacturing firms. The results concerning
the role that legal form has on growth differ; the results of our primary models suggest that legal
form has no impact on growth. However, when the regression was run without ownership
variables, the coefficient on legal form obtained was significant. This would seem to suggest that
legal form can be seen as a proxy for a much more complicated ownership growth relationship.
They also found that the results on firm age confirmed previous findings by suggesting that
younger firms grow faster than older firms. They measured firm size by adding a quadratic size
variable to the model. The result obtained suggests that the growth rate initially increases with
firm size, but then starts to decrease after a certain level. When the firms were categorized into
firms with more than ten employees and those with less than ten employees, the result were
found to be significant only for the smaller firms. Therefore, they rejected Gibrat’s law for the
firms with more than 10 employees. Also, when the sample was separated into manufacturing
and non-manufacturing firms, they rejected Gibrat's law only for manufacturing firms. A number
of other firm characteristics also turned out to be significant determinants of firm growth. They
also found that increases in profitability lead to an increase in growth rates in the smaller firms
with less than 10 employees and in non-manufacturing firms. The results also indicate that parent
companies grow faster and subsidiaries slower than the independent firms in the sample. Finally,
it seems that the firm specific variables included in our model are most useful in determining
64

growth rates for firms with less than 10 employees and firms that operate under unlimited
liability legal form. The results suggest that relationship lending effects and the ownership
structure of the firm are important determinants of firm growth. Bank/borrower relationships
enhance growth mostly for the larger firms in the sample and for the non-manufacturing firms
and competitive local banking markets benefit only the larger firms in our sample.
While the literature shows the contribution of microenterprises to employment, income, and
livelihoods and the differing measures that can be employed to measure and assess enterprise
performance, there is little work on how financing with microcredit contributes to
microenterprise performance in the specific context of Nigeria. The available studies are mainly
survey-based (studies) and highlight only the microcredit and microenterprise development
Nigeria.
Harding, Soderbom and Teal (2004), investigated recent reforms in most African economies of
their trading and exchange rate regimes which have eliminated much of the protection which
previously limited competition. According to them, despite reforms (in many African countries)
aimed at improving the manufacturing sectors, African manufacturing firms remain
unsuccessful, particularly in international export markets. They consider the roles of learning,
competition and market imperfections in determining three aspects of firm performance, namely
firm exit, firm growth and productivity growth. Using pooled panel data set of firms in Ghana,
Kenya and Tanzania that spans a period of five years, they found that the main determinant of
exit is firm size, with small firms having much higher exit rates than large ones. They also found
that productivity affects firm survival among large firms, but not among small firms. They
found evidence that, among surviving firms, old firms grow slower than young firms, which is
interpreted as evidence consistent with market constraints limiting growth of firms in Africa.
There is no evidence that larger firms have faster rates of productivity or input growth, or are
more efficient in the sense of benefiting from scale economies. Competitive pressure enhances
productivity growth. Given that one of the objectives of the reform programmes implemented in
all three countries was to stimulate higher efficiency levels, this finding shows that one aspect of
the reform programme has been successful.
65

Brown, Earle and Lup (2004), employed panel data techniques to analyze a survey of 297 new
small enterprises in Romania containing detailed information from the startup date through 2001.
We find strong evidence that access to external credit increases the growth of both employment
and sales. Taxes appear to constrain growth. The data suggest that entrepreneurial skills have
little independent effect on growth, once demand conditions are taken into account. The evidence
for the effectiveness of technical assistance is weak: only assistance provided by foreign partners
yields a positive effect. A wide variety of alternative measures of the business environment
(contract enforcement, property rights, and corruption) are tested, but none are found to have any
clear association with firm growth.
Barnes et al (2001) on impact of loan on enterprise performance, found that Zambuko loan had a
positive impact on the inflation-adjusted value of the monthly sales revenue of the matched
enterprise of repeat continuing clients (they define continuing client as individuals who have
stayed on with the program from 1997 till date and have taken at least one loan). In spite of the
unfavorable economic environment, they earned an estimated Z$1,380 a month more than the
non-clients in 1999. When considering the total net revenue from all the household’s enterprises,
positive gains were made by the departing clients and non-clients. Nevertheless, both years the
level of income was higher for the continuing clients than the other two comparison groups. The
estimated values in 1999 did not suggest that microfinance had an impact on the level of income
from all the household’s enterprises. Also, participation in the microfinance programme does not
appear to have had an impact on employment in the matched enterprise and in all household
enterprises. Employment was measured by the number of paid employees, total person-hours
worked last week, and total person-days worked last month. The results are likely to be related to
the unfavorable economic conditions for microenterprises in 1999.
On value of assets in the matched enterprise and all household enterprises tended to be higher in
both 1997 and 1999 for the continuing and departing client groups, than the non-clients. The
impact analysis did not suggest that the differences in 1999 between the groups were associated
with participation in Zambuko’s programme. Nevertheless, the average value of all enterprise
assets in 1999 for departing client households was estimated to be Z$4,987 more than for the
non-client households. Transaction relationships which refer to ways micro-entrepreneurs
66

organize and manage their businesses in reference to others. The study found that transaction
relationships in the matched enterprises were largely unaffected by participation in the
microfinance programme. The majority of respondents operated their enterprises from their
residence in both 1997 and 1999. Clients were more likely than non-clients to sell outside their
town of residence, in small towns and rural areas in Zimbabwe and places in South Africa. The
pattern did not change significantly from 1997 to 1999. The respondents sell to individuals who
are normally the final consumer. These customers often ask for credit. Among those who
extended credit, significantly more departing clients than non-clients insisted on a deposit in
1999. The result suggests the influence of training by Zambuko.
Ogunriola and Alege (2008) study was restricted to rural areas of Lagos State, while the work of
Fasoranti, Akinriola and Ajibefun (2006) on microcredit and training on efficiency of small scale
Entrepreneurs was restricted to Ondo State. Cross-sectional data obtained through a survey
across the western states geo-political zone allowed us to bridge this apparent gap, examining the
contribution of microcredit to MSEs’ performance in Nigeria.
Based on our review of the literature, this study classifies factors that affect the long-term
survival and viability of firms into 4 broad categories of independent variables. These four broad
categories were macro economic factors, factors that affect access to social capital, factors that
affect the internal efficiency of small businesses and enterprises, and factors that affect access to
micro credit. Macro economic factors include variables related to economic policy that are
essential for promoting private investment in MSMEs, legal and regulatory issues, the
assessment of tax, backward and forward linkages, access to credit, the degree of competition at
the local market as well as local demand for goods and services produced by MSMEs. Factors
related to internal efficiency refer to business-related decisions made by owners/mangers, trends
in net income, conversion of profit back into investment, demographic conditions, level of
education, prior business experience, managerial ability, motivation for working in the sector,
number of working hours, level of technical skills, business training received, etc. Micro credit
refers to availability of credit, access to credit finance, sources and amount of initial start-up
capital, terms of loan repayment conditions and the extent of effective utilization of credit. Social
capital refers to participation in microfinancing schemes, access to free family labour at work
67

and networking with other businesses and enterprises as a result of participation in micro-
financing schemes. These four categories of independent variables account for most of the key
predictors of survival affecting MSMEs in Nigeria.
Most relevant to our work are the submissions of Churchill and Lewis (1983) on 5 stages of
small business evolution on the passage from survival stage to the success stage which requiring
external loan for appreciable growth. Also, relevant is the financial growth theory propounded by
Berger and Udell (1998). They explain that firms lie on a size/age/information continuum where
the smaller/younger/more opaque firms lie near the left end of the continuum indicating that they
must rely initial insider finance, trade credit and /or angel finance. Microfinance being a type of
an angel finance. It is obvious from the foregoing that limited literature exists on effect of micro-
financing on small MSMEs in Nigeria. It is also obvious, that microfinance offers important
alternative sources of credit to small business operators, but there is no empirical information on
the extent of the impact of microfinancing on small business survival and growth particularly in
Nigeria. This study will fill the gap in literature in Nigeria. An important issue addressed in this
study is the capability of microfinance institutions to enhance expansion capacity in terms of
growth of the MSE sector, which will put to rest the capability of small enterprise to solve the
unemployment problem in Nigeria. Alternatively, why is it that despite the fact that about 90%
of the businesses in Nigeria is micro and small enterprises in Nigeria, the rate of unemployment
is still very high? This is one major issue this study intends to address.
2.4.10 Political and Social Dimension to Entrepreneurship in Nigeria
Djankov et al. (2004) identify three distinct perspectives on entrepreneurship. The first is the
institutional perspective emphasized by economists and political economists. This perspective
focuses on the role of economic, political, and legal institutions in fostering or restricting
entrepreneurship in different countries at various times. Particularly relevant institutional
constraints are seen in two aspects. One aspect has to do with the credit market in financing
entrepreneurial activities. For example, a major body of research in economic development has
emphasized the role of credit constraints making it impossible for the poor to borrow to set up
their own businesses (Banerjee and Newman, 1993). The other has to do with security of
property rights in providing the right incentives for entrepreneurs. The second perspective
focuses on the sociological variables that are shaping entrepreneurship. Sociologists have long
68

emphasized the role of values (Cochran, 1971) and social networks (Young, 1971) in promoting
or discouraging entrepreneurial activities. Social networks may work through a variety of
channels, such as family, relatives, friends, or social groups in general. The third perspective on
entrepreneurship emphasizes individual characteristics of entrepreneurs. For example,
psychologists have hypothesized about the psychological traits associated with entrepreneurs –
such as a personal need for achievement. Even if the entrepreneur possesses the last two,
activities in the political environment can constraint and frustrate the effort of the entrepreneur.
Djankov et al. (2004) also identified aspects of the institution as environment playing an
important role in determining the scope for entrepreneurship. There is evidence to suggest that
social network effects are very important in determining entrepreneurial behavior.
According to Onwubiko (2009), it is a universal belief that certain basic infrastructural facilities
aid the development of the mind and body and assist productivity in any environment. These
facilities have been identified as good roads, good water supply, constant power, access to
information and communication technology and other tools of trade. When these are not
available in a country, the growth of the economy will be adversely affected. In Nigeria, these
basic work tools as well as the enabling environment are lacking. This state of affairs has
frustrated a lot of young people with bright ideas from actualizing their entrepreneurship dream.
For instance, the power sector has proved to be the greatest challenge to any aspiring
entrepreneur in Nigeria. The supply is epileptic and most times businesses have to be run on
generators. The cost of this alternative source of power frequently erodes whatever profit or
capital an entrepreneur has put aside for his enterprise.
In Nigeria, economic factors such as policy reversals, high and double taxations, difficulty in
procuring business approvals, high inflation and unstable exchange rates are some of the areas of
concern for the potential entrepreneur who is in most cases a greenhorn. The cost and procedure
for establishing a company is prohibitive as the intending entrepreneur must engage a solicitor
and an accountant to take care of the legal and financial aspects.
69

Politically, some of government’s policies, it seems, are made to favour friends and associates.
Even when it comes to the award of contracts and other government patronages, cronyism is the
word. This creates a situation of uneven advantage to certain people while others are meant to
look mediocre regardless of their pedigree, ability and expertise. One cannot complete this
without mentioning the social malaise of systemic corruption which dissuades most people from
venturing into enterprises. It seems, that, quite often, whatever one needs to do must be
accompanied with some kind of favour to the person or authority granting the approval. This
situation is almost frustrating and has kept many away from entrepreneurship; many youths
prefer to be engaged in paid employment where they will be certain of receiving their pay salary
packages at the end of every month without the worries associated with running a business.
Sanusi (2010) remarked that the CBN has done so much to boost domestic lending in the
Nigerian economy, but that government should provide needed infrastructure to complement
monetary measures in order to boost the economy. Sakar (2008) opines that the entrepreneurial
spirit can exist anywhere in the world, but to operate successfully the entrepreneur need a
favourable political and business environments. She further explains that factors such as
bureaucratic red-tapism, corruption, complicated business regulations and suppression of local
markets in many developing countries have forced much entrepreneurial energy to operate
subversively in black market economies.
Lewis (2008) remarks that Nigeria faces developmental challenges in the economic, political,
and social dimensions. Though analytically distinct, these problems are integrally related.
Economic stagnation arises from a generalized crisis of governance, just as poor economic
performance contributes to the infirmities of the state. Dombrovsky (2009) is of the opinion that
entrepreneurship is influenced by a variety of factors, which may differ in a transition context.
Previous entrepreneurship research on transition economies has shown the environment and
institutional factors to be highly relevant in determining the success of entrepreneurship.
Environmental influences in the meaning of culture may be reflected in both social norms, but
also in a wider sense in the role models entrepreneurs draw on. Here, entrepreneurial experiences
within the (wider) family were generally found to offer positive role models. Naturally, the
decision to enter entrepreneurship also is influenced by the individual resource endowments of
70

potential entrepreneurs such as access to financial capital and the level of human capital, with the
latter generally being high in most transition countries.
At times the entrepreneurial drive displayed by an individual is culturally rooted. The inability of
Nigerians to develop their entrepreneurial prowess could be blamed on the development process
which does not allow many Nigerians to be hard thinkers (Olutayo, 1999); people have not been
given enough chance to participate in the development process. The state, it is argued, has
hijacked the role of individual entrepreneurs and therefore encouraged a top-to-bottom approach
to development. Consequently, the state, it is further argued, has been demotivating the ordinary
people who possess the energy required for mobilizing development efforts. According to the
World Bank (1989), these ordinary people who perceive profitable opportunities, are willing to
take risks in pursuing them, and have the ability to organize a business, are the ‘missing link’ in
sub-Saharan African development.
Of the three main ethnic groups in Nigeria, LeVine argues, the Igbos are the most energetic
parvenus who have successfully challenged the established order of supremacy which the
Yoruba occupied in the elitist professional civil service establishments. Green (1947) observes
that the Igbo admire “the man of energy, the go getter...” and that the qualities stressed in
children’s upbringing are property, money, honesty, and loyalty to kinsmen. Due to these
patterns of socialization and the democratic nature of the Igbo social structure, LeVine argues
that, contrary to other motivation theorists, especially McClelland, the family influence on the
need for the achievement motive is intrinsic rather than extrinsic among the Igbos.
2.5 Theoretical Findings
The review of literature covered in this study has led to the following findings:
1. Regular participation in microfinance enhances small business survival. Bekele and
Zeleke (2008) found ability to convert profit into investment, good managerial ability,
entrepreneur’s level of education, ability to make profit and regular participation in
microfinance to be major determinants of small business survival.
71

2. Access to external credit increases the growth of both employment and sales. Brown,
Earle and Lup (2004) found strong evidence that access to external credit increases the
growth of both employment and sales. They also found taxes to constrain growth.
Olutunla and Obamuyi (2008), provide evidence that external credit enhances growth, but
emphasize that the right amount of loan at the right time is crucial. Marin (2009) on the
other hand remarks that at the success stage one of two things can happen; the
owner/manager may maintain the present profit status quo by relying on internally
generated fund for investment and essentially, maintain the status quo, or the owner/
manager may decide to grow the business; the owner consolidates the company and
marshals resources for growth through the borrowing power of the company. In order
words, he seeks for external loan in order to grow the company. Managers must be hired
with a focus on the company’s future rather than on maintaining its current condition and
status quo. Fasoranti et al. (2006) also find easy credit access to be a major determinant in
efficiency of the small scale entrepreneur.
3. Lack of access to finance has been identified as one of the major constraints to small
business growth (Carpenter, 2001; Anyanwu, 2003; Owualah, 1999, 2009; Lawson,
2007).
4. Well structured entrepreneurship training programmes facilitate the efficiency and
productivity of entrepreneurs. (Fasoranti et al. 2006). Competitive pressure enhances
productivity growth (Harding et al; 2004).
5. Growth-seeking SMEs have significantly different preconditions for growth than those
which do not pursue further growth (Pasanen and Laukkanen, 2004).
6. Micro, Small & Medium Enterprises (MSMEs) contribute to economic growth and
sustainable development through employment generation and wealth creation (CBN,
2004) NISER (2004).
7. Entrepreneurship in Nigeria is constrained by political and social factors (Onwubiko,
2009). Entrepreneurial spirit can exist anywhere in the world, but in order to operate
successfully, the entrepreneur needs favourable political and business environments;
72

factors such as bureaucratic red-tapism, corruption, complicated business regulations and
suppression of local markets in many developing countries have forced much
entrepreneurial energy to operate subversively in black market economies (Sakar, 2008).
H3
H4 H4
H2 H1
73
Transformation
Micro business to
SmallIndustry
Small Business Survival
SmallBusiness
Productivity/Performance
Microfinance
MSEs Growth andExpansion
FInancial
ServIce
Nonfinancialservice

Figure 2:4 Conceptual model and Hypotheses*H=Hypothesis
Author’s compilation, 2009
CHAPTER THREE
RESEARCH METHODOLOGY3.1 Introduction
This chapter describes the methodological framework used in attaining the stated objectives of
the study. It also shows the research hypotheses postulated. The main focus is on the research
design, type and sources of data, population description, sample size, sampling frame and its
characteristics, sampling technique and a description of the choice of data collection instruments,
questionnaire design, and methods of data measurement.
3.2 Research Methods
A mixed-method strategy was adopted for this study. A mixed method is one in which more than
one method of approach is used in data collection and analysis in research (Romano, 1989).
Otokiti (2005) identifies the following nine types of research methods as those commonly used
in business research: experiment, survey, case study, action process, grounded theory,
ethnographic, archives, ipso facto, and observation. He stresses that the choice of method
depends on the research questions asked and the objectives of the research.
In this study, the first objective requires documenting the process, practice and mode of
operations of microfinance banks; hence we resort to the use of a structured interview with
Senior Bank officials. Another objective involves testing for the survival and growth of small
74

firms in Nigeria. The data collection methods involve the extraction of longitudinal data from
bank records combined with field survey. The survey method was adopted for this study because
it is convenient and has the cheapest cost implication for collection of large data like we have in
this study. The study tests the effect of microfinancing on the survival and growth of small
business. In other words, it is a study that attempts to ascertain the impact of microfinance on
small business development in Nigeria. The survey method used in this study makes visual
presentation and personal contact with some of the respondents possible; this also increased the
response rate. The methods adopted in this study have allowed the use of advanced statistical
techniques such as Kaplan-Meier, Cox Regression Analysis and Ordinary Least Square for
different aspects of the study in relation to the survival and growth of small business.
3.3 Research Design
The multiple-method strategy was adopted for this study so as to reduce the possibility of
personal bias by not depending on only one method or response from only one firm or sector.
Adopting this approach enhances the authenticity of the study. The study was designed to
combine primary survey-based data with secondary information from bank records. Both
qualitative and quantitative data were used in a variety of ways, including a detailed overview of
survey results in terms of a general profile and a model of Nigerian micro and small firms. A
well structured questionnaire was administered to operators and semi - structured interviews
were conducted with Senior Bank Officials to document the practice and process of
microfinancing in Nigeria. The idea behind this was to obtain cross-referencing data and some
independent confirmation of data, as well as a range of opinions. The panel data, that is the
combination of primary and secondary longitudinal data already gathered by the banks gives a
better perspective of the clients/customers’ profile over a period of time and makes better
judgment possible. Panel data facilitate a precise specification of timing so that the effect of a factor
is measured after the factor has changed. What is also important is that they permit the use of fixed
firm specific effects. This is suitable for the present study because we are looking at a variable in
retrospect (microfinance) and relating it to the enterprise (survival, performance, and growth).
The interview sessions contained questions directed to senior officials of the bank in mostly face-to-
face interview to document the process, practice and mode of operations of microfinancing in
Nigeria.
75

3.4 Population of the StudyThis research identified two-in-one aggregation or study groups; these are all Microfinance bank
(MFB) in Nigeria, all Microfinance Bank (MFB) clients who are operators of micro and small
enterprise in Nigeria, particularly those that have benefited at one time or another from the
financial and non–financial services rendered by a MFB in Nigeria. According to the CBN
records as at 31st March 2009, there were 305 Microfinance Banks in the Southwest geopolitical
zone. Out of the 305, only 169 have obtained their final licence to operate as Microfinance
Banks. The other 136 reportedly have provisional approval. For the purpose of this study, the
population of Microfinance Banks adopted for the study is the 169 MFBs that have obtained
final approval. See distribution across the South-West as stated in Table 3.4.
Table 3.4 Licenced & Unlincenced Microfinance Banks
In South Western Zone of Nigeria as at March 2009
Bank
Licence
Status
States of the South Western Zone
Lagos Ogun Oyo Osun Ekiti Ondo Total
Banks
Licenced
74 29 26 24 7 9 169
Banks with
Provisional
licence
73 22 20 7 6 8 136
Total 147 51 46 31 13 17 305Source: CBN, Other Financial Institutions Department (2009)
According to the United States Agency for International Development (USAID) funded project
on Promoting Improved Sustainable Microfinance Services (PRISMS) (2004), the statistics on
the number, size, geographical distribution, and activities of the microenterprise and SME sub-
sectors are partial and defective; however, the report suggested that the MSME sub-sector may
comprise as much as 87 percent of all firms operating in Nigeria. This percentage excludes the
informal microenterprise sub-sector, which remains the main source of income and employment
for most Nigerians. The assessment study suggested that there are about 8.4 million MSMEs in
76

operation in Nigeria today. Given the paucity of available statistics, it is impossible to gauge the
exact numbers of MSMEs segregated by size, but it is plausible to suggest that the number of
microenterprises may comprise 80 percent of the total number of estimated MSMEs
(approximately 6.7 million); that small businesses may account for 15 percent of the total (about
1.3 million); and that medium enterprises may comprise 5 percent of the total MSMEs (around
420,000) (USAID, 2004). A rough estimation based on the 2004 survey, distributed across the
six states is as shown below;
Table 3.5 Distribution of Micro, Small and Medium Enterprises South-West
Nigeria
State Micro
Enterprise
Small Scale
Enterprise
Medium Scale
Enterprise
Total
Lagos 741,448 142,285 16,662 900,395
Ogun 556,086 106,713 8,999 671,798
Oyo 381,534 41,304 1,208 424,046
Osun 285,220 24,112 890 310,222
Ondo 189,890 6,889 302 197,081
Ekiti 103,007 1009 158 104,174
Total 2,257,185 322,312 28,219 2,607,716Source: Adapted from Chemonics International for USAID (2005)
3.5 Sample Frame
The sample frame for this study is determined from the population of MSMEs operators, users of
MFBs. We rely on the findings of an assessment study carried out by USAID (2005) on a
financial service demand survey for micro, small and medium enterprises in Nigeria. The
findings suggested that only 10% of MSMEs operators have access to microfinance due to the
limited number of microfinance institutions in Nigeria (USAID, 2005). Using this parameter, we
77

develop another table to determine the sample frame for the study on small and micro enterprise
operators, user of microfinance banks. Based on the sample frame, a final sample size was
selected.
Table 3.6 Distribution of MSEs Operators Using Microfinance Banks.
State Micro
Enterprise
Small Scale
Enterprise
Total
Lagos 74,145 14,229 88,374
Ogun 55,609 10,671 66,280
Oyo 38,154 4,130 42,284
Osun 28,522 2,411 30,933
Ondo 18,989 689 19,678
Ekiti 10,301 101 10,402
Total 225,720 32,231 257,951Source: Adapted from Chemonics International for USAID (2005)
3.6 Sampling Technique
In this study, the multistage random sampling technique was adopted. This is because the study
identifies a two-in-one aggregate study groups which form different clusters, therefore, the
multistage sampling technique becomes useful. The clusters are Microfinance Banks in South-
West Nigeria, their clients/customers operators of micro and small enterprises that have
benefitted from financial and non financial product offered by the Microfinance Banks for a
period of not less than five years. The community banks that transformed into Microfinance
Banks in South-West Nigeria form the first cluster. 106 of such banks were randomly selected
from the list of 169 banks that have obtained final license to practice in South-West Nigeria. The
selection of banks was based on the geographical spread of MFBs in South-West Nigeria. The
78
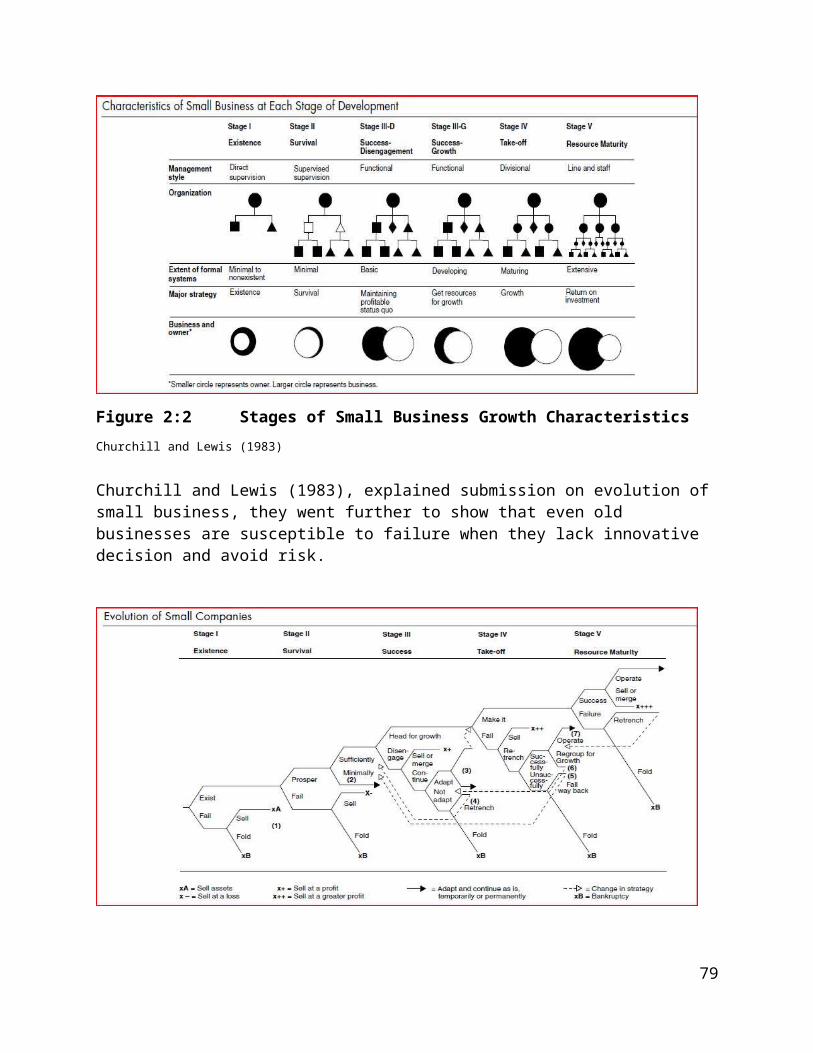
Microfinance Banks Clients/Customers operators of micro and small enterprises that have stayed
with the banks for a period of at least five years are listed for each bank, while six
clients/customers were randomly selected from each bank among those that have benefited from
the financial and non-financial services provided by the banks at one time or the other. Thus, for
the purpose of the study we selected our sample unit based on specific criteria. The
generalization of results is thus limited to those which satisfy the criteria.
The study accordingly ensured that Microfinance Banks selected satisfied the five years
existence criterion, while the small and micro enterprise users of microfinance banks also were
subjected to minimum of five (5) operations in our final analysis. The South West geographical
zone had the highest concentration of Microfinance Banks in the country with 305 banks and 169
having final license status (CBN, 2009). The North-West zone had 56 Microfinance Banks,
North-Central 101, and North-East 30. South-South and South-East zones had 110 and 166
Microfinance Banks respectively.
3.7 Sample Size Determination
In choosing the sampling size and securing representative responses, the size of the sample was
based on statistical estimation theory considering degree of confidence that is expected from this
type of research. There are different models in the literature developed to determine sample size
from a given population, but for a continuous and categorical data like what we have in this
study, Bartlett, Kotrlik and Haggins (2001) model for determining the minimum returned sample
size for any given population was adopted. The model is developed from the work of Cochran
(1977) and it is estimated with an accepted margin of error of 0.03 for continuous data and 0.05
for categorical data. Continuous data produce responses from a measuring process which takes
any value within a range like the one we have in MSEs where there is no end to the number of
people starting and joining the group on a daily basis, while categorical data are those
differentiated by certain categorical variables as associated with micro enterprise, small scale
enterprise and medium enterprise.
79

Table 3.7 Minimum Returned Sample Size Table for Continuous and Categorical Data
S/N Population
Size
Sample Size
Continuous data
(Margin of error = 0.03)
Categorical data
(margin of error=.05)alpha=.10
t=1.65
alpha=.05
t=1.96
alpha=.01
t=2.58
Alpha =.10
t=1.65
Alpha =.05
t=1.96
Alpha =.01
t=2.58
1 100 46 55 68 74 80 87
2 200 59 75 102 116 132 154
3 300 65 85 123 143 169 207
4 400 69 92 137 162 196 250
5 500 72 96 147 176 218 286
6 600 73 100 155 187 235 316
7 700 75 102 161 196 249 341
8 800 76 104 166 203 260 363
9 900 76 105 170 209 270 382
10 1000 77 106 173 213 278 399
11 1,500 79 110 183 230 306 461
12 2,000 83 112 189 239 323 499
13 4,000 83 119 198 254 351 570
14 6,000 83 119 209 259 362 598
15 8,000 83 119 209 262 367 613
16 10,000 83 119 209 264 370 623
80

Source: Bartlett, Kotrlik and Higgins (2001)
In determining the appropriate sample size for this study, the Barlett et. al. model was used as
earlier stated. The research sought to define the sample of Microfinance Banks in such a way that
at least 95% level of confidence could be obtained and the probable error of using the sample
would not exceed 0.05. The sample size of Microfinance Banks used was determined from a
population of 169 Microfinance Banks that have obtained final licence to operate.
According to the Barlett et al (2001) model, the appropriate sample size for a population of one
hundred and sixty nine (169) Microfinance Banks across the six States is one hundred and six
(106). The 106 sample size was determined taking the average of (80 + 132)/2 = 106 from the
minimum returned sample Table for categorical data (see Table 3.7). Since the researcher’s
interest is in the population of the MSEs Operators’ who are Microfinance Banks’ clients,
preliminary estimation (see Table 3.6 above) showed a rough estimate of two hundred and fifty
seven thousand, nine hundred and fifty one (257,951) MSEs operators, users of Microfinance
Banks. Consequently an appropriate sample size of six hundred and twenty three (623) was
selected based on Barlett et al’s model which is the height of the Table. An average of six copies
of questionnaire was distributed in 106 Microfinance Banks across the six States in South-West
Nigeria. Some of the questionnaire was administered personally by the researcher and others
through researcher assistants.
3.8 Distribution of Questionnaires and Response rate
A total of six hundred and twenty-three (623) copies of the questionnaire were administered
across the six States in the South-West covered by the study. The basis of distribution of the
copies of the questionnaire was based on the CBN records of March 2009, which provides useful
insights into the geographical spread of Microfinance Banks (MFBs) across the South-West of
Nigeria with particular reference to Microfinance Banks that operate within the ambit of the law
that governs their operations. The records also show that there were 169 Microfinance Banks
with a final licence operating in South-West geopolitical zone. The details of the questionnaire
distribution and response rate are shown in Table 3.8 below.
81

Table 3.8 Questionnaire Distribution / Response Rate of Micro & Small Enterprise
Operator
I II III IV VStates in South West Zone
Micro-finance Banks with final license I
Percentage of Spread (%)
No. of Questionnaire distributed
No. of questionnaires returned
Rate of Response(%)
Lagos 74 44 274 219 38.5
Ogun 29 17 106 83 13.8
Oyo 26 16 96 84 13.7
Osun 24 14 88 63 10.5
Ekiti 7 4 26 23 4.0
Ondo 9 5 33 30 5.0
Total 169 100 623 502 85.5Source: Researcher’s Analysis of Field Survey, 2009
As mentioned earlier, Table 3.8 shows the questionnaire distribution and response rate across the
six States in the South-West geopolitical zone. A total of 274 copies of the questionnaire,
representing 44% of the total sample size were administered in Lagos State. In Ogun State, a
total of 106 copies of the questionnaire were distributed, representing 17% of the sample size. In
Oyo 96 (representing 15%) were distributed, in Osun State, 88 copies of the questionnaire were
distributed representing 14% of the total sample. In Ekiti and Ondo States 26 and 33 copies of
questionnaire were distributed respectively, representing 4% and 5% respectively of the total
sample size.
82

According to Saunders, Thornhill, & Lewis (2007), there are two methods of calculating a
response rate: one is total number of responses divided by total number in the sample minus
ineligible; the other active response rate, is total number of responses divided by the total number
in the sample minus ineligible plus unreachable. Method one was used in this study. Out of the
274 copies of the questionnaire distributed in Lagos area, 219 copies were adequately completed
and returned. This represents 38.5% response rate. In Ogun State, 83 copies of the questionnaire
were returned and that represents 13.8% response rate. In Oyo, Osun and Ekiti States, 84, 63 and
23 copies of the questionnaire were adequately completed and returned; these represent 13.7,
10.5, and 4 percent response rate respectively. In Ondo State, 30 copies of the questionnaire were
returned out of the 33 administered representing 5% response return rate. In all, a total of 502
copies of the questionnaire were returned from the six States out of 623 copies administered.
This represents a total response rate of 80.5%. The high return rate achieved from the field
survey can be attributed to the support received from the loan/field officers in the banks visited.
A total of 106 Microfinance Banks were used for the study and the copies of questionnaire were
distributed at an average of six (6) copies of questionnaire per Bank.
3.9 Sources of Data Collection
This study combined secondary and primary data. The primary data were sourced through a well
structured questionnaire. The researcher utilized a questionnaire to obtain information needed on
microfinance and small business survival, growth and performance. Interview sessions were also
scheduled with some of the Banks visited to document the process, nature and mode of operation
of microfinancing in Nigeria. The secondary data were obtained from the Microfinance Bank
records through clients’ membership cards. The membership card is a record of client’s loan
history and savings progression as well as his/her enterprise and welfare performance.
3. 10 Data collection Method
There are three stages of data collection for this study. The first step involves data collection
through the use of a well-structured questionnaire. The result was used to answer research
questions and test relevant hypotheses. For this study a well-structured questionnaire and in-
depth interview was used. A structured questionnaire gives the respondent a number of
alternative options from which he/she chooses the one closest to his/her view, or requires the
83

respondent to fill in the actual figure(s) related to the question asked. The essence of the study
was explained to the respondents through the loan officers so as to elicit the respondents’ sincere
response. The secondary data was sourced from the bank records through the clients’
membership cards kept with the Bank. Information on Client progress record on savings and loan
obtained as well as the enterprise progress was obtained from the membership card. The co-
operation of the loan officers was sought to achieve this.
3.11 Data Collection Instruments
Several data collection methods considered for this study include participatory observation, in-
depth interviews, postal surveys, telephone surveys and a well-structured questionnaire. A well
structured questionnaire and in-depth interviews were considered as the most appropriate data
collection instruments for this study. However, it was not possible for the researcher to meet the
623 respondents considered for the study, the assistance of clients’ loan officers was sought. The
service of research assistants was employed and they worked with the loan officers for maximum
co-operation. The questionnaire ensured that questions posed to all respondents are uniformly
phrased, so as to allow objective comparisons of results obtained.
3.11.1 The questionnaire
The questionnaire was structured to elicit information on the impact of the financing method on
business/enterprise survival, growth and performance. The questionnaire is a combination of
closed and open-ended questions. The open-ended questions permitted the respondents to give
detailed answers, most of them being actual figures. With the assistance of the loan officers we
ensured the validity of the information obtained. The questionnaire was divided into five
sections. Section one deals with personal data and socio -economic characteristics of the business
enterprise. Section two dwells on the impact of microfinancing on small business survival. The
questions asked covered macroeconomic variables, internal efficiency variable, microfinance
variables and social capital variables. Response on questions such as ability to invest from profit
generated from the business, ability to make profit, number of managerial trainings attended,
access to micro credit, and regular participation in microfinance were obtained from the
84

respondents in this section. Other questions covered regular contact with loan officer and
perception of microfinance on business. Section three looks at expansion capacity of microloan
on enterprise growth measured by small business growth. Section four looks at the impact of
microfinance on the entrepreneur’s productivity and Section five of the questionnaire was on the
impact of non-financing services on business performance.
3.11.2 Pre–testing of Instrument
A pilot study was conducted to test-run the practicability of the study and to detect flaws in the
data collection process. This helped to discover errors on the issues raised such as ambiguous
instruction or wording, inadequate time limit and measurability of variables defined. Copies of
the questionnaire were given to senior colleagues, colleagues, statisticians and loan officers
before the pilot study. The views of the loan officers were considered very important because
they work with the entrepreneurs and they understand their level of perception on the subject
matter. Fifty copies of the questionnaire were used for the pilot study.
3.12 Method of Data Analysis
The data generated for the study were analyzed using both descriptive and inferential analytical
techniques. The analytical techniques employed are basically two: Survival Analysis and
multiple regression analysis using the ordinary least square (OLS) approach. The survival
analysis incorporated Cox Regression Analysis and Kaplan Meier Survival Analysis technique.
The adequacy of the fitted model was assessed using the likelihood ratio test. Analyses were
done using SPSS statistical package version 15.1. The duration of survival was measured for
each of the MSEs in the study using the past five years’ records and financing method as
treatment control. The model employed in Kauffman and Wang (2003) and Bekele and Zeleke
(2008) were adapted, while a Survival Analysis technique was used to determine the factors
responsible for survival of MFB-financed MSEs in Nigeria. The data comprises of secondary
data obtained from the banks records and primary data obtained from field survey of 623 MSEs
in South West Nigeria. The period covered for the study is 2004 to 2008. Eight explanatory
variables were used, drawn from the four categories of factors affecting small business survival
identified in literature. The variables were analyzed to know their level of influence, strength and
85

significance on small business survival. Survival analysis (SA) technique was chosen as the main
analytical technique for this study because:
1. SA techniques are more sophisticated and relevant than the traditional popular techniques of
discriminant analysis (DA) and logit analysis (LA). Except for sequential cumulative sum
(CUSUM) procedures, SA is the only well-known technique that incorporates historical (or
longitudinal) nature of Business Failure Prediction (BFP) data into its model. Thus, SA does
not assume that the failure process remains stable over time. All other cross sectional models
are only valid if the underlying failure process remains stable over time, which is a problem
as the steady failure process assumption is usually violated in the real world (Laitinen and
Luoma, 1991). This fundamental difference between the time-series SA models and cross-
sectional traditional models also makes empirical comparisons between the techniques
difficult. For example, a single SA model can make predictions of varying length; however, a
single DA model can only make predictions of a fixed length based on its training data.
Therefore, a single SA model is usually compared with many traditional models. This is an
advantage in itself as one SA model is clearly more powerful in making different predictions
than one traditional model.
2. The built-in time factor in SA models allows for time dependent explanatory variables.
Zavgren (1985) found that in BFP the signs of the explanatory variable coefficients may
change in different years before failure. Laitinen and Luoma (1991) went further and added
that the values of the coefficients may also change relative to time before failure. Thus, an
advantage of SA is the capability to model these changes, which cannot be done with cross
sectional models. Therefore, SA models appear to be more suited to modelling a dynamic
process, such as business failure, than cross sectional models. This also means that
theoretically, the predictive accuracy of SA models should be greater than that of both DA
and LA.
3. Almost all well-known approaches assume that the data (businesses) come from two distinct
populations, which are those either going to succeed or fail. SA models do not make this
assumption, but rather assume that all businesses come from the same population
distribution. In SA models, the successful businesses are distinguished by treating them as
86

censored data, which indicates that their time of failure is not yet known. This assumption
models more accurately the real world (Laitinen and Luoma, 1991).
4. SA models can also deal with the delayed entry and early exit of businesses from a study,
which is likely to happen in studies of business failure.
5. SA does not make any of the restrictive distribution assumptions inherent in DA and LA,
such as linearity. The semi-parametric and parametric SA models make some distribution
assumptions, but they are less commonly violated.
6. In addition to the easily interpretable probability of success or failure, SA models also
produce the interpretable hazard function that is not available in other techniques. Analysis of
the hazard rate can aid understanding of any process of death or failure (Harrell, 2001). Thus,
SA is able to provide more information than other techniques, which is a significant
component of any good model (Chatfield, 1995).
7. The SA technique uses standard forward and backward variable selection procedure which
helps to deal with issues of multicollinearity, particularly the Cox model.
8. SA is designed to focus on determining the effects of explanatory variables on the life of
businesses, rather than to predict outcomes such as the failure of businesses. The implication
of this is that obtaining predictions from SA models is more difficult than anticipated.
Each of these techniques is discussed below.
3.12.1 Survival Analysis (SA)
Survival Analysis examines and models the time it takes for a certain event to occur. An example
of such an event is death, from which the name ‘survival analysis’ and much of its terminology is
derived, but the ambit of application of survival analysis is much broader. Survival analysis
focuses on the distribution of survival times. The survival model examines the relationship
between survival and one or more predictors, usually termed covariates in the survival analysis
literature. The SA approach to Business Failure Prediction (BFP) is fundamentally different from
87

the other approaches of BFP. While other techniques model BFP as a classification problem, SA
models BFP as a timeline, where businesses are represented by lifetime distributions. Lifetime
distributions are distributions with a non-negative random variable that represents the lifetimes
of individuals (or businesses) in some population. Lifetime distributions can be characterized by
a number of descriptor functions, the most common being the survival or hazard function. The
survival function S(t) represents the probability that a business will survive past a certain time t,
while the hazard function h(t) represents the instantaneous rate of failure at a certain time t. The
interpretations of these two functions are very different, but either one can be derived from the
other.
There are many different SA techniques available to estimate the survival and hazard descriptor
functions. These techniques use past data to calculate the functions at each specific time, but
some do not have the ability to make future predictions. Thus, they can be used to analyze past
failure to help further the understanding of the failure process. The most popular of these is a
non-parametric technique known as the Product-Limit, or Kaplan-Meier, estimator. In addition to
these techniques, there are also different SA models that define relationships between one of the
descriptor functions (usually the survival or hazard function) and the set of explanatory variables.
These models can also be used for prediction and are estimated using regression. In this study,
the survival analysis was used to estimate the survival probability of MSEs across category of
firms and different sectors of the economy. It was also used to estimate the hazard ratio of
predictor variables to small business survival.
3.12.2 Regression Based Estimation
The basic difference between various SA models is the assumptions about the relationship
between the hazard (or survival) function and the set (vector) of explanatory variables (X). Thus,
the general regression formula is written as Log h0(t) = α+β1xi1+β2xi2 +…+βKxik ………(1)
Where, i is a subscript for observation, X’s are the covariates, α is a constant that represents the
log baseline and Log h0(t) takes a binary form, 1 if the event occurs and 0 if the event does not
occur, β = is the vector of parameters to be estimated. The predictor variables are given as X1,
X2, X3, X4, X5, X6, X7, X8; The Cox regression proportional hazard model, is the most prominent
88

model applied in the medical and business failure field due to its flexibility. The Cox
proportional hazard regression was applied in this study.
3.12.3 Methods for Empirical Analysis
Since the aim of this aspect of the study is to see the impact of microfinance on survival and
viability of MSEs in Nigeria, analysis was done using two methods: First, we performed a
semi-parametric survival analysis using a proportional hazards model. And two, we used
nonparametric techniques to estimate the survival estimate for the businesses and compare the
results with those of the semi-parametric analysis.
Semi parametric Analysis. We used the Cox (1972, 1975) proportional hazards model to
analyze the MSEs survival data obtained similar to the methodology applied in Kauffman and
Wang (2001, 2003) and Bekele and Zekele (2008). We estimated both a hazard model based on
the four categories of factors influencing small business survival identified in the literature and a
hazard model based on the historical data obtained from the Microfinance Banks records.
In the analysis of firm survival, we can observe the failure time of a firm, or its continued
existence. Thus, a firm in our sample will still be at risk at time t if its survival time or the
censored time is greater than or equal to t.
The Cox model assumes the following functional form for the hazard function:
Log h0(t) = α+β1xi1+β2xi2 +…+βKxik (2)
In Equation 2, h0 (t) is the unknown baseline hazard function and ß is a vector of parameters to
be estimated. This expression enables us to capture the baseline hazard rate as a result of the
method of financing via h0 (t), and the impact of other factors that vary across firms through their
vector of time-varying covariates, X, via the estimated parameters, ß.
Based on this hazard function, the corresponding survival function is given as:
S(t , x, b ) [So (t)]exp(xβ) (3)
89

In Equation 3, S0 (t) {0,1} is the baseline survival function. This expression represents the
likelihood that a firm will continue to be in existence at time t, in view of the baseline rate of
survival among observed firms and other economic variables, firm and financing method
characteristics that also vary over time will be examined, given that it has been in operation
continuously in prior periods.
For a firm i that is still at risk at time ti, its likelihood of failure at time ti compared to other firms
that are at risk at time ti is given as
(4)
In equation 4, R(ti ) is set of all firms that are still at risk at time ti . For a data set that contains n firms, the partial likelihood is given by
(5)
In Equation 5, ci is 1 if the observation is not censored and 0 if the observation is censored.
Using this partial likelihood function, the parameters can be estimated without specifying the
baseline hazard function.
Non-Parametric Analysis. In addition to the Cox regression, a Kaplan-Meier model was used to
perform a descriptive analysis. The Kaplan-Meier estimator is defined as:
where ni is the number of firms that are still at risk at time ti and di is the number of firms that
actually failed at time ti. The Kaplan-Meier estimator provides a reading on the likelihood of
survival at time t based on the survival history of all firms. Using results from the semi-
parametric analysis, we stratify the data set into different subgroups such as microenterprise and
small enterprise and different sectors of the economy covered in the study and calculate the
Kaplan-Meier estimator for each group. We then use standard statistical tests to compare the
differences among the groups and compare the results with our regression results from the
proportional hazards models.
90

3.12.4 Multiple Regression Analysis
The evaluation of the relationship between dependent and independent variables was performed
using the multiple regression technique. The first step consisted of defining the variables of
interest. In this study, small business growth proxied by annual sales growth rate over the five
years is the dependent variable (SBG) and key predictors of MSEs’ expansion and growth are the
independent variables. The independent variables are divided into three different categories
consisting of owners’ characteristic variables, firm characteristics variables and microfinance
variables. The owners’ characteristic variables consist of variables such as, owners’ age, owners’
level of education, owners’ marital status and gender. The firm characteristic variables consist of
business age, form of business, business size, business location, and business registration, while
the microfinance characteristics variables consist of size of technology/asset/equipment loan
received, technology related training received, asset loan duration, Asset Loan repayment and
loan utilization. The variables are: EAge1, EE2, MS3, EG4, Bizage5, Bizform6, Bizsize7, Bizloc8,
Bizreg9, ALS10, ALD11, ALR12, LU13, TT14. In this case, small business growth was regressed on
the set of explanatory variables that predicted MSEs growth as it relates to microfinance. The
coefficient of the variables measures the marginal effects of the independent variables on small
business growth measured by annual sales growth in this aspect of the study. The general form
for the model in the work is given as:
SBG = f (X1….Xn)………………………….(6)
Where,
SBG = dependent variable is a measure of small business growth;
f = a function to be specified
X = a vector of explanatory variables of microfinance characteristics that pertain to business
growth
In specific form, equation 6 translates into equation 7 thus:
SBG = a + b1X1 + b2X2 + b3X3 +………, + bnXn + e…………………………(7)
Where,
SBG = dependent variable (small business growth)
a = constant
x1, x2, x3,…,…,…,…,xn are independent variables (Entrepreneurs’ age, Entrepreneurs’ level of
education, Marital Status, Gender, Business age, Form of business, Business size, Business
91

location, business registration, size of asset loan received, duration of asset loan, repayment of
asset loan, loan utilization, technology related training received by the entrepreneur).
b1, b2, b3, …, …, …, …, bn are regression coefficients which determine the contribution of the
independent variables
e = residual or stochastic term (which reveals the strength of b1x1 … bnxn; if e is low, this implies
that the amount of unexplained factors is low, then the residual R and R2 will be high and vice
versa.
Multiple Regression Analysis II – Entrepreneurs productivity
The general form for the model is:
EPr = f (X1….Xn)………………………….(8)
Where,
EPr = is the dependent variable, Entrepreneur productivity. Productivity is measured by output
over resource input. ‘Sales’ is used as proxy for output while input is taken as the sum of cost of
capital at time t, rent at time t, cost of machine maintenance at time t, cost of electricity and other
utilities at time t.
f = a function to be specified
X = explanatory variables of key predictor of Entrepreneur’s productivity included are EAge1,
EE2, HW3, BE4, ET5, Bizform6, Bizsize7, Bizloc8, Bizreg9, LI10, ML11, CWL12, WM13, WR14
Where EAge1 = Entrepreneur Age, EE2 = Entrepreneur’s Education, HW3 = Hours Worked per
day, BE4= Business Experience, ET5 = Entrepreneurial Training, Bizform6 = Business form,
Bizsize7= Business Size, Bizloc8= Business location, Biz reg9 = Business registration, LI10 =
Loan Interest, ML11 = Microloan received by Entrepreneur, CWL12 = Contact with Lender
WM13 = Weekly Meetings, WR14 = Weekly Repayment.
In specific form, equation 8 translates into equation 9
EPr = a + b1X1 + b2X2 + b3X3 +………, + bnXn + e …………………………(9)
Where,
EPr = dependent variable (Entrepreneur productivity)
a = constant
92

x1, x2, x3,…,…,…,…,xn(EAge1, EE2, HW3, BE4, ET5, Bizform6, Bizsize7, Bizloc8, Bizreg9, LI10,
ML11, CWL12, WM13, WR14 . Where EAge1 = Entrepreneur Age, EE2 = Entrepreneur Education,
HW3 = Hours Worked per day, BE4= Business Experience, ET5 = Entrepreneurial Training,
Bizform6 = Business form, Bizsize7= Business Size, Bizloc8= Business location, Biz reg9 =
Business registration, LI10 = Loan Interest, ML11 = Microloan received by Entrepreneur, CWL12
= Contact with lender , WM13 = Weekly Meetings, WR14 = Weekly Repayment).
Multiple Regression Analysis III - Non financial services effects on small business
performance
The most general form for the model is adopted:
SBP = f (X1….Xn)………………………….(10)
Where,
SBP = dependent variables measuring MSE performance proxied by gross profit margin. Gross
profit margin is defined as gross profit over sales multipled by 100 (Pandey, 1987).
f = a function to be specified
X = explanatory variables of key predictor of MMSEs performance, inclusive are microfinance
banks non financial service variables measured as in specific as;
In specific form, equation 10 translates into equation 11
SBP = a + b1X1 + b2X2 + b3X3 +………, + bnXn + e …………………(11)
Where,
SBP = dependent variable (gross profit margin)
a = constant
x1, x2, x3,…,…,…,…,xn (EAge1, EE2, EG3, TE4, Bizage5, Bizform6, Bizsize7, Bizloc8, Bizreg9,
AS10, PT11, GM12 , CG13, NW14. Where; EAge1 = Entrepreneur Age , EE2 = Entrepreneur
Education, EG3 = Entrepreneur Gender, TE4= Training Experience, Bizage5 = Business Age,
Bizform6 = Business form, Bizsize7= Business Size, Bizloc8= Business location, Biz reg9 =
Business registration, AS10 = Advisory Service, PT11 = Pre-loan Training, GM 12= Group
Membership, CG13 = Cross Guaranteeship, NM14 = Networking Meetings).
3.13 Model Specification
93

The model specification used in this study was based on the hypotheses of the study. This
statistical model is presented below to examine the extent to which microfinance facilities have
enhanced small and micro enterprise (MSEs) survival in Nigeria. The model was adapted from
the work of Bekele and Zeleke (2008) who identified six key predictors of small business
survival as follows: (1) ability to convert profit to investment, (2) past bankruptcy, (3) level of
education, (4) participation in microfinance, (5) ability to make profit and (6) managerial ability.
Consequently, the first five variables were adapted as ultimate predictors of business survival,
together with ease of access to microcredit, regular contact with loan officers, and mandatory
savings, while past bankruptcy was excluded.
The study uses the survival analysis technique which examines the relationship of the survival
distribution to covariates. It entails the specification of a linear–like model for the log hazard.
Kauffman and Wang (2001, 2003) specified the Cox survival model using industry specific
characteristics, firm specific characteristics and e-commerce specific characteristics as the
covariates in a model presented as follows:-
Log h0(t) = α+β1xi1(t)+β2xi2
(t) +…+βKxik ………………………………………..(12)
Where
X takes the form of X1….X12. The same model was adopted in this study with a little
modification to include financing method as part of the covariate removing e-commerce variable.
Hence it was specified as follows:
Log h0(t) = α(t)+β1Xi1+β2Xi2 + β3Xi3 +β4Xi4+β5Xi5+β6Xi6+β7Xi7+β8Xi8+u1 …………(13)
Where
i is a subscript for observation
Xs’ are the covariates
α is a constant that represents the log baseline and
Log h0(t) takes a binary form, 1 if death occurs and 0 if death does not occur
β = is the vector of parameters to be estimated.
The predictor variables are given as X1, X2, X3, X4, X5, X6, X7, and X8;
Where
X1, = Regular participation in Microfinance,
X2, = Ability to convert profits into investment,
94

X3, = Ability to make profit,
X4, = Entrepreneur level of education,
X5 = Technical capacity,
X6 = Contact with loan officer,
X7 = Access to microcredit
X8 = Mandatory micro savings
and U1 = Error term
A priori, β1 > 0; β2 > 0; β3 > 0; β4 > 0; β5 > 0; β6> 0; β7 > 0, β8 > 0
Table 3.9 Measurement of Variables - Hypothesis 1.
Hypothesis 1
S/N Variables Measurement Expected
Sign on
impact
Apriori
Firm survival S0(t) –
Dependent variable
Hazard ratio h0(t) takes a binary form 1 is
assigned if the firm is in-active during the
course of the study and 0 is assigned if the firm
is active and performing.
Independent Variables
1. Regular participation in
microfinance
likert scale coding of 1 to five of strongly
disagree to strongly agree.
+ β1 > 0
2. Easy access to microcredit likert scale coding of 1 to five of strongly
disagree to strongly agree.
+ Β2 > 0
3. Mandatory savings Yes or no, 1is assigned if savings is mandatory,
0 is assigned if savings is not mandatory.
+ Β3 > 0
4. Ability to convert profit to
investment
likert scale coding of 1 to five of strongly
disagree to strongly agree.
+ Β4 > 0
5. Ability to make profit likert scale coding of 1 to five of strongly
disagree to strongly agree.
+ Β5 > 0
6. Regular contact with
lender
likert scale coding of 1 to five of strongly
disagree to strongly agree.
+ Β6 > 0
95

7. Technical Efficiency likert scale coding of 1 to five of strongly
disagree to strongly agree.
+ Β7 > 0
8. Entrepreneurs education 0 if no formal education and 1 was assigned to
primary education completed, if not
completed 0, and 2 for secondary education
completed, 1 if not completed. The value of 3
was given to OND and NCE completed, value
of 4 assigned to HND/B.Sc completed and
value of 5 given to above B.Sc.
+ Β8 > 0
Source: Author’s compilation, 2009
Hypothesis 2
2. The second hypothesis was structured to ascertain the impact of microfinance on MSE
growth. This was expressed as:
SBG = f (OX, FX, MFX).................................................... (14)
SBG = Small Business Growth
OX = Owner’s characteristic variables (Entrepreneurs age, Entrepreneurs Education, Marital
Status, Entrepreneurs Gender)
FX = Firm Characteristic variables (Business age, Business Formation, Business size, Business
location, Business register)
MFX = Microfinance characteristic variables (Asset Loan Size received from Microfinance
Bank, Asset Loan Duration, Asset Loan Repayment, Loan Utilization, No. Technology Training
received by entrepreneur or his staff in the last year)
Hence the equation is re – written as:
SBG = αo+α1EAge1+ α2EE2+ α3MS3+α4EG4+α5Bizage5+α6Bizform6+α7Bizsize7 +α8Bizloc8+
α9Bizreg9+α10ALS10+α11ALD11+α12ALR12 + α13 LU13 + α14 TT14 = µ1…. …………(15)
SBG = Small Business Growth (SBG) proxied by annual sales growth rate over the five years of
study Expansion of SME proxied by annual sales growth rate over the five years of study is
defined as Gr = {(St/S0)1/n – 1} x 100 where St is the current sales level, So is the base year 2004,
n is the number of years considered for study while Gr is the annual rate of growth (Niskanen
and Niskanen, 2007).
96

Key predictor of MSEs growth is given as
EAge1 = Entrepreneur Age, EE2 = Entrepreneur Education, MS3 = Marital Status, EG4=
Entrepreneur Gender, Bizage5 = Business Age, Bizform6 = Business form, Bizsize7= Business
Size, Bizloc8= Business location, Biz reg9 = Business registration, ALS10 = Asset Loan Size
received from Microfinance Bank, ALD11, = Asset Loan Duration, ALR12 = Asset Loan
Repayment, LU13 = Loan Utilization, TT14 = No. Technology Training received by entrepreneur
or his staff in the last year, U1 = Error term.
A priori,; α1 < 0; α2 > 0; α3< 0…. α6 < 0, α7>0, α8<0, α9>0…..α14 > 0
Table 3.10 Measurement of Variables – Hypothesis 2
S/N Variable Measurement Expected Sign on impact
Apriori
SBG = Small Business Growth. Dependent Variable
Proxy sales growth rate over five years period. = {(St/S0)1/n – 1} x 100 where St is the current sales level, So is the base year 2004, n is the number of years considered for study while Gr is the annual rate of growth
Independent Variables Owner’s Characteristics Variables
1. Owners Age actual age at last birthday + α1 > 0, α1 < 02. Owner’s education 0 if no formal education and 1 was
assigned to primary education completed, if not completed 0, and 2 for secondary education completed, 1 if not completed. The value of 3 was given to OND and NCE completed, value of 4 assigned to HND/B.Sc completed and value of 5 given to above B.Sc.
+ α2 > 0
3. Marital Status Dummy variable; Single 1; 0 = otherwise married = 1;0 = otherwise, divorced 1; 0 = otherwise, Seperated 1; 0 = otherwise, widowed 1; 0 = otherwise
+ α3 > 0, α3 < 0
4. Gender Dummy variable; Male 1; 0 = otherwise, Female 1; 0 = otherwise
+ α4 > 0, α4 < 0
5.Firm Characteristics variablesFirm age
actual business age-
α5 < 06. Form of Business Dummy variable; Sole proprietorship 1; 0
= otherwise + α6 > 0, α6 < 0
97

7. Firm size Current number of employees + α7 > 08. Business location 1 was assigned for urban area because of
accessibility to microfinance banks, 0 is assigned for rural area.
+ α8 > 0, α8 < 0
9 Business registration 1 was assigned for registered business, 0 assigned for unregistered business.
+ α9 > 0,
Microfinance Characteristic 10. Size of asset loan actual amount received over the five
year period is taken.+ α10 > 0,
11. Duration of Asset loan actual number of months loan was taken. + α11 > 012. Repayment of asset loan A likert scale measure was assigned to
repayment of asset loan.+ α12 > 0
13. Loan utilization 1 was assigned if loan was used for the purpose of the business,0 was assigned if otherwise
+ α13 > 0
14. Technology training received actual number of technology related trainings attended by the entrepreneur
+ α14 > 0
Source: Author’s compilation, 2009
Hypothesis 3
3. To ascertain the impact of micro-financing on Entrepreneur’s productivity. Fasoranti et al.
(2006) examined the impact of microcredit and training on productivity of small scale
entrepreneurs. The model was adapted in our model with some amendments as follows:
EPr = f (OX, FX, MFX).................................................... (16)
EPr = Entrepreneur’s Productivity
OX = Owner’s characteristic variables (Entrepreneurs age, Entrepreneurs Education, Hours
work per day, Business Experience, Entrepreneurial training)
FX = Firm Characteristic variables (Form of Business, Business size, Business location,
Business registration)
MFX = Microfinance characteristic variables (Loan interest, Micro loan received, Contact with
lender, Weekly Meetings, Weekly repayment)
Hence the equation is re – written as:
EPr = λo+λ1EAge1+λ2EE2+λ3HW3+λ4BE4+λ5ET5+λ6Bizform6+λ7Bizsize7+λ8Bizloc8+
λ9Bizreg9+λ10LI10+λ11ML11+λ12CWL12 + λ13WM13 +λ14WR14+ u1 …. …………(17)
EPr = Entrepreneur’s Productivity (dependent variable). Productivity is measured as output value
(sales value) over resource input value. Resource input here is measured as cost of capital at time
98

t, wages and salary paid at time t, rent paid at time t, electricity paid at time t, and cost of
machine maintenance at time t (Otokiti, 2002).
a = constant
The independent variables which are key predictors of MSE productivity are given as;
EAge1, EE2, HW3, BE4, ET5, Bizform6, Bizsize7, Bizloc8, Bizreg9, LI10, ML11, CWL12, WM13, WR14.
Where;
EAge1 = Entrepreneur Age,
EE2 = Entrepreneur Education,
HW3 = Hours Worked per day
BE4= Business Experience,
ET5 = Entrepreneur Training,
Bizform6 = Business form
Bizsize7= Business Size,
Bizloc8= Business location,
Biz reg9 = Business registration
LI10 = Loan Interest,
ML11 = Microloan received by Entrepreneur,
CWL12 = Contact with lender
WM13 = Weekly Meetings,
WR14 = Weekly Repayment,
U1 = Error term
A priori,; λ1 < 0; λ2 > 0; λ3< 0; λ4> 0; λ5 < 0; λ6< 0, λ7>0, λ8<0, λ9>0, λ10<0 λ11>0…..λ14 > 0
99

Table 3.11 Measurement of Variable – Hypothesis 3
S/N Variables Measurement Expected Sign on impact
Apriori
EPr = Entrepreneur’s Productivity – Dependent Variable
Entrepreneur productivity is defined as output over resource input. Output is measured as sales at time t, while resource input is measured as cost of capital at time t, wages and salary paid at time t, rent paid at time t, electricity paid at time t, and cost of machine maintenance at time t.
1. Entrepreneur’s Age Actual Age - λ1< 02. Owner’s education 0 if no formal education and 1 was
assigned to primary education completed, if not completed 0, and 2 for secondary education completed, 1 if not completed. The value of 3 was given to OND and NCE completed, value of 4 assigned to HND/B.Sc completed and value of 5 given to above B.Sc.
+ λ2> 0
3. Hours work per day Actual number of hours work per day - λ3< 04. Business experience actual number of years in business was
obtained.+ λ4<>0
5. Entrepreneurial training number of times such training was received by the entrepreneur in the last five years was obtained.
+ λ5>0
6. Form of Business Dummy variable; Sole proprietorship 1; 0 = otherwise
+ λ 6 > 0, λ 6 < 0
7. Business Size Current number of employees + λ 7 > 08. Business location 1 is assigned for urban area because of + λ 8 > 0, λ 8 <
100

accessibility to microfinance banks, 0 is assigned for rural area.
0
9. Business registration 1 was assigned for registered business, 0 assigned for unregistered business.
+ λ 9 > 0,
10. Loan Interest likert scale coding of 1 to five of strongly disagree to strongly agree.
- λ 10 < 0
11. Micro loan received actual figures obtained + λ 11 > 012. Contact with Lender likert scale coding of 1 to five of strongly
disagree to strongly agree.+ λ 12 > 0
13. Weekly meetings likert scale coding of 1 to five of strongly disagree to strongly agree.
+ λ 13 > 0
14. Weekly repayment likert scale coding of 1 to five of strongly disagree to strongly agree.
+ λ 14 > 0
Source: Author’s compilation, 2009
Hypothesis 4
4. To measure the impact of non-financial services of microfinancing institutions on MSEs
performance. Karlan and Valdivia (2006) examined the impact of business training on
microfinance Clients and Institutions. The model used in that study was adopted with
modification as follows:
SBP = f (OX, FX, MFX).................................................... (18)
SBP = Small Business Performance
OX = Owner’s characteristic variables (Entrepreneurs age, Entrepreneurs Education, Marital
Status and training Experience)
FX = Firm Characteristic variables (Business age, Form of Business, Business size, Business
location)
MFX = Microfinance characteristic variables (Advisory Services, Pre-loan training, Group
membership, Cross guaranteeship, Networking Meetings)
Hence the equation is re – written as: α
SBP = δ o+ δ 1EAge1+ δ 2EE2+ δ 3EG3+ δ 4TE4+ δ 5Bizage5+ δ 6Bizform6+ δ 7Bizsize7+ δ
8Bizloc8+ δ 9AS9+ δ 10PT10 + δ 11GM11 + δ 12CG12+ δ 13NW13+U1 …………………………(19)
Where;
101

SBP is proxied by gross profit margin. Gross profit margin is defined as gross profit over sales
multipled by 100 (Pandey, 1987). Gross Profit itself is total sales minus cost of goods sold.
The independent variables are MFBs non-financial services such as Advisory service, pre-loan
training as listed below:
Where;
EAge1 = Entrepreneur Age, EE2 = Entrepreneur Education, EG3 = Entrepreneur Gender
TE4= Training Experience, Bizage5 = Business Age, Bizform6 = Business form
Bizsize7= Business Size, Bizloc8= Business location, AS10 = Advisory Service
PT11 = Pre-loan Training, GM 12= Group Membership, CG13 = Cross Guaranteeship
NM14 = Networking Meetings
U1 = Error term
A priori δ1 < 0; δ 2 > 0; δ 3< 0; δ 4> 0; δ 5 > 0; δ 6< 0, δ 7>0, δ 8<0, δ 9>0, ….. δ 13 > 0
Table 3.12 Measurement of Variable – Hypothesis 4S/N Variable Measurement Expected
Sign on impact
Apriori
SBP – Small Business Performance – Dependent variable
Gross profit margin was used as proxy for small business performance. It is calculated as gross profit divided by sales multiplied by 100. Actual figure on profit for the immediate past financial year was obtained divided by total sales in the same year multiplied by 100.
Independent Variables are:
1. Owners Age actual age at last birthday + δ1 > 0, 1 δ < 02. Owner’s education 0 if no formal education and 1 was assigned to
primary education completed, if not completed 0, and 2 for secondary education completed, 1 if not completed. The value of 3 was given to OND and NCE completed, value of 4 assigned to HND/B.Sc completed and value of 5 given to above B.Sc.
+ δ 2 > 0
3. Marital Status Dummy variable; Single 1; 0 = otherwise married = 1;0 = otherwise, divorced 1; 0 = otherwise, Seperated 1; 0 = otherwise, widowed 1; 0 = otherwise
+ δ 3 > 0, δ 3 < 0
4. Training experience likert scale coding of 1 to five of strongly disagree to strongly agree.
+ δ 4 > 0
5. Business age actual business age + δ5> 06. Form of business Dummy variable; Sole proprietorship 1; 0 =
otherwise+ δ 6 > 0, δ 6 <
07. Business size Current number of employees + δ 7 > 08. Business location 1 is assigned for urban area because of accessibility
to microfinance banks, 0 is assigned for rural area.+ δ 8 > 0, δ 8 <
0
102

9. Advisory services 1 was assigned if advisory services given were considered to have significant impact on business performance as perceived by the entrepreneur and 0 was assigned if otherwise.
+ δ 9 > 0
10. Pre-loan training 1 was assigned if pre loan training was given, and 0 if otherwise
+ δ 10 > 0
11. Group membership 1 was assigned if membership of a group is mandatory before loan was obtained, and 0 if otherwise,
+ δ 11 > 0
12. Cross guaranteeship 1 was assigned if cross guarantee was pre-requisite for loan and 0 was assigned if otherwise.
+ δ 12 > 0
13. Networking meetings 1 was assigned if advisory services given was considered to have significant impact on business performance as perceived by the entrepreneur and 0 was assigned if otherwise.
+ δ13> 0
Source: Authour’s compilation, 2009
3.14 Theoretical Justification of Variables Used in Study
Hypothesis 1 – Small Business Survival and Microfinance
Kauffman and Wang (2003) identified industry-specific characteristics, firm-specific
characteristics and e-commerce specific characteristics (because their study is on dotcom
enterprise) as key predictor of survival rate of a firm. The industry-specific characteristics
include the rate of new firm entry, industry growth as measured by price-cost margins, and the
technological regime of the industry. Firm-specific characteristics include financial capital, cash
flow components, start-up size, post-entry firm size, founding time, insider ownership and
whether the company is an independent start-up or the online versions of existing companies. E-
commerce-specific characteristics are a critical mass of customers and the business model.
Bekele and Zeleke (2008) as cited earlier, reveals that factors affecting long-term survival and
viability of MSMEs are categorized into 4 broad categories. These he presents as (i) macro
economic factors, (ii) factors that affect access to social capital, (iii) factors that affect the
internal efficiency of small businesses and enterprises, and (iv) factors that affect access to micro
credit. The macro economic factors include variables related to economic policy that are
essential for promoting private investment in MSMEs, they are; legal and regulatory issues, the
assessment of tax, backward and forward linkages with large enterprise, access to credit, the
degree of competition at the local market and local demand for goods and services produced by
MSMEs.
103

Factors related to internal efficiency refer to business related decision made by owners/
managers, trends in net income, conversion of profit back into investment, demographic
conditions, level of education, prior business experience, managerial ability, motivation for
working in the sector, number of working hours, level of technical skill, business training
received, etc. Factors that affect access to micro credit include, availability of credit, access to
credit finance, sources and amount of initial start- up capital, terms / or conditions of loan
repayment, and the extent of effective utilization of credit. Lastly, factors that are related to
social capital include, participation in microfinance scheme, access to free family labour at work
and networking with other businesses and enterprises as a result of participation in microfinance
scheme. He applied backward stepwise procedure to eliminate “useless variables”. Six predictor
variables that emerged for the study are: ability to convert profit back into investment, regular
participation in microfinance, ability to make profit, managerial ability, and past bankruptcy,
level of education. They found the first four variables to have positive impact on firm survival,
while past bankrupty and low level of education have negative impact on firm survival. Niskanen
and Niskanen (2007) found regular contact with lender to have positive impact on business
growth in relationship banking. Mckernan (1996) found that programme participation exert a
large positive impact on self employment profit. Khan and Rahaman (2007), Mosley (2001),
Coleman (1999) and Pit and Khandker (1998, 1996) all found access to microcredit and
mandatory savings to have positive impact on both enterprise and household asset.
Hypothesis 2 – SBG and Microfinance
Niskanen and Niskanen (2007), defined as Gr = {(St/S0)1/n – 1} x 100 where St is the current
sales level, So is the base year sales value, n is the number of years considered for study while Gr
is the annual rate of growth. While some surveys show that growth is not an objective for all
small and medium sized firm, the ability of firms to grow is important, because it has been
suggested that firms with low or negative growth rates are more likely to fail Philips and
Kirchhoff, 1989). Storey (1994) suggests that there are three categories of factors that influence
the growth of small firms. The first group of factors is that of the entrepreneurs’ individual
resources. These are factors that can be identified prior to the establishment of business. They
include entrepreneur’s level of education, age, gender and sometimes marital status. The second
group of factors is firm specific characteristics such as the firm’s size, age, legal form and
104

location and the third group is formed by the strategic choices made by the entrepreneur or the
owners of the firm. Ericson (1998) predict that small firm are likely to experience negative
growth and exit the market than their large counterparts. The model also predicts that risk of
business failure declines over time as firms acquire new competitive skills or as they fully
discover their innate efficiency. Bernard and Jensen (2007) find positive and statistically
significant relationship between firm age and size on firm growth and survival. Almus and
Nerglinger (1999), Davidson et al. (2002), and Wijewardena and Tibbits (1999) all find an
inverse relationship between firm age and growth suggesting that older firms grow less rapidly
than younger firms. Niskanen and Niskanen (2007) found that growth rate initially increases with
firm size but then starts to decrease after a certain level. Mcpherson (1995) found that female
owned small firms exhibited a higher risk of closure than their male counterpart. Disney Haskel
and Haden (2003), shows that being part of a group of companies enhances growth and increases
survival probability. Storey (1994), U.K firms located in rural areas can be expected expected to
grow faster than those in urban centers. Davidson et al (2002) obtains somewhat similar result
using Swedish data. Almus and Nerglinger (1999) found weak effect evidence that location
affects growth. Their findings show that firms located in densely populated areas exhibit higher
growth rate. Liedholm (2001) shows that firms located in urban and commercial areas are more
likely to survive during a given year than those located in rural areas or those being operated out
of home. Urban and commercial location is also associated with faster growth, as measured by
the number of employees hired in a given year. Harhoff et al., (1998), Almus and Nerglinger
(1999), Davidson et al. (2002), all shows that firms with limited liability grow faster than firms
with unlimited liability. Niskanen and Niskanen (2007) shows that increase in family ownership
has negative impact on firm growth while increase in management ownership has a positive
impact on growth. Orji (2006) shows that technical training has positive impact on growth.
According to him the readiness of SME to transform to small scale industry could be assess
using the following factors , investment in asset, size of asset loans, number of loans obtained, loan duration, loan utilization and changes in employment over time.
Hypothesis 3 – Entrepreneurs Productivity and Microfinance
Total productivity is measured as output value (sales value) over resource input value. Resource
input here is measured as cost of capital at time t, wages and salary paid at time t, rent paid at
105

time t, electricity paid at time t, and cost of machine maintenance at time t (Stevenson, 1999,
Plenert 2001, Otokiti, 2002). Despite methodology difference in the estimation of productivity,
the study by Fraser (2005), and Soderbom et al. (2006) provide evidence that productivity
reduces the risk of exit significantly. Pakes and Ericson (1998) relate firm survival and growth to
investment in productivity enhancing activity. Obwona (2000) shows that productivity of
tobacco growers decline gradually as numbers of hours work increase. Fasoranti et al shows
significant determinants of technical efficiencies of bakers, furniture maker and burnt brick
makers as age of operators, business experience, level of education, training experience, assess to
credit, availability of working capital and initial capital outlay. They also stress that provision of
adequate credit at favourable terms ultimately raises productivity level of small scale
entrepreneurs. Olutunla and Obamuyi (2008) shows a positive impact between profitability, bank
loan and loan interest.
Hypothesis 4 – MSE Performance and Non – financial services offered by Microfinance
Banks
Gross profit margin is defined as gross profit over sales multipled by 100 (Pandey, 1987).
Olutunla and Obamuyi specified profit as proxy for performce and states that the use of
profitability to measure performance is in line with profit or utility maximization assumptions
that are the cornerstones of many economic theories (Rantamaki- Lahtinen et al. 2007).
Makasure et al (2008), also use profit as proxy for financial performance and define profit as
profits as sales revenue minus operating costs in the 12 months prior to the survey, whle
Olutunla and Obamuyi (2008) define profit as profit before tax. Makasure et al (2008) stated that
in order to examine what factors explain firm performance, their empirical model includes
variables that reflect the standard measures used in the micro and small enterprise literature such
as characteristics of the entrepreneur, enterprise characteristics and market effects characteristics.
Enterprise characteristics variable includes Entrepreneur’s age, gender, level of education, years
of apprenticeship and religion, and enterprise characteristics as location, firm size proxy by
number of paid employee, business registration and business age, while market effect
characteristics are access to bank credit, access to personal credit, value of capital assets.
Olutunla and Obamuyi also specifies amount of bank loan obtained by firm, level of sales, age of
business and firm size, and interest rate on loan as factors that affect firms performance.
106

Ogunrinola and Alege (2007) found pre-loan training, group membership and cross
guaranteeship to have positive impact microenterprise development in Lagos state. Fasoranti et
al (2006) found well structured training to have positive impact on Entrepreneur’s level of
efficiency.
3.15 Validity of Research Instrument
The face validity of the research instrument was carried out. This was assessed by a cursory
review of the items (questions) by trained individuals in the field of microfinance. The
individuals make their judgments on whether the items are relevant. The face validity is a
qualitative measure of validity; it is not quantified with statistical methods. Of all validity
measures, the face validity is normally considered as the least scientific, because trained
individuals chosen on the basis of convenience are involved, and because this measure is
subjective and not quantifiable. To demonstrate the content validity of the research instrument,
the researcher sought the help of the experts in the field of microfinance and small business
development to ensure that the selection procedure yielded a representative sample for the study
of Microfinance Impact. In content validity, the researcher essentially checked the
operationalization against the relevant content domain for the construct. Also, criteria related
validity was performed; to measure criteria-related validity, the researcher checked the
performance of the research instrument operationalization against certain criterion. In other
words, the instrument was assessed by ensuring that its operationalizing ability was not in doubt
and the research instrument predicted what it should theoretically be able to predict. This is done
by administering the questionnaire on experienced microfinance bankers to determine if there is
a high degree of correlation between scores on the measure and customers’ perceptions on the
impact of microfinance operations on their enterprise. A high correlation of r = 0.84 provided
evidence for predictive validity. It also shows that the research instrument can predict correctly
what the researcher theoretically designed it to predict.
Concurrent validity of the research instrument was also assessed. To assess the concurrent
validity of the research instrument, that is to distinguish between groups, the instrument was
administered on non-business sample, the result yielded a low correlation coefficient of r = .021
which is good, this implies that the instrument is discipline specific. In assessing convergent
validity, the researcher examined the degree to which the operationalization of research
107

instrument was similar to (converges on) other operationalizations that it theoretically should be
similar to by correlating the scores on the research instrument with scores on other tests that it is
purported to measure Microfinance Impact and a coefficient of .71 was the evidence of
convergent validity. A discriminant validity was carried out on the research instrument; a
discriminant validity examined the degree to which the operationalization is not similar to or
diverges from other operationalizations to which it should theoretically not be similar. The result
yielded a low coefficient of 0.04 which implies that it is theoretically dissimilar; hence evidence
of discriminant validity was valid.
3.16 Reliability of Research Instrument
A test-retest reliability of the research instrument was carried out in ten Microfinance Banks
across four States in the South-West geopolitical zone twice and at fourteen days interval. Over
90% of the items had moderate or better levels of reliability (consistency over time). Four items
had inadequate reliability. Two of these items measured internal efficiency factors and two
macroeconomic factors. None of the prevalence rates for variables measured by the survey
changed significantly across the two administrations, and prevalence rates typically varied less
than 2% between the two administrations. Scale reliabilities were calculated using Cronbach’s
Alpha; the result obtained was .72. Cronbach’s Alpha is considered the most appropriate
statistical test for reliability, given the nature of responses used to construct the scales. For this
kind of data, this is equivalent to the Kuder-Richardson formula 20 (KR20) coefficient. These
evaluations are a more rigorous approach than traditional split-half statistics. Cronbach’s Alpha
ranges in value from 0 to 1. A coefficient equal to or greater than .6 is considered a minimum
acceptable level, although some authorities argue for a stronger standard of at least .70. The
internal consistency for this instrument is considered high.
108

CHAPTER FOUR
DATA PRESENTATION, ANALYSIS AND INTERPRETATION
4.1 Introduction
The study investigated the effects of microfinancing on micro and small enterprises in South-
West Nigeria. In order to attain this, the study documented the operations and processes of
microfinancing in Nigeria, evaluated the contributions of microfinancing to the survival of micro
and small enterprises, analyzed the effects of microfinance on the expansion capacity of small
and micro enterprises and assessed the effects of microfinance on productivity of micro and
small enterprises in Nigeria. It also investigated the impact of non – financial services offered by
Microfinance Banks on the business performance of micro and small enterprises in Nigeria.
Three different methods of data collection were used in the study, this includes the
administration of questionnaires, personal interview and extraction of secondary data from the
Banks’ records. The data were analyzed, and presented on the basis of the four hypotheses
earlier formulated for the study. The hypotheses were structured to focus on variables that are
relevant to the survival, growth, productivity and performance of micro and small enterprises in
Nigeria, which also formed the bedrock of the research questions.
4.2 Profile of Respondents
109

The table 4.13 below provides information on the socio-economic profile of the respondents. As
seen in the table, 357 respondents are females while 145 are males. The majority of the
respondents are therefore women, which further confirms the fact that most beneficiaries of
microfinance credit facilities are female. Among the female micro entrepreneurs, 26 (10%) are
single, 169 (67%) are married, 10 (3%) are divorced, 38 (15%) are separated and 9 (3%) are
widowed. Among the small-scale entrepreneurs 105 are female, among the female small scale
entrepreneurs, 10 (9.5%) are single, 74 (70%) are married, 6 (5.7%) are divorced, 11 (10.5%) are
separated and 4 (3.8%) are widowed. Among the male micro-entrepreneurs, 23 (20%) are single,
73 (63%) are married, 5 (4%) are divorced, 11 (10%) are separated while 3 (3%) are widowers.
Among the 30 small-scale entrepreneurs, 7 (23%) are single, 20 (67%) are married, 2 (7%) are
separated and 1(3%) are widowers. It was observed that majority of the respondents are married
Table 4.13 Personal Profile of Respondents
Variation Levels Female MaleAll Tot
All %
Micro SmallM%
S%
Total Micro
Small % %
Total Tot %
Marital
Status
Single 26 10 10 9.5 36 23 7 20 23 30 66 13
Married 169 74 67 70 243 73 20 63 67 93 336 67
Divorced 10 6 3 5.7 16 5 0 4 0 5 21 5
Separated 38 11 15 10.5 49 11 2 10 7 13 62 12
Widowed 9 4 3 3.8 13 3 1 3 3 4 17 3
Sub Total 252 105 100 100 357 115 30 100 100 145 502 100
Age
group
18 – 24 25 9 10 9 34 10 2 9 7 12 46 9
25 – 34 78 20 31 19 98 57 10 50 33 67 165 33
35 – 44 89 33 35 31 122 25 11 22 37 36 158 31
45 – 54 36 23 14 22 59 16 3 14 10 19 78 16
55 – 64 22 19 9 18 41 6 3 5 10 9 50 10
65 and above 2 1 1 1 3 1 1 1 3 2 5 1
Sub Total 252 105 100 100 357 115 30 100 100 145 502 100
Education No Formal Education
11 1 4.3 1 12 14 3 12 10 17 29 6
Pry Six 52 26 20.6 24.7 78 15 4 13 13 19 97 19
School Cert 58 35 23 33.3 93 23 5 20 17 28 121 24
OND/NCE 79 21 31 20 100 33 12 29 40 45 145 29
B.Sc 34 10 13 10 44 24 3 21 10 27 71 14
M.Sc/Ph.D 4 3 1.5 2 7 3 1 3 3 4 11 2
110

Others 14 9 6 9 23 3 2 3 7 5 28 6
Sub-Total 252 105 100 100 357 115 30 100 100 145 502 100
No. of
Children
None 47 20 19 19 67 24 7 21 23 31 98 19
1 – 2 81 25 32 24 106 40 4 35 13 44 150 30
3 – 4 88 40 35 38 128 41 12 36 40 53 181 36
5 and above 36 20 14 19 56 10 7 9 23 17 73 15
Sub Total 252 105 100 100 357 115 30 100 100 145 502 100
Religion Christian 164 64 65 61 228 34 13 30 43 47 275 55
Islam 81 36 32 34 117 69 13 60 43 82 199 40
Other 7 5 8 5 357 12 4 10 14 16 28 5
Sub-Total 252 105 100 100 357 115 30 100 100 145 502 100
Source: Field survey, 2009
which implies that majority of the respondents have family they cater for despite the fact that
they are entrepreneurs.
In respect to age distribution of the respondents, Table 4.13 shows that among female micro-
entrepreneurs, 25 (10%) respondents are within age group 18 – 24 years, 78 (31%) are within age
group 25 – 34 years, 89 (35%) are within age group 35 – 44 years, 36 (14%) are within age
group 45 – 54 years, 22 (9%) are within age group 55 – 64 while 2 (1%) are within age group 65
and above. Among female small scale entrepreneurs, 9 (8.5%) are within age group 18 – 24, 20
(19%) are within age group 25 – 34, 33 (31%) are within age group 35 – 44, 23 (22%) are within
age group 45 – 54, 19 (18%) are within age group 55 – 64, while 1 (.9%) is within the age group
65 and above. This implies that majority of the respondents fall within the economic active age
group, that is, age group of 25 – 54 years which represent 79% of the total respondents. This also
mean that 79% of the economic active age group are employ by the MSE subsector of the
economy, that is the more reason why the sector given more attention so that the sector can
contribute maximally to the GDP of the nation.
The table also reveals that among male micro-entrepreneurs, 10 (9%) are within the age group 18
-24, 57 (50%) are within age group 25 – 34, 25 (22%) are within age group 35 – 44, 16 (14%)
are within the age group 45 – 54, 6 (5%) are within age group 55 – 64, while 1 (.9%) is within
the age group of 65% and above. Among male small scale entrepreneurs, 2 (7%) are within age
group 18 – 24, 10 (33) are within the age group of 25 - 34, 11 (37%) are within the age group of
111

35 – 44, 3 (10%) are within the age group 45 – 54, also 3 (10%) are within the age group 55 –
64, and 1 (representing 3%) is in category of age group 65 and above.
The study equally classified the respondents in terms of their level of formal qualifications,
because this affects the source of their initial capital and the management of their enterprises
(Makasure, 2008). The survey revealed that among female micro entrepreneurs, 11 (representing
4.3%) had no formal education, 52 (representing 20.6%) had basic primary education, 58 (23%)
had completed secondary education, majority of the female micro-entrepreneurs 79 (31%) had
OND/NCE certificate, 34 (representing 13%) had first degree, 4 (1.5%) had master’s degree and
above while the remaining 14 (6%) are categorized under other type of education. It was
revealed that some of the respondents filled Islamic education and traditional education as other
types of education. The relevance of this to the study is that, majority in the sample size are
literate. They have adequate knowledge judging from their educational qualification, to be able
to provide intelligent answers to questions requested of them. The table further reveals that
among female small scale entrepreneurs 1 (representing .95%) had no formal education, 26
(24.7%) had completed basic primary education, 35 (33%) had completed secondary education,
21 (20%) had OND/NCE certificate, 10 (9.5%) had fist degree, 3 (2%) had master’s degree and
above, while 9(8.6%) filled other type of education.
Among the male micro entrepreneurs on the other hand 14 (representing 12%) had no formal
education, 15 (13%) had completed basic primary education, 23 (20%) had completed secondary
education, 33 (29%) had OND/NCE certificate, 24 (21%) had first degree, 3 (2.6) had master’s
degree and above, while the same 3 (2.6%) had other type of educational qualification. Among
the male small scale entrepreneurs, 3 (representing 10%) had no formal education, 4 (13%) had
completed basic primary six education, 5 (17%) had completed secondary education, 12 (40%)
had OND/NCE certificate, 3 (10%) had a first degree, 1 (3%) had a Master’s degree and above,
while 2 (representing 7%) had other types of educational qualification. Ironically there were
more male entrepreneurs with no formal education, despite the beliefs that women are more
educationally disadvantaged.
Our analysis further shows that among female micro entrepreneurs, 47 (19%) had no children;
partly due to their unmarried status. The result obtained also shows that 81 (32%) had 1-2
children, 88 (35%) had 3-4 children, while 36 (14%) had 5 children. This implies that most of
112

them are still within the stipulated average family size in Nigeria, which signifies a minimal level
of poverty. Among the female small scale entrepreneurs, 20 (19%) had no children, 25 (24%)
had 1 – 2 children, 40 (38%) had 3 – 4 children, 20 (19%) had 5 children and above. The table
also reveals that among male micro entrepreneurs, 24 (representing 21%) had no children, 40
(35%) had 1-2 children, 41 (representing 36%) had 3 -4 children, while 10 (representing 9%) had
5 children and above. The statistics are a little different among male small- scale entrepreneurs; 7
(23%) had no children, 4 (13%) had 1 – 2 children, 12 (40%) had 3-4 children, 7 (23%) had 5
children and above. On the basis of this analysis we tried to find out how many members of a
family each respondent had to cater for, because a large family size usually attracts higher
expenditures and that may signify poverty if the income earned is not commensurate to the level
of expenditure in the family.
Table 4.14 BUSINESS CHARACTERSITICS OF RESPONDENTS
Variable Measuring group Frequency %
Year Business Established
5 years 239 47.66 – 10 years 195 38.811 – 15 years 56 11.216 – 20 years 10 2.0Above 20 years 2 0.4Total 502 100
When did you open account with MFB/community Bank?
Above 10 years 76 15.17 – 9 year 138 27.55 - 6 years 262 52.23 – 4 years 26 0.5Total 502 100
Kind of Business
Trading 238 47.4Artisan 86 17.1Manufacturing 54 10.7Agriculture 89 17.7Service 33 6.6Others 2 .4Total 502 100
Form of BusinessSole ownership 420 83.7Family Business 56 11.2Partnership 24 4.8Other type 2 0.4Total 502 100
Source of Initial Capital
Personal Savings 388 77.4Borrowed from friends 61 12.2Loan from bank 13 2.6Gift & Grant 39 7.8Total 502 100
Registration of Yes 171 34.1
113

Business No 331 65.9Total 502 100
Category of Business Micro 367 73.2Small 135 26.8Total 502 100
Business Location Urban Area 396 78.9Rural area 106 21.1Total 502 100
Motivation for starting a business
Financial independence
283 56.4
Loss of Job 126 25.1To bequeath to children
79 15.7
Others 14 2.8Total 502 100
Source: Authors computation from study Sample Data 2009
4.3 BUSINESS CHARACTERISTICS OF RESPONDENTS
Table 4.14 above shows that 239 (47.6%) of the businesses had been in existence for five years,
195(38.8%) had been in existence for about 6 – 10 years, 56 (11.2%) had been in existence for
between 11 – 15 years, 10 (2.0%) had been in existence for between 16-20 years, while only 2
(0.4%) had been in existence for a period more than twenty years. Note that one of the sampling
techniques employed in this study is judgemental. That is, the survey targeted businesses that
were five years and above, the basis is to be to relate their continuous existence to the method of
financing, particularly; the consistent use of Microfinance Banks. The majority in the five years
time frame implies that the businesses started just around the same time the MFB was officially
introduced into the Nigeria financial system. Meaning that the existence of these banks are a
catalyst to business start-up five years ago and are also contributive to the growth of the new
businesses as well as the expansion of the old ones. It was observed from the data collected that
most of these businesses were established around the same time the respondents joined the MFB.
On the type of business, the field survey revealed that 238 (47.4%) are involved in trading,
particularly retail trading. This confirmed the 2001 country survey carried out by the CBN,
where wholesale and retail trading accounted for 49% of non-agriculture microenterprise in
Nigeria. This situation is largely due to the fact that retail trading does not require any special
skill to start. Also, the dominance of Lagos State in the field survey may be another reason,
Lagos State being the commercial nerve centre for the country. It was observed that 86 (17.1%)
114

are artisans, including people involved in hair-dressing, furniture making, tailoring, mechanics,
vulcanizers, fashion designing, brick laying, etc. 33 (6.6%) are involved in service industry’ the
majority of people in this category are people involved in the sale of recharge cards, operators of
business centres, providers of educational services, food vendors, etc. Only 54 (10.8%) and 89
(17.7%) are involved in manufacturing and agricultural businesses respectively. This calls for
concern, If out of five hundred and two respondents only 54 are involved in production of goods,
it is a pointer to the fact that the nation has a long way to go in terms of real economic growth,
because no nation develop on mercantile trading and commerce alone. Most of the businesses
are sole ownership. 420 (83.7%), a typical micro enterprise is operated by a sole
proprietor/manager aided mainly by unpaid family members and occasional paid employee
and/or apprentice. Fifty six (representing 11.2%) are family businesses, 24 (4.8%) are
partnership businesses, while 2 (0.4%) are other types of business formation. This is to buttress
the fact that most of the businesses supported by MFB are one-man businesses which are
expected to grow to other forms, such as partnership business or limited liability Company after
some years. In relation to the registration status of the businesses, the analysis revealed that 331
(65.9%) are not registered businesses, while only 171 (34.1%) are registered businesses. This
may be as a result of bureaucratic bottleneck involved in registration of businesses and the
dominance of microenterprise in the survey. The survey revealed that 367 (73.1%) are micro
enterprises, using the 2007 National policy on MSMEs classification. 135 (26.9%) are small
scale enterprise. The 2001 country survey revealed that most micro enterprises in Nigeria operate
in the informal sector, meaning that they are most not registered business. It is in recent time that
the MFB is persuading business owners to at least register their business name.
The table also shows the sources of initial capital of the respondents, 388 (77.4%) started their
business with their personal savings, 61(12.2%) started with borrowed funds from friends and
family, 13 (2.6%) started with a loan from the bank, while 39 (7.8%) started with gifts and grants
obtained from friends and institutions. This confirms the fact that funding for most
microenterprises is mainly from individual resources, with a little help from family and
traditional mutual fund societies such as Rotational Savings and credit Association (ROSCA).
Bank loans are rarely sought and more rarely obtained. The research tried to find out the
composition of the initial capital to know the likely capital structure of small business in South
115

West Nigeria. The study revealed that 266 (53%) is purely owners equity, that is the entrepreneur
rely mainly on their personally generated funds to finance their businesses. The implication of
this is that their growth and expansion is limited in size. Table 4.14 also reveals that 135 (26.9%)
combined owners equity and loan which makes for business growth if they are combined in
appropriate proportion. Also, 101 (20.1%) make use of loan alone. This implies that such
entrepreneurs do not have any stake in the business and as a result, he/she may not be
enthusiastic towards ensuring business growth.
The research also strived to know what motivate the respondents to start their businesses. The
result obtained reveals that to gain financial independence is the main reasons why many
Entrepreneurs start their own businesses. 283(56.4%) indicated financial independence,
126(25.1) indicated loss of job, 79 (15.7%) to bequeath to their children and 14 (2.8%) gave
other reasons such as for self actualization and for economic reasons. The research also
discovered that most of the businesses are located in the urban areas 396 (78.9%), the dominance
of Lagos in the survey explains this. 106 (21.1%) located in the rural area.
4.4 BUSINESS CHARACTERISTICS OF RESPONDENTS BY LOCATION
Table 4.15 (see appendix B) shows the statistics of business characteristics of respondents
according to location of their business enterprise. The Table reveals that 396 of the businesses in
this survey are situated in urban areas. Storey (1994) suggests that there are some locations in
which firms are more likely to grow faster. According to the evidence presented in Storey
(1994), U.K. firms located in rural areas can be expected to grow faster than those in urban
centres. The Table also reveals that only 2 micro entrepreneurs and 2 small-scale entrepreneurs
in the trading business, within the age group of 18 – 24 years are sole proprietors of their
businesses, living in urban areas, received micro loan from MFBs in the year 2000. Among
respondents within the age group of 25 – 34 years, only 8 micro entrepreneurs and 4 small-scale
entrepreneurs in the trading business and are sole proprietors of their businesses, living in urban
areas, obtained micro loan from MFBs in 2000. Of the respondents of the same age group living
in urban areas, there are 2 micro entrepreneurs among artisans and 2 micro entrepreneurs in
agricultural and service business respectively that received micro loan in year 2000. Among
those operating family business, within the age group of 25 – 34 years, only 1 micro entrepreneur
and 1 small-scale entrepreneur in the trading business received micro loan in 2000. Also, within
116

the same age group, 1 micro entrepreneur who is an artisan, and 1 small scale entrepreneur in
agricultural business received micro loan in 2000. In partnership business, 1 micro entrepreneur
artisan, 1 small-scale entrepreneur in manufacturing business and 1 micro entrepreneur in the
service sector received micro loan in 2000. And lastly, among the respondents of the age group
of 25 – 34 years, living in urban area of South-west Nigeria, only 1 micro entrepreneur in other
type of business formation received microloan in 2000.
Within the age group of 35 – 44 years, living in urban areas and in sole proprietorship business,
11 micro entrepreneurs in the trading business, 2 micro entrepreneur artisans, 1 micro in service
industry received microloan in the year 2000. Among those operating family business of the
same age group, 1 micro entrepreneur in agricultural business and 1 small-scale entrepreneur in
the service sector received entrepreneur in the trading business, 1 small-scale entrepreneur in the
manufacturing business, 1 small-scale entrepreneur in agricultural business received microloan
in 2000 from community banks transformed into MFBs. Among those operating partnership
businesses of the same age group, only 1 small-scale entrepreneur artisan received a microloan in
2000.
For the period covering 2001 – 2003, the Table further shows that within the age group of 18–24
years and among those operating sole proprietorship business, 1 small-scale entrepreneur in the
trading business, 1 micro entrepreneur in agricultural business, 2 small scale entrepreneurs in the
agricultural business and 3 micro entrepreneurs in the service business all received microloan
from MFBs. Among those operating family business of the same age group, the Table also
reveals that 1 small-scale entrepreneur artisan, 1 small-scale entrepreneur in manufacturing, and
1 micro entrepreneur in the manufacturing business all received microloan from MFBs. Among
those in partnership business, only 1 micro entrepreneur in the service sector received microloan
from an MFB.
Among those within the age group of 25 – 34 years and operating sole proprietorship businesses,
14 micro entrepreneurs and 3 small-scale entrepreneurs in the trading business, 7 micro
entrepreneur artisans, 3 micro entrepreneurs in the manufacturing business, 2 micro
entrepreneurs in agricultural business and 2 micro entrepreneurs in the services sector received
117

microloans from MFB within 2001 – 2003 period. Among those operating family business,
within the age group of 25 – 34 years, living in urban areas, 1 small-scale entrepreneur in the
trading business, 1 micro entrepreneur in the manufacturing business, and 2 micro entrepreneurs
in agricultural business all received micro loans from MFBs. Among those operating partnership
businesses, only 1 micro entrepreneur artisan and 1 small-scale entrepreneur artisan received a
micro loan during the 2001 – 2003 period.
The Table also reveals further that for entrepreneurs within the 35 – 44 age group operating sole
proprietorship business, 13 micro entrepreneurs and 10 small-scale entrepreneurs in the trading
business, 1 micro entrepreneur and 1 small-scale entrepreneur in the manufacturing business, 1
micro entrepreneur and 1 small-scale entrepreneur in agricultural business, and 3 micro
entrepreneurs and 1 small scale entrepreneur in the service sector all received microloans from
MFBs during the years 2001 – 2003. Among those in family business, 1 micro entrepreneur
artisan, 1 micro entrepreneur in the manufacturing business and 1 small scale entrepreneur in
manufacturing business all received microloan from Microfinance Bank. Also, for age group of
45 – 54 years and in sole proprietorship business, 4 micro entrepreneurs in the trading business, 1
micro entrepreneur artisan, 1 small-scale entrepreneur artisan and 1 micro entrepreneur in
agricultural business all received microloans from MFBs. Among those operating family
business, only 2 micro entrepreneurs in agricultural business received microloans. Among those
in partnership business within the same age group, only 1 micro entrepreneur and 2 small-scale
entrepreneurs in the manufacturing business received microloans for the 2001 – 2003 period.
For the period covering 2004 – 2005, among those within the age group of 18 – 24 years, living
in urban areas and operating sole proprietorship business, 8 micro entrepreneurs and 1 small-
scale entrepreneur in the trading business, 2 micro entrepreneur artisans, 2 micro entrepreneurs
in the manufacturing business, 1 micro entrepreneur in agricultural business and 1 micro
entrepreneur in the service sector received microloans from MFBs. Among entrepreneurs within
the age group of 25 – 34 years, operating sole proprietorship business, 22 micro entrepreneurs
and 14 small-scale entrepreneurs in the trading business, 8 micro entrepreneur artisans and 3
small-scale entrepreneur artisan, 3 micro entrepreneurs in the manufacturing business, 6 micro
entrepreneurs and 3 small-scale entrepreneurs in agricultural business, as well as 4 micro
118

entrepreneurs and 2 small-scale entrepreneurs in the service sector all received micro loans. The
final analysis revealed that out of the 396 entrepreneurs residing in the urban areas, 215 are in the
trading business, 62 are artisans, 37 in the manufacturing business, 52 in agricultural business
and 28 in the service sector. The high proportion in the trading business may be due to the fact
that starting a trading business especially at the micro level is less capital intensive and does not
require special skill like in other sectors. Out of the 215 in the trading business, 208 are in sole
proprietorship business, 4 in family business, and 3 in partnership business. This implies that
most MSEs are one-man businesses. The implication of this finding could be that one – man
business is a constraint to business growth, given that in partnership and family business there
could be greater pool of ideas and skills.
4.5 BUSINESS CHARACTERISTICS OF RESPONDENTS BY LOCATION
Table 4.16 (see appendix B) shows the business characteristics of respondents living in rural
areas of the South- West geopolitical zone. There are 106 respondents distributed across the six
States; and in different business formation and trading activities as shown below. Davidson et al.,
(2002) using Swedish data shows that firms located in a number of smaller communities grow
slower than those in capital area. The Table reveals that in the year 2000, among entrepreneurs
living in rural area of South-West Nigeria, and operating family business, within the age group
of 18 – 24 years, only 1 micro entrepreneur in agricultural business received micro loan from
MFBs. Within the age group of 25 – 34 years and in sole proprietorship business, 3 micro
entrepreneurs and 1 small- scale entrepreneur in the trading business received micro loan from
MFBs in 2000. Also, 3 micro entrepreneur artisans and 1 micro entrepreneur in agricultural
business in sole proprietorship business received micro loans in the same period. Within the 35 –
44 age group, 1 small-scale entrepreneur in trading business and 2 small-scale entrepreneurs in
the manufacturing business received micro loans in the same period.
For the period covering 2001 – 2003, among entrepreneurs within the 18 – 24 age group, living
in rural area and in sole proprietorship businesses, 4 micro entrepreneurs in the trading business,
2 micro entrepreneur artisans, and 1 micro entrepreneur in the agricultural business all received
microloans from MFBs. Among entrepreneurs within the 25 – 34 age group in sole
proprietorship business, 4 micro entrepreneurs, 1 micro entrepreneur artisan and 1 micro
119

entrepreneur in the agricultural business all received micro loans for the period. For the same age
group and among family business operators, only 1 micro entrepreneur in the trading business
and 1 micro entrepreneur in the agricultural business received micro loans for the same period.
Within the 35 – 44 year age group and in sole proprietorship business, 1 micro entrepreneur in
the trading business, 2 micro entrepreneur artisans and 1 small-scale entrepreneur in the
agricultural business received micro loans. Among entrepreneurs operating family business of
the same age group, 2 micro entrepreneurs in family business and 1 micro entrepreneur in the
agricultural business received micro loan in the same period. Among entrepreneurs within the
age group of 45 – 54 years and operating sole-proprietor business, 1 micro entrepreneur and 1
small-scale entrepreneur in the manufacturing business, as well as 1 micro entrepreneur and 1
small-scale entrepreneur in the agricultural business all received micro loans from MFBs in the
same period. Only 2 micro entrepreneurs in the agricultural business, operating family business
and living in the rural area received micro loans for the same period.
For the 2004 – 2005 period among entrepreneurs operating sole-proprietor business, within the
age group of 18 – 24 years, 1 micro entrepreneur in trading, 1 micro entrepreneur in the
agricultural business, 1 micro entrepreneur and 1 small-scale entrepreneur in the service sector
received microloans. Among entrepreneurs within the age group of 25 – 34 years, 1 micro
entrepreneur and I small-scale entrepreneur in the trading business, 4 micro entrepreneur artisans
and 1 small scale entrepreneur artisan, 1 micro entrepreneur and 1 small-scale entrepreneur in the
manufacturing business, 4 micro entrepreneurs in the agricultural business and 1 micro
entrepreneur in service sector operating sole proprietorship business all received micro loan. The
final analysis shows that of the 106 entrepreneurs living in rural area of south west Nigeria, 74
are operating sole ownership business, 29 in family business and 2 in partnership business.
Unlike the distribution in the urban area, agricultural business has the highest proportion in terms
of business activities with 37, followed by artisan with 24, and 23 in trading activities while the
lowest is manufacturing with 17. The result is expected, the reason is that the rural areas are
likely to be more conducive for agricultural business than urban area due to availability of space
and easy access to farmland.
4.6 CROSS-TABULATION OF VARIABLES
Table 4.17 Business Resident and Kind of Business
120

Kind of Business
Actual Number Percentages
Trading
Artisan
Manuf.
Agric.
Service
Total
Trading %
Artis%
Manuf%
Agri%
Servic% %
Business Ekiti 11 2 2 4 4 23 4.6 2.3 3.7 4.5 11.4 5Resident Lagos 127 28 22 30 12 219 53.4 32.6 40.7 33.7 34.3 44
Ogun 43 18 4 14 4 83 18.1 20.9 7.4 15.7 11.4 17Ondo 13 8 3 6 0 30 5.5 9.3 5.6 6.7 0.0 6Osun 22 15 11 10 5 63 9.2 17.4 20.4 11.2 14.3 13Oyo 22 15 12 25 10 84 9.2 17.4 22.2 28.1 28.6 17Total 238 86 54 89 35 502 100 100 100 100 100 100
(X2 = 54.26, significant level, 5%) Source: Author’s Computation from Study Sample Data 2009
The research tried to find out the kind of businesses engaged in by respondents across the six
States. In Table 4.17 above, it was observed that trading was highest in all the States, both
wholesale and retail trading. This confirms Anyanwu’s (2004) findings, that Microfinance
Institutions available in the country mostly finance trading. Lagos State has the highest
percentage of 53.4% among the six States in South-West zone. This is expected because Lagos is
the commercial nerve centre for the country; besides this, the State has the highest percentage of
respondents. Among artisans, Lagos has the highest percentage of respondents (32.6%), followed
by Ogun State with 20.9% and Osun and Oyo States with 17.4% respectively, while Ondo and
Ekiti States have 9.3% and 2.3% respectively. Lagos State has the highest percentage among
manufacturers with 40.7%, followed by Oyo State with 22.2% and Osun State with 20.4% and
Ogun, Ondo and Ekiti State with 7.4%, 5.6% and 3.7% respectively. Most surprising in the
agricultural business is the fact that Lagos State has the highest percentage of 33.7%, followed
by Oyo State with 28.1% and Ogun State with 15.7% while Osun, Ondo and Ekiti States have
11.2%, 6.7% and 4.5% respectively. In the service industry, Lagos dominates with 34.3%,
followed by Oyo State with 28.6% and Osun State with 14.3% while Ogun and Ekiti States have
11.4% each. The dominance of Lagos in the survey is evident in the results obtained.
Table 4.18 Education and Business Residents of respondents
Business Resident
121

Actual Percentage
Ekiti Lagos Ogun Ondo Osun Oyo TotalEk%
La%
Og%
On%
Os%
Oy%
Tot%
EducationNo formal educ 0 11 3 1 9 5 29 0 5 3.6 3.3 14 6.0 6
Pry Six 3 49 18 8 4 15 97 13 22 22 27 6 18 19
Sch Cert 5 55 22 8 13 18 121 28 25 27 27 21 21 24
OND/NCE 12 61 22 9 19 22 145 52 28 27 30 30 26 29
B.Sc 3 26 9 3 10 20 71 13 12 11 10 16 24 14
M.Sc/PhD 0 3 3 0 2 3 11 0 1 4 0.0 3.2 3.6 2
Others 0 14 6 1 6 1 28 0 7 7 3.3 9.5 1.2 6
Total 23 219 83 30 63 84 502 100 100 100 100 100 100 100
(ᵡ2 46.91, significant level, 10%)
Source: Author’s Computation from Study Sample Data 2009
To know the level of education of micro entrepreneur across the six States, Table 4.18 reveals
that Lagos State has the highest number across the six category levels of education, followed
closely by Ogun State. For first degree holders (that is B.Sc) Lagos State has the highest number
of 26 (36.6%), followed by Oyo State with 20 (28%) and Osun and Ogun States with a 10 (14%)
and 9 (12.6%) respectively, while Ekiti and Ondo States have 3(4%) each. The reason is that the
level of education affects the entrepreneur’s level of performance in business management
(Makasure et al., 2008).
Table 4.19 Kind of Business and Form of Business
Form of Business Actual Percentage
Sole Ownership
Family Business
Partnership Total
Sole%
Family%
Part% %
Kind of
Business
Trading 230 5 3 238 54.5 8.9 12.5 47.4Artisans 77 4 5 86 18.2 7.1 20.8 17.1Manufacturing 34 12 8 54 8.1 21.4 33.3 10.8Agriculture 51 35 2 88 12.1 62.5 8.3 17.5Service 28 0 5 33 6.6 0.0 20.8 6.6
122

Others 2 0 1 3 0.5 0.0 4.2 0.6Total 422 56 24 502 100 100 100 100
(ᵡ2 = 152.81, significant level, 1%)
Source: Authors computation from study Sample Data 2009
Table 4.19 shows that the dominant form of business in the study is sole ownership and this cuts
across all the business type. Most Africans are afraid of losing control of their businesses that is
why they opt for sole proprietorship (CBN, 2004) but unfortunately most of the businesses die as
soon as the founder/owner dies. Shiferaw (2008) find death of business owner and migration as
the predominant factor for firm exit in Ghana. Most of the agricultural businesses are family
owned with a high percentage of 62.5%, followed by the manufacturing sector with 21.4%. It is
understandable that many will like to bequeath such businesses to their children, hence the need
to involve family members in the business. Under the partnership type of business, the
manufacturing sector has the highest percentage of 33.3%, followed by service and artisan’s kind
of business with 20.8% each, this indicate such businesses require more than one man skill.
Table 4.20 Level of education and Sources of Initial Capital
Source of Initial Capital Actual Percentage
Personal Savings
Loan from Friend
Loan from bank
Gift/Grant Total
P%
LF%
LB%
GG%
Total%
EducationNo fromal educ 24 3 1 1 29 6.2 4.9 7.7 2.6 5.8
Pry Six 76 13 1 7 97 19.5 21.3 7.7 17.9 19.3 Sch Cert 99 11 3 8 121 25.4 18 23 20.5 24.1 OND/NCE 111 16 6 12 145 28.5 26.2 46 30.8 28.9 B.Sc 49 13 2 7 71 12.6 21.3 15 17.9 14.1 M.Sc/PhD 7 2 0 2 11 1.8 3.3 0 5.1 2.2 Others 23 3 0 2 28 5.9 4.9 0 5.1 5.6 Total 389 61 13 39 502 100 100 100 100 100
(ᵡ2 = 116.63, significant level, 1%)
123

Source: Author’s Computation from Study Sample Data 2009
The entrepreneur’s level of education is believed to exert a great influence on the Entrepreneur’s
business performance, particularly the source of initial capital (See Makasure et al, 2008). The
entrepreneur’s level of education at start up determines the amount the entrepreneur is able to
save or access to start the business. Table 4.20 shows that most of the entrepreneurs rely on their
personal savings at start-up. Among graduate entrepreneurs, the source of most of the initial
capital is personal savings and loans from friends, while gifts and grants constitute other sources.
Table 4.21 Level of Education and Kind of Business
CategoryActual Percentages
Micro Enterprises
Small Scale Enterprises
Total Micro %
Small %
Total %
Education No Formal Education
25 4 29 6.8 3.0 5.8
Pry Six 67 10 77 18.3 7.4 15.3
Sch Cert 81 13 94 22.1 9.6 18.7
OND/NCE 112 33 145 30.5 24.4 28.9
B.Sc 58 60 118 15.8 44.4 23.5
M.Sc/Ph.D 7 4 11 1.9 3.0 2.2
Others 17 11 28 4.6 8.1 5.6
Total 367 135 502 100 100 100
(ᵡ2 = 72.28, Significant level, 5%)
Source: Author’s computation from study Sample Data 2009
On classification of businesses, Table 4.21 shows that micro enterprise is dominant in the survey,
but level of education among small scale entrepreneurs is higher than micro entrepreneurs. Even
though there are only 135 small scale entrepreneur respondents, 44% of them are graduates, 24%
124
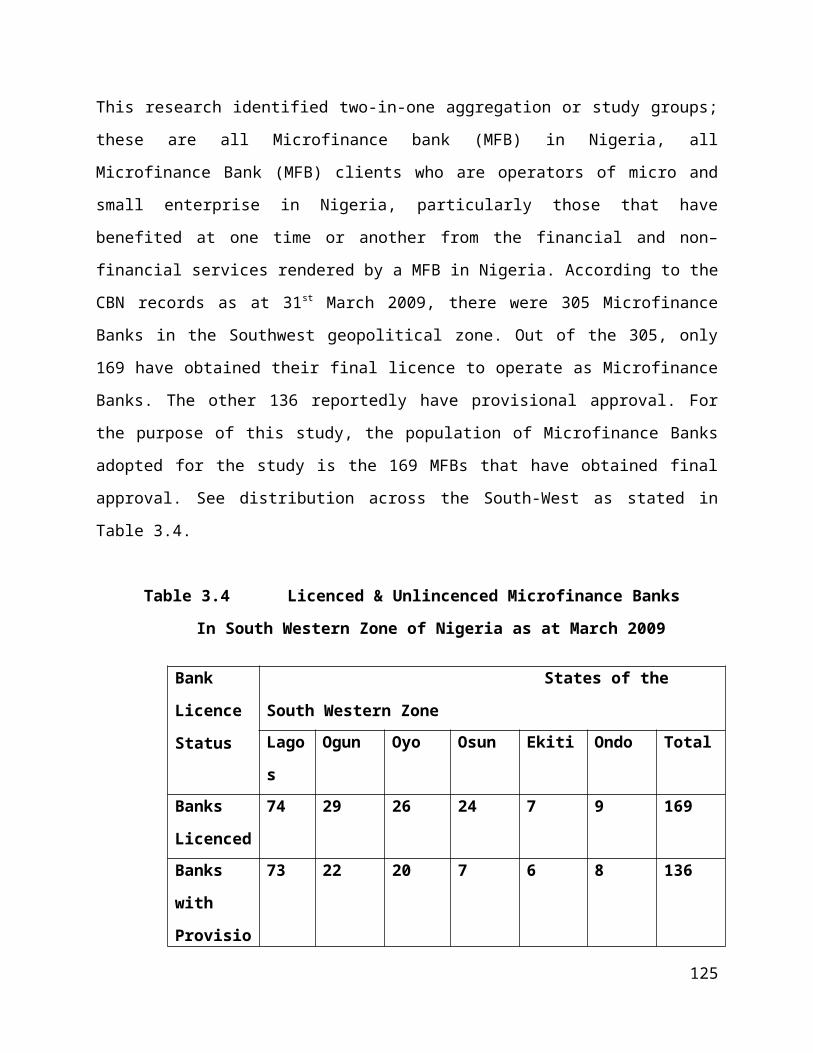
have OND/NCE, the percentage with school certificates and below are very few. This suggests
that level of education affects the quality of business enterprise.
Table 4.22 Kind of Business and Category of Business Enterprise
(ᵡ2 = 56.32, significant level, 10%)
Source: Author’s Computation from Study Sample Data 2009
To know the kind of business the entrepreneurs are engaged in cuts across the two classifications
of enterprises. Table 4.22 shows that trading dominated both types (of classifications). Among
the artisans for instance, 18% are micro-enterprise, while 14.8% are small-scale enterprise.
Among manufacturers, 9% are in micro-enterprise, while 15.6% are in small-scale enterprise. In
relation to individuals involved in agricultural business, 18% are in micro-enterprise, while 17%
125
Category Actual Percentage
Micro
Enterprise
Small Scale
Enterprise TotalMicro
%Small
%Total
%Kind of Trading 177 61 238 48.2 45.2 47.4Business Artisans 66 20 86 18.0 14.8 17.1 Manufacturing 33 21 54 9.0 15.6 10.8 Agriculture 66 23 89 18.0 17.0 17.7 Services 24 9 33 6.5 6.7 6.6 Total 367 135 502 100 100 100

are in small-scale. While in the service industry, 6.5% each are categorized as micro
entrepreneurs while 6.7% are small-scale entrepreneurs. Though the micro enterprises are more,
the result obtained shows that small scale entrepreneur dominated in certain trade such as
manufacturing.
Table 4.23 Sources of Initial Capital and Composition of Capital Structure
(ᵡ2 = 155.57, significant level, 1%)
Source: Author’s computation from study Sample Data 2009
Composition of Capital Structure
Actual Percentage
Loan Only
Debt & Equity
Owners Equity
Grant/Gift Tot
LO %
DE%
OE%
GG%
Total%
Source of
Personal Savings 37 75 251 25 388 66.1 56.0 94.4 55.6 77.4
Initial
Loan from friend 15 38 5 3 61 26.8 28.4 1.9 6.7 12.2
Capital
Loan from Bank 2 7 4 0 13 3.6 5.2 1.5 0.0 2.6
Gift/Grant 3 14 6 17 39 3.6 10.4 2.3 37.8 7.8
Total 56 134 266 45 502 100 100 100 100 100On composition of capital structure, Table 4.23 shows that among those who used loan only,
66.1% are sourced from personal savings, 26.8% from loans from friends, 2.6% came from loans
from bank while 3.6% came as gifts and grants. Among those who combine debt and equity,
56% are sourced from personal savings, 28.4% came from loans from friends, 5.2% came from
126

loans from banks while 10.4% came as gifts and grants. Among those who use equity only in
their capital structure, the result obtained in Table 4.23 shows that 94.4% sourced their initial
capital from
personal savings,
1.9% from
loan from
friends, 1.5%
from loan
from banks,
and the
remaining 2.3% sourced from gift and grants. This gives us an idea of what the capital structure
of the respondents look like. The implication of this is that many of them are not growing
because they rely more on internally generated revenue, hence they cannot grow beyond their
immediate capacity except they receive external funding.
Table 4.24 Enterprise Age and Entrepreneurial Training/Meeting
127
Entrepreneurial Training/meeting
Actual Percentage
No Yes Total
No
%
Yes
%
Total
%
Enterprise
age 5 and below years 93 146 239 54.1 44.2 47.6
6 - 10 years 58 137 195 33.7 41.5 38.8
11 - 15 years 16 40 56 9.3 12.1 11.2
16 - 20 years 5 5 10 2.9 1.5 2.0
20 years and above 0 2 2 0.0 0.6 0.4
Total 172 330 502 100 100 100

(ᵡ2 = 77.62, significant level, 10%)
Source: Author’s Computation from Study Sample Data 2009
With regard to entrepreneurial training on business sustenance, Table 4.24 reveals that 61% of
the respondents in business age group of 5 years and below attend entrepreneurial training
programmes regularly. Among the 6 – 10 years business age group 72% indicated they attend
entrepreneurial trainings regularly. Among the business age group of 11 – 15 years, 71% said
they attend entrepreneurial trainings regularly while 29% said they do not attend regularly. The
implication of this result is that 65.7% of the total number of respondents has participated in one
form of entrepreneurial training or the other, which goes further to emphasize the importance of
business training to small business development.
4.7 SURVIVAL ANALYSIS
This aspect of the study was based on a survey of a sample of 623 MSEs randomly selected from
a population frame consisting of MFB clients that have transacted business and had operating
relationships of not less than 5 years with the MFBs. A total of 502 of the 623 copies of
questionnaire distributed were retrieved and used for the analysis. The sampling procedure has
the advantage of a high total response rate of (85.5%) of owner-managers to the questionnaire
requesting very detailed and sensitive information. The firm-level survey data was then linked to
longitudinal information from the Banks on several performance indicators that include five-year
summary of sales, profits, micro-loans, micro savings, capital employed and total assets. The
combination of extracts from bank records and survey information provides detailed histories of
each firm in the sample, with information for each year over the firm’s life cycle for the period,
some from start-up to the survey date in 2009.
The survey data was collected on 28 socio-economic variables that affect the survival of small
and micro enterprises. The study classified factors that affect survival and viability of firms into
four (4) broad categories of independent variables. These four broad categories are
macroeconomic factors, factors that affect social capital, factors that affect the internal efficiency
128

of small businesses and enterprises and factors that affect access to micro credit. Macroeconomic
factors include variables related to economic policy that are essential for promoting private
investments in micro and small enterprises; legal and regulatory issues, the assessment of tax,
backward and forward linkages, access to credit, the degree of competition at the local market as
well as local demand for goods and services produced by micro and small enterprises. Factors
related to internal efficiency refer to business related decisions made by owners/managers, trends
in net income, conversion of profit back into investment, demographic conditions such as
rural/urban migration, level of education, prior business experience, managerial ability,
motivation for working in the sector, number of working hours, level of technical skills, business
training received, etc.
Micro credit refers to availability of credit, access to credit finance, sources and amount of initial
start-up capital, terms of loan repayment conditions and the extent of effective utilization of
credit, loan size and micro savings.
Social capital refers to participation in micro financing schemes, access to free family labour
work and networking with other businesses and enterprises as a result of participation in micro
finance schemes, relationship with loan officers, group membership, group guaranteeship, and
mandatory savings. These four categories of independent variables account for most of the key
predictors of survival affecting micro and small enterprises in Nigeria. The study initially
selected a total of 28 predictor variables that strongly affect the survival of small and micro
enterprises from all the variables available based on the Pearson Chi-square tests of association
and binary logistic regression analysis with stepwise backward elimination as screening
procedures. The list of variables used for analysis included a number of firm-level dummy
variables. The stepwise backward elimination procedure further reduced the number of highly
influential factors from 28 to 8 variables. The stepwise backward elimination procedure was
applied with a probability cut-off point of 0.20. At each stage of elimination, variables that could
not meet the minimum criteria for staying in the model were dropped. The procedure of
discarding “useless variables” was continued until no more “useless variables” could be removed
from the model. The final model consisted of eight (8) predictor variables that with 5% level of
significance.
129

The aim of this aspect of the study is to test for the effect of microfinancing on small business
survival and identify factors that significantly affect the long-term survival and viability of small
businesses and enterprises. Analysis was done using the Cox Proportional Hazards Model
(Cleves et al., 2004) in view of the fact that some of the 502 businesses in the study were right
censored. Hazard ratios were obtained for key influential predictors of survival. Kaplan-Meier
survival probability curves were used for comparing viable and non-viable businesses in terms of
survival probabilities. Descriptive and summary statistics were also obtained. The adequacy of
the fitted Cox regression model was assessed using the likelihood ratio test and Akaike’s
information criterion (AIC) statistic. The fulfilment of the proportional hazards assumption was
tested by the use of log-minus-log plots. Data analysis was done using SPSS statistical package
15.0.
The duration of survival of businesses was measured for each of the 502 enterprises in the study
using five year business summary linked with survey data, starting from January 2004 and
terminating at December 2008. Firms that were still operational and active at the end of the
period December 2008 were considered censored. Censoring implies that the time to the event
(in this case death) has not occurred. That is, they are still active businesses at the end of the
study period. The total censored businesses were 457 while 45 were not censored. The
businesses not censored are businesses for which the researcher could not obtain data from bank
records, particularly towards the end of the study period on micro credit and micro-savings in
2007 and 2008. We tagged them ‘‘non-active businesses’’ since we are not sure whether they are
dead or not. Survival time is defined as the number of years of operation between 1st January,
2004 and the date of the last data obtained, 16th December 2008.
4.7.1 RESULTS OF ANALYSIS
Table 4.25 shows the distribution of factors that affect the long-term survival of firms. The table
shows frequency proportions of eight (8) key predictors for active and non-active business
enterprises. In the 5-year study period, 45 of the 502 businesses in the study (9%) were non
active while the other 457 businesses (91%) were active and survived very well in the last five
years. “Non activity” is a term used to define businesses that have not received loan or
participated fully in microfinance programmes in the previous two years, while the active and
130

surviving business are those that are actively involved in micro financing in the five-year study
period. The table shows that only 2% of the enterprises that do not participate regularly in
microfinance remain active in business, while the remaining 98% are not active in business. The
2% probably have other sources of financing their enterprise not obvious to the MFBs.
Firms that raised money from MFBs at least 5 times in the 5-year study period are said to be
regular participants in microfinance programme, since accessing the loan is the ultimate aim of
the microfinance programme. The table also shows that 92% of the active enterprises generate
profit regularly, while 8% agreed that they do not generate profit regularly. The basis of the 8%
survival could be on other variable that equally enhance small business survival. Among the non
active businesses, 33% generate profit regularly while 67% agreed that they do not generate
profit regularly. We attribute inactive status to inability to generate profit regularly because
enterprises that generate profit regularly are able to expand their businesses by converting such
profit into investment.
Among the active enterprises, 83% were able to convert profits into investment, meaning that
they have a means of saving profit generated. 17% agreed they were not able to convert profits
into investment. But 22% of the non-active enterprises also were able to convert their profit into
investment, 78% were not able to convert profits into investment, probably because of the
limited investment opportunity as perceived by the entrepreneurs. On easy access to micro credit,
94% of the active enterprises agreed that they could easily access micro credit, the remaining 6%
did not feel that accessing micro credit was easy. Among the non-active businesses, 12% also
agreed that accessing microcredit was easy while the remaining 88% did not agree that accessing
micro credit was easy. Sixty-six percent of the active enterprises agreed that they have adequate
technical capacity to manage a small business, while 44% indicated that they do not have the
technical capacity involved in the management of a small business. The frequency distribution is
different among non-active businesses; 32% agreed that they have the technical capacity to
manage small business while 68% agreed their technical capacity is too weak to manage a small
business.
The distribution of respondents with respect to contact with Lender/Loan Officers shows that
72% of the active businesses have a regular contact with Lender/Loan Officers, while 18%
131

indicated that they do not have regular contact with Lender/Loan Officers. The regular contact
with the Loan/Field officers becomes imperative because the officers recommend clients for
loans. 16% of the non-active businesses agreed that they have regular contact with their Loan
officers while 84% indicated that they do not have regular contact with their loan officers. 81%
of the active businesses entrepreneurs have at least primary education and above while 19% have
no formal education, among the non active businesses only 6% of the entrepreneurs have formal
education, and the remaining 84% have no formal education. Entrepreneur’s level of education
was one of the variables found to have strong association with small business survival. Table
4.25 also shows the frequency distribution for micro savings as one of the variables with a
positive strong association with small business survival. 81% of the survivor businesses agreed
that mandatory savings enhanced their business survival, while 19% did not agree that
mandatory savings enhance business survival. Among the inactive businesses, 15% indicated
that mandatory savings enhance business survival, while 85% did not agree that mandatory
savings enhance business survival.
The table shows that the inactive businesses are characterized by inability to generate profits,
inability to convert the profits generated into quality investments, lack of access to micro credit,
inadequate technical capacity, lack of regular contact with Lender/Loan Officers, no formal
education, non regular participation in microfinance programmes and no mandatory micro
savings.
Table 4.25 Group Proportions with Regard to Long-term Survival
Predictor Variables Survivors/Active (n = 457) Non-survivors/Non active (n = 45)
132

Ability to generate profit regularly Yes 92% Yes 33% No 8% No 67%
Covert profit into investment Yes 83% Yes 22% No 17% No 78%
Access to microcredit Yes 94% Yes 12% No 6% No 88%
Technical Capacity Adequate 66% Adequate 32% Poor 44% Poor 68%
Regular Contact with loan officer Cordial 72% Cordial 16% Not Cordial 18% Not Cordial 84%
Entrepreneur education Above Primary level Above Primary level Yes 81% Yes 6% No 19% No 94%
Regular Participation in Yes 85% Yes 2%Microfinance programme No 15% No 98%
Microsavings Mandatory 81% Mandatory 15% Not mandatory 19% Not Mandatory 85%
Source: Author’s Computations from Study Sample
Kaplan –Meier Survival Analysis Estimate
Kaplan-Meier survival probability estimates and plots were used to compare the survival time of
businesses with regards to participation in microfinance programmes. Table 4.26 shows that
small scale enterprises have higher survival time of 4.82 years while micro enterprises have
survival time of 4.42 years. Survival time for the total sample is 4.53 years with strong
association with participation in microfinance programme. The significance of the estimate was
tested using three diagnostic tests. Table 4.27 shows the result of the three tests, Log rank,
Breslow (generalized wilcoxon) and Terone Ware to be all significant at 1%. The result implies
that there is strong evidence to show that there is statistical difference between the survival time
for micro and small enterprises in South West Nigeria.
Table 4.26 Kaplan Meier Survival Estimate by Category
Means and Medians for Survival Time
133

Category Mean(a) Median
Estima
te
(years)
Std.
Error
95% Confidence
Interval
Estimat
e
Std.
Error
95% Confidence
Interval
Lower
Bound
Upper
Bound
Lower
Bound
Upper
Bound
Micro Enterprise 4.423 .055 4.316 4.530 5.000 .008 4.984 5.016
Small Scale
Enterprise4.820 .053 4.716 4.925 5.000 .015 4.970 5.030
Overall 4.530 .043 4.445 4.615 5.000 .006 4.988 5.012
Source: Author’s Computations from Study Sample
a Estimation is limited to the largest survival time if it is censored.
Table 4.27 Diagonistic Test Kaplan Meier Estimate Overall Comparisons
Chi-Square Df Sig.
Log Rank (Mantel-Cox) 11.204 1 .001
Breslow (Generalized
Wilcoxon)12.592 1 .000
Tarone-Ware 11.946 1 .001
Source: Author’s Computations from Study Sample
Test of equality of survival distributions for the different levels of Category.
Kaplan - Meier Survival Estimate by Kind of Business
Table 4.28 shows Kaplan-Meier survival probability estimate by sector. The Table shows that
the service sector has the highest survival time of 4.67 years. The second highest survival time is
the agriculture sector with 4.64 years. The third highest survival time is the trading sector with
4.59 years, followed by the artisans with 4.36 years survival time. Lastly, the manufacturing
sector has the lowest survival time of 4.18 years. The results obtained are expected. It simply
implies that microfinance may not be the most appropriate method of financing manufacturing
business in South- West Nigeria. Firm level analysis has shown that microfinancing is mostly
suitable for service and retail trading businesses because they require relatively less capital and
constitutes the majority of new firms; they thrive in rather risky conditions and their survival is
based on their ability to generate enough profit. Agricultural businesses have shown relatively
134

better survival time than trading and artisans; this is probably because most of the agricultural
businesses are based on group lending. Overall survival probability for enterprise finance by
Microfinance Banks is 4.53 years.
Table 4.28 Kaplan-Meier Survival Estimate by Kind of Business
Means and Medians for Survival Time
Kind of Business Mean(a) Median
Estimate
(years) Std.
Error
95% Confidence Interval
Estimate
Std. Error
95% Confidence Interval
Lower Bound
Upper Bound
Lower Bound
Upper Bound
Lower Bound
Upper Bound
Trading 4.599 .059 4.484 4.714 5.000 .020 4.961 5.039
Artisans 4.365 .123 4.123 4.606 5.000 .029 4.943 5.057
Manufacturing 4.189 .155 3.886 4.492 5.000 .016 4.968 5.032
Agriculture 4.644 .092 4.464 4.825 5.000 .020 4.960 5.040
Service 4.679 .124 4.437 4.921 5.000 .041 4.920 5.080
Overall 4.530 .043 4.445 4.615 5.000 .006 4.988 5.012
Source: Author’s Computations from Study Sample
a Estimation is limited to the largest survival time if it is censored.
Table 4.29 Diagnostic Test Kaplan-Meier Estimate by Kind of Business
Table 4.29 below shows the results of the three overall diagnostic tests of Log rank, Breslow
(generalized wilcoxon) and Terone Ware. They are all significant at 1%. This implies that there
is strong evidence to show that the survival time among the five sectors (that is trading,
manufacturing, artisans, agriculture and service) is statistically different.
Table 4.29 Diagnostic Test Kaplan-Meier Estimate by Kind of Business
Overall Comparisons
Chi-Square Df Sig.
135

Log Rank (Mantel-Cox) 13.512 5 .019
Breslow (Generalized
Wilcoxon)13.888 5 .016
Tarone-Ware 13.731 5 .017
Source: Author’s Computations from Study Sample
Test of equality of survival distributions for the different levels of Kind of Business.
Table 4.30 Adjusted Hazard Ratio from Cox Proportional Hazard Model
Variables in the Equation
Exp(B)95.0% CI for Exp(B)
Predictor variables B SE Waldt-value d
f Sig.
Hazard Ratio Lower Upper
No Regular participation in microfinance
.098 .025 3.779 3.920 1 .000 1.102 3.450 9.162
No conversion of profit to Investment
.633 .222 3.796 2.851 1 .002 1.883 2.225 7.781
No regular profit 2.015 .376 7.300 5.359 1 .021 7.500 1.133 7.154
Low technical capacity 1.126 .343 .134 3.283 1 .000 3.083 2.243 8.141
No regular contact with Loan officer
1.555 .391 .158 3.976 1 .006 4.735 1.810 7.164
Low Entrepreneur level of education
1.196 .269 8.774 4.446 1 .003 3.307 2.245 7.550
No access to micro credit 2.011 .224 1.067 8.978 1 .031 7.471 1.778 6.066
No mandatory micro savings 1.016 .210 .006 4.838 1 .001 2.762 2.073 8.711
Source: Authors’ computations from study sample
Table 4.30 shows hazard ratios estimated from Cox regression. The Table shows that the survival
of businesses is most strongly influenced by 8 of the 28 predictor variables used for the survival
analysis. These eight (8) influential variables are the ability to generate profits, ability to convert
profits back into investment, easy access to micro credit, adequate technical capacity, regular
contact with loan officers, entrepreneurs’ level of education, regular participation in micro
finance programmes, and mandatory micro savings. The most influential predictor variable
affecting the survival of businesses is the ability to generate profits on a sustainable basis. Table
136

4.30 shows the ability to generate profits regularly and easy access to micro credit as the top two
prominent predictor variables of survival in our estimated equation. However, based on the
Pearson chi-square test of association, both predictor variables are significantly associated with
regular participation in microfinance (p 0.001). This shows clearly that the significance of the top
two predictor variables is attributed to regular participation in microfinance programme.
Microfinance programmes particularly those based on group lending schemes, provide members
with services that are essential for viability and long-term survival. Examples of such services
are saving opportunities (which make it easy for them to convert part of the profits made back
into investment through regular but small amounts of savings), easy access to micro credit,
weekly repayment schedule, the sharing of business skills and networking/exchange
programmes, the promotion of personal discipline, hardworking and creditworthiness. Such
benefits clearly contribute to viability and long-term survival among regular users of
Microfinance Banks in a group setting. Members of a group are constantly motivated to invest
credit monies wisely to avoid the likelihood of enterprise failure. Hence, although the ability of
businesses to generate profits regularly is the most influential variable affecting the survival of
small businesses, it must be noted that the ability to generate profits depends on many other
variables such as macroeconomic environment, participation in microfinance and other
entrepreneur and firm level characteristics such as level of participation in entrepreneurial
training, firm age, firm size and entrepreneur level of education.
This study shows that regular participation in microfinance and regular contact with loan officers
are commonly used strategies for accumulating savings, making profits, and ultimately
converting capital back into investments. The hazard ratio of the variable ‘no regular
participation in microfinance’ is 1.10. This shows that businesses that do not participate regularly
in micro finance are 1.10 times more likely to fail in comparison with businesses that participate
regularly in microfinance programmes. The hazard ratio of the variable ‘no conversion of profits
into investments’ is 1.88. This shows that businesses that do not have the capacity to convert
profits generated into profitable investments for the enterprise are 1.88 times more likely to fail
in comparison with businesses that have the capacity to convert profits made into profitable
investments. The hazard ratio of the variable ‘ability to generate profits’ is 7.50. This shows that
137
businesses that failed to generate profits regularly are 7.50 times likely to fail in comparison with
businesses that generate profits. The hazard ratio of low technical capacity is 3.08. This shows
that businesses with low technical capacity are 3.08 times likely to fail compared to businesses
with high technical capacity. The hazard ratio of ‘no regular contact with loan officers’ is 4.73.
This shows that businesses with irregular contact with their loan officer are 4.73 times likely to
fail compared to businesses that have regular contact with their loan officers. The hazard ratio for
businesses that are operated by owners with low levels of education is 3.30. This implies that
businesses operated by owners with low level of education are 3.30 times more likely to fail in
comparison with businesses that are operated by owners with a moderate level of education. This
shows that formal education is positively correlated with small business survival. The hazard
ratio of the variable, ‘no easy access to micro credit’ is 7.47. This shows that businesses that
cannot easily access micro credit are 7.47 times more likely to fail than those that can easily
access micro credit. Finally, the hazard ratio for the variable, no mandatory savings is 2.76. This
shows that businesses that do not participate in mandatory savings are 2.76 times more likely to
fail than those that are involved in mandatory savings.
Adjustment was made for three potential confounding variables: category of business, legal
status of business and kind of business activity. Unadjusted and adjusted hazard ratios did not
differ significantly. This shows that none of the three variables used for adjustment was a
confounding or effect modifying variable as far as survival analysis is concerned. The adequacy
of the fitted Cox model was assessed using log-minus-log plots, the likelihood ratio test and the
AIC (Akaike’s Information Criterion) as diagnostic procedures. All log-minus-log plots were
parallel, showing that the assumption of proportional hazards was satisfied. The p-value from the
likelihood ratio test was small (0.0001 < 0.05), thereby showing that the 8 variables constituting
the fitted Cox model were jointly efficient in explaining the long-term survival at the 5% level of
significance.
The key objective of this aspect of the study is to test the ability of microfinance to enhance
small business survival and to identify influential variables that affect the survival of micro and
small enterprises (MSEs), particularly in assessing the degree of importance of participation in
138

microfinance for promoting viability and long-term survival of micro and small enterprises. Each
of the 8 predictor variables in Table 4.30 is highly significant at the 5% level of significance.
Table 4.31, below presents a summary of results obtained for the estimated equation. The log
likelihood of 101.493 is high and significant at 5%. When compared with the critical Chi square
at 5% = 31.4. This led to our decision to reject our null hypothesis and accept our alternative
hypothesis. Because the Chi square calculated is higher than the critical Chi square, we conclude
that microfinance enhances the survival of small businesses financed by Microfinance Banks.
Table 4.31 Overall Statistics for Cox Regression
Omnibus Tests of Model Coefficients(a,b)
-2 Log
Likelihoo
d Overall (score)
Change From Previous
Step Change From Previous Block
Chi-
square Df Sig.
Chi-
square df Sig.
Chi-
square Df Sig. Chi-square
101.493 11 .002 29.347 11 .002 29.463 11 .002 29.463
Source: Authors’ computations from study sample
a Beginning Block Number 0, initial Log Likelihood function: -2 Log likelihood: 130.956
b Beginning Block Number 1. Method = Enter
4.8 Multiple Regression Analysis
The field survey for this study was carried out between October and December 2009, on factors
that influence growth and survival of Small and Micro Enterprises in South-West Nigeria. The
first part of the questionnaire was filled by the small business operators using standard
definitions of key concepts (particularly to measure such variables as gross profit margin, sales
growth, productivity, and capital employed micro loan and micro savings). The second part of
the questionnaire contained information on the business enterprise extracted from bank records
with the help of Loan Officers who work directly with the respondents. It is a five-year summary
of the business enterprise on loan history and savings as well as sales, profits, capital employed
and assets.
139

The samples were designed to cover all firms that had stayed with the Microfinance Bank for a
period of at least five years and had received microloan at one point or another in the period
covered. The success of the survey is attributed to the fact that the researcher had the support of
the Loan Officers in approaching the enterprise operators. Out of 623 of such enterprises, 502
results were useful. The data collection combined a survey of small business operators and
extracts from bank records collected over a period of five years on some variables, as well as an
interview session with Senior Officials of the Banks to document the nature, process and
operations of microfinancing in Nigeria.
Since our main goal is limited to the “internal validity” and issue of assessing “the effect of
treatment on the treated.” Our micro loan figures were extracted from the banks records directly
and not just relying on the respondents for the information. When we segregate the analysis to
see the effect common to a segment such as the legal status of the business, the coefficients are
identified off the variation within each sampled firm. The results from this analysis may be
generalized only to enterprise similar to those in our sample, that is firms that are consistently
been finance by MFBs over a minimum of five year periods and one should be cautious about
extrapolations to firms lacking a common statistical support.
A major problem that users of our MFB ‘sample’ could encounter would be if firms are giving
loans based on their expected growth in subsequent years. Although we have been concerned
about this possibility, there are several reasons why it seems unlikely that the possibility would
produce bias in our data. First, as in the case of many MFBs, the loan agencies evaluate loan
applications based on the credit history and particularly the previous cash flow of the applicant,
and they do not even request a business plan for the future. In nearly all cases, no collateral is
required but a satisfactory guarantor. Second, the segregation of equation to isolate certain
variables as peculiar to a particular segment gives a more realistic view of different position and
thirdly, we include other variables to control for differences in demand conditions for
microfinance. Among these variables are firm level characteristic variables such as business age,
business size, business location, registration status, and type of business activities. The presence
of MFBs in the state where the enterprise operate can influence their access to micro loan and
140

other credit as may be available. Other facts, such as managerial assistance, technical assistance,
and regular contact with Loan Officers go a long way to affect the growth and business
performance of an enterprise. A firm operating in a place like Lagos is more likely to get all the
experts help as may be require for business growth.
Another type of selection bias could result from the fact that our database includes more
surviving firms; but worthy of mention is the fact that some firms may be inactive, particularly
as seen in the data; there are firms that do not get the loan continuously for two years. It should
be noted that factors that increase growth also tend to raise the probability of survival of an
enterprise. This suggests that our estimates of the effects will be understated, if not put in proper
perspective, an obvious caveat about our results if not properly stated.
Effects of Microfinance on Small Business Growth by Category of Business
Table 4.32 below presents results from the regression of the average sales growth rates on
different variables characterizing the firms and microfinancing. The equation in column I of
Table 4.32 represents the total sample. In columns II and III we split the sample into small firms
and micro firms. Column II presents observations from small firms (firms with more than 10
employees), while in column III we present observations from micro firms (firms with less than
10 employees). This classification into small and micro firms is based on the definition applied
by the National Policy sponsored by SMEDAN in 2007 and adopted for implementation by the
National Assembly. Our dependent variable is defined as average sales growth during the five-
year study period of 2004 – 2008. The constant, which is the intercept, shows that when all the
variables are zero, sales will grow at 15.3% for the total sample and at 9% and 16% for small
firms and micro firms respectively. The results obtained for the three columns are all significant
at 1%.
On impact of owner characteristics variables on the expansion capacity of MSEs, the result
obtained shows that entrepreneur’s age has a positive relation with the expansion capacity of the
firm but it is not statistically significant for the three samples. The result obtained for owner’s
education shows positive relationship between different level of education and expansion
capacity of the MSE, but of all the different level of education tested, only OND/NCE and
141

university education for small firm are statistically significant. The result shows that for a unit
increase in OND/NCE education level of MSE entrepreneurs, sales will growth by 0.30%,
0.18%, and 0.24% for the total sample, small firms and micro firms respectively; the result
obtained for total sample is statistically significant at 5% while result obtained for small firms
and micro firm’s samples are statistically significant at 10%. The result also shows a significant
relationship between university education and small firm growth. The result shows that a unit
increase in university education will increase sales growth of small firm entrepreneurs by 1.8%
and it is statistically significant at 10%. The result obtained can be relied upon for inference and
it has correct sign as expected in small business theory. Cressy (2006), Salim (2005), and Daniels
and Mead (1998) suggest that the differences in the growth trajectories of enterprises may be due
to heterogeneity in the ability, management and/or ambition and drive of entrepreneurs. More
educated/skilled entrepreneurs may have better start-up conditions, for example in the form of
capital saved from earlier employment (Makasure et al. 2008). On the marital status of the
entrepreneurs, the result obtained shows that the marital status of the entrepreneurs does not have
any significant impact on sales growth. The result only shows a negative impact between widow
and sales growth but the result obtained is not significant, hence it cannot be used for inferences.
On gender, only the result obtained from the micro firm samples shows a statistically significant
impact of female gender on the expansion capacity of micro firms. The result shows a positive
relationship between female gender and micro firm expansion and it is statistically significant at
5%. The gender of the entrepreneur may also affect firm growth. Male – owned enterprises tend
to perform better and over time grow faster relative to female-owned enterprise (Daniels and
Mead, 1998; Fafchamps & Gabre-Madhin, 2001).
Women are often disadvantaged by less education and constrained by social norms which limit
their mobility and access to other productive resources (Fafchamps, 2003; Mitra, 2002). The
result obtained from this study shows that female owned micro enterprises thrive better under
microfinance arrangement and it is significant at 5%.
Table 4.32 Multiple Regression Analysis of Effects of Microfinance on Small Business Growth by Category of Business
Column ITotal SampleCoefficient t- statistics
Column IISmall FirmsCoefficient t-statistics
Column IIIMicro FirmsCoefficient t- statistics
Constant 15.320* 8.561 9.001* 6.581 16.631* 5.588Owners Characteristics Owner’s age 0.858 1.002 0.786 1.134 1.231 0.982
142

Education–No formal 0.061 0.812 1.051 0.101 0.056 1.114Primary education 0.012 0.544 0.102 0.845 0.196 1.329Secondary Education 0.719 0.433 2.111 1.432 1.010 1.490OND/NCE education 0.306** 2.561 0.180*** 3.062 0.242*** 1.852B.Sc Education 0.132 1.444 1.822*** 1.501 1.011 1.227M.Sc/PhD Education 0.001 1.127 1.161 0.120 0.012 1.135Marital Status-Single 0.081 0.114 0.031 0.561 0.008 0.916Marital Status-Married 1.452 0.871 0.239 0.222 1.011 1.016 Separated/Divorced 0.345 1.418 0.124 0.671 1.017 1.010 Widowed -0.113 -0.772 0.118 0.891 -0.216 -1.022Gender – Female 0.562 0.113 1.314 1.014 0.886** 3.217 Male 0.012 0.548 0.052 1.489 0.423 0.810Firm CharacteristicsFirm age -0.014*** -1.612 -0.075** -2.515 -1.924*** -1.823 Business formation - sole proprietorship
0.210 1.121 0.524 1.002 0.552 1.014
Partnership 0.222 0.188 0.341 1.099 1.013 0.681Family business 0.018 1.488 0.231 1.013 0.090 0.518Firm Size 0.111** 3.713 -0.022* -5.912 0.381** 2.645Bus. location- urban area 0.053* 5.569 0.089* 4.225 0.018** 2.164Bus. location- rural area 0.189 0.102 1.120 1.019 0.008 0.771Business registration 0.027* 3.158 0.052** 2.041 0.045 1.003Microfinance characteristicsSize of asset loan 0.034 1.393 0.167 0.811 0.014** 2.598Duration of asset loan 4.403 0.187 1.508 1.448 0.108* 1.872Repayment of asset loan -0.079 -1.128 -1.911 -0.721 -0.693* -4.814Loan Utilization 0.048 1.212 0.846 1.131 0.041* 5.116Technology training received
0.029** 3.586 1.057* 6.681 0.114** 2.123
R – squared 0.321 0.352 0.271Adjusted R-Squared 0.281 0.311 0.211No. of Observation 502 135 367F-test statistics 0.362(0.4117) 0.385(0.551) 1.237(0.340)
Source: Field survey, 2009
The effect analysis of microfinance on Micro and small Enterprises (MSEs) expansion. The dependent variable is sales growth over a five-year period between 2004 and 2008. Column 1 presents the result of the total sample, column II and column III split the data into firms with ten or more employees and less than ten employees respectively. Note * = 1% level of significance ** = 5% level of significance *** = 10% level of significance
The result obtained on firm characteristics variables shows that business age has an inverse
relationship with small business growth and expansion capacity proxy by average sales growth.
The general pattern between firm age and growth seems to be that young firms are more likely to
grow faster. The result shows that a unit increase in firm age will decrease sales growth by
0.01% for the total sample and 0.07% and 1.9% for small firms and micro firms respectively, and
143

they are all statistically significant at 10% for the total sample and micro firms respectively and
at 5% for small firms’ sample.
This implies that older firms grow less rapidly than younger firms. Davidson et al. (2002), Almus
and Nerlinger (1999) also find an inverse relationship between firm age and growth. The result
obtained confirms previous findings on the relationship between firm age and growth. The
variable takes a negative and statistically significant coefficient in all the three columns
suggesting that younger firms grow faster than older firms. The result obtained on form of
business formation shows that there is a positive relationship between the three forms of business
in the study, that is, sole proprietorship, partnership and family business and firm growth, but the
result obtained is not statistically significant; hence it cannot be use to make inferences. On
business size proxy by number of paid employees in the business, the result obtained shows a
positive and highly significant sign for the total sample and micro firms, but a negative and
statistically significant coefficient for small firms. This suggests that the growth rate initially
increases with firm size, but then starts to decrease after a certain level; this may be due to
introduction of technology into the business. The result obtained on the relationship between
firm growth and firm size in other studies is equally unanimous especially, in most studies on
small firms. Caves (1998) found a positive relationship between firm size and growth, while
Eyiah and Cooks (2003) found a negative relation although they used data on larger firms. The
result obtained on business location shows a positive and highly significant coefficient between
urban location and firm growth for the three samples. Storey (1994) suggests that there are some
locations in which firms are more likely to grow faster. He provides evidence using U.K. data
and proof that firms located in a rural area can be expected to grow faster than those in urban
areas. Almus and Nerlinger (1999) use regional population density as their location variable, and
find weak evidence that location affects growth. Their findings show that firms located in
densely populated areas exhibit higher growth rates. The result obtained in this study shows that
businesses located in urban area grows faster than businesses located in the rural areas and it is
statistically significant at 1% for total and small firm sample, and 5% for micro firm. While the
result obtained for rural location do not have significant impact on firm growth. This may be as
result of their ability of businesses in urban areas to be able to access other facilities that would
144
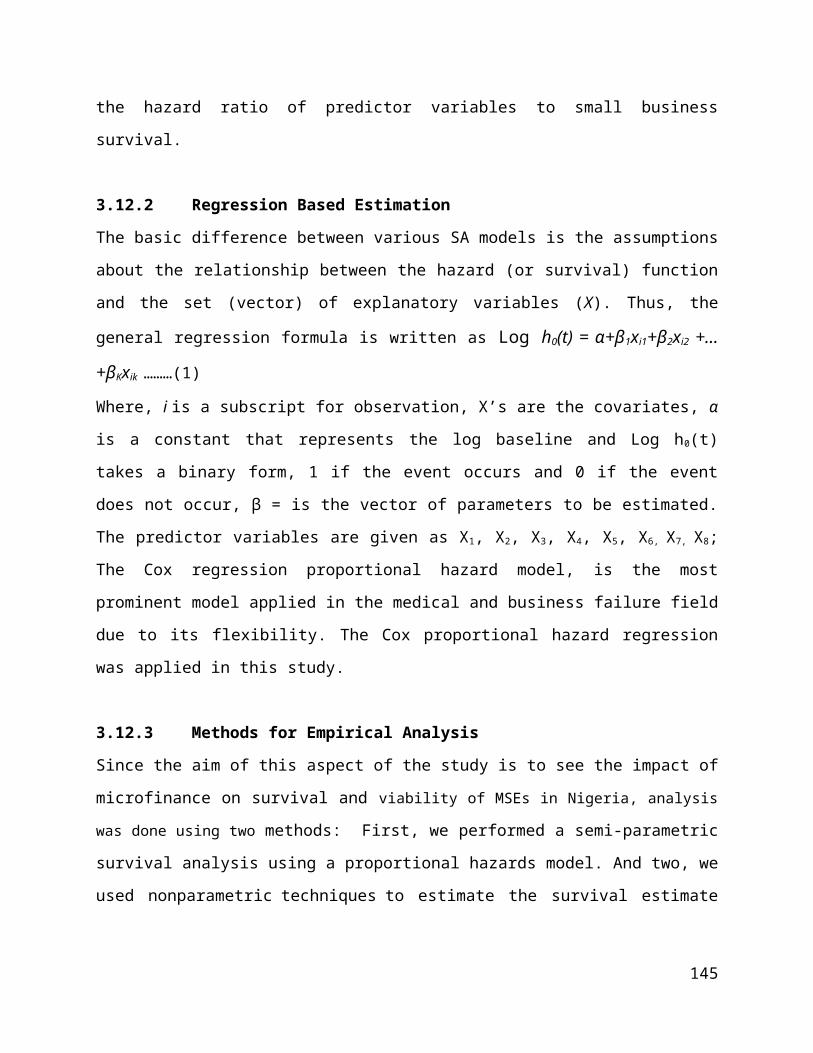
engender business growth such as access to technical assistance, entrepreneurial training,
networking and so on.
On business registration status, it is observed from our data that the firms sampled operate as
both registered and unregistered firms. Results from previous studies show that registered firms
grow faster than unregistered firms. In large firms, registration enhances credibility, opens up
access to rationed resources and reduces transaction costs when dealing with other firms and thus
aids growth and performance (Sleuwaegen & Goedhuys, 2002). This is interpreted to mean that
registered firms owners are more willing to invest in risky ventures that may foster firm growth
than unregistered business owners since most of them are more likely to make use of internally
generated funds. Mitullah (2003) shows how an unregistered and unprotected environment in
cities is not conducive to business, with entrepreneurs being constantly disrupted by municipal
authorities in conflict over licensing, taxation, site operation, sanitation, and working conditions.
The result obtained in this study shows a positive and significant relationship between business
growth and registered business for the total sample and for small firms, though the result
obtained for the micro firm sample shows a positive relationship, but it is not statistically
significant. Most of the firms in the micro firm samples are unregistered businesses.
On microfinance variables, result on size of assets loan on expansion capacity of the MSEs
shows that a unit increase in assets loan will increase sales growth by 0.03% and 0.16% for total
sample and small firms respectively, but the result obtain is not statistically significant, hence it
cannot be relied upon for any inference, even though it is correctly signed as expected in
microfinance theory. For the micro firm sample, the result obtained shows a positive correlation
between size of asset loan and firm growth and it is significant. This implies that small loans
enhance the trading capacity of the micro entrepreneur. This may be that the size of the loan is
too small for any meaningful impact on small firms, but appropriate for the level of activities in
micro firms. Duration of asset loan shows a positive correlation with sales growth for the three
samples, but it is not statistically significant for the total sample and for small firms, meaning
that the duration of the asset loan is too short for any meaningful impact on the expansion
capacity of MSEs. The result obtained for micro firms sample shows that if the duration of asset
145

loan is increased by one month, annual sales growth will increase by 0.1% and it is statistically
significant at 5%. This may be that the asset loan duration is suitable for micro firms only.
On repayment of asset loan, the result obtained shows a negative correlation with sales growth,
and is in support of economic theory because of the frequency of repayments but negates micro
finance theory. The result obtained for the total sample and small firms reveals that as the
frequency of repayment is increased, sales growth will decrease by 0.07% and 1.9% respectively,
although the result obtain is not statistically significant; hence the result cannot be relied upon
for making inferences. But for micro firms, the result reveals that a unit increase in repayment
period will cause annual sales growth to decrease by 0.6% and it is statistically significant at 1%.
On utilization of asset loan, only the result on micro firms is reliable and statistically significant
at 1%, but the result for the total sample and small firms is not statistically significant.
On technology related training received by the entrepreneurs, the result obtained shows that
technology-related training received by entrepreneurs significantly affects sales growth, thereby
enhancing the expansion capacity of MSEs. Specifically, the result shows that a unit increase in
technology-related training received by the entrepreneur will cause annual sales growth to
increase by 0.029% for the total sample and by 1.0% and 0.1% for small firms and micro firms
respectively. They are all statistically significant at 5% and 1% respectively. Previous studies
provide strong evidence of a positive association between the use of technology and business
performance, with observed differences in profit level across enterprises and sectors reflecting
varying innovative environments (Bigsten et al., 2003; Chapelle & Plane, 2005; Daniels, 2003).
The coefficient of determination that is the R2 for the three columns is 0.32, 0.35 and 0.27 for the
total sample, small firms and micro firms respectively and the adjusted R2 of 0.28, 0.31 and 0.21
shows the level of variation in the dependent that is explained by the independent variables in the
three samples. The R2 obtained in this study is acceptable for panel data like we have in this
study.
The decision rule is that we reject the null hypothesis, if the calculated F-value is greater that the
critical F-value. In this case, the calculated f-value is 0.362 while the critical f-value is 1.94, so
we accept our null hypothesis. Besides, the calculated f-value is not statistically significant.
146

Hence we can conclude that microfinancing as practiced by Micro Finance Banks in South-West
Nigeria does not enhance MSEs’ growth. But variables such as Entrepreneur’s education, firm
age, firm size, firm location and firm registration enhance sales growth, while other factors like
size of asset loan, duration of asset loan and frequency of repayment of loan do not enhance sales
growth.
Multiple Regression Analysis of Effect of Microfinance on Small Business Growth by Legal
Status of Business
Table 4.33 presents the results obtained when the total sample was split into registered and
unregistered businesses. From the business characteristics Table 4.33, only 171 enterprises of our
sample study are registered businesses, the remaining 331 are unregistered businesses. Column I
present the results obtained for registered businesses and in column II is the results obtained for
unregistered businesses. The constant, which is also the intercept, showed that when all variables
are zero, annual sales growth, which is the proxy for MSE expansion, will grow at 21.1% and
10.6% for registered and unregistered businesses respectively. The result obtained for registered
businesses is statistically significant at 1%, but the result obtained for unregistered businesses is
not statistically significant. The result obtained from owner’s characteristics variables shows that
entrepreneur’s age has a positive correlation with MSEs’ growth, but the coefficient is not
significant. The result for owner’s education at different level also show positive correlation
between level of education and sales growth but none is statistically significant except University
Education for registered businesses. The result shows that as University Education increase by 1
unit MSEs’ growth will increase by 0.01%, the result obtained is statistically significant at 5%
for registered businesses, but for unregistered businesses, though it is correctly signed, it is not
statistically significant. The coefficient for marital status shows a positive correlation between
married marital status and business growth for registered and unregistered businesses and it is
significant at 10% and 5% respectively. The result also show negative correlation between
separated, divorce and widowed and business growth for registered business but the result is not
statistically significant. This implies that being married enhances business growth. The fact that
entrepreneurs have family to cater for may be one reason why they work harder to be successful
in their business. The coefficient for female gender shows a positive relationship between
147

female gender and MSEs’ expansion and statistically significant at 10% for micro firm samples
while the result for male gender is positive also but not statistically significant.
With respect to firm characteristics variables, the result obtained for firm age shows an inverse
relationship between firm age and MSEs’ growth, which implies that younger firms grow faster
than older ones and as firm age increases growth rate declines. The coefficients obtained are
statistically significant at 1% and 5% for registered and unregistered businesses respectively.
Form of business reflects type of business formation, sole proprietorship, family business or
partnership business. The result obtained shows there is a positive correlation between the three
forms of business and business growth but the result obtain is not statistically significant. The
result on business size shows a positive correlation between business size and MSE growth and
the result obtained is statistically significant for both registered and unregistered business at 1%
and 5% respectively.
Geographical location, that is location where businesses are situated have considerable impact on
enterprise growth and performance (Makasure, 2008). Relative to those in rural locations, urban
based enterprises tend to have better access to a range of resources that are critical to enterprise
growth and performance including infrastructure, working inputs, larger and more dynamic
market, and opportunities for networking with larger firms and within the enterprise sector
(Bogetic and Sanogo, 2005; Sheilds, 2005). At the same time (Gabre-Madhin, 2001) shows that
sectorial variables are important determinants of enterprise growth regardless of location. The
result obtained for this study shows that registered and unregistered businesses situated in urban
Table 4.33 Multiple Regression Analysis of Effect of Microfinance on Small
Business Growth by Legal Status of Business
Column IRegistered Business
Column IIUnregistered Business
148

Coefficient t-statistics Coefficient t-statisticsConstant 21.171* 12.881 10.658 7.418Owners CharacteristicsEntrepreneur’s Age 0.182 1.045 0.025 0.743Education – No Formal Education -1.313 -0.768 0.018 0.501 Primary Education 0.120 1.282 0.033 0.881 Secondary Education 0.415 0.458 1.011 0.620 OND/NCE Education 1.068 1.210 0.141 1.490 B.Sc Education 0.019** 1.718 0.075 1.224 M.Sc/Ph.D Education 0.006 1.228 0.561 0.691Marital Status- Single 0.117 1.617 0.432 1.178Marital Status- Married 0.050*** 2.115 0.061** 2.804 Separated/Divorced -1.041 -0.119 0.066 0.089 Widowed -1.044 -0.331 0.004 0.718Gender –Female 0.027 1.158 0.022*** 1.541 Male 0.078 1.361 0.017 1.091Firm CharacteristicsFirm age -0.016* -4.902 -0.023** -2.523Form of Business -Sole proprietorship 0.210 1.121 0.005 1.002Form of Business –Partnership 0.075 1.224 0.011 0.220Form of Business –Family business 1.022 0.120 0.011 0.203Business Size 0.186* 5.613 0.222** 2.702Business location - Urban area 0.015* 2.269 1.089* 3.405Business location - Rural area 0.510 0.261 1.017 1.306Microfinance CharacteristicsSize of asset loan 0.049 1.273 0.716 0.211Duration of asset loan 0.403 1.187 0.508 1.248Repayment of asset loan -0.011* -4.128 -1.110* -5.721Loan Utilization 0.035 1.112 0.460** 1.631Technology training received 0.028** 2.586 1.019* 3.811
R – squared 0.331 0.261Adjusted R-Squared 0.282 0.222No. of Observation 367 135F-test statistics 0.142(0.7020) 0.463(0.1105)Source: Field survey, 2009Note * = 1% level of significance ** = 5% level of significance *** = 10% level of significance
With respect to the effect of microfinance on Micro and Small Enterprises (MSEs) expansion, the dependent variable is sales growth over a five-years period. Column 1 presents results for registered business and column II for unregistered business respectively.
location have tendency to grow faster than businesses situated in rural location. The result is also
statistically significant at 1%.
149

The results obtained for microfinance variables are as follows. On size of asset loan, the result
obtained reveals that if asset loan is increased by a unit, annual sales will grow by 0.04% for
registered business, and 0.7% for unregistered businesses but the result obtained is not
statistically significant, meaning that it cannot be relied upon to make inferences. Note that most
of the unregistered businesses fall in the category of micro firms, in which small amount of loan
is appropriate for expansion, but for most small business operators, small amount of loan may
not be appropriate for business growth. Most small firms fall in the category of registered
businesses.
On duration of asset loan, the result revealed that extension of asset loan by one month will
increase annual sales growth by 0.4% for registered business and 0.5% for unregistered
businesses, they are both not statistically significant. On repayment of asset loan, the result
obtained shows that as repayment period increase by a unit, annual sales growth which is the
proxy for MSEs expansion decrease by 0.01% for registered businesses and 0.1% for
unregistered business. This is in line with economic theory, but contrary to micro financing
theory. The results obtained for registered and unregistered business are both statistically
significant at 1%.
On technology related training received by the entrepreneurs, the result obtained shows that if
the training activities increased by one unit, annual sales growth will increase by 1.2% for
registered business operators, and 0.08% for the unregistered business operators. They are both
statistically significant at 1% and 10% respectively. This means that technology-related training
enhances business growth. Indeed, appropriate technology enhances business growth; however,
for the majority of MSEs, the composition and value of the capital stock tend to be low and, as a
consequence, are considered to have a relatively small impact on performance and growth
(Chowdhuty & Wolf, 2003; Daniels & Meads, 1998; Fafchamps & Gabre-Madhin, 2001).
Results obtained for loan utilization reveal that the correct utilization of loan received enhances
business expansion for registered and unregistered businesses at 5.8% and 0.8% respectively.
The results obtained are not statistically significant for both registered and unregistered
businesses.
The adjusted R2 of 0.28 and 0.22 for registered and unregistered businesses respectively are both
acceptable for a cross sectional data, like we have in this study. The overall F-values obtained for
150

the two samples are 0.142 and 0.463 and none is statistically significant. Hence we accept the
null hypothesis which states that microfinance does not enhance MSE expansion in South-West
Nigeria, and reject our alternative hypothesis.
Multiple Regression Analysis of Effect of Microfinance on Small Business Growth by
Category of Kind of Business Activities
Table 4.34 present the result on the expansion capacity of MSEs which was also split into kind of
business activities in order to identify the variables that are significant for different kinds of
trade. To facilitate comparison across the different sectors of the economy as used in this study,
the significance and marginal effects of explanatory variables are discussed in the order of
appearance across the five models. As expected there is substantial variation of growth
performance both within and across individual sectors and firm characteristics as well as
microfinance variables. The observed differences in enterprise growth and performance across
sectors reflect the general business environment in which enterprises operate and its effect on
specific sector/market structures, including the level of financial and human capital, value
added/output per employee, nature and level of competition and ability of firms to adapt their
pricing policy to internal and external changes (Fafchamps & Gabre-Madhin, 2001). For
example, performance in the manufacturing sub-sector is affected by inefficiency, poor
regulation and other structural problems including seasonal fluctuations in operations (Fagbenle,
Adeyemi & Adesanya, 2004).
The coefficient on entrepreneur’s age is positive and significant in all models at 5% significant
level except in the manufacturing and artisan sectors. The positive correlation in result obtained
is similar to result obtained in previous study (see Fasoranti et al., 2006). The entrepreneurs’ age
signifies the level of contribution they are able to bring into the business. The characteristic table
shows that 79% of the total sample fall into the economic active age group, that is, age-group 25
– 54 years. All things being equal, they have the capacity to contribute significantly to the
Table 4.34 Multiple Regression Analysis of Effects of Microfinance on Small
Business Growth by Category of Kind of Business ActivitiesColumn ITradingCoef t-stat
Column IIArtisanCoef t-stat
Column IIIManufacturingCoef t-stat
Coulmn IVAgricultureCoef t-stat
Coulmn VServiceCoef t-stat
Constant 7.613* 0.000 6.581 0.006 2.071* 3.145 5.128** 1.566 3.633 1.128
151

Owners CharacteristicsAge 0.218** 1.725 0.003 0.319 0.135 1.049 0.233** 1.644 0.017** 1.830Education- no formal 1.079** 1.807 0.987** 2.624 0.088 1.212 0.311* 4.884 0.308 1.067-Primary Education 0.030 1.403 0.124 0.180 0.312 1.218 1.330 0.941 0.181 0.081-Secondary Education 2.012 1.449 0.009 1.361 0.021 0.321 0.033 1.032 0.981 0.442-OND/NCE 1.650** 3.515 0.093 1.004 0.671** 1.700 1.208 0.890 0.401** 1.940-B.Sc Education 0.881 1.211 1.812 0.899 1.012 1.808 0.045 1.088 1.011 1.411-Professional Educ. 0.102 1.511 0.032 0.611 0.056 1.551 0.090 1.448 0.332 1.421Marital Status-Single 0.301 1.103 0.214 0.810 0.122 1.128 1.033 0.491 0.086 0.811Marital Status-Married 1.012** 1.549 0.209** 1.661 0.210** 1.821 0.531 1.022 0.881 0.342-Separated/Divorced 0.008 1.003 0.432 0.810 0.123 1.127 1.031 0.411 0.180 0.011Widowed 1.012 1.049 0.009 1.361 0.021 0.321 0.033 1.032 0.981 0.424Gender – female 0.702 ** 1.815 0.123** 1.561 0.004 0.343 0.923 0.332 1.236* 5.756Gender- Male 1.050 1.015 0.013 1.214 0.716** 1.501 1.208 0.890 0.301 1.490Firm CharacteristicsEnterprise age 0.415* 6.702 1.230** 2.622 0.113** 2.175 0.059* 4.928 0.073** 1.932 Business formation –Sole proprietorship
0.710 1.021 0.006 1.402 1.063* 1.058 0.042 0.194 0.022 0.584
Partnership 0.101 1.211 0.021 0.116 0.056 1.451 0.010 1.048 0.321 1.221family business 0.301 1.103 0.214 0.810 0.122 1.128 1.033 0.491 0.086 0.811Business Size 0.618* 5.813 0.653** 2.402 2.314* 4.888 1.238 0.980 0.149 1.973Business location- Urban
0.515* 3.266 1.109* 4.115 0.321** 1.821 0.024* 2.879 0.182* 3.491
Business location – Rural area
1.122 1.011 0.032 1.011 0.065 1.451 0.091 1.348 0.232 1.021
Microfinance CharacteristicsSize of asset loan 0.409 1.093 0.161 0.511 -0.027* -4.715 -0.01** -1.891 0.041 1.226Duration of asset loan 0.058 0.870 2.022 1.481 0.099 1.141 1.366 0.202 0.010* 3.912Repayment of asset loan
-0.312** -1.728 -1.710* -4.890 -7.502** -1.913 1.293 1.020 1.331 0.619
Loan Utilization 0.077* 3.581 1.367 1.231 2.041** 1.886 5.013 1.123 0.051 0.581
Technology training
received
0.044** 2.685 1.036* 5.962 5.666* 4.715 5.591** 1.999 1.752 0.429
R – squared 0.381 0.335 0.301 0.312 0.321
Adjusted R-Squared 0.322 0.299 0.255 0.226 0.219
No. of Observation 238 86 54 89 33
F-test statistics 2.892 (0.506) 0.821 (0.423) 1.133 (0.118) 0.189 (0.123) 1.182 (0.309)
Source: Field survey, 2009 Note * = 1% level of significance, ** = 5% level of significance *** = 10% level of significance. The effects analysis of microfinance on Small and Micro Enterprise expansion by kind of business. Column I to column V are as detailed below.growth of the enterprise. The coefficient for education shows a positive correlation between
different level of education and firm growth in all sectors studied, but only OND/NCE level of
education is significant at 5% for trading, manufacturing and service industry. The level of
education attained by the entrepreneur is important in determining how business is managed. The
152

condition at start-up such as the form of capital saved from earlier employment and ability to
access more capital and accumulate wealth are all determined by level of education attained by
the entrepreneur (Makasure et al, 2008).
Professional education is also found to be significant for the trading sector. The coefficient for
marital status-married is found to be positive and significant at 5% for the trading, artisan and
manufacturing sectors and insignificant for the agriculture and service sectors, while the
coefficient separated/divorced is found to negatively impact on firm growth in the manufacturing
sector but it is not statistically significant. The coefficient for female gender is positive and
significant at 5% in the trading sector at 5%, among artisans also at 5% significant level and at
1% in the service sector. The effect of gender (Female) is not significant in the manufacturing
and agricultural sectors. Although the literature shows that male-owned enterprises tend to
perform better and over time grow faster relative to those owned by female entrepreneurs
(Daniels and Meads, 1998). Women’s inability to perform better in enterprise management is
summarised to women’s relative less education and inability to access productive resources
(Fafchamps, 2003). This study shows that micro-financing is suitable for female entrepreneur,
because there is a positive relationship between female gender and enterprise growth. This
implies that being a female is not a constraint to small business growth when the business is
finance by microfinance institutions. The coefficient for male gender is shown to be significant
at 10% in the manufacturing and agriculture subsectors.
On the firm characteristics variable, the coefficient on enterprise age is positive and significant in
all models at 5% and 1% across the five models. The number of years during which the
enterprise had operated in the years preceding the survey is positively associated with firm
growth. The size of the coefficients across the five models suggests variability in the level of the
impact enterprise age had on the growth of the enterprise, for example, a year increase in
enterprise age among artisans will bring about 1.2% increase in growth of the enterprise, while it
is just 0.4% in the trading sector and 0.1% in the manufacturing sector. The coefficient for form
of business is positive, but not significant across the five models. The coefficient for business
size is positive and significant across the five models except for agricultural sector. This may be
due to the fact that most agricultural businesses particularly at the micro and small levels as we
153

have in this study make use of family members instead of paid employees who are more
motivated and more skilful (Frazer, 2006). The Table shows the coefficient for geographical
location to be positive and significant across the five models implying that businesses located in
the urban areas are more likely to thrive better in South-West Nigeria. Geographical location can
have a substantial impact on microenterprise performance. Urban-based enterprises tend to have
a better access to a range of resources that are critical to enterprise growth and performance such
as infrastructure, working inputs, larger and more dynamic markets, and opportunities for
networking with larger firms and within the micro enterprise sector (Bogetic and Sanogo, 2005;
Fafchamps, 2004).
On micro finance characteristics, the coefficient for size of asset loan shows negative and
significant impact for manufacturing and agricultural sectors, while positive and insignificant
impact for trading, artisan and service sector. The coefficient for duration of asset loan shows a
positive but not significant relationship between asset loan and sales growth across the five
models except for the service sector which is positive and significant at 1%. On repayment of
asset loan, the result obtained shows an inverse relationship between repayment of asset loan and
annual sales growth for enterprises in the trading, artisan, and manufacturing sectors, but the
result obtained for agriculture and service sectors is positive but not significant. The result
obtained is statistically significant for trading, manufacturing and artisans. This implies that
attempts to recover Asset loan early impact negatively on entrepreneurs in the trading,
manufacturing and artisan sub-sectors. On loan utilization, only the coefficient for trading and
manufacturing is positive and significant at 1 and 5% respectively, the other are not significant.
On technology trading received, the entire coefficient is positive and significant at 1% and 5%
level of significance. The coefficient for manufacturing and agriculture is large at 5.6% and 5.5%
respectively, compared to others. What this implies is that, technology-related training received
by entrepreneurs translates into small business expansion. The adjusted R2 for cross section data
is accepted at the level it is for all models, but the overall f-value statistics is not significant for
all the models except for the trading sector. This implies that the null hypothesis is accepted for
all the models, except for trading sector where the alternative hypothesis is accepted. This further
implies that microfinance enhances business growth in the trading sub –sector alone.
154

Multiple Regression Analysis of Effect of Microfinance on Small Business Operators
Productivity by Category.
Table 4.35 below presents results from the regression of micro-financing variables on
Entrepreneur’s productivity. The result in column I of the Table represents the total sample. In
columns II and III we split the sample into small and micro firms. Column II presents
observations for small firms (i.e. firms with more than 10 employees) and column III presents
observations for micro firms (i.e. firms with less than 10 employees). The constant, which is also
the intercept, reveals that when all the variables are zero, the Entrepreneur’s productivity will be
37.7 for the total sample and 17.9 and 8.6 for small and micro firms respectively. The result
obtained is significant at 1%. The coefficient for entrepreneur’s age is negative and significant at
1% for the total sample and 5% for small firms and micro firms. This is expected: as the
entrepreneur advances in age, he becomes less productive. The coefficient for different level of
education shows positive correlation but not all is statistically significant. The result shows that
when OND/NCE level of education increase by one level, entrepreneur’s productivity increases
by 0.3 unit for small firms and it is statistically significant at 5%. The result also shows that as
Entrepreneur’s university education increases by one unit, his productivity will increase by 7.7
units for the total sample and by 6.2 and 8.6 unit for small and micro firms respectively. The
result obtained is significant at 1% for the total sample and at 5% for small firms and micro firms
samples. This implies that B.Sc level of education has positive correlation with productivity; the
significance of education hinges on the fact that it enhances the stock of human knowledge and
management skills which consequently enhance productivity. This confirms the findings of
Fasoroti et al., (2006) that the entrepreneur’s level of education enhances productivity. On hours
worked per day, the result shows that if the number of hours worked per day is increased by an
hour, the entrepreneur’s productivity will decrease by 0.09 unit for the total sample and by 0.04
and 0.3 unit for small and micro firms respectively. This implies that the more hours an
entrepreneur spends on his business, the less productive he becomes; Table 4.35 Multiple Regression Analysis of Effect of Microfinance on Small Business Operators’
Productivity by Category.
Column ITotal SampleCoefficient t- stati
Column IISmall FirmsCoefficient t- stati
Column IIIMicro FirmsCoefficient t- stati
Constant 37.709* 3.962 17.907* 7.184 8.692* 5.008
155
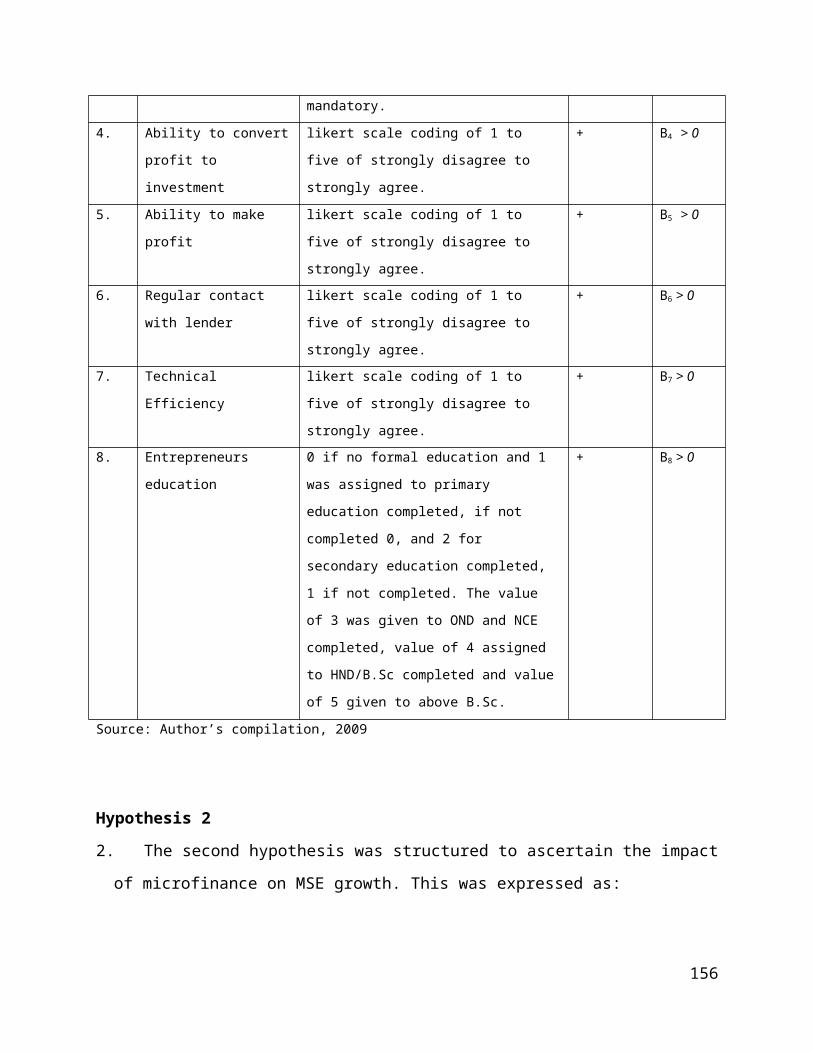
Owners CharacteristicsEntrepreneur’s Age -0.152* -4.813 -2.217** -1.958 -0.195** -1.737Education- No formal 0.016 1.008 0.781 0.081 -1.089 -1.067-Primary Education 0.118 1.171 0.039 0.671 0.087 0.659-Secondary Education 1.012 1.518 0.078 1.399 1.506 0.669-OND/NCE 0.801 1.218 0.321** 2.113 1.340 1.005-B.Sc 1.552*** 1.813 2.266*** 1.618 4.695** 2.577-M.Sc/Ph.D 0.004 0.134 0.186 0.993 0.118 1.421Hours work per day -0.098* 5.592 -0.049* -3.162 -0.395*** -1.924Business experience 0.624** 1.973 1.477** 2.117 0.861** 1.791Entrepreneurial training 12.601* 6.411 6.801** 1.996 4.232** 2.331Firm CharacteristicsForm of Business- Sole Proprietorship
-0.010 -1.121 -0.524** -2.902 0.512*** 1.714
Partnership 0.161 0.118 0.012 0.981 0.089 1.117Family Business 1.014 0.071 1.009 0.771 0.097 0.661Business Size 0.313** 2.583 1.021* 3.912 1.381* 4.546Business location 0.003* 4.169 0.058* 4.725 1.019 1.164Business Location -rural 0.016 1.008 0.781 0.081 1.089 1.161Business registration 1.026* 3.152 0.092** 2.041 1.065 1.003
Microfinance CharacteristicsLoan interest -0.030 -1.393 -0.165 -0.611 -1.014** -2.598Micro loan received 2.003*** 1.887 1.802 1.448 1.108* 4.972Contact with lender 0.079* 4.128 1.811** 2.721 0.006** 2.714Weekly meetings -1.448*** -1.812 -0.046 -1.031 1.041* 7.116Weekly repayment -0.027** -1.886 -1.057* -6.781 2.014** 4.123
R – squared 0.397 0.351 0.301Adjusted R-Squared 0.311 0.303 0.271No. of Observation 502 135 367F-test statistics 3.819(0.000) 1.218(0.081) 2.113(0.000)
Source: Field survey, 2009. Note* =1% level of significance, ** = 5% level of significance, *** = 10% level of significance
The effect analysis of microfinancing on Entrepreneur’s productivity. Productivity is measured as output over resource input at time t. The result of the total sample is presented in column I, the data is later split into two, result of firms with equal or more than 10 employees is presented in column II i.e (small firms), while result of firms with less than 10 employees (i.e micro firms) is presented in column III.
individual entrepreneur therefore needs to find the optimal number of hours that he/she needs to
commit to his business for him to be productive. The result is expected and confirms past
empirical research (Shiferaw, 2007). The coefficient for business experience which is a proxied
by number of years in business is positive and significant at 5% for the three models. This
implies that the longer the years of experience of an entrepreneur, the more productive he is
156

(Shiferaw, 2008; Fasoranti et al., 2006). The magnitude of beta coefficient of entrepreneurial
training for all the three models is high, positive and statistically significant at 1% for the total
sample and 5% for small firm and micro firm samples. This implies that entrepreneurial training
significantly enhances small business productivity.
On firm level characteristics, sole proprietorship form of business formation shows a negative
and significant impact for small firm sample, and positive and significant impact for micro firm
samples. This may be due to the fact that sole proprietorship business formation may not suitable
to enhance productivity of small scale entrepreneur, but may be suitable for micro firms. The
coefficient for business size shows a positive and significant impact on entrepreneur’s
productivity. This implies that the larger the firm the more productive the entrepreneur and the
chances of survival for the enterprise (Bernard and Jensen, 2007). Business location is positive
and significant at 1% respectively for the total sample and small firm sample, but not significant
for micro firms. The coefficient for rural sample is positive but not significant in the three
models. The effect of registration of business seems to be size-based. The coefficient for
business registration is positive and significant for the total sample and small firms at 1% and 5%
significance level, but positive and not significant for the micro firm sample. In small firms,
registration enhances credibility, opens up access to rationed resources and reduces transaction
cost, thus enhancing the growth and productivity of the firm. In micro firms on the other hand,
registration may not enhance productivity appreciably. For instance, operating outside the
purview of government affords firms more flexibility in input use as local conditions change
(Sleuwagen and Goedhuys, 2002).
On micro finance variable, on loan interest, the coefficient for loan interest is positive and
significant for micro firm sample but positive and insignificant for total sample and small firm
sample. This implies that the interest rate charge by the MFBs is only tolerable for micro firms
and this could mean because the micro firm do not have other access to fund except by this
means. The coefficient for micro loan received is positive and significant for total sample and
micro firms at 10% and 1% respectively. The result shows that the use of micro loan
significantly affects the Entrepreneur’s productivity in the total sample and micro firm’s sample,
but it is insignificant in the small firm’s sample. This implies that the amount of loan given is not
157

commensurate to the business activities of small firm operators. The result obtained on contact
with the lender shows positive and significant effect for the three models. This implies that
contact with the lender enhances entrepreneurs’ productivity positively and the result obtained is
significant at 1% for the total sample and 5% for small firms and micro firms.
The result on weekly meetings shows a negative relationship between weekly meetings and
entrepreneurs’ productivity. The result for the total sample shows that as the weekly activity
increases the entrepreneur’s productivity decreases by 1.44 units for the total sample, and 0.049
and 1.04 unit for small and micro firms respectively. The result obtained is statistically
significant for the total sample and micro firms at 1%, but not statistically significant for small
firms. Barnes et al (2001) found frequency of meeting to have a negative impact on business
performance for repeat and continuing client. Also, result for weekly repayment shows a
negative relationship between entrepreneur’s productivity and weekly repayment. The result
shows that as repayment activities increases, entrepreneur productivity drop by 0.02 for total
sample and 1.05 and 2.014 for small and micro firms respectively. The result obtained is
statistically significant at 1% for small firm sample and 5% for total firm and micro firm
samples. This implies that the weekly repayment schedule is too frequent for all entrepreneurs
and it affects their productivity negatively.
The coefficient of determination, that is, the adjusted R2 for the three samples are 0.31, 0.30 and
0.27 for the total sample, small firm and micro firms respectively. This is acceptable for a cross-
sectional data, like we have for this study. The overall statistic is significant at 1% for the three
columns. The decision rule is that when calculated F-value is significant we reject the null
hypothesis and accept the alternative hypothesis. We therefore conclude that, microfinance
enhance productivity of micro entrepreneurs and the factors that positively affect entrepreneur’s
productivity are Entrepreneurs’ education, business experience, business registration, contact
with lender, and micro loan received while other factors such as weekly meetings, and frequency
of loan repayment do not enhance entrepreneur’s productivity in South West Nigeria. This is in
line with the conclusion reached by Fasoranti (2008) that the significant determinants of
technical efficiencies of bakers, furniture makers and burnt brick makers were age of operators,
business experience, and level of education, training experience, credit access, working capital
158

and initial capital outlay. And that well structured entrepreneurship training programmes
complemented with easy credit access can facilitate the desired improvement in the efficiencies
of small scale business people.
Multiple Regression Analysis of Effect of Microfinance on Small Business Operators
Productivity by Legal Status of Business
Table 4.36 presents the results of the effects of microfinancing on entrepreneur’s productivity
split into registered businesses (column I) and unregistered businesses (column II). The constant,
which is the intercept of the equation, shows that when all the variables (X) are zero, the value of
(Y), that is the dependent variable, (Entrepreneur’s productivity) is 27.7 and 13.8 for registered
and unregistered businesses respectively. The result obtained for registered businesses is
significant at 1%, while that of unregistered businesses is not significant. The result shows there
is an inverse relationship between entrepreneur’s age and his productivity as obtained in the
category Table 4.36 above. It is expected that as the entrepreneur grows older, his productivity
will decrease. The result also shows that there is a positive correlation between entrepreneur’s
productivity and his level of education, primary education is found to be positive and statistically
significant at 5% for unregistered business, university education is found to be positive and
statistically significant for registered business at 5% and OND/NCE education is found to be
positive and statistically significant for unregistered business at 10%. As the entrepreneur’s
primary education increases by a level, his productivity increases by 0.02 for unregistered
businesses, and as university education increase by a unit, productivity increase by 2.7 for
registered businesses, while as OND/NCE education increase by a unit, productivity level
increase by 1.0 for unregistered business. On hours worked per day, the result obtained shows an
inverse relationship between hours worked per day and productivity and this is in line with the
theory of productivity, which posit diminishing return of labour. The result shows that if number
of hours worked per day increases by one hour, the entrepreneur’s productivity will decrease by
Table 4.36 Multiple Regression Analysis of Effect of Microfinance on Small
Business Operators Productivity by Legal Status of Business
Column IRegistered BusinessCoefficient t-statistic
Column IIUnregistered BusinessCoefficient t-statistics
159

Constant 27.717 3.171 13.860 0.120 Owners CharacteristicsEntrepreneur’s Age -1.558 -1.482 -0.687* -4.734Education- no formal 0.217 0.362 0.431 1.044-Primary Education 0.157 1.419 0.020** 1.662-Secondary Education 0.319 1.009 0.617 0.345-OND/NCE 0.930 0.981 1.098*** 1.654 -B.Sc Education 2.708** 1.888 1.062 0.767M.Sc/Ph.D 0.661 1.019 0.121 0.817Hours work per day -0.382* -4.122 -0.139 -1.212Business experience 1.062** 2.713 1.442** 2.014Entrepreneurial training 12.012* 8.119 6.018** 3.343 Firm CharacteristicsBusiness age -0.004*** -1.612 1.131** 1.715Form of Business-Sole Proprietorship
-0.110 -1.121 -0.245* -3.802
Partnership 0.415 0.621 0.231 1.441Family Business 0.219 1.409 0.617 1.145Business Size 1.233** 2.743 -0.322* -4.612Business location-Urban 0.133* 4.569 2.189* 3.935Business location-Rural 1.078 1.188 0.031 1.167
Microfinance CharacteristicsLoan interest 0.034 1.393 0.067 0.711Micro loan received 1.403** 2.871 1.085** 2.648Contact with lender 1.191*** 1.528 1.711*** 1.721Weekly meetings -0.008*** 1.712 0.861** 2.131Weekly repayment -0.020** 2.586 1.057** 2.681
R – squared 0.375 0.325Adjusted R-Squared 0.320 0.269No. of Observation 171 331F-test statistics 2.819 (0.000) 1.991 (0.000)
Source: Field survey, 2009
The effect analysis of Micro-financing on Entrepreneur’s productivity. Productivity is measured as output over resource input at time t. The data is split into two; the result of registered business is presented in column I, while that of unregistered business is presented in column II.
0.3 and 0.1 for registered and unregistered businesses respectively. The result is also statistically
significant at 1% for registered businesses, but not statistically significant for unregistered
businesses. This means that increase in the number of hours worked for registered business does
not increase the entrepreneur’s productivity. The coefficient for business experience shows a
positive correlation between business experience obtained by the entrepreneur and entrepreneurs’
160

productivity. As business experience increase productivity also increase. The coefficient for
entrepreneurial training is also high, positive and significant at 1% and 5% respectively.
Result obtained on firm characteristic variables is similar to that obtained in the category table
above. Business size, and business location (urban area) have positive relationship with
entrepreneurs’ productivity while business age and form of business formation (sole
proprietorship) have negative relationship with entrepreneur’s productivity and business age has
positive relationship for unregistered business.
Results obtained for interest on loan size revealed that as loan interest increases by a percentage,
Entrepreneur’s productivity decreases by 0.03 for registered business and 0.06 for unregistered
business respectively. Both results are not statistically significant; hence they cannot be used to
make inferences. On weekly meetings, the results obtained for registered and unregistered
businesses shows a negative correlation with entrepreneur’s productivity for both registered
businesses and unregistered businesses and they are both statistically significant at 10% and 1%
respectively. The results on weekly repayment of loan received by the entrepreneurs also show
an inverse relationship with entrepreneurs’ productivity for both registered and unregistered
businesses and they are both statistically significant at 5% and 1% for registered and unregistered
businesses respectively.
Contact with lender shows a positive relationship with entrepreneurs’ productivity and is
significant at 10% significant level for both registered and unregistered businesses. Micro loan
received by the Entrepreneurs also shows a positive correlation with Entrepreneurs’ productivity
and is statistically significant at 5% for both registered and unregistered businesses. The
coefficient of determination that is the adjusted R2 for registered and unregistered business is
accepted at 0.32 and 0.26 for cross-sectional data as in this study. The main focus of interest is
the impact of each independent variable on the dependent variable as specified in the equation.
The calculated F-statistics of 2.819 and 1.991 are significant at 1% therefore we reject the null
hypothesis and accept the alternative hypothesis, which states that microfinance impact
significantly on entrepreneurs’ productivity in South-West Nigeria.
161

Multiple Regression Analysis of Effect of Microfinance on Small Business Operators
Productivity by Kind of Business
The result on Entrepreneur’s productivity was also split into kind of business activities so as to
determine the impact of different variables tested on Entrepreneur’s productivity by kind of
business. The result obtained is presented in table 4.37 below. The intercept, which is the
constant, is positive and statistically significant for all the sectors of the economy except for the
service industry, which is negative and statistically significant at 5%. The result obtained for
owners’ characteristics variables shows inverse relationship between entrepreneurs’ age and
entrepreneurs’ productivity in all industry except for trading industry. This implies that as
entrepreneur grows older in trading industry their productivity increase but result obtained is not
significant. On entrepreneurs’ Level of Entrepreneur’s primary education is found to have
positive correlation with Entrepreneur’s productivity and it is statistically significant for all kind
of trade except for artisans which is not significant. Probably level of education do not have
significant impact on entrepreneurs’ productivity among artisans. The result obtained for hours
worked per day shows an inverse relationship between hours worked per day and entrepreneurs’
productivity and statistically significant in trading, manufacturing and agriculture subsector but
not significant in artisans and service industry. The result on business experience and
entrepreneurial training is also positive and significant in all sectors except for artisans and
agricultural sectors.
On firm characteristics variables, the coefficient for business age shows positive and significant
correlation with entrepreneur’s productivity in all sectors, the coefficient for form of business is
positive for all sectors but not significant in artisans, agriculture and service subsectors. The
coefficient for business size is also positive for all sectors but not significant in agriculture sector
while the coefficient for geographical location (urban) is positive and significant in all sectors
Table 4.37 Multiple Regression Analysis of Effect of Microfinance on Small Business
Operators Productivity by Kind of BusinessColumn ITradingCoef t-stat
Column IIArtisanCoef t-stat
Column IIIManufacturingCoef t-stat
Coulmn IVAgricultureCoef t-stat
Coulmn VServiceCoef t-stat
Constant 8.471* 2.029 0.036 3.316 10.449 1.916 16.441 3.962 -0.013 -1.923Owners CharacteristicsEntrepreneur’s 0.018 1.025 -0.903** -2.319 -1.135** -1.519 -0.030* -4.044 -0.117* -4.730
162

AgeEducation- No formal
0.033 0.807 0.412 1.136 0.213 0.900 0.815 0.452 0.003 1.114
-Primary Education
0.335** 3.165 0.434 1.228 0.152** 2.615 0.119** 2.182 0.308*** 1.567
-Secondary Education
1.212 0.312 0.055 1.113 0.341 0.404 1.034 0.641 0.342 1.233
-OND/NCE 0.221 0.778 0.322 0.567 1.201 1.047 1.321 0.731 0.456 0.651B.Sc Education 1.012 1.048 1.211 0.980 0.344 1.304 1.004 1.115 0.321 0.332M.Sc/Ph.D 0.211 0.441 0.452 0.331 1.221 0.918 0.314 0.991 1.123 1.324Hours work per day
-1.006* -6.418 -0.112** -1.925 -0.898** -1.829 -1.410 -1.916 -1.341 -2.186
Business experience
1.206** 1.760 1.186*** 1.870 0.630** 1.813 1.072 1.451 1.024*** 1.622
Entrepreneurial training
4.712** 2.556 2.118** 1.876 6.155** 3.656 3.888*** 1.801 1.011** 1.679
Firm CharacteristicsBusiness age 0.015* 4.602 1.430** 2.822 0.313** 3.115 0.047* 5.528 0.053** 1.832 Form of Business 0.010** 1.621 0.606 1.302 1.003** 1.758 0.052 0.174 0.055 0.694Partnership 0.221 0.778 0.322 0.567 1.201 1.047 1.321 0.731 0.456 0.651Family business 1.012 1.048 1.211 0.980 0.344 1.304 1.004 1.115 0.321 0.332Business Size 0.018* 4.713 0.053** 2.402 4.314* 5.778 0.238 0.880 0.045** 1.873Bus loc – Urban 0.615* 4.216 1.008** 1.915 0.023** 1.622 0.321** 2.976 0.183* 3.991Bus loc – Rural 1.201 1.012 0.355 1.413 0.311 1.204 0.034 1.241 0.542 1.033Microfinance CharacteristicsLoan interest -5.755* -5.093 -0.009 -1.411 -0.017 -1.015 -0.41** - 1.961 -3.841* -4.186Micro loan received
2.055** 1.536 0.091* 5.135 1.799 0.491 1.303 1.452 1.110 0.135
Contact with lender
1.312** 1.928 1.610* 2.090 5.302** 1.913 1.293* 6.820 1.331* 5.619
Weekly meetings -0.077** -1.781 -1.387 -1.331 -0.141** -1.786 -3.113** -1.923 -1.051** -1.881Weekly repayment
-0.042** 2.185 -1.060* -4.862 -5.006* -4.515 -3.511** -1.741 -1.651 -0.329
R – squared 0.381 0.290 0.201 0.285 0.222Adjusted R-Squared
0.315 0.221 0.187 0.230 0.196
No. of Observation
238 86 54 89 33
F-test statistics 2.183 (0.000) 1.132 (0.230) 1.318 (0.038) 1.972 (0.005) 2.961 (0.000)Source: Field survey, 2009
The effect analysis of microfinance on Entrepreneur’s productivity split into nature of business activities. Column I to column V are as detailed below.except for the agricultural sector which is not significant. Rural location is not significant for all
sectors.
On micro finance characteristics, the result obtained from our regression estimate shows an
inverse relationship between loan interest and Entrepreneur’s productivity in all sectors but only
163

statistically significant in trading, agriculture and service subsectors. The use of micro loan
significantly affects Entrepreneurs productivity in the trading and artisans sub-sector, but it is not
significant in the manufacturing, agriculture, service subsectors. The coefficient for contact with
lenders is positive and statistically significant in all sectors. This implies that positive
relationship with lenders enhance entrepreneurs’ productivity. The result obtained on weekly
meetings shows a negative relationship with entrepreneurs’ productivity in the trading, service,
manufacturing, artisan and agriculture sectors and statistically significant at 5% in all sectors
except for artisans sector where it is not significant. This implies that weekly meetings do not
enhance entrepreneur’s productivity. The result on weekly repayment of loan received by the
entrepreneur also shows a negative relationship for all business type and they are all statistically
significant except for service sector. This implies that weekly repayment of loan affect
entrepreneurs’ productivity negatively. The significance and impact of each of these variables
on entrepreneurs’ productivity vary across the five sub-sectors; therefore it is difficult to draw
general and definite conclusions as to the impact of any one factor.
The coefficient of determination, adjusted R2, seems tolerable for all the sectors because of cross
sectional data used for this study. But the overall statistics show F-value calculated to be 2.183,
1.132, 1.318, 1.912, and 2.961 for trading, artisans, manufacturing, agriculture and service
industry respectively, only the result obtained for trading, agriculture and service is significant
while the result for manufacturing and artisan is not significant. We therefore reject our null
hypothesis for the trading, agriculture and service sectors and accept our alternative hypotheses
for the three sectors. But for the manufacturing and artisans we accept our null hypothesis, which
implies that microfinancing enhances entrepreneurs’ productivity in the trading, agriculture and
service sub-sectors but does not enhance productivity of entrepreneurs in the manufacturing, and
artisan sub-sector in South-West Nigeria.
Multiple Regression Analysis of Effect of Non- Financial Services of Microfinance Bank on
Small Business Performance by Category
The impact of non-financial services of Microfinance Bank on business performance of
Entrepreneurs was also measured. Table 4.38 presents the results of the total sample (column I);
it is then split into small (column II) and micro firms (column III). The intercept shows the value
164

of the dependent variable (Y) Gross profit margin, when all the independent variables are zero.
The result obtained showed 73.3% for total sample, and 19.5% and 32.9% for small firms and
micro firms respectively. The result obtained is significant at 1% except for micro firm (column
III) which is significant at 5%. On owners characteristics variables, the magnitude and the signs
of beta coefficient for entrepreneurs’ age and entrepreneur’s performance shows a negative
correlation in the three models and they are also statistically significant at 1% for total sample
and 5% for small firms and micro firms. This implies that as entrepreneur grows older the level
of performance decrease. The result obtained confirm past empirical search (See Makasure et al.,
2008; Fasoranti et al., 2006). The magnitude and signs for OND/NCE education shows positive
corelations with firm performance and statistically significant at 5% for micro firm sample, while
University education shows positive correlation with small firm performance and statistically
significant at 10%. This may imply that the level of education of respondents in the micro firm
sample is not adequate to statistically impact on the performance of the entrepreneurs.
Entrepreneur’s gender female was found to be positively correlated with business performance
and also statistically significant. The result obtained shows that a unit increase in female gender
increase entrepreneur’s performance by 0.09%, 0.04% and 1.02% for total sample, small firm
sample and micro sample respectively, the result obtain is statistically significant at 5%, 10% and
5% for the total sample, small firm sample and micro sample respectively. The magnitude of
beta coefficient for training experience shows a positive correlation between training experience
and MSEs’ performance. This implies that as training received by entrepreneurs increases by one
unit, MSE performance will increase by 5.4% total sample and 1.0% and 3.8% increase in
performance for small firms and micro firms. This confirms prior empirical findings (See
Ajibefun and Daramola, 1999).
Table 4.38 Multiple Regression Analysis of Effect of Non- Financial Services of
Microfinance Bank on Small Business Performance by Category
Column ITotal SampleCoefficient t-tatistic
Column IISmall FirmsCoefficient t-tatistic
Column IIIMicro FirmsCoefficient t-statistic
Constant 73.342* 2.661 19.502* 1.518 32.921** 2.813Owners Characteristics
165

Entrepreneur’s Age -0.125* -5.681 -0.215** -1.859 -0.505** -2.637Education- no formal 0.015 0.655 0.265 1.016 0.615 1.051-Primary Education 0.008 0.522 0.018 0.913 1.112 0.815-Secondary Education 0.087 0.712 0.221 1.250 0.341 1.315-OND/NCE 0.038 1.111 0.043 1.383 0.932** 1.813-B.Sc 0.132 1.444 1.822*** 1.501 1.011 1.227-M.Sc/Ph.D 0.001 1.127 1.161 0.120 0.012 1.135Gender - Male 1.012 1.318 0.072 1.391 1.006 0.609 Female 0.094** 2.082 0.042*** 1.812 1.021** 3.108Training experience 5.424** 1.873 1.074** 2.897 3.861** 1.975Firm CharacteristicsBusiness age -0.650* -3.812 -0.008** -1.725 -1.004* -4.812 Form of Business -0.210 -1.121 -0.624* -4.702 -1.112*** -1.614Partnership 0.021 0.188 0.341 0.899 1.016 0.781Family 0.018 1.088 0.231 1.015 0.090 1.118Business Size 0.316** 1.883 1.211* 6.876 1.812* 7.761Business location- Urban 0.030* 4.159 1.055* 5.565 0.017** 1.764Business location – rural 1.078 1.022 1.015 0.713 1.212 0.715Business registration 1.026* 5.152 0.092** 1.941 -0.075* -5.503
Microfinance CharacteristicsAdvisory service 1.843** 1.871 0.421 1.042 2.264** 2.334Pre-loan training 7.913* 6.906 0.580* 4.132 0.796* 5.584Group membership 4.502*** 1.798 0.051 1.128 4.319*** 1.811Cross guaranteeship 10.448** 2.834 -1.801*** -1.995 1.024** 2.061Networking Meetings 0.025** 3.518 1.306** 3.619 1.501* 4.119
R – squared 0.412 0.230 0.332Adjusted R-Squared 0.382 0.198 0.291No. of Observation 502 135 367F-test statistics 4.182 (0.000) 2.912(0.0108) 1.998(0.000)
Source: Field survey, 2009
The impact analysis of non-financial activities of microfinancing institutions on business performance of Micro and Small Enterprises (MSEs) in South-West Nigeria. The dependent variable is MSEs Gross Profit Margin. Gross Profit Margin is measured as gross profit over sales multiplied by 100. The result of the total sample is presented in column I, the data is later split into two, result of firms with equal or more than 10 employees is presented in column II i.e. (small firm) while result of firms with less than 10 employees (i.e. micro firm) is presented in column III.
On firm characteristics variables, the result obtained for business age shows an inverse
relationship between firm age and enterprise performance. The result shows that as firm age
increases by one year, enterprise performance decreases by 0.6% for the total sample and
0.008% and 1.0% for the small firm and micro firm samples respectively. The result is
statistically significant at 1% for the total and micro firm samples and 5% for the small firm
166

sample. This confirms the findings of Niskanen and Niskanen (2007) that as firm age increases,
firm performance drops and that impact of one extra year diminishes as the firm gets older.
The result on forms of business formation shows sole proprietorship has negative correlation
with enterprise performance. The result obtained shows that a unit increase in the current
ownership structure will bring about a 0.6% and 1.1% decrease respectively in enterprise
performance for the small firm and micro firm samples and they are both statistically significant
at 1% and 10% respectively.
The coefficient for firm size shows a positive correlation for all the three samples; the results
obtained are all statistically significant, at 5% for the total sample and 1% for the small firm and
micro firm sample. This implies that as firm size increases by one unit, it enhances MSE
performance by 0.3% in the total sample and 1.2% and 1.8% in small and micro firm sample
respectively. The coefficient for urban business location shows a positive correlation for all the
three samples and statistical significance, while the result for business location rural is not
statistically significant for the three samples. And lastly in this segment, the coefficient for
business registration shows a positive correlation for the total sample and small firm and a
negative correlation for micro firm. This implies that registration of small firms will decrease
performance because they have to be regulated and restricted, and yet need to be flexible to
survive. This confirms the finding of Mead & Liedholm (1998) that registration of
microenterprises does not enhance performance appreciably.
With respect to Microfinance characteristics, the results obtained revealed that the magnitude of
the beta coefficient for advisory service is consistent with microfinance theory and significant at
5% for the total sample. The result implies for one additional unit of advisory service received by
the entrepreneurs, the gross profit margin, which is the proxy for performance, increased by 1.84.
The data is then split into small firms and micro firms and the result obtained shows that a unit
increase in advisory services increases the level of performance for small business operators by
0.4, but the result is not significant; hence it cannot be used for any inferences. The result also
shows that a unit increase in advisory services increases the performance for micro entrepreneurs
by 2.2; the result is also statistically significant at 5% for micro firms. Small firm operators may
167

consider advisory services offered by MFBs as relevant to their business. We found the result on
pre-loan training to be positively correlated with business performance. The result revealed that
an increase in pre-loan training will bring about 7.9% increases in business performance for the
total sample and 0.5% and 0.7% for small firm and micro firm respectively. This is statistically
significant at 1% and confirms the prior empirical findings of Ogunrinola and Alege (2008).
The result on group membership also shows a positive correlation between business performance
and group membership. The magnitude of beta coefficient for group membership is consistent
with microfinance theory and significant at 10% for the total sample and micro firms but not
statistically significant for small firms. The result shows that group membership practice
enhances business performance by 4.5% for the total sample and 0.05% and 4.3% for small firms
and micro firms respectively. On cross guaranteeship of members by other members of the
group, the result obtained revealed that cross guaranteeship enhances performance by 10.4% for
the total sample and by 1.0% for micro firms and they are both statistically significant at 5%. But
the result obtained for the small firm sample shows a negative correlation between cross
guaranteeship and business performance of small firm operators. The result revealed that as
cross guaranteeship is enforced business performance drop by 1.8%; the result is statistically
significant at 10%. This may be due to the nature of the level of business of small firm operators.
Most small scale enterprises operates on a level higher than micro enterprises hence micro
financing may not the the most appropriate method of financing such enterprise. The results
obtained on group membership and cross guaranteeship confirm the findings of Anderson et al.,
(2002), that group membership and guaranteeship stand as a form of social capital and enhance
accessibily and efficiency of funds among small business operators.
Many MFBs organize meetings to pull people in the same line of business together so that they
may share experience to enhance business growth. The result obtained confirmed that such
meetings enhance business performance for MSEs Entrepreneurs. The magnitude of beta
coefficient of networking meetings is consistent with microfinance theory and business practice.
The result obtained revealed that a unit increase in networking meetings increases gross profit
margin by 0.02% for the total sample and 1.3% and 1.5% for small firms and micro firms
respectively. The results obtained are all statistically significant at 5%.
168

The coefficient of determination R2 of 0.38, 0.19 and 0.29 shows the fitness of the estimated
model. The F-statistics of 4.182, 2.912 and 1.998 show the overall fitness of the estimate and
because the estimate is statistically significant at 1%, we reject our null hypothesis and accept
our alternative hypothesis which implies that the non-financial services rendered by MFBs to
their customers enhance their business performance.
Multiple Regression Analysis of Effect of Non- financial services of Microfinance Bank on
Small Business Performance by Legal Status of Business
Table 4.39 below presents the results when split into registered and unregistered businesses. The
results obtained on owners’ characteristics and firm characteristics were similar to those obtained
under category of business. Advisory services and pre-loan training show a positive correlation
with gross profit margin and are statistically significant. The covariate, group membership, also
shows a positive correlation with gross profit margin for registered business and is statistically
significant at 5%. The result obtained for unregistered business shows a negative correlation
which negates microfinance theory, although the result obtained is not statistically significant.
The result obtained for cross guaranteeship also shows a negative correlation with business
performance for registered businesses, but positive correlation for unregistered business and is
statistically significant at 10%. The coefficient for networking meetings shows a positive
correlation for both registered business and unregistered business and they are both statistically
significant at 5% and 1% respectively.
The coefficient of determination for the estimated model adjusted R2 of 0.19 and 0.23 are
acceptable for cross sectional data and the overall F-statistics of 3.819 and 2.390 are statistically
significant at 1%. This led to our decision to reject our null hypothesis and accept our alternative
hypothesis for the two models.
Table 4.39 Multiple Regression Analysis of Effect of Non- financial services of
Microfinance Bank on Small Business Performance by Legal Status of
Business
Column IRegistered BusinessCoefficient t-statistics
Column IIUnregistered BusinessCoefficient t-statistics
169

Constant 6.555* 10.496 8.772* 18.407 Owners CharacteristicsEntrepreneur’s Age -1.803 -1.082 -0.487* -4.834Education- no formal-Primary Education 1.213 1.568 0.018 0.501-Secondary Education 0.120 1.282 0.033 0.881 -OND/NCE 1.415 1.580 1.011** 1.620-Graduate Education 1.068 1.210 0.141 1.490-Professional Educ. 1.072 1.110 1.025* 5.802Gender – male 0.415 0.458 1.011 0.620 Female 0.413 1.068 1.118 1.201Training experience 1.662** 2.513 1.403** 2.116
Firm CharacteristicsBusiness age -1.004* -4.612 -1.131** -2.715Form of Business-Sole proprietorship
-0.710** -1.821 -1.245* -4.702
Partnership 0.319 1.009 0.617 0.345Family Business 1.930 0.981 0.098 0.654Business Size 1.332** 2.543 1.622* 5.812Business location- Urban 0.670* 5.987 0.113* 4.056Business location-Rural 0.312 0.868 0.018 1.081Microfinance CharacteristicsAdvisory service 4.788** 2.540 7.098** 1.841Pre-loan training 5.357* 4.573 2.279** 1.878Group membership 7.083** 2.922 -9.111 -0.301Cross guaranteeship -1.148 -1.121 4.361** 1.788Networking Meetings 1.280** 1.566 1.530* 4.585
R – squared 0.225 0.289Adjusted R-Squared 0.190 0.230No. of Observation 171 331F-test statistics 3.819 (0.000) 2.390 (0.000)
Source: Field survey, 2009
The impact analysis of non-financial services of microfinance banks on business performance of Micro and Small Enterprises (MSEs) in South-West Nigeria. The dependent variable is MSEs’ Gross Profit Margin. Gross Profit Margin is measured as gross profit over sales multiplied by 100. The data is split into two, the result of registered business is presented in column I, while that of unregistered business is presented in column II. Multiple Regression Analysis of Effect of Non- financial Services of Microfinance Bank on
Small Business Performance by Kind of business
The result obtained for the effects of non-financial service of microfinance institutions on
business performance split into kind of trade is presented in Table 4.40. The intercept of the
model, which is the constant shows the value of Y (gross profit margin) when all Xs are 0.
Column I presents the results for trading activities, columns II for artisans while columns III, IV
and V present the results for manufacturing, agriculture and service respectively. Column 1
170

shows that when the independent variable is 0, the gross profit margin will be 10.9 and 16.5,
26.0, and 33.8 for artisans, manufacturing and agricultural activities respectively. The intercept
for the service industry is -1.05 but it is not statistically significant, while all others are
statistically significant.
On owner’s characteristics variable, the independent variable, entrepreneur’s age, shows a
negative inverse relationship with business performance, which implies that as the entrepreneur
increases in age, business performance decreases in all the sectors except in the trading sector
which shows positive correlation but is not statistically significant. The result obtained for the
artisan sector is also not significant, but the result obtained for the manufacturing sector is
significant at 5% while the result for agriculture and service is significant at 1%. OND/NCE
level of education appears to be positively correlated with business performance in all the sectors
and statistically significant too. The coefficient for entrepreneurs’ gender (male) shows positive
correlation with business performance for all but only statistically significant in the
manufacturing sector. The variable, entrepreneur gender (female) shows positive correlation with
business performance in the trading and service sectors and statistically significant at 5% and
10% respectively. The coefficient for training experience also shows a positive correlation with
business performance in all the sectors which is similar to the result earlier obtained in the study.
On firm characteristics variables, business age shows an inverse relationship with business
performance and it is statistically significant in all sectors except in the trading sector. Form of
business (sole proprietorship), business size, and business location (urban area) all show a
positive correlation with firm performance, although some of the results are not statistically
significant.
On microfinance variables, the result obtained for advisory service shows a positive correlation
between advisory service and business performance for all classes of business activities except
for manufacturing and agricultural activities. Among traders, advisory services enhance business
performance by 10.6, which implies that a unit increase in advisory service will increase business
performance by 10.6 and it is statistically significant at 10%. Also among the artisans it bring
about 0.9 increase in performance and statistically significant at 5%, while in the services
171

industry performance increase 1.5 and significant at 5% too. For manufacturing activities and
agriculture there is a negative correlation, but the two are not statistically significant; hence it
cannot be relied upon for any meaningful conclusion.
The result obtained for pre-loan training shows a positive correlation for all the five sectors
except the service industry, where the result obtained is not statistically significant. Group
membership before loan can be granted shows a positive correlation with business performance
for all types of business activities, except manufacturing activities. This is contrary to
microfinance theory which posits that belonging to a group helps to enhance business
performance and increases the repayment rate for the loan collected.
The cross guaranteeship result also shows a positive correlation for trading, artisans and service
industry, but a negative correlation for manufacturing and agriculture; this result also negates the
microfinance theory. The result obtained for networking shows that a unit increase in networking
meeting increases gross profit margin by 0.01 units for the trading sector and 0.005 for the
service industry; they are both statistically significant at 5%. The result obtained for artisans,
manufacturing and agriculture shows a negative correlation and is statistically significant at 10%,
except for manufacturing which is not statistically significant.
The adjusted R2 of 0.28, 0.19, 0.26 and 0.17 are still acceptable for trading, artisans,
manufacturing and agricultural business respectively. But the adjusted R2 for the service industry
is 0.22. The F-statistics obtained for all the five models is significant at 1% as a result we reject
our null hypothesis for all the five models and accept our alternative hypothesis. This means that
non-financial services rendered by MFBs enhance the business activities of the MSEs.
Table 4.40 Multiple Regression Analysis of Effect of Non- financial Services of
Microfinance Bank on Small Business Performance by Kind of business
Column ITradingCoef t-stat
Column IIArtisanCoef t-stat
Column IIIManufacturingCoef t-stat
Coulmn IVAgricultureCoef t-stat
Coulmn VServiceCoef t-stat
Constant 10.931 8.191 16.550 2.291 26.002 1.492 33.85 1.592 -1.050 -1.278Owners CharacteristicsEntrepreneur’s Age 1.181 1.005 -0.309 -0.189 -1.513** -1.915 -0.504* -4.784 -0.864* -5.890Owners Education 0.881 1.211 1.812 0.899 1.012 1.808 0.045 1.088 1.011 1.411Primary Education 0.102 1.511 0.032 0.611 0.056 1.551 0.090 1.448 0.332 1.421
172

Secondary Education
0.301 1.103 0.214 0.810 0.122 1.128 1.033 0.491 0.086 0.811
OND/NCE 0.331** 1.653 1.034** 1.628 0.122** 1.815 0.118* 5.162 0.301** 1.661Graduate Education 0.010 1.621 0.606 1.302 1.003* 1.758 0.052 0.174 0.055 0.694Professional Educ 0.221 0.778 0.322 0.567 1.201 1.047 1.321 0.731 0.456 0.651Gender – Male 0.102 1.411 0.032 0.611 0.056** 1.551 0.090 1.448 0.332 1.421 Female 0.301*** 1.603 0.214 0.810 0.122 1.128 1.033 0.491 0.086** 2.811Training experience 0.602** 1.860 0.001 1.370 0.020** 1.923 0.721** 1.811 0.025** 1.720Firm CharacteristicsBusiness age -0.005 -1.002 -1.330** -1.622 -0.013** - 2.114 -0.037* -4.728 -0.003** -1.832 Form of Business 0.000 1.021 0.206 1.102 1.005** 1.858 0.552 0.184 0.065 0.641Partnership 0.110 1.221 0.066 0.302 1.003 1.158 0.512 1.174 1.055 1.194Family Business 0.222 0.178 0.322 0.367 1.001 1.147 0.321 0.131 0.654 0.511Business Size 0.019* 4.613 0.035** 2.402 0.314* 3.678 0.231 0.180 0.040 1.673Business location- Urban
0.516* 5.216 1.000* 3.885 0.230** 1.582 0.121** 2.676 0.185* 3.991
Business location- Rural
0.615* 1.216 1.088 1.415 0.023 1.022 0.321 0.776 0.185 1.091
Microfinance CharacteristicsAdvisory service 10.676*** 2.143 0.996** 1.904 -7.735 -0.978 -2.620 -0.477 1.511* 4.191Pre-loan training 10.138** 2.581 1.591** 1.522 3.718** 1.613 0.078** 1.600 0.198 1.007Group membership 0.187** 1.698 0.019* 4.418 -0.151** -1.595 0.081** 2.191 0.039** 1.660Cross guaranteeship 1.581** 1.915 -0.015** 2.136 -0.017** -1.575 -0.915**-1.631 0.008 0.419Networking Meetings
0.017** 2.007 -0.052***-1.641 -1.967 -1.217 -1.690***1.569 0.005** 2.569
R – squared 0.33 0.29 0.26 0.17 0.28Adjusted R-Squared 0.28 0.19 0.21 0.14 0.22No. of Observation 238 86 54 89 33F-test statistics 4.912 (0.000) 5.182 (0.000) 2.251 (0.000) 5.250(0.000) 1.125(0.000)
Source: Field survey, 2009
The impact analysis of non – financial activity of MFB on business performance. Result is analysed according to the kind of business activities engaged in by the Micro and Small Enterprises.
4.9 The Operations, Process and Practice of Microfinance in Nigeria
The result obtained for this aspect of the study was based on the outcome of personal interview
conducted with forty one (41) senior Bank officials of Microfinance Banks, covering selected
Banks in Lagos, Ogun and Oyo States. The intention was to cover 106 banks used for this study,
but due to financial constraints the researcher was limited to just forty-one randomly selected
across Lagos, Ogun and Oyo States. A total of 607 erstwhile Community Banks (CBs) that met
the minimum capital requirement of N20 million Shareholders' Funds, unimpaired by losses,
173

converted to Microfinance Banks (MFBs). An analysis of the CBs converted to MFBs shows that
187 CBs had completed the process and obtained final licences, while 420 had provisional
approval as at 31st March, 2009. At the same date, a total of 72 new investors in the microfinance
sub-sector had been granted final licenses, while 89 had been granted approvals-in-principle
(AIPs). The total number of approved MFBs as at the end of March 2009 stood at 768.
An analysis of the total number of licensed Banks showed that there was a high concentration of
the banks in Lagos (147), Anambra (79), Ogun (51), Oyo (46) and Imo states (42). These five
States accounted for 365 or 47.5 per cent of the total number of approved MFBs. The remaining
31 States and Abuja FCT accounted for 403 or 52.5 per cent of the total number of approved
MFBs. The spread reveals that the MFBs are concentrated in States located in the southern geo-
political zones and thinly spread in the Northern geopolitical zones as summarized in Table 4.41
(see appendix)
To join a Micro Finance Bank in Nigeria is not strenuous; an individual can walk in or can be
introduced by other individual who is already a client/customer to the Bank. Most categories of
clients/customers of MFBs are self-employed individuals who own and manage their business
outfit. Categories of clients/customers range from agriculture/agro-based micro business
entrepreneurs such as poultry farmers, oil palm farmers, grain farmers, legumes and cotton
farmers, orchards farmer, fisher men/women, snail farmers to individuals involved in the
processing of any of the above product. Also, among the MFB customers are tailors and fashion
designers, arts and craft, sculptors, carpenters and furniture makers, motor vehicle repairers,
vulcanizers, shoe makers and shoe menders, newspaper vendors, electricians, water packaging
and sales men. Included also are general retailers and merchandisers, GSM repairers, small
restaurant operators, musical and video rental shop operators, party rentals operators etc. One of
the Bank Managers commented that “Anyone in business can join Microfinance bank in as much
as he/she is ready to abide by the rules, but acquisition of a particular skill or interest in a
particular sector of the economy is necessary to have a focus”.
Response from the MFB interview reveals that most of the MFB do not carry out pre-site
research before the banks are situated in a particular location, neither do they target specific
174

group. Most of the banks were sited base on the discretion of the owners. It was also revealed
that, for some of the banks, their officials meet with the resident of a community to inform them
about the bank project, familiarizing the community members with the objectives, policies and
programmes of the banks even before the banks are sited, but most of the banks interviewed do
not inform the residents about their intension before setting up the banks in the community. Also,
most of the banks do not visit the homes of prospective participants for personal interview and to
assess their economic situation so as to enable the banks develop financial product that will be
suitable for the community.
To qualify for loan, applicants go through a pre – loan training or business training. A pre – loan
training is compulsory and it takes an average of 2 – 6 weeks depending on the bank. The pre-
loan training covers areas such as records keeping, minute writing and other areas of training,
which depend on the training needs of the group in focus. After the training, an exchange visit is
made by some banks to successful clientele. This is to expose the new client/customer to other
business environment so as to learn new ways and techniques of doing business and also to
conceptualize their own business. After successful repayment of the first loan, the client qualifies
for the next stage of loan. Average minimum loan is N8,000 – N10,000 and maximum N500,000
– 1% of shareholders capital unimpaired by loses for individual and 5% for corporation. There
are many credit products the bank client can explore for loan; most banks have regular loan,
asset/equipment loan, festival loan, special loan. Interest rate is market determined and it is
negotiable. It takes an average of 3 – 6 months after joining the bank before a client/customer
can get a loan. The client/customer must have completed the pre-loan training and get a good
report from the field officer allocated to him/them before loan can be granted.
Savings were done weekly on group level. Individuals could also save and withdraw any
additional amount saved. In most of the banks, 10% of savings is held against members who
have outstanding loans, while an open access to new voluntary saving products exist. The
savings account was structured as follows: General Members’ savings account, Special savings
account, Associate Member’s savings account: the amount saved varied among groups and it
could be withdrawn any time, long-term savings and short-term deposits. Interest on savings
varied among banks but an average savings deposit rate is estimated at 2-3% which is
175

comparable with that of other banks. The savings rate in the MFBs is therefore not attractive;
hence their inability to mobilize lots of savings from the poor. However, reflecting the low
income level of the clients, the average savings deposit size ranged from N1,483.00 to N15,000
for small loan members.
The Board of Directors of MFBs is primarily responsible for the corporate governance of the
banks. To ensure good governance of the banks, the Board of Directors ensures the establishment
of strategic objectives, policies and procedures capable of guiding and directing the activities of
the banks; the means to attain same, as well as the mechanism for monitoring the Management’s
performance. The management of the day-to-day affairs of the banks is the responsibility of the
Management team; the Board of Directors is, however, responsible for monitoring and
overseeing Management’s actions. Consequently, the licensed microfinance bank operates under
a diversified and professional board of directors.
Two categories of clientele exist in Nigeria microfinance bank today, individual client and group
base client. There are more of individual client than group base client in Nigeria MFBs.
Individual member client borrow just like in normal banking system mostly with collateral and
the interest rate for individual are much higher than that of groups. Some banks do not use
collateral but request three guarantors to indemnify in case of default. Most of the banks give
group loan especially for first time applicant especially under the regular loan category; it is after
the complete repayment of the first loan and the level of exposure of the customer/client
expanded that individual loan is granted. Group membership is encouraged to facilitate loan
approval; groups are formed along business line, similar age group, similar educational
background, and socio economic standing. Group members should be neighbors but not
relatives. The groups are formed by group members and they elect group leaders themselves. The
groups operate like normal co-operatives bodies, they have Chairperson, Assistance Chairperson,
Secretary, Treasurer, Chief Whip and Ex-officials. Most of the group consists of five to ten
members. The bank assigned Field Officer to each group. The Field Officer attends the group
meetings and assists the group with their training needs and record keeping in preparation for
loan. Oral group recognition test are carried out by the Branch Manager to ensure that all
176

members of the group know each other and understand the principles and procedures of the
project.
Group guarantee-ship is encouraged as a form of social capital instead of collateral but not
enforce in most of the banks. One of the manager remarked that “groups that must cross
guarantee each other are preferred because savings is mandatory and not compulsory and there
are no collateral”. Customer on individual loan is encouraged to provide three guarantors incase
of loan default. Although, group membership is encouraged, most of the banks have more
individual loans than group loan and rely on guarantors to pay in case of default.
Apart from credit and savings products, other service that is common with MFBs in Nigeria is
money transfer. Other non-financial services offered by most banks are training programmes.
Most common is pre-loan/loan usage training, it is compulsory for all intending client. “Only the
pre loan training services is compulsory for members and records keeping trainings for the
secretaries and treasurers”. Managerial/technical training is not common because the banks
themselves lack human capital for such training. Every intending applicant qualifies for training,
and training are done according to need and in batches. One of the Managers commented that
“basic training is required for all potential members to assure a thorough understanding of the
principles, philosophy, rules and regulations, and procedures of the credit system”.
The initial loan amount is modest in Nigeria banks, ranging from N30,000 to N80,000 for micro-
enterprises but much higher for small scale enterprises depending on the loan request, but the
amount can be gradually increased in subsequent loans. The borrower repays the loan in equal
instalments as agreed with the banks. One of the Bank Managers commented that “the idea of
quick repayment instills credit discipline and promotes successful repayment”. MFBs customers
repay loan monthly and not weekly as practice by other MFIs. Though those that belong to a
group meet weekly to make voluntary contribution and they cover up for each other in such
meetings but such group arrangement is lacking in most of the banks. One of the respondent
remarked that ‘‘Weekly meetings are mandatory. Repayment of their outstanding loans may not
be weekly, it may be done fortnightly or monthly. What matters most is that there must be a
record for payment of the agreed monthly loan repayment’’. Loan repayment rate is estimated at
an average of 70% – 80%. The practice of micro financing in Nigeria is not as strong and
177
properly deliver especially among banks compare to the original concept borrowed from Asian
countries. One of the bank manager remarked that ‘‘Micro finance is not properly practiced in
Nigeria. Most of the micro finance bank owners opened up their banks mostly to enrich their
purse through collection of savings and find it difficult to repay thereafter. Now, most of them
cannot withstand the test of time before going bankruptcy, this happened after diversifying
clients’ money to another business’’. Another manager remarked that ‘‘the future of micro
finance is bleak in Nigeria, if proper measures are not taken now, it may end up like other failed
programme”
Response from the interview also revealed that each member must submit a simple loan
proposal, within the limits of the available loan amount; the loan proposal explains the intended
productive use of the funds. One of the managers commented that “the proposal must be
approved initially by the group for those operating within the group before going to the bank
manager for final approval”. Loan disbursement is not staggered among group member (from
the weakest member of the group to the strongest member of the group) in most of the banks;
once the loan is approved all group members get their share of the loan at the same time in most
banks in Nigeria. It was also revealed that the loan officers monitor the borrower closely to
ensure that loan given are use for the stated purpose and the borrower maintains a good
repayment record, “close supervision by the field officers is an ongoing process”.
CHAPTER FIVE
SUMMARY OF FINDINGS, CONCLUSION AND RECOMMENDATIONS5.1 Introduction
The main aim of this study is to investigate the effects of micro financing on small business
survival, growth and expansion in South-West Nigeria. This chapter summarizes the main
findings of the study. The arrangement for the presentation is guided by the hypotheses stated for
178

discussion. The conclusion that follows is drawn from the findings, while recommendations and
suggestions for further study are also indicated.
5.2 SUMMARY
The study investigates the effects of microfinancing; comprising of financial and non – financial
products, offered by the Microfinance Banks on micro and small enterprise growth, survival,
productivity and performance in South-Western Nigeria. According to our findings, the survival
of micro and small enterprises (MSEs) depends largely on whether the enterprises are able to
generate profit from the use of micro funds and easy access to micro credit. It also depends on
regular participation of entrepreneurs in microfinance programmes; and whether entrepreneurs
are able to convert the profits made in a particular year to further investments. The study also
assesses the impact of microfinance on entrepreneur’s productivity. Productivity is measured as
output value proxied by sales-value over resource input value, proxied by cost of material input
at time t, cost of capital at time t, wages at time t, rent paid at time t, electricity bill at time t, and
cost of machine maintenance at time t. The study also assessed the direct effect of non-financial
services rendered by microfinance banks on the performance of micro and small entrepreneurs,
using gross profit margin as proxy to measure performance. Gross profit margin is defined as
gross profit divided by sales multiplied by 100.
Two major analytical techniques were employed for this study; they are the Survival Analysis
and Multiple Regression Analysis techniques. The Survival Analysis incorporated Cox
Proportional Hazard Model and Kaplan Meier Survival Analysis. The Survival Analysis was
used because it is supposedly superior to other business failure prediction techniques such as
Discriminant Analysis Technique and Logit Analysis, and the result obtained can be easily
interpreted. Survival Analysis incorporates historical nature (i.e longitudinal variables) to explain
and predict business survival and failure.
5.3 Findings5.3.1 Micro finance and MSE Survival
179

The findings of this study among others reveal that 90% of the Micro and Small Enterprises
(MSEs) financed by MFBs with track records of regular participations in microfinance
programme and easy access to micro credit survived up to 4 ½ years.
The study also reveals that the likelihood of survival of small firms increases provided that they
are able to generate profits regularly, have easy access to micro credit and plough back profits
generated into re-investments. The study also shows that formal education has positive impact on
the ability of business owners and operators to conduct business efficiently. The study reveals
that high level of education is a significant factor in increasing operational efficiency,
profitability and success of businesses. Technical capacity is also revealed to have significant
influence on long-term survival of small business. Technical capacity may be assessed in terms
of ability to adapt to new technology, regular technology-related training, application of
information technology and sound business plan writing. Successful businesses and enterprises
were associated with managers who are given to continuous innovation and adapting new
technology. The study also reveals profitability as a key predictor of long-term survival and
viability of MSEs.
Easy access to micro credit is significantly associated with small business survival. Easy access
to microfinance is closely associated with cordial relationship and regular contact with loan/field
officer as well as regular participation in microfinance. The appropriateness of loan size, proper
utilization of loan given and a good repayment plan schedule are the factors that make micro
credit worthwhile for small business operators. The study has shown that businesses that
participate in microfinance programmes, particularly at the group level, have survived much
better than those which do not participate. These results have shown that there is a robust and
positive correlation between small business survival and regular participation in microfinance
activities.
5.3.2 Microfinancing and Micro and Small Enterprises (MSE) Growth
The result obtained was split into categories, legal status of business and kind of business of
MSEs operators in South-West Nigeria. The outcome of the study on the effects of
microfinancing on MSEs’ growth and expansion capacity shows that microfinance does not
enhance the expansion capacity of small business in South-West Nigeria.
180

Looking at the result critically, it was revealed that variables such as technology-related training
received by small business operators, business location (urban area) and business registration
impact positively and significantly on small business expansion and growth. The result obtained
from micro firm samples reveals that owners’ education (OND/NCE), loan utilization, duration
of asset loan, business location (urban area), technology related training received and size of
asset loan all significantly impact positively on micro firm expansion but the magnitude of the
co-efficient of microfinance variables are very small. When the sample was split into legal status
of business (that is into registered and unregistered businesses) it was observed that only owners’
characteristics variables and business characteristics variables are found to be statistically
significant with small business expansion.
When the result was split by type of business activities, the result obtained shows variation in the
type of variables that significantly affect small business growth and expansion. In the services
sub-sector, only owners’ education (OND/NCE), female gender, business size, and duration of
asset loan appears to be statistically significant. In the trading sub-sector, repayment of asset
loan, loan utilization, duration of asset loan and business location-urban and other owner and
firm characteristics variables are positively correlated with sales growth and also statistically
significant. In the manufacturing sector, it is technology-related training received by the
entrepreneurs, loan utilization, urban location, business registration and business age that appear
to be statistically significant. Among artisans, the variables that are positively correlated with
business growth and statistically significant are repayment of asset loan, duration of asset loan
and size of asset loan. In the agricultural sub-sector, it is technology-related training and business
registration that significantly affects sales growth. One can observe that, in all sectors,
technology-related training is highly significant and correlated with sales growth.
5.3.3 Microfinance and Entrepreneurs’ Productivity
The findings of this aspect of the study shows that all the owners’ characteristics variables, some
firm characteristics variables and microfinance variables such as, contact with lender/loan
officers has significant impact on entrepreneurs’ productivity in South-West Nigeria. When the
sample was split into small firms and micro firms, the same variables were seen to have
181

significant impact on entrepreneurs’ productivity. The same order was obtained for micro loan
operators except that weekly meetings and weekly repayment were found to have positive
correlation with entrepreneur’s productivity.
When the data was further split by kind of business engaged by the entrepreneurs, the findings
imply that different efficiency and productivity strategies may be emphasized for the different
sub-sectors of the MSEs sector. Our findings revealed that micro loan, entrepreneurship training,
entrepreneur’s education (primary education), business experience, business size, business
location (urban area), loan interest, micro loan received, and contact with lender in that order are
found to have significant impact on the level of entrepreneur’s productivity in the trading sub-
sector. Among artisans, the most significant factors are entrepreneurial training, business
experience, business size and business location, regular contact with lender/loan officer, and
micro loan. In the manufacturing sector, regular contact with lender/loan officer was found to be
the most significant factor; other factors of significant impact are weekly repayment of loan,
business size, entrepreneur’s training, owner’s education and business experience in that order.
In the agricultural sub-sector, entrepreneur’s training was found to be the most important
contributory factor into entrepreneurs’ level of productivity.
5.3.4 Non – Financial Service of Microfinance Banks and Business Performance
The findings of this aspect of the study revealed a positive correlation between non – financial
service offered by Microfinance Banks especially and pre-loan training on business performance
of Microfinance Bank clients/customers. When the result was split into small and micro firms’
category, networking meetings and pre-loan training was found to have the highest coefficient
among small firm operators. This is an indication that the non-financial services provided by
MFBs affect business performance in different magnitudes and this will aid policy formulation
for MFBs in the development of programmes targeting both small and micro firms.
When the data was split by legal status, for registered business, group membership, pre-loan
training, advisory services and networking meetings are the microfinance variables that were
found to have significant impact on entrepreneur business performance. For unregistered
182

businesses, cross guaranteeship among members of a group was found to be the most significant
factor.
Lastly, when the data was split by kind of business activities, the result obtained reveals variation
in the magnitude of beta coefficient as it relates to business performance. In the trading sub-
sector, advisory services, pre-loan training, cross guaranteeship, group membership and
networking meetings are the most significant non-financial services that affect business
performance of MSE entrepreneurs in South-West Nigeria. The null hypothesis was also rejected
for this sample, leading to the acceptance of the alternative hypothesis. Among the artisan
entrepreneurs, pre-loan training exerts the most significant influence on business performance.
This is not surprising because the pre – loan training is not only mandatory, it is also the starting
point for all MFB clients as evidence of joining the bank. Other variables of significance are
advisory services and group membership. Cross guarantee, and networking meetings exert
negative influence on business performance. This is understandable since among artisans, the
kind of training and meetings required by each group will be different. May be an in-depth study
of different groups will generate a different kind of result.
In the manufacturing sector, the findings also revealed advisory services and pre-loan training as
the most significant factors to impact significantly on business performance. Most of the
entrepreneurs in this category are probably small scale business operators who may not found the
idea of group lending, cross guaranteeship suitable for their level of business. In the agricultural
subsector, networking meetings, group membership, and pre-loan training all exert positive
significant impact on entrepreneurs’ business performance. The alternative hypothesis was
accepted for the two sectors. In the service sub-sector, advisory service, group membership, and
net-working meetings in that order are the non-financial factors that contribute significantly to
business performance. The null hypothesis was rejected for this sample and the alternative
hypothesis was accepted. This implies that the non-financial activities of microfinance
institutions do enhance the business performance of MSEs in the service sector in South-West
Nigeria.
5.4 Hypotheses Testing
Hypothesis 1
183

The null hypothesis was rejected while we accepted the alternate hypothesis. This implies that
microfinance enhances survival of small business in South-West Nigeria.
Hypothesis 2The null hypothesis was accepted while we rejected the alternative hypothesis. This implies that
Microfinancing does not enhance growth and expansion capacity of MSEs in Nigeria.
Hypothesis 3The null hypothesis was rejected while we accepted the alternative hypothesis. This implies that
Micro finance impacts significantly on the level of productivity of MSEs operators in South-
West Nigeria.
Hypothesis 4The null hypothesis was rejected while we accepted the alternative hypothesis. This implies that
the provision of non-financial services by micro finance institutions enhances the performance of
MSEs in South – West Nigeria.
5.5 Other findings1. Most microfinance banks have more individual client members than group based clients.
With this, recovery of loans becomes very difficult, especially when there are no
collateral to fall back on.
2. The source of initial capital is mostly from the entrepreneurs’ personal savings.
3. The composition of initial capital revealed 53.6% as owners’ fund (equity finance),
26.3% is debt and equity combined, while 20.1% is debt finance only.
4. The result obtained revealed that 68.2% of the respondents would not like their enterprise
to be co-financed by banks or other private individuals, while 31.8% would not mind co-
financing.
184

5. Majority of the respondents agreed that they could more easily access microcredit than
bank credit.
6. Majority of respondents agreed that regular participation in microfinance enhanced their
business.
7. Only a few of the total respondents are involved in manufacturing business.
5.6 Conclusion of StudyEntrepreneurs in the small and micro sub-sector of the economy in Nigeria require access to
finance for their businesses to thrive on a sustainable basis. Although, the MSE sector
contributes significantly to the national economy, the sector has so far not been given due
recognition commensurate with level of the contribution. Although financial issues are important
to all firms, results from this study show that both financial and non-financial services obtained
from MFBs have highly benefited MSEs in Nigeria and have facilitated the sharing of business
skills and innovative ideas, as well as alleviated the acute shortage of finance to an extent. The
policy implication of this study is that, microfinancing contributes significantly to an enhanced
entrepreneurial environment by making the business environment more conducive and narrows
the resource gap for small businesses.
When properly harnessed and supported, microfinance can scale-up beyond the micro-level as a
sustainable part of the process of economic empowerment by which the poor improve their
situation. Based on findings from this study, the use of MFBs has potentials for enhancing the
performance of small businesses in three major ways- regular participation in microfinancing,
offering of non – financial services, and as a means to enhance entrepreneur’s productivity.
If we consider the variation in impact of these factors on the intensity of MSE growth and
survival within any one sub-sector, it is possible to define a common series of critical factors for
sub-sets of firms. This suggests that policies aimed at promoting the performance of micro and
small enterprises should adopt a sectoral approach. Thus, approaches and resources should
address the most critical determinants of performance in focal sub-sectors, aiming to augment
access to critical resources and, perhaps, overcome the disadvantages that cannot be easily
varied.
185

5.7 Recommendations1. Enterprises supported by MFBs should be linked up with larger financing windows like
the SMEEIS fund or Strategic Partners as suggested by Ojo (2003). The linkages should
be such that the entrepreneurs would be serviced through their MFBs based on social
capital. This will enable MFBs to introduce loan products and strategies targeted at
financing technology acquisition by MSEs.
2. In order to encourage technology acquisition for MSE expansion, MFBs can categorize
their loans into low and high interest loans. The conventional loans to clients can be
maintained as high interest loans, while loans for capital assets or technology acquisition
should be low interest loans, which can be secured by a mortgage over the fixed asset so
acquired by the micro-borrower. To achieve this, the Microfinance Banks can be
recapitalized.
3. MFBs should increase the duration of their clients' asset loans, or spread the repayment
over a longer period of time, or increase the moratorium. This will enable the clients to
have greater use of the loan over a longer period for the acquisition of capital assets and
technology.
4. The MFBs should employ collective group-based loan disbursement and staggered
disbursement strategy; this will reduce the default rate and the volume of portfolio at risk.
5. The microfinance banks should reduce the gap between their savings deposit rate and the
lending rate by mobilising more savings from the informal financial market which is an
integral part of their operating environment.
6. In terms of policy on support services, MFBs should assist their clients by providing
training on credit utilization and provide information on government programmes to
MSE operators in the country. Such MSE support and training institutions should be
strengthened and properly funded while the services should be properly delivered too.
MFBs can partner with relevant technology enterprise development organizations/skills
training institutions to provide client-focused skills training to their clients.
186

7. The small scale Industrial and Agricultural sectors should be given priority financing
from the N50billion micro credit capital fund since the sector is found to have the highest
mortality rate.
8. University education is found to have positive effects on entrepreneurs’ productivity;
Entrepreneurs should therefore be encouraged by the MFBs to improve on their current
level of education by engaging in adult education or life-long learning; as this will have
the potency to increase their level of productivity.
9. Banks should engage in target site selection and means testing before they are sited in a
particular location. This will enable the banks to develop appropriate financial product
that will suit the need of the entrepreneurs in a particular location rather than offering
blanket services that will not have positive impact on the MSEs growth.
10. MFBs should seek long-term capital from the Pension and Insurance Companies in the
country. This will help to reduce their lending rates and enable them spread their interest
payments over a longer period to encourage the acquisition of capital assets and
technology.
11. The MFBs should attend to loan proposals of MSEs through their business associations
and other self –help organisations. This will reduce the adverse effect of information
asymmetry. Social capital can be employed to obviate the need for tangible collateral.
12. The banks should employ relationship-based financing rather than insisting on a solid
business plan only, particularly since regular contact with lender is found to have positive
impact on MSEs survival.
Government/Regulators13. The CBN should not adopt a blanket financing option for all categories of businesses and
sectors within the economy. Rather, policies aimed at promoting the performance and
growth of micro and small enterprises should adopt a sectoral approach. Thus, resources
for each sector would address the most critical determinants of performance and growth
in focal sub-sectors.
187

14. The Government should urgently tackle the problem of infrastructure development and
maintenance. These include electricity, water and efficient transportation system which
impact greater on MSE operations. The bureaucratic bottleneck involved in small
business registration should also be removed.
15. A National Science and Technology policy that is properly funded; and an educational
policy with emphasis on technology and entrepreneurship education, should be
formulated and implemented for MSE growth and expansion in the country.
16. CBN should carry out frequent and thorough institutional appraisal of the microfinance
industry. This will allow for better assessment of the industry and enable the regulators
take prompt corrective action when necessary.
17. Government should establish relevant well adapted and appropriately structured
institutions and organizations to provide support for MSEs in such aspect as;
procurement, supply and distribution of raw material, supply of local/imported machines
for use on concessional terms, training in several technical grades, and create favourable
market conditions. They should also set up Tool Design Institute and Testing Centres for
raw materials and produced goods/service institute as earlier suggested by Ojo (2006).
5.8 Contributions to Knowledge
This study contributes to the body of knowledge on the field of micro-financing and
MSEs’ survival and growth. The study will be of help to the operators of small and micro
enterprise who are users of Microfinance Banks across the six States of South-West
Nigeria, Micro Finance Banks operators, SME policy makers, and academia.
The following are the specific contributions of our study:
1. Unlike previous studies on Nigerian firms, this study uses panel data as well as
survival analytical techniques incorporating Kaplan- Meier and Cox regression
analysis, using Nigerian data, thus introducing the emerging microfinance
industry data into survival analysis.
2. The study provided empirical evidence of the variables that enhance small
business productivity and performance. This will enable entrepreneurs to
188

concentrate more on factors that sustain business growth, thus giving insightful
information concerning the practice, process and mode of operation of
Microfinance Banks in Nigeria.
3. The study also showed the strength and limitation of microfinance as a method of
financing MSEs in Nigeria by providing evidence that microfinance can only
support the survival but not the growth of MSEs in Nigeria.
4. The study succeeded in operationalizing small business survival, growth and
entrepreneurs’ productivity, providing empirical evidence on the survival rate and
survival probability for enterprise financed by microfinance banks in South-West
Nigeria.
5.9 Suggestions for further Research
This research study has revealed numerous research opportunities in the field of micro
financing, particularly in the development of Microfinance Banks in Nigeria. Other areas
that could be of researchers interest includes, but not limited to the followings:
a. Interest Rate Determination and Microfinance Bank Performance in Nigeria
b. Group versus Individual Liability: A Field Experiment of Microfinance Bank in
Nigeria
c. Teaching Entrepreneurship: Impact of Business Training on Microfinance Clients
and Institutions
d. Impact analysis of Microfinance Banks on Small business Development- An in-
depth analysis of different sectors of the economy.
e. A group-based study of different trade group among artisans in Nigeria – A
microcredit approach.
BIBLOGRAPHY
Abugu, I. (2007, June). SME: Issues, Challenges & Prospects, Paper presented at the Abuja International Conference on Financial System Strategy 2020, Retrieved from http://www.cenbank.org/fss/mon/FSS2020Presentation%20at%20International%20Conference.ppt.
189

Abosede, A. J. (2000). Sampling and Sampling Techniques in Research Methods in the Social and Management Sciences, Centre for Sandwich Programmes (CESAP), Ogun State University, Ago-Iwoye.
Adelaja, B. O. (2003). Financing Small and Medium Enterprises under SMIEIS: Operators Perspective, Paper delivered at Small and Medium Industries Equity Investment Scheme (SMIEIS) Seminar. CBN Training Centre, Lagos.
Adegbite, E. O. (1995). Effective Growth and Survival of SMEs in Nigeria in the 1990s and Beyond: The Role of Policy. Ojo J. A. T (Eds) Management of SMEs in Nigeria. (Lagos) Concept Publishers, Chapter 7, pp 80 – 98.
Adizes. I. (1979). Organisational Passages – Diagnosing and Treating Life-cycle Problems of Organisations, Organisational Dynamics (Summer), 9(1), 3-25.
Afrane, S. (2002). Impact assessment of microfinance interventions in Ghana and South Africa: A synthesis of major impacts and lessons, Journal of Microfinance 4(1), 37- 58.
Agarwal, R. and Gort, M. (1996). The Evolution of Markets and Entry, Exit and Survival of Firms, The Review of Economics and Statistics, 78(3), 489-498.
Alexander, G. (2005). An Empirical Analysis of Microfinance: Who are the Clients?, Paper presented at 2005 Northeastern Universities Development Consortium Conference, Australia. Retrieved from www.adbi.org
Almus, M., and Nerlinger, E. (2000). Testing Gibrat’s law for young firms – Empirical Results forWest Germany, Small Business Economics, 15, No. 112.
Almus, M., and Nerlinger, E. (1999). Growth of technology based firms: Which factors matter?,Small Business Economics, 13, No. 141154.
Anyanwu, C. M. (2003). The Role of Central Bank of Nigeria in Enterprises Financing, Paper delivered at Small and Medium Industries Equity Investment Scheme (SMIEIS) Seminar. CBN Training Centre, Lagos.
Anyanwu, C. M. (2004). Microfinance Institutions in Nigeria: Policy, Practice and Potentials Paper Presented at the G24 Workshop on Constraints to Growth in Sub-Saharan Africa, Pretoria, South Africa, November 29-30,
Arbaugh, J. B. and Sexton, D. L. (1996). ‘New Firm Growth and Development: A Replication and Extension of Reynolds’ Research, Journal of Enterprising Culture. 4(1), 19 – 36.
Audretsch, D.B. and Mahmood, T. (1991). The Hazard Rate of New Establishments, Economic Review, 36(2), 409-412.
Audretsch, D.B. and Mahmood, T. (1995). New firm survival: new results using a hazard function, The Review of Economics and Statistics, 77(1), 97-103.
190

Anaro, B. (2006, July 18). CBN says microfinance will empower the poor, provide jobs. Retrieved on 13th May 2007 from the website: www.businessdayonline.com
Anderson, C. L, Locker, L., and Nugent, R. (2002). Microcredit, social capital, and common pool resources, World Development, 32(1), 95-105.
Aryeetey, E., Abaah, A., Duggleby, T., Hettige, H., and Steel, W. (1994). Supply and demand for finance of small enterprise in Ghana, Discussion Paper Number 251, Washington DC, World Bank.
Asika, N. (1991). Research Methodology in the Behavioral Sciences, Lagos, Longman Nigeria,
Bamberger, I. (1983). Value systems strategies and the performance of small and medium-sized firms, European Small Business Journal, 1 (4), 25-39
Barry, B. (1978). Organization design in the smaller enterprise, in D. T. Bryault, and R. J. Niehaus, (Eds.), Manpower, planning and organization, New York: Plenum Press.
Barnes, C., Morris, G., and Gaile, G. (1999). An Assessment of Client of Microfinance Programs in Uganda, International Journal of Economic Development, 1, 80-121.
Bartlett, J .E., Kotrliik, J.K., and Higgins, C. C. (2001). Organizational research: determining appropriate sample size in survey research, Information Technology, Learning, and Performance Journal, 19(1), 5-12.
Baumback, C. M. and Lawyer, K. (1979). How to organize and operate a small business. (6th ed.), Englewood Cliffs, NJ: Prentice-Hall.
Barnes, C., and Keogh, E. (2001). An Assessment of the Impact of Zambuko’s Microenterprise Program in Zimbabwe: Baseline Findings. Assessing the Impact of Microenterprises (AIMS) Paper, Washington, D.C, Management Systems International.
Banerjee, A. and Newman, A. (1993). Occupational choice and the process of development. Journal of Political Economy, 101(2).
Bekele, E and W. Zeleke, (2008). Factors that affect the long-term survival of micro, small and medium enterprises in Ethiopia. South African Journal of Economics, 76 (3), 1-33.
Bernard, A. B., and Jensen, J. B. (2007). Firm structure, multinationals and manufacturing plant deaths. Review of Economics and Statistics, 84(2), 193–204.
Berger, M. (2000), Microfinance: An Emerging Market within the Emerging Markets. Washington DC, Inter-American Development Bank.
Berger, A. N. and Udell, G. F. (1998). The economics of small business finance: the roles of private equity and debt markets in the financial growth circle. Journal of Banking and
191

Finance Vol. 9 No. 22, pp. 873-897.
Beverland, M. and Lockshin, L. S. (2001). Organizational life cycle in small new zealand wineries. Journal of Small Business Management, 39 (4), 354-362.
Bigsten, A., Collier, P., Dercon, S., Fafchamps, M., Gauthier, B., Gunning, J. W., et al. (2005). Adjustment costs and irreversibility as determinants of investment: Evidence from African manufacturing. Journals in Economic Analysis and Policy, 4(1), 1–29.
Bolnick, B. R. and Nelson, E. R. (1990). Evaluating the economic impact of a special credit programme: KIK/KMKP in Indonesia. Journal of Development Studies, 26(1), 299-312.
Bogetic, Z., and Sanogo, I. (2005). Infrastructure, productivity and urban dynamics in Co te d’Ivoire: An empirical analysis and policy implications. Africa region working paper series no. 86. The World Bank, Washington, DC.
Brau, J. C. and Osteryoung, J. S. (2001). Micro – IPOs: An analysis of issues made under the small corporate offering registration (SCOR) Procedure. Journal of Small Business Management, 39(3), 209 – 227.
Brown, J. D, Earle, J. S. and Lup, D. (2004). What makes small firms grow? finance, human capital, technical assistance, and the business environment in romania (october). IZA Discussion Paper No. 1343; Upjohn Institute Staff Working Paper No. 03-94.
Carpenter, C. (2001). Making Small Business Finance Profitable in Nigeria: SME finance in Nigeria. Retrieved on 18th March. 2007 from the website: www.nipc-ng.org.
Carland, J., Hoy, F., Boulton, W., and Carland, A. (1984). Differentiating entrepreneurs from small business owners: a conceptualization. Academy of Management Review, 9(2), 354-359.
Caves, R. E., and Porter, M. E. (1977). From entry barriers to mobility barriers: Conjectural decisions and contrived deterrence to new competition. Quarterly Journal of Economics, 91(2), 241–262.
Central Bank of Nigeria (2005), Microfinance, Regulatory & Supervisory framework for Nigeria.http://www.cenbank.org/OUT/PUBLICATIONS/GUIDELINES/DFD/2006/MICROFINANCE%20POLICY.PDF’. Accessed on Jan. 13, 2008.
Central Bank of Nigeria (2004), Draft National Microfinance Policy and Regulatory Guidelines forNigeria.<<http://www.cenbank.org/OUT/PUBLICATION/DRAFT/DFD/2005/MICROFINANCE%20POLICY.PDF’>. Accessed on June. 18, 2007.
Central Bank of Nigeria CBN 2007, annual report. <http://www.cenbank.org/documents/annualreports. asp. Assessed on Dec. 12, 2008
192

Chaganti, R. W. and Chaganti, R. (1983). A profile of profitable and not-so-profitable small business. Journal of Small Business Management, 21(3), 43-51.
Chan, Y. E., Bhargava N., and Street, C. T. (2006). Having arrived: the homogeneity of high growth small firms. Journal of Small Business Management, 44(3), 426 – 440.
Chapelle, K., and Plane, P. (2005). Technical efficiency measurement within the manufacturing sector in Coˆ te d’Ivoire: A stochastic frontier approach. The Journal of Development Studies, 41(7), 1303– 1324.
Chaston, I. and Mangles, T. (1997). Core capabilities as predictors of growth potential in small manufacturing firms. Journal of Small Business Management, 35 (1), 47–57.
Chaston, I., Badger, B. Mangles, T. and Sadler-Smith, E. (2001). Organizational learning style, competencies, and learning system in small, UK manufacturing firms. International Journal of Operations and Production Management, 21(11), 1417 – 1432.
Charistonenko, S. (2004). Policy issues in licensing microfinance institutions that accept deposits from the public. Presented on March 18, at the International Validation Summit on Microfinance Policy and Regulatory Guidelines, Central Bank of Nigeria, Abuja.
Chatfield, C. (1995). Model uncertainty, data mining and statistical inference (with discussion). Journal of the Royal Statistical Society A, 158, 419 - 466.
Cheston, S. and Reed, L. (1999). Measuring transformation: assessing and improving the impact of microcredit. Microcredit Summit Campaign, Washington, D.C.
Chittenden, F., Hall, G. and Hutchinson, P. (1996). Small firms growth, access to capital markets and financial structure: Review of issues and an empirical investigation. Small Business Economics 8, 59-67.
Christen, R. P. (1999). Bulletin Highlights. MicroBanking Bulletin, Issue No. 3, July.
Cochran, T. (1971). The Entrepreneur in Economic Change. Entrepreneurship andEconomic Development, The Free Press.
Chowdhury, S. D. and Lang, J. R. (1993). Crisis, decline and turnaround: a test of competing hypotheses for short term performance improvement in small firm. Journal of Small Business Management, 31(4), 8-17.
Chowdhury, S. K., and Wolf, S. (2003). Use of ICTs and the economic performance of SMEs in East Africa. World Institute for Development Economics Research. Discussion paper no. 20003/06.
Churchill, N. C. (1983). Entrepreneurs and their enterprises: A stage model”, in J. A. Hornaday,
J. A. Timmons, & R.H. Vesper (Eds.), Frontiers of entrepreneurship research, pp. 1-22 Babson Park, MA: Babson College.
193

Churchill, N. C., & Lewis, V. L. (1983). The five stages of small business growth. Harvard Business Review, 61(3), 30-50.
Coleman, S. (2000). Access to capital and terms of credit: a comparison of men-and women owned small business. Journal of Small Business Management, 38(3), 37-53.
Coleman, B. E. (1999). The impact of group lending in Northeast Thailand. Journal ofDevelopment Economics, 60, 105-142.
Coleman, B. (2002). Microfinance in Northeast Thailand: who benefits and how much?” Manila: Asian Development Bank.
Cooper, A. C., Gimeno-Gacson, and Woo, C. Y. (1994). Initial human and financial capital as predictors of new venture performance. Journal of Business Venturing, 9(1), 371-395.
Cuba, R. C. and Milbourne, G. (1982), Delegation for small business success. American Journal of Small Business, 7(2), 23 - 41
Crapp, H. R. and Stevenson, M. (1987). Development of a method to assess the relevant variables and the probability of financial distress. Australian Journal of Management, 12(2), 221-236.
Cressy, R. (2006). Why do most firms die young?. Small Business Economics, 26, 103–116.
Cochran, W. G. (1977), Sampling techniques (3rd ed.), New York, John Wiley & Sons.
Copestake, J. (2002). Inequality and the Polarizing Impact of Microcredit: Evidence from Zambia’s Copperbelt. Journal of International Development, 14, 743-755.
Copestake, J., S. Bhalotra, and Johnson, S. (2001). Assessing the impact of microcredit: A Zambian case study. Journal of Development Studies, 37 (4), 81-100.
Cox, D. R. (1972). Regression models and life-tables. Journal of the Royal Statistical Society,34, 187-220.
Das, S. and Srinivasan, K. (1997). Durations of firms in an infant industry: the case of indian computer hardware. Journal of Development Economics, 53(1). 157-167.
D’Amboise, G. and Y. Gasse, (1980). Performance in small firms and the utilization of formal management techniques. Paper presented at The Joint National Meeting of TIMSIORSA, Washington, DC.
D'Amboise, G. (1974). Personal characteristics, organizational practices and managerial effectiveness: A comparative study of French and English-speaking chief executives in Quebec”. Unpublished doctoral dissertation, University of California, Los Angeles.
194

D’Amboise, G. (1986). A survey of strategic planning models for small business. Journal of Small Business and Entrepreneurship, 3(3), 617-650.
D'Amboise, G., and Gasse, Y. (1982). Managerial difficulties as perceived by small business owner-managers: Where are the similarities and differences?” Working Paper 82, Faculte des sciences de l'administration, Lava1 University.
Daniels, L., & Mead, D. (1998). The contribution of small enterprises to household and national income in Kenya. Economic Development and Cultural Change, 47(1), 46–71.
Daniels, L. (2003). Factors that influence the expansion of the microenterprise sector: results from three national surveys in Zimbabwe. Journal of International Development, 15, 675–692.
Davidson, P. (1989). Entrepreneurship and after? a study of growth willingness in small firms. Journal of Business Venturing, l(4), 211-226.
Davidson, P. (1991). Continued entrepreneurship: ability, need and opportunity as determinants of small firm growth. Journal of Business Venturing, 6, 405-429.
Davidson, P., Kirchhoff, B., HatemiJ, A., and Gustavsson, H. (2002). Empirical analysis of business growth factors using Swedish data. Journal of Small Business Management, 40, 332349.
De Carlo, J. T. and Lyons, P. R. (1980). Toward a contingency theory of entrepreneurship. Journal of Small Business Management, 18(3), 37- 42.
Deeks, J. (1973). The small firm asset or liability?. Journal of Management Studies, 10(1), 25- 47.
Delmar, F., Davidson, P. and Gartner, W. B. (2003). Arriving at the High Growth Firms.’ Journal of Business Venturing, 18, 189-216.
Dill, W. R. (1958). Environment as an influence on managerial autonomy. Administrative Science Quarterly, 2, 409-443.
Diseny, R., Haskel, J., & Heden, Y. (2003). Entry, exit and establishment survival in UK manufacturing. Journal of Industrial Economics, 51(1), 91–112.
Dodge, H. R., Fullerton, S. and Robbins, J.E. (1994). Stage of the Organizational Life Cycle and Competition as Mediators of Problem Perception for Small Business Management.Journal of Small Business Management 30(1), 27-37.
Dollinger, M. J. (1983). The effects of environmental, organizational and personal characteristics on boundary spanning activities and organizational performance in small business firms. Dissertation Abstracts international, 44 (3), 850-901
195

Djankov, S., Miguel, E. Qian, Y. Roland, G. and Zhuravskaya, E. (2005). Who are Russia’s Entrepreneurs?. Journal of the European Economic Association, 3(2), 587-597.
Dunn, E. (2002). It Pays To Know the Customer: Addressing the Information Needs of Client-Centered MFIs. Journal of International Development, 14, 325-334.
Dunn, E. (2001). Microcredit and Microenterprise Performance: Impact Evidence from Peru. Small Enterprise Development Journal, 12, 22-33.
Ebel, R.L., and Frisbie, D. A. (1991). Essentials of Educational Measurement, Englewood Cliffs, NJ: Prentice Hall.
Edrnunds, S. W. (1979). Differing perception of small business problems. American Journal of Small Business, 3(4), 1-14.
England, G. W. and Lee, R. (1973). Organization size as an influence on perceived organizational goals: A comparative study among American, Japanese and Korean managers.” Organizational Behavior and Human Performance, 9, 45-50.
Eyiah, A. K., and Cook, P. (2003). Financing small and medium-scale contractors in developing countries: A case of Ghana. Construction Management Economics, 21, 357–367.
Evans, D. (1987). Tests of alternative theories of firm growth, The Journal of Political Economy95, 657674.
Fafchamps, M., & Gabre-Madhin, E. (2001). Agricultural markets in Benin and Malawi: The operation and performance of traders. Rural Development Department, Policy research working paper 2734. The World Bank, Washington, DC.
Fafchamps, M. (2003). Ethnicity and networks in African trade. Contributions to Economic Analysis and Policy, 2(1), 1–53.
Fafchamps, M. (2004). Market Institutions in Sub-Saharan Africa: Theory and evidence. Massachusetts: MIT Press
Fagbenle, O. I., Adeyemi, A., and Adesanya, D. A. (2004). The impact of non-financial incentives on bricklayers’ productivity in Nigeria. Construction Management Economics, 22, 899–911.
Fasoranti, M. M, Akinrinola, O. O. and Ajibefun I. A. (2006). Impact of microcredit and training on effeciency of small scale entrepreneurs: Evidence from National Directorate of Employment (NDE) Loan/training programmes in Nigeria. The Social Sciences 1 (4) 264 – 269.
Filley, A. C., and Aldag, R. J. (1978). Characteristics and measurement of an organizational Typology. Academy of Management Journal, 21, 578-591.
196

Fink, A. (1995). The survey handbook, Thousand Oaks, CA: Sage Publications.
Frazer, G. (2005). Which firms die? A look at manufacturing firm exit in Ghana. Economic Development and Cultural Change, 53(3), 585–617.
Frazer, G. (2006). Learning the master’s trade: Apprenticeship and human capital in Ghana. Journal of Development Economics, 81, 259–298.
Gabe, T. M. (2007). Local economic instability and business location: The case of Maine. Land Economics, 83(3), 398–411.
Garmaise, P. and Natiridada, M. (2010), Information, the Cost of Credit, and Operational Efficiency: An Empirical Study of Microfinance. Review of Financial studies: Oxford Journal, 23(6), 2560 – 2590.
Gaskill, L. R. and Van Auken H. E. (1993). A Factor Analytic Study of the Perceived Causes of Small Business Failure. Journal of Small Business Management, 31(4), 18-32.
Gaston, P. and Marshall, R. W. (2003). Survival Analysis is a Better Estimation of recurrent disc Herniation. The Journal of Bone & Joint Surgery, 85-B, (4), 74-105.
Gentry, J. A., Newbold, J. P and Whitford, D. T. (1985). Predicting Bankruptcy: If Cash Flow's Not the Bottom Line, What Is It?. Financial Analysts Journal, 41(5), 47- 56.
Ghemawat, P., and Nalebuff, F. (1985). “Exit”. The Rand Journal of Economics, 16(2), 184- 194.
Goffee, R., and Scase,R. (1995), Corporate Realities, London, Routledge.
Goetz, A. and Gupta, R. S. (1996).Who Takes the Credit? Gender, Power, and Control over Loan Use in Rural Credit Programs in Bangladesh. World Development, 24, 45-63.
Gómez , R and Santor, E. (2001). Does the Microfinance Lending Model Actually Work? The Whitehead Journal of Diplomacy and International Relations, IX(2), 21-48.
Gomez, R. and Santor, E. (2001). Membership has its privileges: The effect of Social Capital and Neighourhood Characteristic on the Earnings of Microfinance borrowers. The Canadian Journal of Economics, 34(4), 943 – 966.
Greiner, L. E. (1972). Evolution and revolution As Organizations grow. Harvard Business Review, 50 (4), 37- 46.
Gronlund, N.E. and Linn, R. L. (1990). Measurement and Evaluation in Teaching (6th ed.) New York, Macmillan.
Gundry, L.K. and Welsch, H. P. (1997). Frontiers of Entrepreneurship Research”. Retrieved on 18th February, 2007 from the website: www.babson.edu/entrep/fer/papers97
197

Harding, A., Soderbom, M., and Teal, F. (2004). survival and success among African manufacturing firms. Centre for Study of African Economics, University of Oxford.
Hall, G., Hutchinson, P. and Micheals, N. (2000). Industry Effects of the Determinants of Unquoted SMEs Capital Structure. International Journal of the Economics of Business, 7( 3), 297-312.
Hall, B., (1987). The relationship between firm size and firm growth in the U.S. manufacturingsector. Journal of industrial economics, 35, 583606.
Harrell, F. E. (2001). Regression Modeling Strategies: with applications to Linear models,Logistic Regression and Survival Analysis, Chapter 16, Springer Series in Statistics. Springer, New York.
Hartarsk, V. and Nadolnyak, D. (2008). An Impact Analysis of Microfinance in Bosnia and Herzegovina. World Development, 8(3), 341 – 405.
Harhoff, D., Stahl, K. and Woywode, M. (1998). Legal form, growth and exit of West Germanfirms – Empirical results for manufacturing, construction, trade and service industries. Journal of Industrial Economics, 46, 453489.
Hanks, S. H., Watson, C. J., Jansen, E. and Chandler, G.N.(1993). Tightening the Life-Cycle Construct: A Taxanomic Study of Growth Stage Configurations in High Technology Organisations. Entrepreneurship Theory and Practice, 1(2), 5-29.
Hensler, D.A., Rutherford, R. C. and Springer, T.M. (1997). The Survival of Initial Public Offerings in the Aftermarket. The Journal of Financial Research, 20(1), 93-110.
Honjo, Y. (2000). Business Failure of New Firms: An Empirical Analysis Using a Multiplicative Hazards Model. International Journal of Industrial Organization, 18(4), 557-574.
Hillidge, J. (1990). Planning for Growth in a Small Company. Long Range Planning, 23(3),76-81.
Hisrich, R. D. and Peters, M. P. (1998). Enterpreneurship, 4th ed. Irwin/McGraw-Hill.
Holmes, S., and Kent, P. (1991). An Empirical Analysis of the Financial Structure of Small and Large Australian Manufacturing Enterprises. Journal of Small Business Finance, 1(2) 141-154.
Hulme, D. (1997). Impact Assessment Methodologies for Microfinance: A review Paper prepared in conjunction with the AIMS project for the Virtual Meetings of the CGAP Working Group.
Inegbenebor, U (2006). Financing Small and Medium Industries in Nigeria – Case Studies of (SMIEIS) Empirical Research Findings. Journal of Financial Management and Analysis,
198
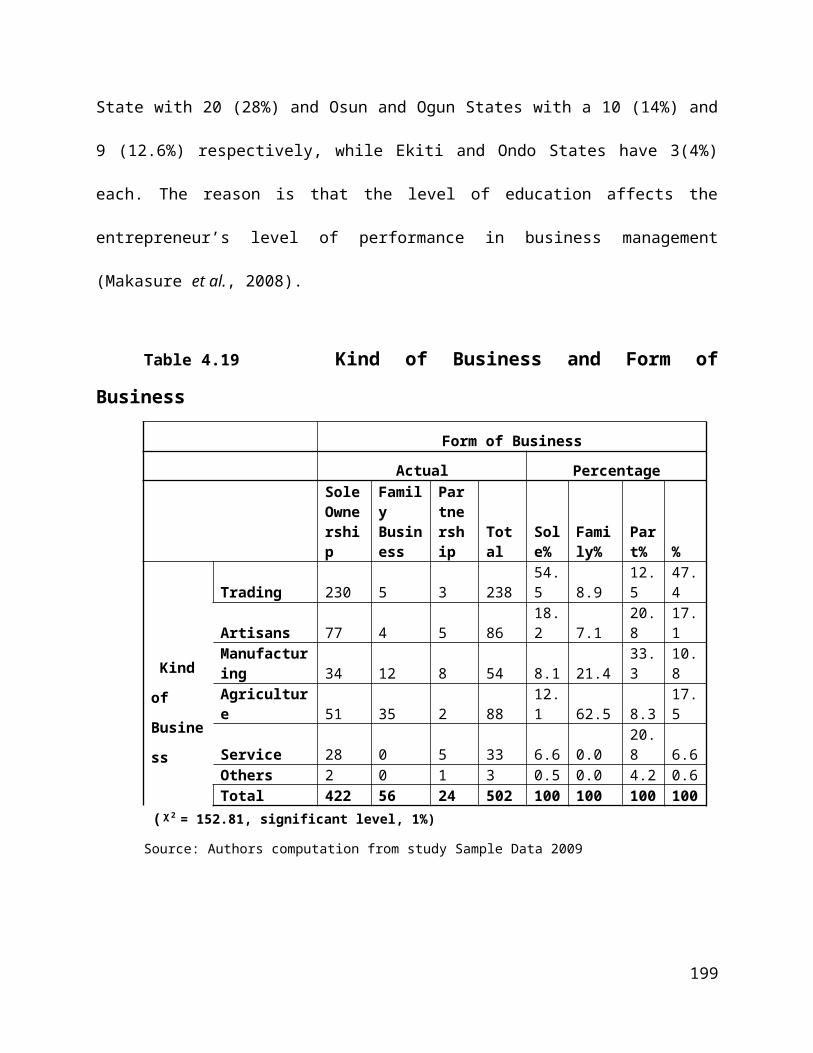
19(1). 19-38.
Jones, R. G. (1979). Analyzing Initial and Growth Financing for Small Business. Management Accounting, 61(5), 30-38.
Jovanovic, B. (1982). Selection and Evolution of Industry. Econometrica, 50(3), 649-670.
Julien, P. A. and Ramangalahy, P. (2003). Competitive Strategy and Performance of Exporting SMEs: An Empirical Investigation of the impact of their Export information search and Competencies. Entrepreneurship Theory and Practice, 27(3), 227- 268.
Kao, R. W. (1982). Management control system for small and medium firms. Conference Proceedings of International Council for Small Business, Canada. 31-42.
Kalbfleisch, J. D. and Prentice, R. L. (1980). The Statistical Analysis of Failure Time Data. New York, NY: John Wiley and Sons.
Kauffman, R.J. and Wang.B. (2001). New Buyers’ Arrival under Dynamic Pricing Market Microstructure: The Case of Group-Buying Discounts of the Internet. Journal of Management Information Systems, 18(2), 18 – 49.
Kauffman, R. and Wang, B. (2001). The success and failure of dotcoms: A multi-method survival analysis. In Proceedings of the 6th INFORMS Conference on Information Systems and Technology (CIST), Miami, FL, USA.
Kauffman, R. and Wang, B. (2003). Duration in the digital economy: Empirical bases for thesurvival of internet firms”, In 36th Hawaii International Conference on System Sciences (HICSS), Hawaii.
Keasey, K., McGuinness, P. and Short, H. (1990). Multilogit approach to predicting corporate failure: Further analysis and the issue of signal consistency. Omega, 18(1), 85-94.
Kevane, M., and Wydic, B. (2001). Microenterprise Lending to Female Entrepreneurs: sacrificing economic growth for poverty alleviation? World Development, 29, 1225-1236.
Khan, M. R., and Rocha, J.R. (1982). Recurring managerial problems in small business. American Journal of Small Business, 7(1), 50-58.
Khandker, S. R.(2005). Microfinance and Poverty: Evidence Using Panel Data from Bangladesh. World Bank Economic Review, 19(2), 263 – 286.
King, W. R., and Teo, T. S. (1997). Integration between Business Planning and Information System Planning: Validating a Stage Hypothesis. Decision Sciences, 28(2), 279-308.
Kimberely, J. R. and Miles Associates. (1980). The Organizational Life Cycle, San Francisco, Jossey-Bass.
199
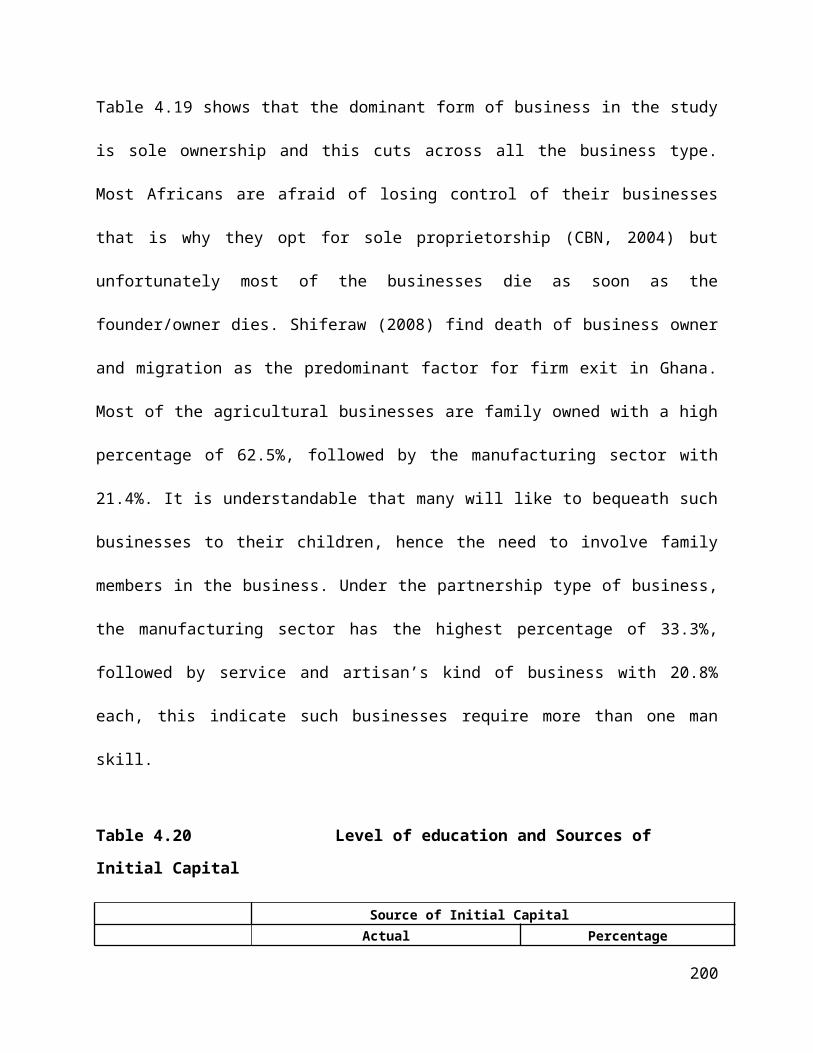
Kihlstrom, R. and Laffont, J.J. (1979). A General Equilibrium Entrepreneurial Theory of Firm Formation Based on Risk Aversion. Journal of Political Economy, 5(9), 719-748.
Knight, F. (1921). Risk, Uncertainty and Profit, New York: Houghton Mifflin.
Kolvereid, L. and Bullvag, E. (1996). Growth Intentions Actual Growth: The Impact of Enterpreneural Choice. Journal of enterprising Culture, 4(1). 1 – 17.
Kolvereid, L. (1992). Growth Aspirations among Norwegian Entrepreneurs. Journal of Business Venturing, 7(4), 209 – 222.
Kotir and Obeg – Odoom (2009). Microfinance and Rural Household Development: A Ghanaian Perspective. Journal of Developing Societies, 25(1), 85-105.
Laitinen, E. K. and Luoma, M. (1991). Survival analysis as a tool for company failure prediction. Omega, 19(6). 673-678.
Laitinen, T. and Kankaanpää, M. (1999).Comparative analysis of failure prediction methods:the Finnish case. The European Accounting Review, 8(1), 67-92.
Lane, W. R., Looney, S. W., and Wansley, J.W. (1986). An application of the Cox proportionalhazards model to bank failure. Journal of Banking and Finance, 10(4), 511-531.
Lawson, B. (2007). Access to finance for SMEs, Paper at the Abuja International Conference on Financial System Strategy 2020, Retrieved from http://www.cenbank.org/fss/mon/FSS2020Presentation%20at%20International%20Conference.ppt.
Lapenu, C and Zeller, M. (2001). Distribution, Growth and Performance of Microfinance Institutions in Africa, Asia and Latin America.FCND Discussion Paper No. 114
Lavoie, D., and Culbert, S. A. (1978). Stages of Organization and Development,’’ Human Relations, 5(2), 417-438.
Lapenu, C. (1998). Indonesia’s rural financial system: The role of the state and private institutions. Case Studies in Microfinance, Sustainable Banking with the Poor, Asia Series. World Bank, Washington, D.C.
Lapenu, C. (2000). Multicountry synthesis report on institutional analysis”. Report to the Federal Ministry for Economic Cooperation and Development (BMZ), Germany. International Food Policy Research Institute, Washington, D.C.
LeVine, R. (1966). Dreams and deeds: achievement motivation in Nigeria. The University ofChicago Press, Chicago and London.
Lieberman, M.B. (1990). Exit From Declining Industries: “Shakeout” or ‘Stakeout”?” The
200

RAND Journal of Economics, 21(4), 538-554.
Lucas, R. E. (1978). On the size distribution of business firms. Bell Journal of Economics, 9. 508-523.
Maduagwu, A, (2006). Alleviating poverty in Nigeria: using micro- finance as a strategy for poverty reduction. CBN Economic & Financial Review, 39(4), 28-52.
Manroth, A. (2001). How Effective is Microfinance in CEEC and the NIS?’’ A Discussion of Impact Analysis to Date.” Washington, D.C., AIMS.
Mambula, C. (2002). Perceptions of SME growth constraints in Nigeria.(Global Perspective)”. Journal of small business management, 34.(4), 258 – 271.
Mahdi, L and Osman, M. (2000). An assessment of the effectiveness of small and micro enterprise finance in employment creation. Journal of Small Enterprise, 5(3),23 – 51.
Masurel, E. and Montfort, K.V. (2006). Life cycle characteristics of small professional service firms. Journal of Small Business Management, 44(3), 461 – 437.
Masakure, O., Cranfield, J., and Henson, S. (2008). The Financial Performance of Non-farm Microenterprises in Ghana. World Development, 36(12), 2733–2762.
Matouv, D., (2006). Microfinance and aoverty alleviation Uganda --A Case Study Of Uganda Finance Trust, School of Global Studies, Master Thesis Africa and International Development Cooperation.
McGuire, J. W. (1976). The small enterprise in economics and organization theory. Journal of Contemporary Business, 5(2), 115-138.
McKenna, I. F. and Oritt, P.L. (1981). Growth planning for small business. American Journal of Small Business, 5(4), 19-29.
McKernan, S. (2002). The Impact of Microcredit Programs on Self-Employment Profits: Do Noncredit Program Aspects Matter? The Review of Economics and Statistics, 84(1), 93-115.
Mehnez, R and Munshi, L. (2006). Financing SMEs and its effect on employment Generation: A study of Brac Bank’s SME lending”. Research & Evaluation division. Retrieved on February 2008, from website: www.bracresearch.org
Microcredit Summit Campaign. (1998). Directory of institutional profiles. Microfinance Institutions, Washington, D.C.
Miller, D. and Friesen, P. H. (1982). Innovation in conservative and entrepreneurial firms: Two
201

models of strategic momentum. Strategic Management Journal, 3(1), 10-25.
Miltra, R., and Pingali, V. (1999). Analysis of growth stages in small firms: a case study of automobile ancillaries in India. Journal of Small Business Management, 37(3), 43-61.
Mitra, R. (2002). The growth pattern of women-run enterprises: An empirical study in India. Journal of Developmental Entrepreneurship, 7(2), 217–237.
Mitullah, W. V. (2003). Street vending in African Cities: A synthesis of empirical findings from Kenya, Cote D’ivoire, Ghana, Zimbabwe, Uganda and South Africa. Background paper for the 2005 world development report. University of Nairobi, Institutefor Development Studies.
Mossman, C.E., Bell, C. G., Swartz, L. M. and Turtle, H. (1998). An empirical comparison of bankruptcy models. The Financial Review, 33(2), 35-53.
Mount, J. L., and Slevin, D. P. (1993). Organizing for development in the small business. Long Range Planning, 26(5), 111 – 120.
Mosley, P. (2001). Microfinance and poverty in Bolivia. The Journal of Development Studies, 37, 101-132.
Mosley, P. and Hulme, D. (1998). Microenterprise finance: Is there a conflict between growth and poverty alleviation? World Development , 26, 783-790.
Morduch, J. (1998). Does Microfinance Really Help the Poor? New Evidence from Flagship Programs in Bangladesh. Princeton University working paper.
Morduch, J. (1998). The Microfinance Promise. Journal of Economic Literature, XXXVII, 1569–1614
Morduch, J., and Haley, B. (2001). Analysis of the Effects of Microfinance on Poverty Reduction. NYU working paper.
Niskanen, M and Niskanen, J. (2007). The determinants of firm growth in small and micro firms – evidence on relationship lending effects. Small Enterprise Development , 24, 45-63
Nigerian Institute Of Social And Economic Research (NISER)(2004), Baseline Economic Survey Of Small And Medium Scale Industries In Nigeria, National Synthesis Final Report; Survey Of Existing Small And Medium Industries Part A (Chapters 1-4),SUBMITTED To Implementation Committee On Baseline Economic Survey Of SMIs In Nigeria.
202

Nigeria Investment Promotion Council (2001). Carpenter, C., (2001).‘‘Making small Business Finance Profitable in Nigeria - SME finance in Nigeria. <http://www.nipc.gov.ng/paperpresentation.html Accessed on March. 18, 2007.
O’Farrell, P. N. and Hichens, D. M. (1988). ‘‘Alternative theories of small firm growth: ACritical Review. Environment and Planning, 20, 1365 – 1383.
Ogg, P. J. (1988). “Quantitative aspects of modelling financial distress. Working Paper.Submitted to The Inaugural Australasian Finance and Banking Conference without acceptance.
Ogunrinola O. I and Alege, P. O. (2007). Microcredit and microenterprise development: An analysis of some rural based enterprises in Nigeria. Nigeria Journal of Economics and Social Studies, 49(1), 95 – 113.
Ojo, Ade T. (2010). The Nigerian Maladapted Financial Systems: Reforming Tasks and Development Dilema, CIBN Press Ltd, Lagos, 229-342.
Ojo, J. A. T. (2007). Reforms in the Microfinance Sub-sector” Lead paper presented at the 1st Annual National Conference on “Economic Reforms and The Nigerian Financial System. Organized by the Dept of Banking and Finance, University of Lagos.
Ojo, J. A. T. (2006). Using SMEs to Achieve Millenium Development Goals: Challenges and Prospects, Covenant Journal of Business and Social Sciences, 1(1), 20-35
Ojo, J. A. T. (2003). Partnership and Strategic Alliance Effective SME Development. Small and Medium Enterprises Development and SMIEIS: Effective Implementation Strategies; CIBN Press Ltd, Lagos, 185-212.
Olaseni, A. M. (2004). Basic Principles of Research. Lagos, Concept Publications Ltd.
Olorunshola, J. A. (2003). Problems and Prospects of Small and Medium Scale Industries in Nigeria. Seminar paper delivered at Small and Medium Industries Equity Investment Scheme (SMIEIS) Seminar. CBN Training Centre, Lagos.
Olowe, R. A. (2008). Financial Management, Concepts, financial System and Business Finance, Lagos, Brierly Jones Nigeria Ltd.
Olutayo. O. A. (1999). The Igbo Entrepreneur in the Political Economy of Nigeria, African Study Monographs, 20(3): 147 – 174.
Olutunla, G. T and Obamuyi, T. M. (2008). An empirical analysis of factors associated with the profitability of small and medium enterprises in Nigeria. African Journal of Business Management, Vol. 2, pp. 195 – 200
Onwubiko, C. M., (2009). Entrepreneurship and Leadership, Occassional Paper No. 12, Centre for Private Enterprises, New York
203

Opportunity International (2002). Microfinance: The Business Solution to Global Poverty. Annual Report.
Orser, B., Horgath-Scott, S. and Riding, A. L.(2000). performance, firm size, and management problem solving. Journal of Small Business Management, 38(4), 42-58.
Orji, K. O. (2006). Transforming microfinance schemes from subsistence living to Small Scale Enterprises in Nigeria: Analysis of policies for integration of science and technology into client’s activities”, United Nations Educational, Scientific, and Cultural Organization, Policy paper No. 11 -12, 1-36.
Osa-Afiena, L. (2003). Critical success factors in the implementation of SMIEIS”, paper delivered at Small and Medium Industries Equity Investment Scheme (SMIEIS) Seminar, CBN Training Centre, Lagos.
Oyekanmi, R. (2003). Concepts of Equity Financing and its implication for SMIEIS”, paper delivered at Small and Medium Industries Equity Investment Scheme (SMIEIS) Seminar, CBN Training Centre, Lagos.
Oyelaran- Oyeyinka, B. (2007). SME: Issues, Challenges and Prospects. Paper presented at the Abuja International Conference on Financial System Strategy 2020, Retrieved from http://www.cenbank.org/fss/mon/FSS2020Presentation%20at%20International%20Conference.ppt.
[
Otokiti, S. O. (2002). Theoretical concepts and Scope of Management (A Re-appraisal of Management Principles). Lagos, Pumark Nigeria Limited.
Owualah, S. I. (1999). Entrepreneurship in small business firms. Lagos: G-Mag Investments Ltd., (Chapter 3).
Pandey, I. M. (1979). Financial Management. 6th Ed, India: Vikas Publishing House PVT Ltd. (Chapter 4).
Papadaki, E., and Chami, B. (2002). Growth Determinants of Micro-Business in Canada. Small Business policy paper, Canada.
Park, J. C. (1983). Entrepreneurial corporations: A managerial assessment. Journal of Small Business Management, 2(1), 38-43.
Park, A. and Ren, C. (2001). Microfinance with Chinese characteristics. World Development 29, 39-62.
Pavia, T. M. (1990). Product growth strategies in young high technology firm. Journal of Product Innovation Management, 7, 297-309.
Pearce, J. A., Chapman, B. L., and David, F.R. (1982). Environmental scanning for small and
204

growing firms. Journal of Small Business Management, 20(3), 27-34.
Pitt, M. and Khandker, S. (1998). The Impact of Group-Based Credit Programs on Poor Households in Bangladesh: Does the Gender of Participants Matter. Journal of Political Economy, 106(5), 958-996.
Preston, L. E. (1977). The world of small business: A suggested typology. American Journal of Small Business, 1(4), 13-19.
Polit, D. & Hungler, B. (1991). Nursing Research: Principles and methods. New York: JB Lippincott.
Portes, A. (1998), Social capital: Its origins and applications in contemporary sociology. Annual Review of Sociology, 24 (1), 1-24.
Prashanthi, N. (2005). “Survival regression”, in Sahai, A., Kaliaperumal, V. G., and Venkatesan, P., (eds), 22nd Annual National Conference of Indian Society for medical statistics: Pre Conference Workshop/Seminar on Survival Analysis. Indian Society for Medical Statistics (ISMS), Jawaharlal Institute of Postgraduate Medical Education and Research.
Pronyk, P. M., Hargreaves, J. R., and Morduch, J., (2007). Microfinance Programs and Better Health. Journal of the American Medical Association, 298(16), October.
Quinn, R. E., and K. Cameron, (1983). Organizational Life Cycles and Shifting Criteria of Effectiveness: Some Preliminary Evidence. Management Science, 29(1). 33 – 51.
Rhenman, E. (1973). Organization theory for long-range planning. London: Wiley.
Rice, G. H., Jr., and Hamilton, R. E. (1979). Decision theory and the small businessman”. American Journal of Small Business, 4(1), 1-9.
Robinson, R. B., Pearce, J. A., Vozikis, G. S. and Mescon, T.S. (1984). The relationship between stage of development and small firm planning and performance. Journal of Small Business Management, 22(2). 45-52.
Romano, C. A., Tanewski, G. A and Symrnios, K. X. (2001). Capital Structure Decision Making: A Model for Family Business. Journal of Business Venturing, 16(3). 285 – 310.
Romano, C. (1989). Research Strategies for Small Business: A Case Study Approach, International Small Business Journal, 7(4), 35-43.
Sadler-Smith, E., Hampson, Y. Chaston, I. and Badger, B. (2003). Managerial behaviour, entrepreneurial style, and small firm performance. Journal of Small Business Management, 41 (1), 41-67
Salkind, N. J. (1997). Exploring research (3rd ed.). Upper Saddle River, NJ: Prentice Hall.
205

Salim, R. A. (2005). Modeling entrepreneurship in small-scale enterprises. Applied Economics Letters, 12, 51–57.
Sanusi, J.O. (2003). Utilization of the SMIEIS funds: The right approach. Available on http:\\ www.cenbank.org/OUT/SPEECHES/2003/Govadd - 14 Aug. pdf (March 9, 2011).
Sarkar , S. (2008). Entrepreneurship as a weapon against poverty, Cascade Policy Issues, No 12
Saunders, M., Lewis, P. and Thornhill. A (2007). Research Methods for Business Students, Prentis Hall, 5th edition,USA.
Schuler, S.R., Hashemi, S. M. and Riley, A. P. (1997). The influence of women’s changing roles and status in Bangladesh’s fertility transition: Evidence from a study of credit programs and contraceptive use. World Development, 25, 563-575.
Schumpeter, J. A. (1939). Business Cycles: A Theoretical, Historical and Statistical Analysis of the Capitalist Process, New York: McGraw Hill Book Company Inc.
Scott, M., and Bruce, R. (1987). Five stages of growth in small business. Longe Range Planning, .20, 45 – 52.
Sexton, D. L., & P. Van Auken, (1985), “A longitudinal study of small business strategic planning”. Journal of Small Business Management, Vol. 23 No. 11, pp. 7-15.
Sexton, D. L and Smilor, R. W. (1997). Entrepreneurship 2000, Chicago: UpstartPublishing.
Shiferaw, A. (2007). Firm heterogeneity and market selection in Sub- Saharan Africa: Does it spur industrial progress. Economic Development and Cultural Change, 52(2), 393–423.
Shiferaw, A. (2008). Survival of private sector manufacturing establishments in africa: the role of productivity and ownership. World Development, doi:10.1016/j.worlddev.2008.08.004
Shields, J. F. (2005). Does rural location matter? The significance of a rural setting for small businesses. Journal of Developmental Entrepreneurship, 10(1), 49–63.
Shumway, T. (2001). Forecasting bankruptcy more accurately: A simple hazard model. The Journal of Business, 74(1), 101-124.
Sleuwaegen, L. and Goedhuys, M. (2002). Growth of firms in developing countries: evidence from Cote D’Ivoire. Journal of Development Economics, 68, 117–135.
Smallbone, D., Lieg, R and North, D. (1995). The Characteristics and Strategies of High Growth SMEs. International Journal of Entrepreneurial Behaviour and Research, 1(3), 44-79
206

Smith, S. C. (2002). Village banking and maternal and child health: Evidence from Ecuadorand Honduras. World Development, 30, 707-723.
SMEDAN (2007), ‘National Policy on Micro, Small and Medium Enterprises.’ << http://www.smedan.gov.ng/search.php?searWords=National%20policy%20on%20MSMEs. Assessed March. 8. 2009.
Steele, F., Amin, S. and Naved, R.T. (2001), “Savings/credit group formation and change in contraception. Demography, 38, 267-282.
Storey, D. (1994). Understanding the small business sector, Routledge, New York.
Tumkella K (2003). The Challenge of Globalisation and SME Sector in Nigeria: Repositioning through Technology and Innovation,” Paper presented at the National Summit on SMIEIS organised by the Bankers’ Committee and Lagos chambers of commerce and Industry (LCCI), Lagos, 10th June,.
Udechukwu, F. N. (2003). Survey of Small and Medium Scale Industries and Their Potentials in Nigeria. Small and Medium Industries Equity Investment Scheme (SMIEIS) Seminar. CBN Training Centre, Lagos.
UNDP (1997). Microfinance Assessment Report Prepared as a component of the MicroStart Feasibility Mission.
UNCTAD (2003). Improving the Competitiveness of SMEs through Enhancing Productive Capacity, TD/B/Com.3/51/Add.1 (Geneva, 31 January 2003), table 2, p. 3 and country profiles of Nepal and Viet Nam.
USAID PRISMS (2005). Governance Issues in Microfinance A Paper Presented At The International Year Of Micro Credit (IYMC) Workshop.
USAID PRISMS (2005). Nigeria Micro, Small and Medium Enterprises (MSMEs) Assessment: A Paper Presented At The International Year Of Micro Credit (Iymc) Workshop.
Variyam, J. and Kraybill, D. (1994). Managerial Inputs and the Growth of Rural Small Firms. American Journal of Agricultural Economics, 76(3), 568-575.
Van Auken, H. E., and Neeley, L. (1996). Evidence of Bootstrap Financing among Small Start-up Firms. Journal of Entrepreneurial and Small Business Finance, 5(3), 235-249.
Vargas, G. (1984). Growth crisis in small industries and small firms. Revue Franaise de Gestion, 13-22. Washington DC: Accion International. Washington, D.C.
Watson, J. & Everett, J. (1999). Small business failure rate: choice of definition and industry effects. International Small Business Journal, 17, 123-129.
207

Weingerg, J. (1994). Firm Size, Finance, and Investment. Economic Quarterly –Federal Reserve Bank of Richmond, 80(1), 19 – 33.
Welsch, H. P., and Young, E (1982). The information source of selection decision: The role of entrepreneurial personality characteristics. Journal of Small Business Management, 20(4), 49-57.
Welsh, J. A., and White, J. F. (1981). A small Business is Not a Little Big Business. Harvard Business Review, 59(4), 18-33.
Wucinich, W. (1979). How to Finance a Small Business. Management Accounting, 61(5), 16-18.
Wole, S. (2004) “The Micro and Small Enterprises Sector in Ethiopia: An over view” in W. Gebeyehu and D. Assefa. (eds), The Role of Micro and Small Enterprises in the Economic Development of Ethiopia. Addis Ababa: FeMSEDA.
Woller, G. and Parsons, R. (2002). Assessing the community economic impact of microfinance Institutions. Journal of Developmental Entrepreneurship, 7, 133-150.
Wydick, W. B. (2002), “Microfinance among the Maya: Tracking the progress of borrowers”, Development and Change, 33, 489-509.
Yunus, M. (2003). Expanding Microcredit Outreach to Reach the Millennium Development Goals. International Seminar on Attacking Poverty with Microcredit, Dhaka, Bangladesh.
Zavgren, C. V. (1985). Assessing the vulnerability to failure of American industrial firms: A logistic analysis. Journal of Business, Finance and Accounting, 8(4), 19-45.
Appendix A
Table 4.41 Distribution of MFBs by Geopolitical Zones – March, 2009.
Geo- Political Zone Number of MFBs Total per Zone % of TotalNorth – WestJigawa 5Kaduna 23Kano 6Katsina 5
208

Kebbi 6Sokoto 5Zamfara 6Sub-Totals 56 56 7.3North – CentralAbuja 24Benue 9Kogi 21Kwara 22Nasarawa 3Niger 10Plateau 12Sub-Total 101 101 13.2North – EastAdamawa 8Bauchi 10Borno 4Gombe 3Taraba 4Yobe 1Sub-Total 30 30 3.9South – WestEkiti 13Lagos 147Ogun 51Ondo 17Osun 31Oyo 45Sub-total 305 305 39.7South – SouthAkwa Ibom 10Bayelsa 3Cross River 15Delta 29Edo 25Rivers 28Sub-total 110 110 14.3South – EastAbia 18Anambra 79Ebonyi 6Enugu 21Imo 42Sub-total 166 166 21.1Total 768 768 100Source: Other Financial Institutions Departments
Appendix B Table 4.14 BUSINESS CHARACTERISTICS OF RESPONDENTS BY LOCATION
Period
Age group
URBAN
Sole Proprietorship
Family Business Partnership Others Total
209

Cat
ego
ry 2000 T A M Ag
S T A M Ag
S T A M Ag
S
T A M Ag
S
18- 24
M 2 - - - - - - - - - - - - - - - - - - - 2S 2 - - - - - - - - - - - - - - -
-- - - - 2
25 –34
M 8 2 - 2 2 1 1 - - - - 1 - - 1 - - - 1 - 19S 4 - - - - 1 - - 1 - - - 1 - - - - - - - 7
35- 44
M 11 2 - 1 - 1 - - - - - - - - - - - - - - 15S - - - - 1 - - 1 1 - - 1 - - - - - - - - 4
45– 54
M 4 1 1 - - - - - - - 1 - - - - - - - - - 7
55 –64
M 1 - - - - 1 - - - - - - - - - - - - - - 2
2001-2003
18 –24
M - - - 1 3 - - - 1 - - - - - 1 - - - - - 6
S 1 - - 2 - - 1 1 - - - - - - - - - - - - 525 –34
M 14 7 3 2 2 - - 1 2 - - 1 - - - 1 - - - - 33S 3 - - - - 1 - - - - - 1 - - - - - - - - 5
35 –44
M 13 - 1 1 3 - 1 1 - - - - - - - - - - - - 20
S 10 - 1 1 1 - - 1 - - - - - - - - - - - - 1445 –54
M 4 1 - 1 - - - - 2 - - - 1 - - - - - - - 9S - 1 - - - - - - - - - - 2 - - - - - - - 3
55 –64
M 2 1 - - - - - 1 - - - - - - - - - - - - 4
S 2 1 1 - 1 - - - - - - - - - - - - - - - 52004 – 2005
18 –24
M 8 2 2 1 1 - - - - - - - - - - - - - - - 14
S 1 - - - - - - 1 - - - - - - - - - - - - 225- 34
M 22 8 3 6 4 - - - - - - - - - - - - - - - 43S - 3 - 3 2 - - 1 1 - 2 - - - - - - - - - 12
35– 44
M 35 8 4 6 - - - - 2 - 1 - - - - - - - - 21
S 11 1 - 2 - - - - - - 1 - 1 - 1 - - - - 1 1845– 54
M 14 2 - 3 1 - - - 2 - - - - - - - - - - - 22S 9 3 - - - - - - - - - - - - - - - - - - 12
55– 64
M 9 1 6 1 2 - - - - - - - - - - - - - - - 19S 5 2 1 - - - - - - - 1 - 1 - - - - - - - 10
65 & above
M 1 1 - - - - - - - - - - - - - - - - - - 2
2006- 2007
18 –24
M 1 - - - - - - - - - - - - - - - - - - - 1
25-34 M 3 1 - - - - - - 1 - - - - - - - - - - - 4S 2 - - - - - - - - - - - - - - - - - - - 2
35 –44
M 3 - 1 - - - - - - - - - - - - - - - - - 4
S 1 2 - - - - - - - - - - - - - - - - - - 345-54 M 1 2 - - - - - - - - - - - - - - - - - - 3
S - 2 - 1 - - - - - - - - - - - - - - - - 3Total 20
854
24
36 23
4 3 7 13 0 3 5 6 2 5 1 - - 1 - 396
Source: (Field survey, 2009)
TABLE 4.15 BUSINESS CHARACTERISTICS OF RESPONDENTS BY LOCATION
210

Period Age group
Cat
egor
y RURAL
Sole Proprietorship Family Business Partnership Others Total
Before 2000
T A M Ag S T A M Ag S T A M Ag S
T A M Ag S
18 - 24 M - - - - - - - - 1 - - - - - - - - - - - 125 – 34 M 3 3 - 1 - - - - - - - - - - - - - - - - 10
S 1 - - - - - - - - - - - - - - - - - - - 135 – 44 M - - - - - - - - - - - - - - - - - - - - 0
S 1 - 2 - - - - - - - - - - - - - - - - - 345 – 54 M 1 1 - - - - 1 - 1 - - - - - - - - - - - 455 - 64 M - - - - - - - - 2 - - - - - - - - - - - 2
2001 -2003
18 - 24 M 4 2 - 1 - - - - - - - - - - - - - - - - 7
25 - 34 M 4 1 - 1 - 1 - 1 - - - - - - - - - 1 - 935 – 44 M 1 2 - - - - - 2 1 - - - - - - - - - - - 6
S - - - 1 - - - - - - - - - - - - - - - - 145 - 54 M - - 1 1 - - - - 2 - - - - - - - - - - - 4
S - - 1 1 - - - - - - - - - - - - - - - - 255 - 64 M - - - - - 1 - - - - - - - - - - - - - - 1
S 1 - - - - - - - - - - - - - - - - - - - 12004- 2005
18 - 24 M 1 - - 1 1 - - - - - - - - - - - - - - - 3
S - - - - 1 - - - 1 - - - - - - - - - - - 225 – 34 M 1 4 1 4 1 - - - 3 - - - - - - - - - - - 14
S 1 1 1 0 - - - - 1 - - - - - - - - - - - 435-44 M 1 4 1 1 - - - - 4 - - - - - - - - - - - 11
S 1 - - 1 - - - - 1 - - - - - - - - - - - 345 – 54 M - - 1 - 1 - - - - - - - - - - - - - - - 2
S 1 - 2 2 - - - - - - - - 1 - - - - - - - 655 – 64 M - 1 - - - - - - - - - - - - - - - - - - 1
S - 1 3 - - - - - 1 - - - - - - - - - - - 52006 – 2007
18 – 2425-34
M - 1 - - - - - - - - - - - - - - - - - - 1M - 2 - - - - - - - - - - - - - - - - - 2
35 – 44 M - - - - - - - - 1 - - - - - - - - - - - 145 - 54 M 1 - - - - - - - - - - - - - - - - - - - 1
Total 22
23
10
15 4 1 1 5 22 0 0 0 2 0 0 0 0 0 1 106
Source: (Field survey, 2009)
Note: T = Trading, A=Artisans, M= Manufacturing, Ag = Agriculture, S = Service.Under category: M = Micro enterprises, S= Small scale enterprise
APPENDIX C
211

Dear Respondent,
RESEARCH QUENSTIONNAIRE
Mrs. Abiola Babajide is a post graduate student of Banking and Finance in the Department of
Banking and Finance, Covenant University. She is currently carrying out a PhD research work
on “Effects of Microfinancing on Micro and Small Enterprises in South – West Nigeria”.
Your cooperation is therefore solicited in supplying the required relevant information as factual
as possible. Information supplied will be treated with utmost confidentiality and use for
academic purpose only. Hence your name or address is not required.
Thank you in anticipation of your cooperation.
Professor J. A. T Ojo,Supervisor
212