Embed Size (px)
Citation preview
NAVAL POSTGRADUATE SCHOOL Monterey, California
THESIS
TURBOCHARGERS TO SMALL TURBOJET ENGINES FOR UNINHABITED AERIAL VEHICLES
Thesis Advisor: Second Reader:
by
ilbert D. Rivera, Jr.
June 1998
Garth V. Hobson David W. Netzer
Approved for public release; distribution is unlimited.

REPORT DOCUMENTATION PAGE Form Approved OMB No. 0704-0188
Public reporting burden for this collection of information is estimated to average 1 hour per response, including the time for reviewing instruction, searching existing data sources, gathering and maintaining the data needed, and completing and reviewing the collection of information. Send comments regarding this burden estimate or any other aspect of this collection of information, including suggestions for reducing this burden, to Washington headquarters Services, Directorate for Information Operations and Reports, 1215 Jefferson Davis Highway, Suite 1204, Arlington, VA 22202-4302, and to the Office of Management and Budget, Paperwork Reduction Project (0704-0188) Washington DC 20503.
1. AGENCY USE ONLY (Leave blank) 2. REPORT DATE June 1998
3. REPORT TYPE AND DATES COVERED Engineer's Thesis
4. TITLE AND SUBTITLE TURBOCHARGERS TO SMALL TURBOJET ENGINES FOR UNINHABITED AERIAL VEHICLES
6. AUTHOR(S) Rivera, Gilbert D., Jr.
5. FUNDING NUMBERS
7. PERFORMING ORGANIZATION NAME(S) AND ADDRESS(ES) Naval Postgraduate School Monterey, CA 93943-5000
8. PERFORMING ORGANIZATION REPORT NUMBER
9. SPONSORING / MONITORING AGENCY NAME(S) AND ADDRESS(ES) 10. SPONSORING / MONITORING
AGENCY REPORT NUMBER
11. SUPPLEMENTARY NOTES
The views expressed in this thesis are those of the author and do not reflect the official policy or position of the Department of Defense or the U.S. Government.
12a. DISTRIBUTION / AVAILABILITY STATEMENT
Approved for public release; distribution is unlimited. 12b. DISTRIBUTION CODE
13. ABSTRACT (maximum 200 words) Three test programs were conducted to provide the preliminary groundwork for the design of a small turbojet engine
from turbocharger rotor components for possible Uninhabited Aerial Vehicle applications. The first program involved the performance mapping of the Garrett T2 turbocharger centrifugal compressor. The second program involved the bench testing of a small turbojet engine, the Sophia J450, at 115000 RPM, and comparing the results to another small turbojet, the JPX-240, from previously documented research. The compressor radii of the two engines were identical but greater than that of the Garrett compressor. The two engines, despite their physical similarities, had different fuel requirements. The J450 used heavy fuel (fuel pump required) while the JPX used liquid propane (pressurized fuel tank required). The third program involved the performance prediction of the J450 using GASTURB cycle analysis software. The compressor map generated from the Garrett T2 test was imported into GASTURB and used to predict the J450 performance at 94000, 105000,115000, and 123000 RPM. The performance predictions agreed reasonably well with actual J450 performance.
14. SUBJECT TERMS Centrifugal Compressor, Turbomachinery, Uninhabited Aerial Vehicles (UAV), GASTURB, SMOOTHC, Turbojet, Turbocharger
17. SECURITY CLASSIFICATION OF REPORT Unclassified
18. SECURITY CLASSIFICATION OF THIS PAGE Unclassified
NSN 7540-01-280-5500
19. SECURITY CLASSIFICATION OF ABSTRACT Unclassified
15. NUMBER OF PAGES
89
16. PRICE CODE
20. LIMITATION OF ABSTRACT
UL
Standard Form 298 (Rev. 2-89) Prescribed by ANSI Std. 239-18
DTIC QUALITY Hi 5TED&

11

Approved for public release; distribution is unlimited
TURBOCHARGERS TO SMALL TURBOJET ENGINES FOR UNINHABITED AERIAL VEHICLES
Gilbert D. Rivera, Jr. Lieutenant, United States Navy
B.S.A.E., United States Naval Academy, 1991 M.S.A.E., Naval Postgraduate School, 1997
Submitted in partial fulfillment of the requirements for the degree of
AERONAUTICAL AND ASTRONAUTICAL ENGINEER
from the
NAVAL POSTGRADUATE SCHOOL June 1998
Author:
Approved by:
r^Q— Gilbert
q— (K. D. Rivera^r.
6/arth V. Hobson, Thesis Advisor
Gerald H. Lindsey, CEäkman, Department Aeronautics and Astronatrtk
in

IV

ABSTRACT
Three test programs were conducted to provide the preliminary groundwork for
the design of a small turbojet engine from turbocharger rotor components for possible
Uninhabited Aerial Vehicle applications. The first program involved the performance
mapping of the Garrett T2 turbocharger centrifugal compressor. The second program
involved the bench testing of a small turbojet engine, the Sophia J450, at 115000 RPM,
and comparing the results to another small turbojet, the JPX-240, from previously
documented research. The compressor radii of the two engines were identical but greater
than that of the Garrett compressor. The two engines, despite their physical similarities,
had different fuel requirements. The J450 used heavy fuel (fuel pump required) while the
JPX used liquid propane (pressurized fuel tank required). The third program involved the
performance prediction of the J450 using GASTURB cycle analysis software. The
compressor map generated from the Garrett T2 test was imported into GASTURB and
used to predict the J450 performance at 94000, 105000,115000, and 123000 RPM. The
performance predictions agreed reasonably well with actual J450 performance.
v

VI

TABLE OF CONTENTS
I. INTRODUCTION 1
II. GARRETT T2 TURBOCHARGER TEST PROGRAM 3
A. EXPERIMENTAL SETUP 3
1. Overview 3
2. Turbocharger Test Rig 4
B. DATA ACQUISITION AND REDUCTION 5
1. Overview : 5
2. Instrumentation and Control 5 a. Scanivalve Control 6 b. Scanning Digital Voltmeter 6 c. Scanner 2 6
3. Software 7
4. Data Reduction 7 a. Mass Flow Rate 8 b. Pipe Reynolds Number , 8 c. Total-to-Total Pressure Ratio 9 d. Stagnation Temperature Change ...9 e. Total-to-Total Isentropic Efficiency 9 f. Power 9 g. Referred Quantities 9
5. Experimental Procedure.. 10
C. RESULTS OF GARRETT T2 TURBOCHARGER TEST PROGRAM ..11
1. Performance Maps 11
2. Summary 13
IE. SOPHIA J450 ENGINE TEST PROGRAM 15
A. EXPERIMENTAL SETUP 15
1. Overview 15
2. Engine Test Rig 15
B. DATA ACQUISITION AND REDUCTION 17
1. Overview 17
2. Instrumentation and Control 18
vii

a. Thrust Measurement 18 b. Fuel Flow Rate Measurement 18 c. Mass Flow Rate Measurement 18
3. Software 19 a. MICROJET 19 b. MICROJET_CAL 19 c. EEADMJJZOC 19
4. Data Reduction 19
5. Experimental Procedure 19
C. RESULTS OF SOPHIA J450 ENGINE TEST PROGRAM 21
1. Sophia J450 Test Results 21
2. Sophia J450 vs JPX-240 Comparison 22
3. Summary 23
IV. PERFORMANCE PREDICTION PROGRAM 25
A. OVERVIEW 25
B. COMPRESSOR MAP GENERATION 25
1. Data Manipulation 25
2. Software Description 25
3. Results 25
C. ENGINE PERFORMANCE PREDICTION 26
1. Software Description and Interface 26
2. Cycle Analysis Procedure 27
3. Results 28
4. Summary 29
V. CONCLUSIONS AND RECOMMENDATIONS 31
A CONCLUSIONS 31
B. RECOMMENDATIONS 31
APPENDIX A. GARRETT T2 TEST TURBOCHARGER TEST RESULTS 33
APPENDIX B. PLOTS OF FLOW COEFFICIENT AS A FUNCTION OF PIPE REYNOLDS NUMBER AND DIAMETER RATIO 43
APPENDIX C. SOPHIA J450 ENGINE TEST RESULTS 47
viii

APPENDIX D. SOPHIA J450 TEST PROGRAM CHECKLISTS 51
APPENDIX E. PERFORMANCE PREDICTION ....57
APPENDLX F. GARRETT T2 COMPRESSOR SLIP FACTOR CONSIDERATIONS AND POWER FACTOR CALCULATIONS 65
LIST OF REFERENCES 71
BIBLIOGRAPHY 73
INITIAL DISTRIBUTION LIST 75
IX


ACKNOWLEDGEMENTS
I extend my sincere appreciation in acknowledging several persons whose efforts
greatly contributed towards the development of this thesis.
I would like to thank Mr. Rick Still of the Department of Aeronautics and
Astronautics for his technical support in the logistics, planning, and on-sight trouble
shooting throughout the project.
I greatly appreciate the efforts of Dr. Garth Hobson in providing the opportunity
to pursue this thesis. Without his guidance, patience, and dedicated support, this research
would never have been completed.
I would also like to thank my wife, Ms. Shanna Sasser, for the love and support
she has given me throughout our lives together.
XI

Xll

I. INTRODUCTION
The Wright brothers, in 1903, changed the face of transportation with the world's
first successful heavier-than-air powered flight. Their simple bi-plane design set off an
evolutionary chain reaction that saw the creation of the aviation/aerospace industry.
Soon, aerodynamic performance and structural engineering advances allowed higher
flight speeds requiring more from the conventional propeller propulsion plants ofthat era.
Not more than a quarter-century later, Frank Whittle, a British Royal Air Force
cadet, reasoned that aircraft would have to fly faster and higher to improve efficiency. He
also recognized the limitations of the propeller engine and that the rocket was not the
convenient solution. Instead, he concluded that a high-speed jet stream produced by a
ducted fan driven by a turbine might be the answer to the propulsion dilemma. After
several years of research and development, Whittle realized his vision when on May 15,
1941, the first British jet aircraft, the Gloster Meteor, powered by the Whittle engine,
flew from Cranwell in Lincolnshire, England.
Since the introduction of the first operational jet engine, these engines have
primarily grown larger in order to meet the increasing demands of thrust, fuel efficiency,
and specific thrust. In more recent times, however, the popularity of remote control
airplanes has created a new marketplace for scaled-down operational aircraft and jet
engines. Additionally, the Department of Defense (DoD) has realized the potential of the
Uninhabited Aerial Vehicle (UAV) in reconnaissance as well as strike roles [Ref. 1]. The
DoD requires a low-cost, lightweight, low-maintenance, high-reliability engine that will
propel the UAV to meet close and short-range mission requirements. A small expendable
turbojet engine may also provide the necessary gas generator core for ramjet engines,
which could be used to power supersonic UAVs.
The centrifugal compressor and radial inflow turbine meet the size and
lightweight requirements for such an engine. Not only is the centrifugal compressor and
pump probably the most predominant type of turbomachine application known to man
(vacuum cleaner, washing machine, piston engine turbocharger, etc.), but its evolutionary
1
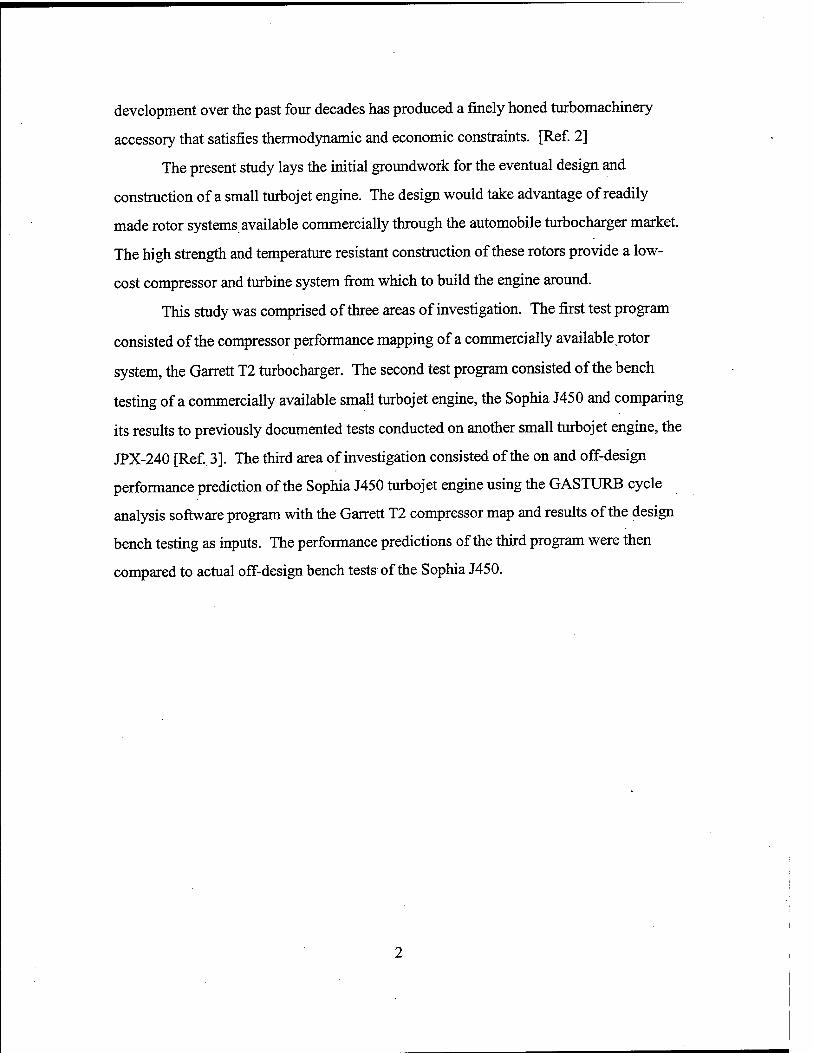
development over the past four decades has produced a finely honed turbomachinery
accessory that satisfies thermodynamic and economic constraints. [Ref. 2]
The present study lays the initial groundwork for the eventual design and
construction of a small turbojet engine. The design would take advantage of readily
made rotor systems available commercially through the automobile turbocharger market.
The high strength and temperature resistant construction of these rotors provide a low-
cost compressor and turbine system from which to build the engine around.
This study was comprised of three areas of investigation. The first test program
consisted of the compressor performance mapping of a commercially available,rotor
system, the Garrett T2 turbocharger. The second test program consisted of the bench
testing of a commercially available small turbojet engine, the Sophia J450 and comparing
its results to previously documented tests conducted on another small turbojet engine, the
JPX-240 [Ref. 3]. The third area of investigation consisted of the on and off-design
performance prediction of the Sophia J450 turbojet engine using the GASTURB cycle
analysis software program with the Garrett T2 compressor map and results of the design
bench testing as inputs. The performance predictions of the third program were then
compared to actual off-design bench tests of the Sophia J450.
II. GARRETT T2 TURBOCHARGER TEST PROGRAM
A. EXPERIMENTAL SETUP
1. Overview
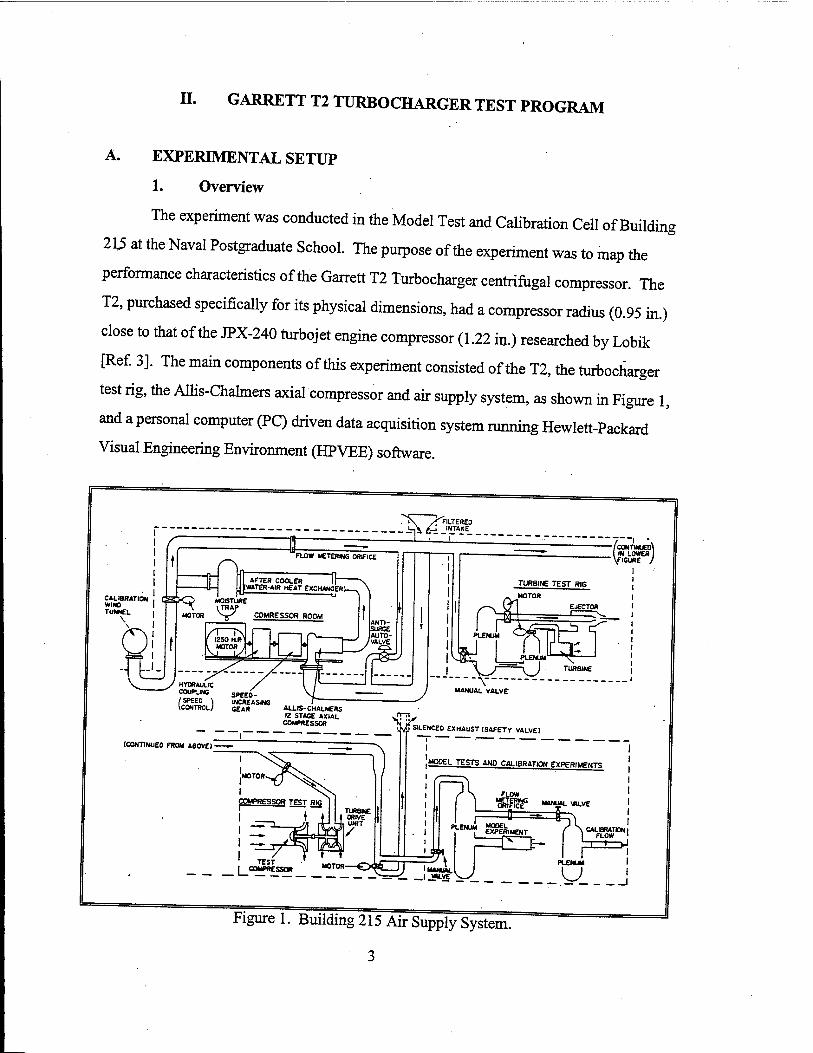
The experiment was conducted in the Model Test and Calibration Cell of Building
2tf at the Naval Postgraduate School. The purpose of the experiment was to map the
performance characteristics of the Garrett T2 Turbocharger centrifugal compressor. The
T2, purchased specifically for its physical dimensions, had a compressor radius (0.95 in.)
close to that of the JPX-240 turbojet engine compressor (1.22 in.) researched by Lobik
[Ref. 3]. The main components of this experiment consisted of the T2, the turbocharger
test rig, the Allis-Chalmers axial compressor and air supply system, as shown in Figure 1,
and a personal computer (PC) driven data acquisition system running Hewlett-Packard
Visual Engineering Environment (HPVEE) software.
Figure 1. Building 215 Air Supply System.
3

2. Turbocharger Test Rig
The T2 was attached to the pre-existing turbocharger test rig, Figure 2, which was
slightly modified to meet the smaller turbocharger requirements. Such modifications
included reduced-area orifice plates (turbine and compressor inlet pipe orifice diameters
of 1.90 and 1.25 in., respectively), a compressor exit throttle valve as well as compressor
and turbine inlet adapters.
The test rig instrumentation included one temperature probe, four combination
stagnation temperature-pressure probes, two pressure differential transducers (one ±2.5
psig, ahead of the compressor, and one ±1.0 psig, upstream of the turbine), and one
magnetic speed pickup.
Settling Chamber
DIAGRAM NOT TO SCALE]
Air Supply from Allis-Chalmers
Settling Chamber
^Differential Pressure Transducer
^Temperature Probe
^Temperature/Pressure Probe
Compressor Exhaust Turbine Exhaust
Figure 2. Turbocharger Test Rig Layout.

B. DATA ACQUISITION AND REDUCTION
1. Overview
The computerized data acquisition system consisted of a Hewlett-Packard
HP75000 Series B VXI-Bus Mainframe controlled by HPVEE software running on a PC,
a scanner, universal counter, signal conditioner, and an external digital voltmeter (DVM).
The mainframe itself contained an internal DVM, along with two scanning multiplexers,
a switchbox multiplexer, and a Quad 8-bit Digital I/O Module. The system, shown in
Figure 3, provided near real-time data to the PC monitor and also provided the option to
export the acquired data to Microsoft Excel spreadsheet format.
HP1326B MULTIMETER
Analog Bus
HP75000 SERIES B E1301A MAINFRAME VXIBus
PC (HPVEE) HP82341C
Controller Card
HP-m
HP-IB INTERFACE!
HP1347A16CH THERMOCOUPLE SCANNING MULTIPLEXER
EEgThermocouple ,ines(6)
HP1345A 16 CH RELAY SWTTCHBOX MULTIPLEXER
HP1330B QUAD 8-BIT DIGITAL I/O
HP1345A 16 CH RELAY SCANNING MULTIPLEXER
35TS J48-Port Scanivalve
HG-78 Scanivalve 4x2 Transducer Controller
LinesJ
Signal Condition«
4x8 TTL Lines
4x2 Control Line
Universal Counter Magnetic Speed Pickup
Scanner 2 Signal Conditioner ~
-{External Digital Voltmeter!
Figure 3. Turbocharger Data Acquisition Schematic.
2. Instrumentation and Control
The Hewlett Packard HP75000 Mainframe was used to control and directly
address a variety of instruments grouped together. Communication between the PC (with

a HP 823141C Controller Card installed) and the mainframe was via a HP-IB (IEEE-488)
interface cable.
a. Scanivalve Control
. Scanivalve control involved stepping and homing the 48-port pneumatic
scanning valve (pressure port assignments summarized in Table 1) with the HG-78
Scanivalve controller and ensuring that the correct port was selected and measured.
Grossman [Ref. 4] provided a detailed configuration and logic sequence description for
the control of the Scanivalve.
Port# Scanivalve Pressure Assignment
1 Tare, PI 2 Calibration, P2 3 Not Used 4 Not Used 5 Turbine Inlet, P5 6 Turbine Exit, P6 7 Not Used 8 Not Used 9 Compressor Inlet, P9 10 Compressor Exit, P10
11-48 Not Used
Table 1. Scanivalve Port Assignments.
b. Scanning Digital Voltmeter
A 16-channel multiplexer was connected to the HP75000 DVM allowing
it to operate as a thermocouple relay multiplexer module (HP 1347A). The module
(channel assignments summarized in Table 2) was used to measure five stagnation
temperatures as well as the lubrication oil temperature. Again, Ref. [4] provided a
detailed configuration and logic sequence description.
c. Scanner 2
The two differential pressure transducers were used to measure the
pressure differences across each of the two orifice plates. The turbine and compressor
pressure differentials were connected to the signal conditioner and were assigned to
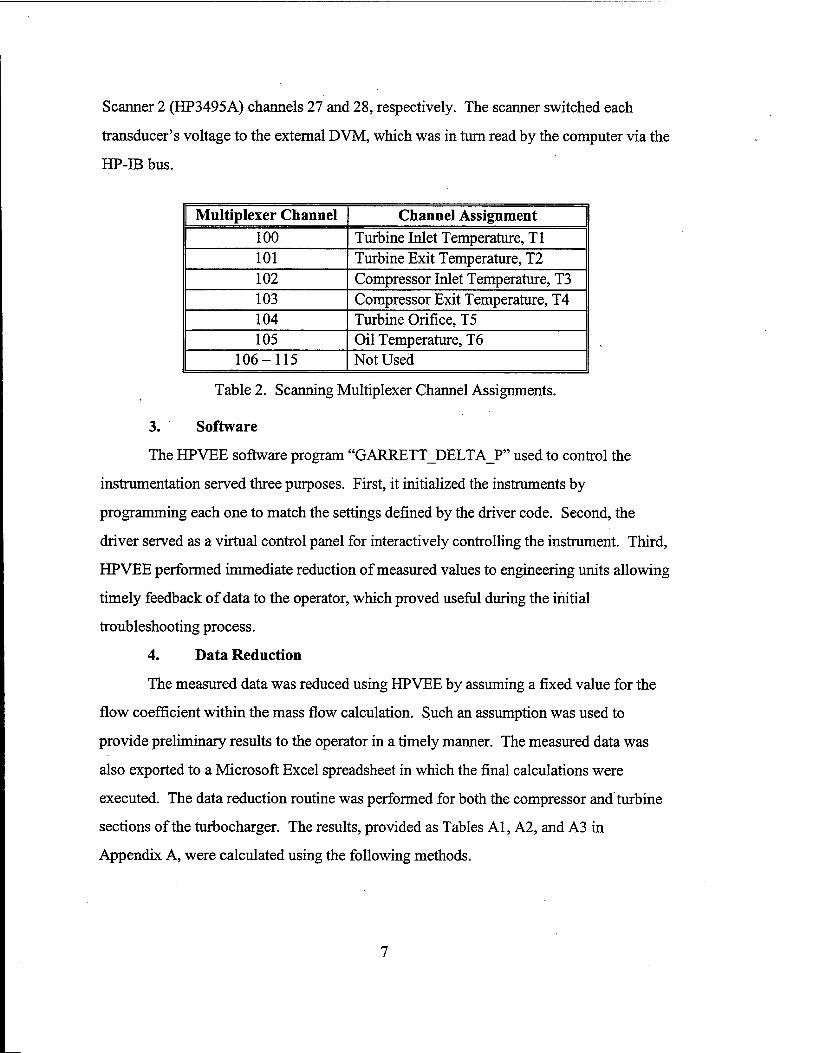
Scanner 2 (HP3495A) channels 27 and 28, respectively. The scanner switched each
transducer's voltage to the external DVM, which was in turn read by the computer via the
HP-IB bus.
Multiplexer Channel Channel Assignment 100 Turbine Inlet Temperature, Tl 101 Turbine Exit Temperature, T2 102 Compressor Inlet Temperature, T3 103 Compressor Exit Temperature, T4 104 Turbine Orifice, T5 105 Oil Temperature, T6
106-115 Not Used
Table 2. Scanning Multiplexer Channel Assignments.
3. Software
The HPVEE software program "GARRETT_DELTA_P" used to control the
instrumentation served three purposes. First, it initialized the instruments by
programming each one to match the settings defined by the driver code. Second, the
driver served as a virtual control panel for interactively controlling the instrument. Third,
HPVEE performed immediate reduction of measured values to engineering units allowing
timely feedback of data to the operator, which proved useful during the initial
troubleshooting process.
4. Data Reduction
The measured data was reduced using HPVEE by assuming a fixed value for the
flow coefficient within the mass flow calculation. Such an assumption was used to
provide preliminary results to the operator in a timely manner. The measured data was
also exported to a Microsoft Excel spreadsheet in which the final calculations were
executed. The data reduction routine was performed for both the compressor and turbine
sections of the turbocharger. The results, provided as Tables Al, A2, and A3 in
Appendix A, were calculated using the following methods.
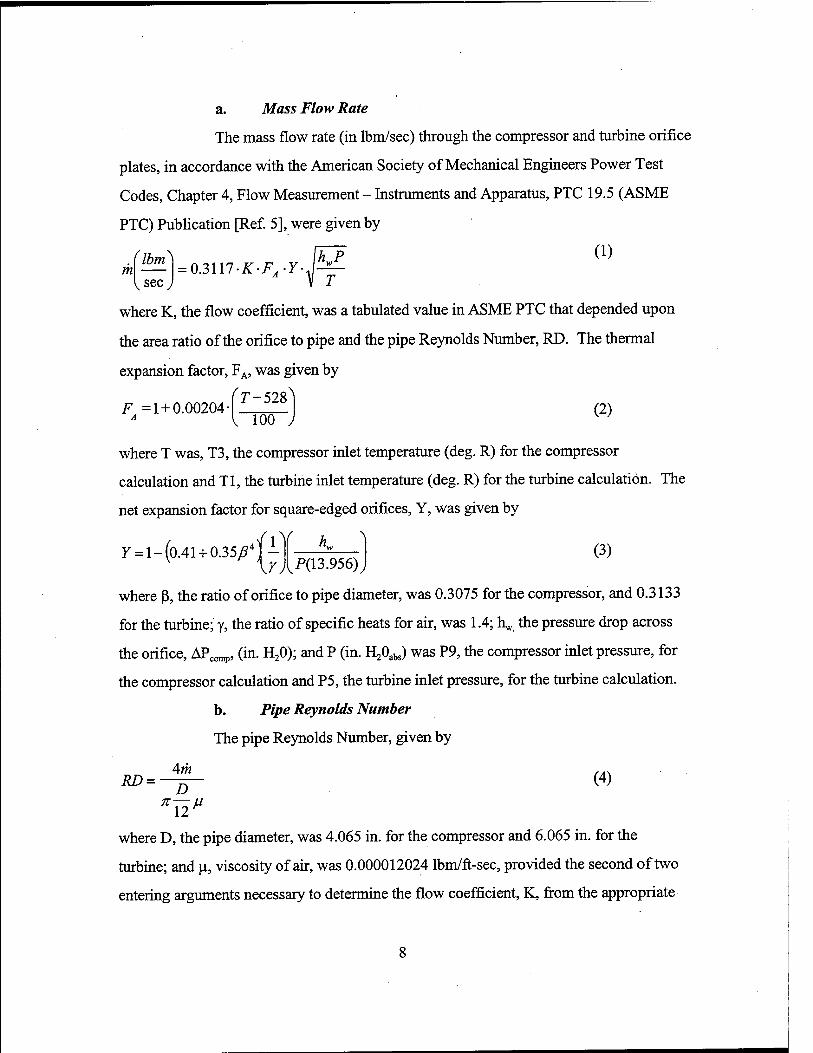
a. Mass Flow Rate
The mass flow rate (in lbm/sec) through the compressor and turbine orifice
plates, in accordance with the American Society of Mechanical Engineers Power Test
Codes, Chapter 4, Flow Measurement - Instruments and Apparatus, PTC 19.5 (ASME
PTC) Publication [Ref. 5], were given by
(lbm\ .. IhJP (!) m = Q3\\1-K-FA-Y-
\sec J
where K, the flow coefficient, was a tabulated value in ASME PTC that depended upon
the area ratio of the orifice to pipe and the pipe Reynolds Number, RD. The thermal
expansion factor, FA, was given by
F=l+0.00204 • I T~528 (2) A V 100 J K '
where T was, T3, the compressor inlet temperature (deg. R) for the compressor
calculation and Tl, the turbine inlet temperature (deg. R) for the turbine calculation. The
net expansion factor for square-edged orifices, Y, was given by
v k. x
7 = 1-(0.41 + 0.35 W- P(13.956)
(3)
where ß, the ratio of orifice to pipe diameter, was 0.3075 for the compressor, and 0.3133
for the turbine; y, the ratio of specific heats for air, was 1.4; h* the pressure drop across
the orifice, APcomp, (in. H20); and P (in. H20abs) was P9, the compressor inlet pressure, for
the compressor calculation and P5, the turbine inlet pressure, for the turbine calculation.
b. Pipe Reynolds Number
The pipe Reynolds Number, given by
JU>—%- (4)
where D, the pipe diameter, was 4.065 in. for the compressor and 6.065 in. for the
turbine; and p., viscosity of air, was 0.000012024 lbm/ft-sec, provided the second of two
entering arguments necessary to determine the flow coefficient, K, from the appropriate

tables in ASME PTC which was graphically represented as Figure Bl for the compressor
and Figure B2 for the turbine in Appendix B.
c. Total-to-Total Pressure Ratio
The total-to-total pressure ratios were given by
P10 P6 Uc=—- and nr=— (5) c p9 T p5 v )
where P10 and P6 were the exit pressures (in. H20abs) for the compressor and turbine,
respectively.
d. Stagnation Temperature Change
The stagnation temperature changes were given by
ATcomp=T4-T3 and ^=71-77 (6)
where T4 and T2 were the compressor and turbine exit temperatures, respectively.
e. Total-to-Total Isentropic Efficiency
The total-to-total isentropic efficiency was calculated as
Vc = \T J and Vt = , **^. (7) ^comp 71 1-n/
f. Power
The power absorbed by the compressor and produced by the turbine were
obtained from the respective mass flows through the compressor and turbine as
HP = 0.33958- m- AT (8)
where AT, the total temperature difference, was ATcomp for the compressor and AT^ for
the turbine calculations.
g. Referred Quantities
The compressor and turbine performances were described in terms of
referred quantities that retain their original units:
V0 „„w RPM AXJt> HP
vr;and^=wi mref =m^—; RPMref = —=-; and HPref=^rT= (9)
where 0 = ^; S = ^-; Tref= 518.7deg. R;Pref= 407.2112 in.H20; TtinfwasT3 and Kef "ref
Tl for the compressor and turbine calculations, respectively; and Ptinf was P9 and P5 for
the compressor and turbine calculations, respectively.
5. Experimental Procedure
Prior to the initial data acquisition, the ±2.5 psig and +1.0 psig differential
pressure transducers were both calibrated to 5 in. Hg and 2 in. Hg, respectively.
Additionally, the calibration pressure for the Scanivalve was set at 10 in. Hg.
The rotational speed of the magnetic pickup, displayed by a frequency counter,
was verified prior to testing by using a calibrated strobe light. One of the impeller blades
on the exposed face of the T2 compressor was marked with paint which allowed the
rotating compressor, when strobed at a known frequency, to appear non-rotational with
the paint marking in a fixed position. Though the strobe frequency was limited to 25000
RPM, the compressor speed was verified up to 50000 RPM by viewing the strobed
compressor face in the manner described and realizing that doubling the speed produced a
similar result. The exception was that the strobe illuminated the painted blade every
second revolution.
Once the Allis-Chalmers compressor was stabilized, the air supply valve system
was set such that the desired T2 turbocharger compressor speed measured by the
magnetic speed pickup was obtained.
The HPVEE program "GARRETT_DELTA_P", once executed, led the user
through a series of required inputs which included ambient pressure as well as the number
of temperature and pressure samples desired. The first data point was collected with the
T2 compressor exhaust throttle valve fully open, subsequent data points were obtained
while throttling the valve in full, half, or quarter-turn increments until the throttle was
closed. It should be noted that the air supply valve system was manipulated after each
throttle adjustment in order to maintain the same T2 turbocharger compressor speed.
10

Data was collected for the Garrett T2 turbocharger at compressor speeds of 50000,
75000,100000, and 125000 RPM. Multiple experiments were conducted in an effort to '
verify the repeatability of the results.
C. RESULTS OF THE GARRETT T2 TURBOCHARGER TEST PROGRAM
1. Performance Maps
The total-to-total pressure ratio, efficiency, and referred power were plotted
against the referred mass flow rate for each constant speed test. The plots show the data
collected for each speed line for two data runs. Additionally, the pressure ratio and
efficiency plots were generated for the turbine and are provided as Figures Al and A2,
respectively, in Appendix A.
The total-to-total pressure ratio versus referred mass flow rate, Figure 4, indicated
a slight increase in pressure ratio and decrease in mass flow rate as the compressor was
throttled. The sudden increase in mass flow rate indicated compressor surge. This
-OK 0450k RPM
-D« 04 75k RPM
-D«c04100k RPM -0^04125k RPM -Die 15125k RPM
-Jan 07 50k RPM -J» 07 75k RPM
-J«n 07100k RPM
°' 0.15
Referred Mass How (Ibm/sec)
MSS" Fbw^tf T2 TUrbOCharger ComPressOT Total-to-Total Pressure Ratio vs Referred
11
behavior was not typical of centrifugal compressors. The only explanation could be that
the T2 compressor splitter blades caused the compressor to have two characteristics. At
stall the compressor may have jumped to its second characteristic. Nonetheless, the
overall peak pressure ratio noted was 1.72 for the 125000 RPM speed line. An example
of a centrifugal compressor with splitter blades is provided in Appendix A as Figure A3.
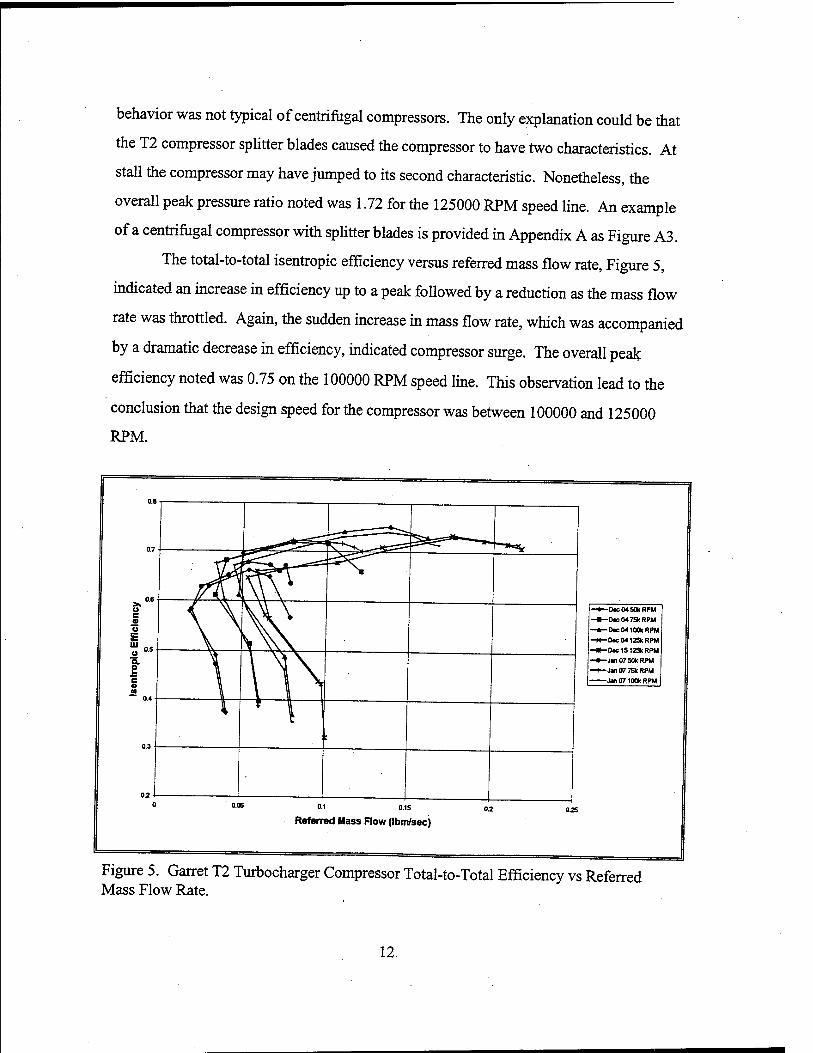
The total-to-total isentropic efficiency versus referred mass flow rate, Figure 5,
indicated an increase in efficiency up to a peak followed by a reduction as the mass flow
rate was throttled. Again, the sudden increase in mass flow rate, which was accompanied
by a dramatic decrease in efficiency, indicated compressor surge. The overall peak
efficiency noted was 0.75 on the 100000 RPM speed line. This observation lead to the
conclusion that the design speed for the compressor was between 100000 and 125000
RPM.
Dec 04S0k RPM
Dae 04 75k RPM
Dae 04100k RPM
04125k RPM
•Dae 15125k RPM
Jan 07 50k RPM
Jan 07 75k RPM Jan 07100k RPM
Referred Mass Flow (Ibm/sec)
Figure 5. Garret T2 Turbocharger Compressor Total-to-Total Efficiency vs Referred Mass Flow Rate.
12

The referred power versus referred mass flow rate, Figure 6, indicated a near-
linear relationship between power and mass flow. As expected, the peak referred power
noted, 7.72 HP, corresponded to the highest speed line with the maximum mass flow
throttle condition. Again, the sudden increase in mass flow rate accompanied by a
dramatic increase in power indicated compressor surge.
-D«cM5(*RPM
-0«c047SkRPM
-D«04100KRPM
-D«c0412SkRPM -Dtc1S12ScRPM
-J»07S0ltRPM -Jm077SkRPM
-jM07100kRPM
Referred Mass Flow (Ibm/sec)
Figure 6. Garrett T2 Turbocharger Compressor Referred Power vs Referred Mass Flow Rate.
2. Summary
The compressor performance map of the Garrett T2 Turbocharger provided
insight into the unique characteristics of small centrifugal compressors. Documented
research into such studies has been few and far between. Despite the success in mapping
the performance of the compressor, the attempt to test the performance of small rotating
turbomachinery proved to be a difficult task. The primary difficulty involved the size of
the turbocharger and the placement of the instrumentation. As a result, the following
items represent the most evident limitations to the test program:
13

• The compressor size allowed high rotational speeds. Unfortunately, the rotational speed could only be confirmed up to 50000 RPM.
• The mass flow rate required by the compressor was so low that the pressure differential recorded across the orifice plate may not be accurate.
• The combination probes used to measure the stagnation temperature and pressure may have been relatively large enough to disturb the flow into the compressor.
• The combination probe used to measure the compressor exit conditions was placed in the exhaust pipe rather than inside the compressor diffuser casing, allowing additional friction losses.
• The differential pressure transducer response to fluid inertia effects may have made these measurements questionable at these low mass flow rates due to the physical pressure line distance between the orifice plates and the transducers.
It should be noted that the turbine performance maps provided in Appendix A
were not considered to be accurate representations of the Garrett turbine in an actual
turbojet application. The instrumentation and experimental procedures of the Garrett test
program were specifically designed to measure the performance of the compressor. As a
result, the turbine data reflected cold mass flow conditions, which are not typical of actual
turbine operating conditions.
Additional research into compressor slip factor considerations and power factor
calculations is provided in Appendix F.
14

III. SOPHIA J450 ENGINE TEST PROGRAM
A. EXPERIMENTAL SETUP
1. Overview
The Japanese-built Sophia J450 Turbojet is a small jet engine manufactured
primarily for use in the remote-control model airplane industry. The Sophia J450 was
purchased because of its physical similarities to the JPX-240 engine researched by Lobik
[Ref. 3]. The only difference between the two engines was the fuel requirement and
associated fuel delivery lines to the engine. The Sophia used heavy fuels (either jet fuel
or a kerosene/Coleman lantern fuel mixture) while the JPX-240 used liquid propane
supplied by a pressurized tank, which was fed to the combustion chamber after preheating
in the exhaust nozzle. The J450 required an electric fuel pump which delivered 85 psi
maximum pressure and was powered by a variable-current 12V supply. Table 3 provides
a side-by-side comparison of the technical specifications for each engine.
Engine Specifications JPX-240 from Ref. [6] Sophia J450 from Ref. [7] Length (in.) 13.18 13.19
Diameter (in.) 4.56 4.72 Weight (lbf) 3.75 4.00
Fuel Liquid propane Jet fuel for aircraft (JP-4) or Coleman fuel & Kerosene
Starting System Compressed air Compressed air Ignition System Spark plug and igniter Spark plug and igniter
Lubrication Self-feeding oil lubrication Self-feeding oil lubrication Fuel Feed System Pressurized fuel tank 12V turbine type fuel pump
Compressor Single stage centrifugal Single stage centrifugal Thrust 8.83 Mat 120000 RPM 11 Mat 123000 RPM
Fuel Consumption 15.95 lbm/hr 19.98 lbm/hr
Table 3. JPX-240 and Sophia J450 Specifications After Refs. [6] and [7].
2. Engine Test Rig
The engine test rig used for the Sophia J450, shown in Figure 7, was located in
the Gas Dynamics Laboratory (Building 216) at the Naval Postgraduate School. It was
15
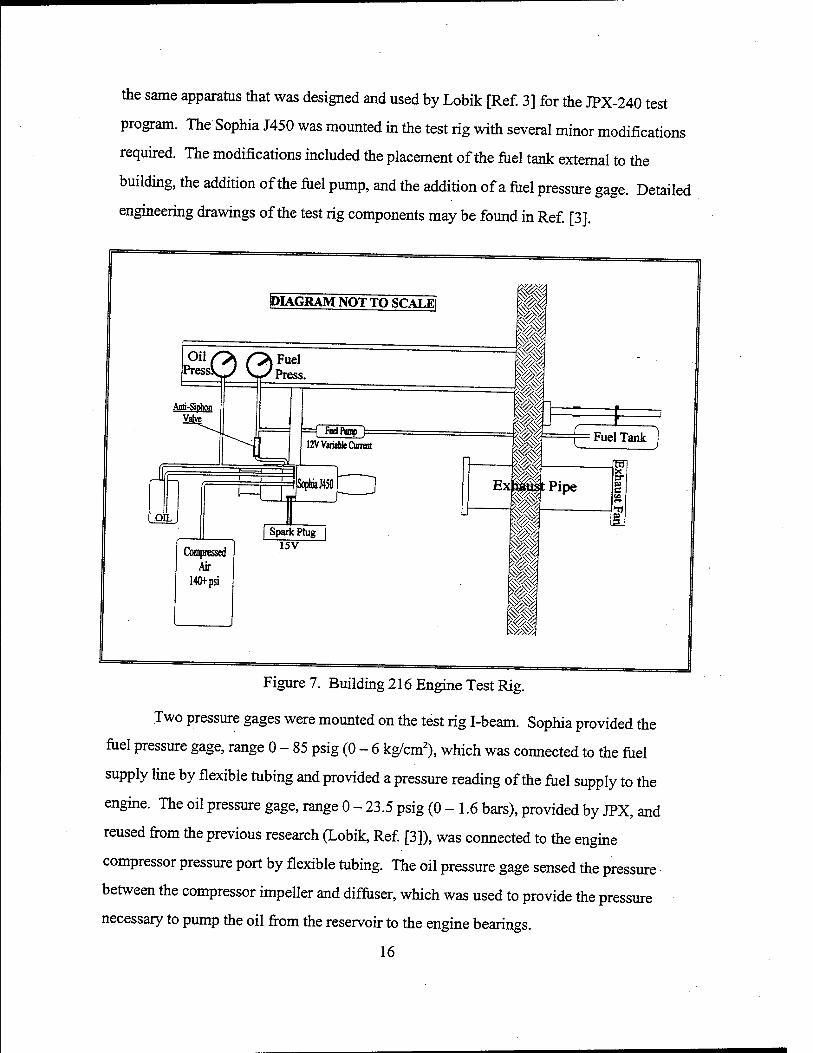
the same apparatus that was designed and used by Lobik [Ref. 3] for the JPX-240 test
program. The Sophia J450 was mounted in the test rig with several minor modifications
required. The modifications included the placement of the fuel tank external to the
building, the addition of the fuel pump, and the addition of a fuel pressure gage. Detailed
engineering drawings of the test rig components may be found in Ref. [3].
DIAGRAM NOT TO SCALE
Fudfump ttVVaraMeCumat
SopMaJ450
I m ■PM-
Sparte Plug
Air 140fpsi
15V
T: Fuel Tank
Ex pt Pipe
[Si 5- IB E
iff ¥M ♦I Mt.
ISJ
Figure 7. Building 216 Engine Test Rig.
Two pressure gages were mounted on the test rig I-beam. Sophia provided the
fuel pressure gage, range 0-85 psig (0-6 kg/cm2), which was connected to the fuel
supply line by flexible tubing and provided a pressure reading of the fuel supply to the
engine. The oil pressure gage, range 0-23.5 psig (0-1.6 bars), provided by JPX, and
reused from the previous research (Lobik, Ref. [3]), was connected to the engine
compressor pressure port by flexible tubing. The oil pressure gage sensed the pressure
between the compressor impeller and diffuser, which was used to provide the pressure
necessary to pump the oil from the reservoir to the engine bearings.
16

B. DATA ACQUISITION AND REDUCTION 1. Overview
A HP9000 Series 300 workstation was used to control the data acquisition system
as well as store and process the data. The primary instruments used for data acquisition
were strain gages and pressure lines. The strain readings were cued using a HP397A
Data Acquisition Control Unit (DACU) in conjunction with a HP digital voltmeter
(D^wlnchreceivedsignalsthroughasignalconditioner. The pressures were sensed
using the Scanivalve Zero-Operate-Calibrate (ZOC-14) system in conjunction with the
CALSYS 2000 calibration standard. The ZOC-14 and CALSYS systems were controlled
by the workstation using the HP6944A Multiprogrammer. The DACU, DVM, CALSYS,
and multiprogrammer were connected to the workstation via a HP-IB (IEEE^SS) bus.
The test rig data acquisition schematic is shown in Figure 8.
IDIAGRAM NOT TO SCALE! •t n &&(■< Fuel Flow Strain Gases
M
M it It M
Figure 8. Engine Test Rig Data Acquisition Schematic.
17
2. Instrumentation and Control
a. Thrust Measurement
The engine thrust was determined by using the beam from which the
engine was suspended as a thrust-measuring device. The beam contained four strain-
gages (two on each side). The strain-gages were configured in a full Wheatstone bridge
with the leads providing an output through a signal conditioner to the data acquisition
system. The arrangement is shown in Lobik [Ref. 3]. Prior to engine testing, the beam
was calibrated with known weights using HP Basic program "MICROJET_CAL". The
calibration results are provided in Appendix C as Figure Cl.
b. Fuel Flow Rate Measurement
The fuel flow rate was determined by using a cantilevered beam as a
weighing device to calculate the change in fuel weight over given periods of time. The
beam used two strain-gages configured in a half Wheatstone bridge to provide an output
through a signal conditioner to the data acquisition system. Prior to engine testing, the
beam was calibrated with known weights, again using "MICROJET_CAL". The
calibration results are provided in Appendix C as Figure C2.
c. Mass Flow Rate Measurement
The flow rate into the compressor was measured using a bellmouth
assembly. Lobik [Ref. 3] designed the bellmouth for the JPX-240 engine in accordance
with ASME PTC [Ref. 5] specifications. The compressor inlet area for the Sophia J450
matched that of the JPX-240 allowing the bellmouth to be used on the Sophia engine
without modification. The bellmouth had a diameter of 2.19 in. at the compressor
entrance and a design flow coefficient, K, of 0.995. Complete engineering diagrams for
the bellmouth are found in Ref. [3]. Inside the bellmouth were four static pressure ports,
spaced 90 degrees apart, which sensed the static pressures using the Scanivalve ZOC-14
system with the CALSYS 2000 providing the nitrogen-pressurized calibration standard.
Wendland [Ref. 8] provided a comprehensive guide to the system. The ambient air
temperature and pressure were also independently recorded.
18
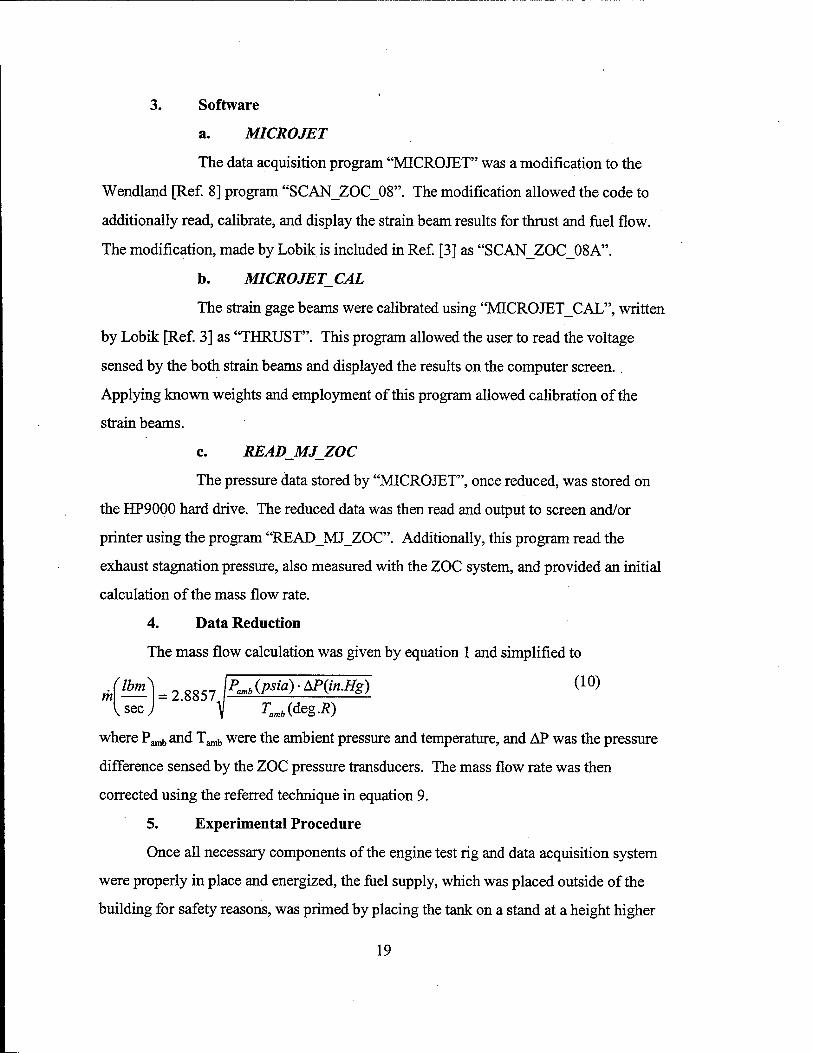
3. Software
a. MICROJET
The data acquisition program "MICROJET" was a modification to the
Wendland [Ref. 8] program "SCAN_ZOC_08". The modification allowed the code to
additionally read, calibrate, and display the strain beam results for thrust and fuel flow.
The modification, made by Lobik is included in Ref. [3] as "SCAN_ZOC_08A".
b. MICROJETJCAL
The strain gage beams were calibrated using "MICROJET_CAL", written
by Lobik [Ref. 3] as "THRUST". This program allowed the user to read the voltage
sensed by the both strain beams and displayed the results on the computer screen..
Applying known weights and employment of this program allowed calibration of the
strain beams.
c. READ_MJ_ZOC
The pressure data stored by "MICRO JET", once reduced, was stored on
the HP9000 hard drive. The reduced data was then read and output to screen and/or
printer using the program "READ_MJ_ZOC". Additionally, this program read the
exhaust stagnation pressure, also measured with the ZOC system, and provided an initial
calculation of the mass flow rate.
4. Data Reduction
The mass flow calculation was given by equation 1 and simplified to
Ibm m
\SQC )
= 2 g857 lPamb(psia)-AP(in.Hg) (10)
Tamb(deg.R)
where Pamb and T^,, were the ambient pressure and temperature, and AP was the pressure
difference sensed by the ZOC pressure transducers. The mass flow rate was then
corrected using the referred technique in equation 9.
5. Experimental Procedure
Once all necessary components of the engine test rig and data acquisition system
were properly in place and energized, the fuel supply, which was placed outside of the
building for safety reasons, was primed by placing the tank on a stand at a height higher
19
than the engine. By placing the tank as such, the fuel pump, once engaged, was gravity-
assisted in pumping the fuel into the building which freed the fuel supply line of any air
bubbles. The fuel flow strain beam was calibrated to indicate zero strain under the given
conditions. Once calibrated, the fuel tank was placed within the holding carriage of the
fuel flow strain beam.
Inside the building, the thrust beam was calibrated at zero load. The data
acquisition system was then setup using the program "MICROJET" to collect five data
points at 1000 Hz using ZOC #1 and CALMOD 1 for pressure readings, of which there
were ten samples per port, and ten seconds between data points.
With the air supply connected, the engine was started and fuel flow throttled using
the variable-current 12V power supply connected to the fuel pump until the engine was
operating in a stabilized manner. The fuel flow was then adjusted until the oil pressure
gage read 1.15 bar. This oil pressure reading matched that of the highest data collection
point used by Lobik during his JPX tests [Ref. 3]. The computerized data acquisition
system was then initiated which provided screen-only outputs of the engine thrust and
fuel flow rate while storing the pressure data to the computer hard drive. The engine
thrust and fuel flow rate were manually recorded as well as the ambient pressure,
temperature, and exhaust gas temperature. The entire data collection sequence had about
a one-minute time duration. An engine startup checklist is provided in Appendix D.
The employment of the magnetic pickup used in the Garrett T2 Turbocharger
experiment was attempted during this test program without success. As an alternate plan,
the assumption was made that the Sophia and JPX engines had identical compressors.
This assumption allowed the JPX manufacturer-provided engine operation guide, Table 4,
to be used for the Sophia J450. The engine operation guide relates the pressure sensed by
the oil pressure gage to compressor speed. The tests conducted for this program were for
a compressor pressure reading of 1.15 bar, which represented the selected design speed of
115000 RPM.
20

Pressure (bar) RPM 0.15 49,000 0.20 57,000 0.40 79,000 0.50 83,000 0.60 92,000 0.70 95,000 0.80 102,000 0.90 105,000 1.00 110,000 1.10 112,000 1.15 115,000
Table 4. JPX Engine Operation Guide From Ref. [6]
C. RESULTS OF SOPHIA J450 ENGINE TEST PROGRAM
1. Sophia J450 Test Results
Four design speed runs were conducted on the Sophia J450 engine. Each data run
was performed at a compressor oil pressure reading of 1.15 bars (approximately 115000
RPM). The data, provided in Appendix C as Tables Cl and C2, were averaged for each
run. The results are summarized in Table 5.
Data Run Date
1 24-Mar-98
2 24-Mar-98
3 26-Mar-98
4 26-Mar-98
Thrust (lbf) 9.55 9.83 9.89 9.91
mref (lbm/sec) 0.255 0.257 0.281 0.272
SFC (lb/lbf/hr) 1.315 1.310 3.353 -0.532
F ( lbf \ mref \lbm /sec/
37.45 38.25 38.48 39.17
EGT (deg. F) 698 699 814 808
Table 5. Sophia J450 Test Program Results.
The mass flow rate was referred in the same manner as described in Chapter
II.BAg. The specific fuel consumption (SFC) was given by
21

SFC lbm \
Ibf ■ sec = 3600- ™fuel (lbm /§eC)
ThrustQbf) (11)
where wf was the fuel flow rate as measured by the fuel flow strain beam. 'fuel
The specific thrust, FI mref, was given by
Ibf Thrustilbf)
mTef \lbml secJ (12)
mref (lbm I sec)
Of note, the SFC calculations for data runs 3 and 4 were deemed unreliable as a result of
an oscillating fuel flow strain beam caused by gusty winds during testing on 26-Mar-98.
Additionally, the exhaust gas temperature (EGT) readings may be questionable as the
temperature probe used to measure the EGT had to be replaced twice as the result of
damage while exposed to short duration peak temperatures above 1300 deg. F.
2. Sophia J450 vs JPX-240 Comparison
The results of the four J450 data runs were averaged and compared to Lobik's
[Ref. 3] results of the JPX-240 engine at the same compressor speed (115000 RPM). Of
note, the SFC averaged for the J450 only considered data runs 1 and 2 for the reasons
mentioned in the preceding paragraph. The side-by-side comparison of the two engines
(Table 6) indicated that the Sophia J450 produced greater thrust and lower specific fuel
consumption than the JPX-240. However, one problem noted was excessive oil
consumption, which was the primary limiting factor in the short engine run times.
JPX-240 from Ref. [3] Sophia J450
Thrust (Ibf) 9.04 9.80
mref (lbm/sec) 0.300 0.256
SFC (lb/lbf7hr) 1.620 1.313
F ( Ibf \ mr^ \lbmlsecJ
30.13 38.28
EGT (deg. F) 1070 755
Table 6. Sophia J450 vs JPX-240 115000 RPM Test Comparison.
22

3. Summary
The Sophia J450 Test Program was intended to duplicate the tests conducted by
Lobik on the JPX-240 engine operating at 115000 RPM [Ref 3]. The assumption that the
two engines had identical compressors allowed a side-by-side comparison of the effect of
the heavy fuel requirement for the Sophia versus the liquid propane requirement for the
JPX. The results indicated that the Sophia J450 delivered improved performance, within
the scope of this test. Additionally, the non-pressurized fuel tank requirement for the
Sophia provided a safer work environment than the JPX.
23

24

IV. PERFORMANCE PREDICTION PROGRAM
A. OVERVIEW
The purpose of the Performance Prediction Program was to take the performance
characteristic data of the centrifugal compressor obtained during the Garrett T2
turbocharger test program, import it into the GASTURB [Ref. 9] cycle analysis software
program and use it to predict the Sophia J450 engine performance at various spool
speeds. In doing so, the compressor performance data needed to be formatted using the
SMOOTHC [Ref. 10] software program to reproduce the T2 compressor map in a
GASTURB-recognizable format.
B. COMPRESSOR MAP GENERATION
1. Data Manipulation
The data sets from the Garrett T2 turbocharger test program for both the pressure
ratio and efficiency plots (Figures 4 and 5, respectively) were merged, then trimmed to
not include the surge condition data points. Once trimmed, a third-order least-squares
polynomial curve was chosen as the best fit to the data in both plots for each speed line
(Figures El and E2 in Appendix E). The polynomials were then used to generate smooth
curve data for each plot, which were used as inputs into SMOOTHC.
2. Software Description
The SMOOTHC computer program was specifically designed as a tool to produce
high-quality compressor characteristic maps from measured data. The Turbo Pascal-
based program allowed the user to manually input the mass flow, pressure, and efficiency
data and then determined the parabolic shapes that represent the input data on a single
plot. The user could then manipulate the shapes of the parabolas to refine the
presentation. [Ref. 10]
3. Results
Figure 9 represents the compressor performance map of the Garrett T2
Turbocharger test program as plotted using the SMOOTHC software. The 115000 RPM
25
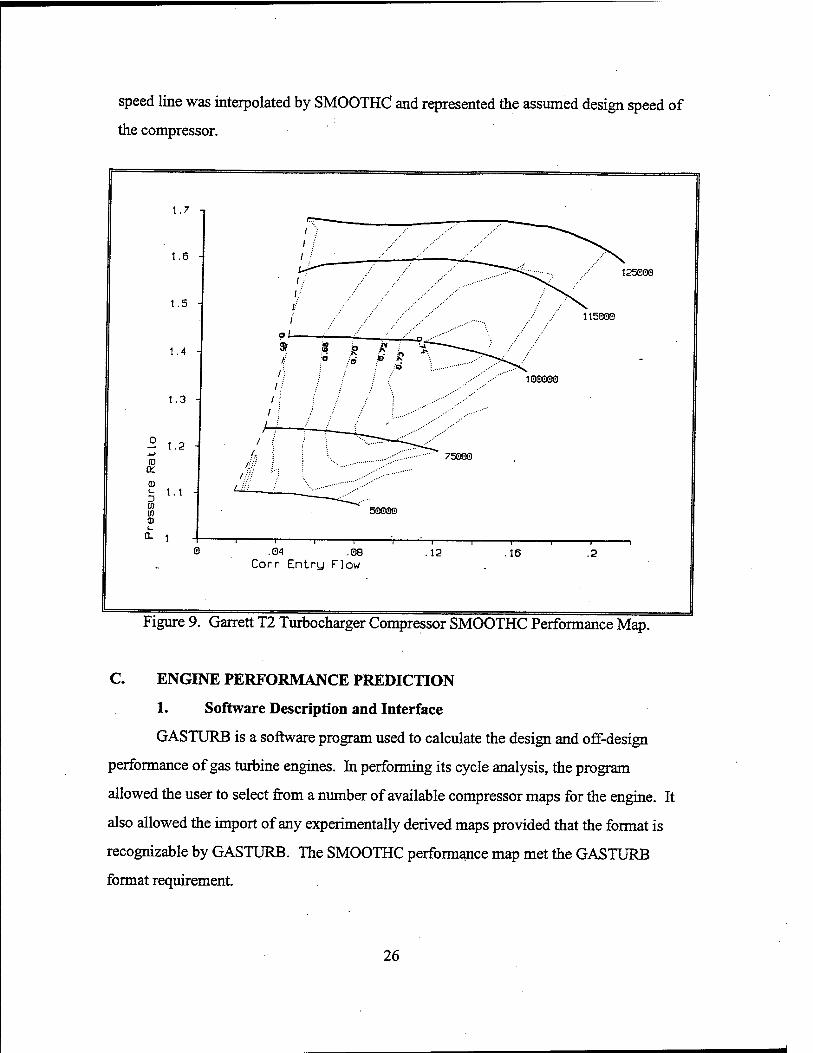
speed line was interpolated by SMOOTHC and represented the assumed design speed of
the compressor.
1.7
1.6
1.5 -
1.4 -
1.3 -
2 1.2 - ID
CC
<D
CO Ü) <D i- a. 1
125000
115000
' / / /
100000
'/ / '/
75000
* ? i? * L
'/ / / / \ 1 \ / ;
/■■• '•- .-•■•"'
50000
- © .04 .C38
Corr Entrg Flow .12
i i
.16 1 i
.2
Figure 9. Garrett T2 Turbocharger Compressor SMOOTHC Performance Map
C. ENGINE PERFORMANCE PREDICTION
1. Software Description and Interface
GASTURB is a software program used to calculate the design and off-design
performance of gas turbine engines. In performing its cycle analysis, the program
allowed the user to select from a number of available compressor maps for the engine. It
also allowed the import of any experimentally derived maps provided that the format is
recognizable by GASTURB. The SMOOTHC performance map met the GASTURB
format requirement.
26

2. Cycle Analysis Procedure
The single spool turbojet design point analysis was selected once the GASTURB
program was executed. The basic data design condition inputs (chosen to be the 115000
RPM Sophia J450 test program results) were:
• Inlet corrected mass flow rate, 0.256 lbm/sec.
• The operator-controlled compressor pressure ratio, 2.15.
• Standard sea level conditions.
• Turbine isentropic efficiency, 0.77.
• Fuel heating value assumed, 18500 BTU/lbm, typical for jet fuels.
• The compressor isentropic efficiency, 0.73, determined from SMOOTHC- generated T2 compressor map (Figure 9) as the peak efficiency at the design speed.
The burner exit temperature was determined to be 1715 deg. R by using the iteration
option of the software. Selecting the burner exit temperature as the iteration variable, and
setting the net thrust determined from the J450 test program, 9.80 lbf, as the value to
achieve, allowed the iteration algorithm of GASTURB to determine the necessary burner
exit temperature. The GASTURB printout of the design point input conditions is
provided in Appendix E as Table El. The design point calculated results are also
provided in Appendix E as Table E2.
The off-design performance prediction involved the evaluation of the J450 at
different spool speeds. The first step was to select the off-design option of GASTURB,
then select the special maps option. The SMOOTHC compressor map formatted and
scaled for the GASTURB Sophia J450 prediction was then read into the program. The
turbine performance was predicted using the default turbine map and is provided as
Figure E3 in Appendix E. The limiter spool speed option was then turned on and set to
the desired speed, as a percentage of the design spool speed, 115000 RPM. The off-
design GASTURB performance prediction process was repeated three times for spool
speeds of 94000 (81.7%), 105000 (91.3%), and 123000 (107%) RPM; and results are
provided in Appendix E as Tables E3, E4, and E5, respectively.
27

3. Results
The performance predictions were summarized and compared to the actual J450
performance data at the 115000 RPM design condition of the Sophia J450 test program.
The SFC was predicted to be within 5% of the design value. Additionally, the three off-
design speeds were compared to actual J450 performance. Figure 10 represents the
-♦- Predicted Thrust -■- Measured Thrust
-X-Measured Mass Flow -*- Predicted SFC
-Predicted Mass Flow
-Measured SFC
12
10
c ^ —^ i—„ £
8= !
1.75
1.5
o IT 1.25 Jj 5
B £ ja —
O •—' U fa CO
2 o 0.75
6 —. 0.5
0.25
90000 100000 110000 120000
Spool Speed (RPM)
Spool Speed (RPM) Thrust Gbf) mref (lbm/sec) SFC (lbm/lbf/hr)
115000 Actual 9.80 0.256 1.313 115000 Predicted 9.79 0.256 1.378 94000 Actual 5.15 0.189 1.838 94000 Predicted 6.39 0.209 1.610 105000 Actual 7.35 0.228 1.613 105000 Predicted 7.92 0.233 1.464 123000 Actual 11.28 0.273 1.384 123000 Predicted 11.35 0.271 1.351
Figure 10. GASTURB Prediction vs Actual Sophia J450 Performance.
28

summarized comparison between the predicted and actual performance of the J450. The
off-design data, included in Appendix E as Table E6, were collected in the same manner
described in the Sophia J450 test program. It should be noted that steady fuel flow was
difficult to maintain during the 94000 RPM run. At this speed the worst match was
achieved in that the predicted thrust was off by 24% and the SFC was off by 12%.
The Garrett compressor map used in the GASTURB analysis is shown in Figure
11. The speed lines were represented as fractions of the design speed 115000 RPM.
Additionally, the figure has the predicted operating line of the compressor displayed as
squares while the circle on the 0.999 speed line denoted the compressor design point.
2 g.. Efficiency Contour» Valid fbfRNt=1, delta eta=0
2.44
2.2
2
5 1-8
5> 1.6 to .©
1.4-
1.2 -.434
05 -1 15 .2 .25 Mass Flow W2RStd flb/s]
.3 .35
Figure 11. GASTURB-Predicted Sophia J450 Compressor Operating Line.
4. Summary
The results of the performance prediction program indicated that the Garrett T2
compressor map, once formatted for GASTURB recognition, proved to be a suitable
model for the performance prediction of the Sophia J450 turbojet. With the exception of
29

the 94000 RPM data, the GASTURB predictions fell within 10% of the actual engine
performance data.
30

V. CONCLUSIONS AND RECOMMENDATIONS
A. CONCLUSIONS
The preliminary groundwork for the eventual design and construction of a small
turbojet engine was established during this study. In doing so, insight into the
performance characteristics of small centrifugal compressors was gained.
The bench testing of a small turbojet engine at a selected design speed allowed the
side-by-side comparison between two engines of different fuel requirements. Such
testing indicated an improved performance for the heavy-fueled J450 turbojet over the
propane-fueled JPX-240 turbojet. It provided quantitative data of the mass flow, thrust,
and specific fuel consumption requirements of small-scale turbojets.
Taking advantage of the experimentally determined compressor performance map
and actual small turbojet bench test results, a gas turbine cycle analysis software program
was successfully used to predict the performance of a small turbojet engine. The results
of the performance prediction program were then compared to actual engine test data with
reasonable results. The compressor performance map can be used in future small gas
turbine design studies.
B. RECOMMENDATIONS
The difficulty in mapping the compressor performance of the turbocharger
primarily involved the size of the instrumentation relative to the compressor. To obtain
more certain results, smaller, less intrusive instrumentation should be used. Additionally,
the rotor speed should be measured using more reliable means at such high rotational
speeds. Future studies should also include the performance testing of the turbine section
in order to produce a more precise turbine map.
The mass flow coefficient of the engine test program assumed a value close to
unity. Calibration of the bellmouth with respect to an orifice plate would help verify the
ASME design.
31

The exhaust temperature readings were deemed unreliable as a result of the
extreme short-duration temperature environment that the probe was exposed to during
engine start up. A more robust combination probe would provide more reliable
temperature readings as well as allowing the exhaust stagnation pressure to be recorded.
The fuel flow reading was subject to unsteady environmental conditions such as
wind as well as uneven heating and cooling effects of sun exposure on the strain beam.
The employment of a flow meter capable of meeting the small flow requirements of the
turbojet may provide the best alternative to replace the strain beam.
The fuel used during the present study involved a mixture of Coleman gas and
kerosene. This choice provided and inexpensive readily available safe fuel. Future
studies should involve the employment of other jet fuels such as JP-4, Jet-A, etc.
32

APPENDIX A. GARRETT T2 TURBOCHARGER TEST RESULTS
< —
«MM
w gj
p
Cd
sä Cd W SS «*: s u o S3 SS 3 H c* H
H Cd SS SS <
?! e- o o
■i o a\ o es >o
00
5 « -S u SEX SM
eu »3
t. w m t— T ^Z oo PS c
r- o <« vo ON i>3 o es •q- es 00 fcj rs VM- es «i P-
5? « S? r/> O T T ■» T ■V Ml (.1 w-> m m vn in
U t-i es
Cd O
eu j. T ov <n p» m ro vo
2 c
m m VI co 00 p- m i -^ -* r~ t~ es P>
§ M- _^ -M —■ „^ es es
r/i o CS fS es es rs rs rs m m in in in m «n
&N r- p- — 00 «« m oo P H
tu o cv o\ —■ o\ — •» y CS T <3\ ■» P» T m fc" co T »n so vO p- 00
f^ a O m m in in m in in
Cd z S <N o r- vo r> Ov 00
£"■* m vn VO —■ m — p-
2 es s c» es es ejv vo T ■» 3
^ co T ir m m m m
Ixi fr- co ro f> m m m m m m in in m m m
p m m vo o O T 00 ro T
s P» —■ in ro rs r- 00 oo R
m ■"
r- p- p- a; co ro m eo m O in m m in in
O r- ( es m es •*T 00 Cd ig
ft- PÄ
m o <3v OX p» p- in
Cd CO Vf3 p- es p- es tr o ov o in rs es es cu o cv o o o o o
OS m ■V in <n «n m m
t. 00 K vo
m Ov vo ^ l» VO m VO O
fc*4 ON VO rs 00 Ov fc? o ro ON oo r^ o _M t^fc
^en CN © OV o rs (S m rr ro
es c e 00 ■sr in i^" 00 rs es t/i o rs r~ o ■* m oo r/i 1 ro T ^- .oo rs vo m Cd 5
es ■^* 00 rn — ■»
es oo vo eo es — o SU 2
' 1 ' ' 1 ' o.
cd U p
c
1 P- es T r~ 00
m
CM
in in es p~ es o o o m vo — es
a\ VO 00
■H- — "9" m p- —
< 5 \d ■q- —■ d es
Ü e
O E-- 00 rM m os r- VO p>
o oo m vn rs m B fcj cv m ■Q- r~ rr ■3- O
cv VO — oo p- o «n Z Ü ^T m es o o\ r- ,^-
o CS es es es — -~ —
»3 Cd
Cd - Cv ■sr O 00 p~ _ o
m c\ m C"l p~ oo ^. 7 00 vrj in p~ p- o o
SS P
sa es 1 co
co f-J in r*;
o\ vi o rs
in rr oo' -^*
00 00 p- P- r» vO vO C/5 5 C/J H u. Cd ^ m 00 -sr cv es SS
i3 VO 00 es m vo
&. T o "3- Ov —
1 vo to O P- vo rs rs es ^ es — —
o S3
cv r- e?S
in Ov VO •«■ tn p~ vO vO
< p- r~ vO VO VO m <«
^^ m m in
co tn m en <*1 U ™~ ■■• "-* •" "^ -^
a Ed
<
a ü j < u SS Cd Ü SS < s u o ea ss P H rsi H —
Cd SS SS <
Cd
6 SU
w
S
ST-
C £
^2 M < JT
Q
q -3
_I P- -^ vn rs m TT o m vo m 00 O vo in so m VO in TT m •q- ro rs •« m in O o O o o o ©
00 rs vo rs so rr Tf "»• so IN vO m
Ov 00 Ov «M MM C3 o Ov Ov C\ ■o o o © T T T in in in in
— p- © ov vo -r p^ vo in © © © ©' © ©
oo in oo vo ov oo T — es —• co ■«■ © © o o ö o' ©' ©
p~ © Cv — in so in es © T co — in r- ^a- ^ P- co vo m co m -r co es — co m ©'©©©©©'©
co © —• in co m co p~ oo — oo ov —• co VO T vo rs P* Ov p^ in vo vo vo vn ^ co ©" ©' ©'©'©'© ©'
P» VO O0 © — 00 TT CO T Ov CO —■ VO -T o\ © ov <n -— in in © ©' ©' co' vo' © ob rs rs rs rs rs co co
— © co oo rs T p- rs © vo es m T OV oo OV Cv © © © ov o o © — — — o
o vo vo _. _ m oo vo o co 2 S —' co oo es rr ~ S p- oo co © vo z; S © es es rs — ^ — —
e« vo vo rs es co — vo T rs ov oo -a- — r~ vo in es — co T © o o o © © o ö © o' ©' o' o" ö
vo rs ov vo es ,» u- rs co co vo ov ^ -1
o © © o © vO vo vo vo vo ©" © © © Ö ° °
vo vo
£ co ro <n vO _— Cv -T Ist in r- Ov 00 CN -r — s o vO Cv in T ov m
vo in T if T co co Pm © © © © © © o HM
£ w in VO TT vn 00 Ov Tf
& rs es "3- o vO es T co rs ro VO «n m in
Su e:
Cv Cv Ov OV CV Cv Cv ■a- ■^- iT T T IT -T
& Cv Cd 1? co © O in in
Ov r» co Cv Cv •a 00 00 00 r» r-
o © © © © o ■«• s ja © o © o © ° oi co
u-
00 © ■fl- es VO Cv fi- "3" VO rs 00 T TT Ov
CO oo © T es vo O |M P» vo VO m m ■«■ IT
© © © o © © O
P» o , CO VO © vo 00 -r T Cv ■T es "** VO rr o © © © Cv »" t» p» p- p- t- r- vo
o © o © o © ©
C m rs VO oo so VO CT
S3 rr r~ P- Cv T © ro
ai in p- es T 00 © Cv © Ov so P- VO VO T
,*^
© T o -T r~ VO vo M •^- r» o VO es oo in
c ro co T T vn «n vc 00 00 00 so 00 00 00 © © o © © © o
oo VO r- Cv T oo © c es
vn o 'O rs Ov © 'T o ro ro es O o\ Cv p- vo es rs es ™- "~* ■"" ~"
_
£ 1» co rs MM CO vO in Cv in rs r- rs «n o
c © © Ov C\ Ov 00 00 o © o © ©
ta ja © o © © o © o
z rs (N VO so 00 -^ rs
li es ro CO »O co C0
M o VO
© VO
© vO
o VO
© vO
«-> O © © © © ° ö -
Table Al(a). Garrett T2 Turbocharger Measured and Calculated Data for 50000 RPM for Tests Conducted on December 4,1997.
33
© o o o o o o s; o o o o o o o
U U UMM IO IO ON -U — 00 ON ui to
^ o o o o o o o or "5 Q M M M M M M. ^ o •- » u) & ^ si Ul — NO Ul KJ NO — ON *. ON O O —
w
Si Si Si Si Si Ni Ul O — Ul ui oo NO •— S3
Ö U >J U OKI si IO Ln — U Ut >J Ul ^ Ui Si O Si .b ON 00
O O O © O O O -J -J sj -o -J si si M
OMn A U U - O ^ U> U Ul U> ^ 00 ^ NO U> NO — 00 OO Si
Si Si Si Si to Ul ui c re >
2H
Ul ON si 00 NO © © U ^ ^ - LA ^ VO © Ul Os — Ul — © OO Ot W 00 ON U U)
o o © © o o © ON ON ON ON OV ON ON j i a U UUU - K> •- VO Ä Ui O ^ t OO W W U U *
00 VO © »— Ul A. Ul *N
Ul Ul Ul -U Ui Os OS rj .U © 00 — U> ON U» \0 U U ^J U \0 M
"=3 Ä. —. r £ © © © O © © 5 O NO © © © O — — sl^ j, vl 00 00« O O 2 NO *. O 00 Si s] J -J Ui U C 00 - 2 S3
3 >J Si »I -J Nl »1 -J
3 2 j*. ui ui .ts ui ui u>
•— NO NO © -si 00 NO 9 © 00 OO 00 Ul si NO Si -C — Ul si © ON PS
5 M
© © © © o — — ~J ON ON ~J 00 NC © © *^ >1 so ON Si OS Si OO 9 ji £*. -U Ul © si s]| PS U si ^ si u CO 001 3
H C S3 K 2
0.6016 0.602
0.6026 0.6054 0.606 0.6038 0.6035
*
P3
o © © © © © o Ö © © Ö © © ~ ON Us Ul Ul si VO •— O ^ ti CO OS Ui M OS Si so 00 -S* © £>.
1- o 8 3
i - M M U) 00 ON © Si Ul NO us NO SO Si — 00 si — u> u> >o — si © to O U) A & A u •- §
Si Si to Si Si Si — Si Ul U> Ul Si ~ so Ul 00 00 so OS Ui Si si — si us Jz. Si so
«
si d W i Ä ^ i pou uoo u -o b si si ui u si bo Si si ON NO Lft — si NO si Si si Ul Si Ul
o 5 > 5
© © © Op © p Ul u» OS Os s] si CN so *- — oo — — Ui si Jl •- O CO U» SO Ul © O s] Si Ul •—
~ ~ P P r~ ~ r* ON — ON ON ►— Ul Ul O si © Ul Si -Ss us ui Ul •— ON so Ui so — Ul Si NO OS so -U.
•3
©©©©©©© ©©'©©'© — — ON Ul Ul .^ 00 © Si *- ui ui © © © © ^. © si © © ON U»
ib
s£ w 2
si si si si si si si £t Ä. -fa. Ul -U .&. Ul NO NO NO O si NO © OS U) U CO V» - - Ul Us .fis. so Ul 00 ^
S3
2 9 pj 5
— — © o — — — ON — ON ON — A. ON *- oo — us s] —• OS si Os Si -fc» si 00 ul O si - A Ul A0O
S3 PS s3
W
2 S3
C5 > S3 S3 IS H
H to H c so es C Q > S3 n IS so
r n c r > ma
ts D
> >
135.786 135.826 135.741 135.733 135.73 135.73
135.733
5 r
» IS cc
e » IS
>*"s.
o o >
o
Patm
: Speed:
PJ !/: ^s
S3 Si Si Si Si Ul *. -t» © Ul ON SO ^~1 '— J± si Si *. NO US Si oc — ■— Ul SO si «— si — si Ul © so © 00 SO si Si si Ui — —
I H c S3 5 2 PS
29.68 "Hg
75000 RPM
172.574 167.766 160.834 150.567
141 133.249 124.949
♦s.
4.33869 4.70158 4.82542 3.6632
2.52562 1.77178
0.588524 s
-
19.5477 13.83745 8.8546
2.23527 1.60941
4.406085 5.53455
I n o 2 "8 S3 PS EC «1 o S3
t 1 1 t t 1 1 — to .U 00 — — to b w bo w ^ ?° ^ C\ O — JS. — *w w O ~0 Q\ Ä ^- — -to. ^ ^ 99 SO U 00 W
1 oo vo O oo si o\ in NO UJ o Os Ji. ja. o b ^. iu ju ■- u I- Ul Ä C\ "- IO W sj NC O O (O 00 00 ON W Ui 00 — CO w «
o
-J -J -sj "*0 ^J -J -J Ul Ui Ul Ui ^ Ul Ul to o — to NO o to — \o o to ro oo o tO NO 0> NO O 00 Ji. C\ CO si t> A \C i>,
5 s IS IS
Ul Ul Ul Ul U» Ul Ul UJ w u u u u u 00 oo oo oo VO vo -o u» ^o bo bo u» ^o bo CN -J © —J ON 00 tO -O -O ON -t». NO tO Ji. 1
H c S3
s 2 PS
H IS 2 ■0 IS 73 > H G so IS 1/5
Ö IS a s
Ul Ul .„ Ul U) Ul Ul U U ^ U U ÜJ u i t 2; ^ ui ui ui ui iu : . bo Ife. so <1 Ul Ul' S W sj U» N1 A W ^ sj ON ^ M
1 Ul Ul Ul Ul ,„ U Ul o o o o x! o o NO oo -j ON ^; ui JX
ö ö — ^-J \- ui bo ji - io — r w o\ ON «O -*J NO "*"" NO *»J
o
U» Ui Ul Ul Ul Ul Ui to to to to to to to JO O O O "- — i— — NO bo ON Ö Ö Ui Ui sj O U) to ON to ui NO NO to ro *i. •—
1 o o 2 rs S3 CO so o S3
CN Ul Ul Ul Ui Ul Ul © OO sj ON ON ON ON © .U ^ VO .U tO tO !- si Ul b Ul *J i- 00 Ui -4 tO -J -O NO ■£w ON •— NO -J ON -^
3
9
a o o
I SO
>
H H H
H C S3 S3 o
is SO
IS >
G S3 P3 Ö a >
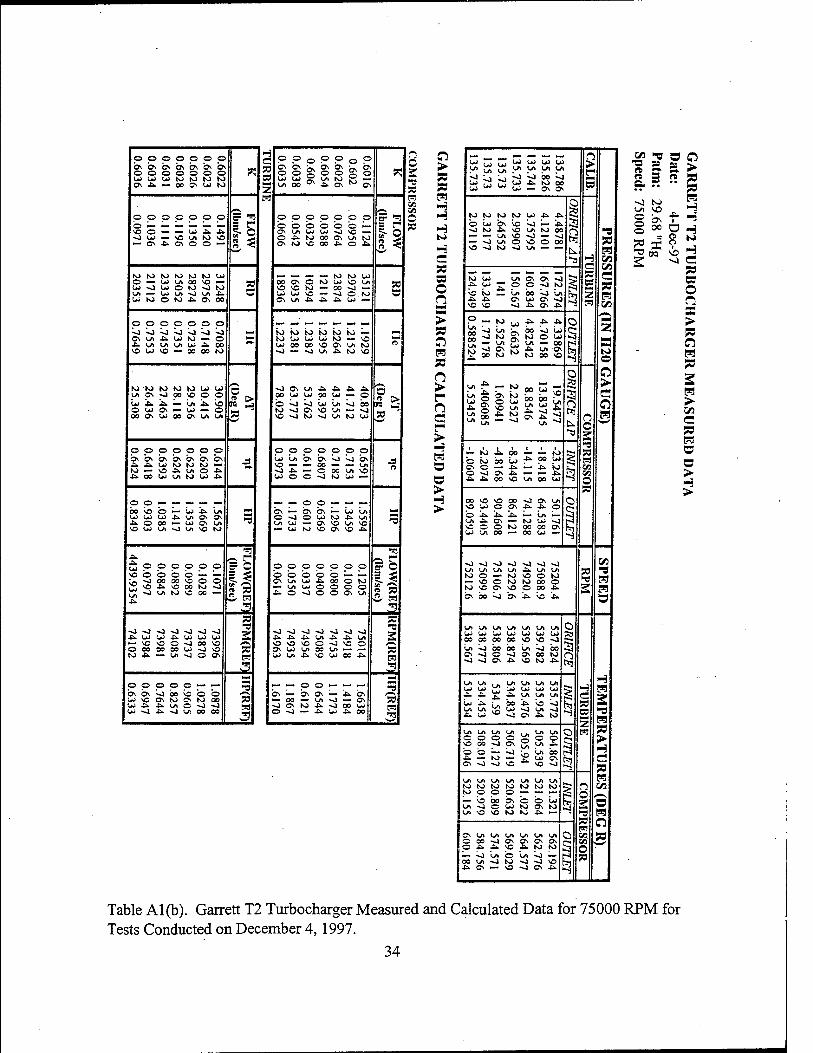
Table Al(b). Garrett T2 Turbocharger Measured and Calculated Data for 75000 RPM for Tests Conducted on December 4,1997.
34

< < a a m « GO < Ed
Cd Ü
U O a PS
H
H H CM
Ed as OS ■<
u
ao a LA
o 00 NO
o © ©
C\ © <N f^
,# ■3
m u u 08 a su tzi
o Ed
ei ce Ed BS &
Ed ft. § Ed H
ON ^r NO ^t NO —• ^* C\ ON -q- 00 in so CN t^ in in \q o ^ m oö CN in en* en m° —' oo ON ON o — en NO WN </^ in NO NO NO NO
•" Cl 00 fN1 m (H el w m oi -■> NO m o\ ■<r o —< — —< — — oi <*i CN CN CN CN es CN m m in m m m
ON en en 00 ON _. NO ONCitNao — ON en in oo °! NO
r-' r-* ON — ci S -r ON ON ON © O S O ■^ T T in m v' in
_ _ cn m CN oo S3 ON en — ^- m o 5 CN* «*5 >> NO *> <*1 S T r- en en CN m K m ci TT m n cn 1 mm mm
7 NT « «o n Jl m © ^- cn in CN cn T CN NO t> "T 00 ON 00 00* 00* NO* ON « ON m en T en ^ cn en cn m m m m in in m
ON m ON a© m Q (** oo r> W ON tn" —* oo* ?" S r» £) o 2) en 2 2 °° 2 ON © oo O © ON © ON O ON ■* "" CN ■" ON ™* 0\
ON 3 m 5 «a P s s ■> cn CN 00 NO
_ _ mo m 2 cn NO' ;■; NO en ON _ en m ~ NO m
NO O
m oo t~ oo oo NO NO CN <T en 00 CN ON CN r~ ,_• f T m o o* CN" £ V <N m r-. CO CO ' •—* 00 »"O «■""
ON -fj ii m m en m 2 — © «N "* S m NO >° £ CN m cn CN ~ "^
— er* er* 00 CN
r- CN ON „ — m CN m CN ON ~ CN m "T oo ON -^ 3 t^ r*- ON Op m ON S CN O — ON p. NO y ON ON I od r-" NO" NT N O
CN en -T OO O CN T "■* "t "T r-* cn" CN — O cn co en
NO T CN NO
m in oo — OO NO en* -r T CN CN CN
m m m ON -sr NO
•T NO _ vo r- r> en in NO NO m
m m ^ CN en "2 m CN t> S m
, CN r> g *o : cn m """*
TT cn m CN
00 00
NO in m —« NO CN CN NO ON CN 00 r^ oo oo t»; r-; r- r-.
2 w in in n in vi *_J cn m m m m m
<
a Ed
u j -< u Ed
ss
Ü ^»
3
CM
Ed
2 <
£* Cd
|
ON -^ — o m cn O .c^» NO m ^- NO CN oo ^r c\ in c* c** ^- c-- NO CN C-; Cl TT ON r- ci cn* CN* — — CN m
5 ta & S s- cs
JQ cn ON T P- O NO S ON -■ oo cn ON — 5 Ol IO ON NO 0O NT Q ON ON ON ON ON ON ^Z, ON ON ON ON ON ON
PS « |-s O 5 !-: — c&
cn m ON oo p» ON CN o r- ON o» r> VN - NO cn o T -^ r- oo —._._. o o o o O Ö O Ö O* Ö Ö
s m ON r— T NO r» — <n CN C— 00 00 CN c— r~ —. NO — cn t— T CN o m cn TT oo r~; cn cn CN —* — CN cn
u m CN oo ON T NO ~ ON CN O t— CN CO ON CN m T ON — 00 NO r> r> r> NO io ^* cn © p* Ö Ö Ö Ö Ö
«3 «a a
CN m cn NO T S r>* NO t- ON CN NO S ZJ cn ON — r- m "^ N. c-^ ö -T — -* 2 2S NO r> r> oo ON ■; 2
NO ^ CN NO NO ON o o NO o r^ ON T in f^ o CN m CN CN 00 cn -T -T T T rr tr\
a as
r» oo ON o cn oo t-~ m p*- in in NO *NT m r^ o oo oo T CN CN TT ON —. T TT cn TJ- T cn cn — — CN CN
c 09
FLO
W
(lbni
/scc
)
CN o ON in cn *r oo cn m — f"- NO ^ ON T CN o T rr r~- c— -. — _. o o o o O O Ö Ö Ö Ö Ö
ss as
8 ^
ON N 00 NT ^ oo ^ O —. -• T ^3- CN CN o o o o o o o NO NO NO NO NO NO NO
Ö O Ö Ö O C> Ö
z 5 as 3
St Sä .
HM
— cn CN — NO r> p~ oo NO cn m p~ — m ON m T — oo NO ON m NO cn cn ON ON r> -; —; _* ™ ö o o
s c ss
ON NT p. n N m NO p** — CN NO ^r cn oo cn O — ON CN CN CN oo oo oo r- oo oo oo ON ON ON ON ON ON ON
ps s S--2 1-3
NO
i> m o — NO ON £j NO cn oo NO ON CN S — —■ O ON 00 00 **" —.-.—. o O O O Ö Ö O O* Ö Ö ~
T
a. cn m oo — m NO r> •«• O T CN —• o r> ■"OM07OT ON p cn CN NO m CN CN rn* CN CN — — -I
-** in ON NO r~ NO © CN ON ON o © •— CN —« — m ON t- 00 CN 00 m m ^* m T m i^- ©' © Ö ©' ©' © ©
tr en •< « a
— t- © t> — CN CN CN r» T NO p~ cn o ON ON ON —< m m NO
— Nf r> cj cn m' 6 ^ ^ cn ^ cn cn en
c CN © in oo cn © cn NO — O ON rr 00 CN NO r> oo ON — CN -*r vn m m in NO NO NO
©' Ö ©'©'©"© ©'
a PS
CN —• ON ON 00 CN in CN NO — CN NO ON m 00 — NO © — © — CN — oo en © r* m TT -T cn en cn CN CN
FLO
W
(Ibn
i/sec
)
r> in m o o cn — T NO T 00 ^ ON o © ON 00 in T CN CN
© © © o © © ©
^ CN CN NO © en m oo — — — CN CN CN CN o o © © o © © NO NO NO NO NO NO NO ©" © Ö '© ö © o'
Table Al(c). Garrett T2 Turbocharger Measured and Calculated Data for 100000 RPM for Tests Conducted on December 4,1997.
35

o o © © © ©
ON ON ON ON ON ON « O O © o O © o O ©
06 Ul ui NO -J Ul
o _ o o o o O © o- "fl M-• MM to to to to IS ON 00 o X» ON NO ON ON ~J to ON © i * Ul Ul 06 4- NO Ul
ui i*> *. Ul Ul ON JM NO Ul o Ul © 2 06 O ui ~) NO 06 00 09 4. 00 a\ w to ui ^J © 00 ON
o o o o © ©
Ul A. 4M 4- Ul 4- a ■— ON 4. NO — 4- 4. 4M NO to w
ON ON o 4- to ON
4- 4a. 4- 4. Ul Ul o
3
•— ~J ON NO to to
ON Ul -J -J Ul NO © * 4. MM -o © NO NO Ul NO ON 4.
O O © o © o A. A. 4. 4- 4M 4. -3 4» 4M to 4M ON NO 4M -J Ul -o NO -J, Ul ON
to to Ul 4» 4. Ul
Ul NO to o -o. to MM ui NO NO NO ON
"0 IO NO NO to Ul NO 4*. ui
•=5
s" 5 o o o o © ©
o o o M.. M- MM
2 50 00 NO NO o —* to Ui © ~J ON Ul •o -J *~ 00 to Ul
3 3
to to to to to to
9 ui to to to Ul to — 06 ON ui 1—• MM
-o O ON o ■u 00 u> to NO ui 4. 4M
3 to
MM "3
— 4. 4M -J NO © 9 ON O 00 u> Ul 00 00 U3 ~) Ul NO NO H Ul 4» o *. -o 00 3
H C © © © © © o
50 OD
ON © to
ON ON ON ON ON * © © © o © Ul Ul o o
Z m
X» ON 4M 00 4M
© © © o © ©
o o o MM MM MM a r" N.T ON *L H Ul ~1 Ul NO 00 00 X» Ul -J NO J- 00
w
M ̂ — Ul 4M Ul NO NO Ul ~1 ~J Ul so Ul Ul NO 00 -J Ul ■o to o ON •~* ~~ © © to
ON ON ON ON ON Ul 3 A. 00 00 -o ON 00 -o to ON -J 4. -J *~ o © -J ON
»*^ 00 4- Ul MM MM © D Ul ON © -J »-» Ul s > © 06 ~) 00 NO Ul » H KJ Ul —1 00 Ul 4. 3 NO Ul © 4. 4M
© © © © © © 4. Ul ON ~0 ~J ^1 -. Ul ~J J-. o Ul NO Ul NO 4M ON to 00 NO ON Ul Ul
Ul Ul to 4M Ul ON
06 o to ^] ^1 to Hrt
o Ul © Ul Ul OO ■0 to 00 ON NO Ul 00 oo 4a. 00 NO ©
•-J ■a c © © © © © o 5= 0
© o © MM MM to 1% 2 50
NO CN Ul Ul -J Ul 4- Ul to Ul 4M 00
ta- m" 00 © Ul
5 50 ■3 MM BM MM MM MM MM
to to to to to to 2 JM X» 4M 4M Ul Ul ON Ul MM © o NO 53 ON MM ~J Ul o -J NO oo ON 4M to M
3 Ul Ul to Ul ON -J "3
MM Ul to 4. 9 00 ON Ul MM -O 4M CN to © ON ON Ul w
3 NO -u NO -U Ul NO
> 53 S3 m H
H to
C S3 C3 o
> S3 ft P3 P n > r ft es
> H P3 D D >
, . n ui ui ui ui ui r~t Ui Ui ON ON ON ^ > r NO NO © © o ;-, ■O 00 ^i Ul 4. 3 U Ul ON vl IO ^ P3
C)
9.76005 8.3532 7.1475 5.57735 4.67553 3.971055
1 ."3
>1 H t/J e C/3 ^ J. ^ U U Ul O A 00 OJ >1 VO ^n 50 c — \o U- 00 o\ N- & S3 -b. 00 U} to O SO 5 z P3
as t-« O U> O ON VO \0 W ^- UJ \o -U
J
OS sj \Q M* «W Cv o Z -wc«!°* C| _r ON -a u> -j *; ^ M*
V ON oo ui to y> W £ 4M 4M M- UI *; m K> ^ oo ON NO \O "J s O
C. o
52.696 36.74685 22.18035 3.735135 5.70325 13.4303
>
1*5 MM o
M "A
MM M. to ül i. ON g 50 "33 to © ON NO to w Ui to ~J NO ON to P »3 © Ui IO MM MM 4M C/l IO ON 4M ON — NO ^ O
53 IO M M to - - n Ui Ul 4* M- oo Ul Ul 4M to MM ui OO *<J 4M 00 "- Ul 00 Ul 3 tO ON NO Ul ON tO t%i ON NO UI ~J Ul Ul ■^
to to io to to to § 2
Ui Ul MM 4M ui 4M U M. IO 0O N] >J 06 -O © Ul © ON O OO Ul © — 00 a
Ul Ul Ul Ul Ul Ul p 4. 4M 4M 4M 4M 4M i 4M 4M 4M UI ON ON
© 4. ^J to 00 NO 4M NO >— JM 4M Ul 8 Ul ON -J OO ~1 00
H H Ul Ul Ul Ul Ul UN t*. Ul Ul Ul Ul 4M 4M
o« o oo a o & rt 2 4M VO ^J ^O 4M 00 s 53 4M Ul Ul Ul Ul Ul ^J Ul 00 -O MM Mj •4 5 z
-a P9
4» MM MM 4M 4M MM n P3 NO NO NO 06 OO 06 i>- Ul - M \fi O O «^ H 00 ON © © 0O NO 3 Ul © MM M- ^J Ul 00 ON Ul O0 Ul Ul H SO
PS Ul Ul Ul UN Ul Ul
| to to to to to to n 1/3 .0M 4M 4M Ul MM Ul o
2 ^■^
ON tO ~J Ul 4M Ul C to ON ON to oo ON LA Ul ^ 4v O 0O * "3
50 l=!
C5 ~J ON ON ON ON ON O cyj vS3 © ^3 Ul 4* Ul tO V3 -J MM ui Ul ON OO *^ n ON — Ul 4M 4M NO 3 50 4M © Ul © tO — ON to ON JM M- »o
^
ai ■D n tj SB a rt M4.
rr = J»
N"M t-J K> VC t-n
CN 4- 1
o oc a o So no
a i V0
"0 ■~4
c. > so SO P3 H H H to H C so 63
> S3 o P3 S3
P3 >
C so P3
>
Table Al(d). Garrett T2 Turbocharger Measured and Calculated Data for 125000 RPM for Tests Conducted on December 4,1997.
36

c
3 <
id
o as ■4
r~- CD
~ o <s <u CO o ;■■ o CM <n d <N
2 Jj £ a
o w e 05 w
1
1* ltd
1* 1 o
■-.
fa
o
Cd
S Cd
a fa 1
<N vo r-* ^ M^ vo oo « t ■*r & c* . Qo oi.o\ c\ ~ m
I — \o r-J p» \o m ^r r-*> >- vt NO\MO\OOW«OOm pr^ou-joofnot^fsr- K«oo\ob — oiKft^o en ro *x f> ci ^ r*i ci ci o mvimvi'flirtiflirtiflift
00r*Oft*O,«t0\'n00ft NNNNDMNMNN
o 141.94
153.
018
171.04
190.
271
2136
23
225.
915
259 39
4 26
3.67
3 26
7.31
1 23
6.91
1
cd O
< Ü o >•* g 05 Cd « B2 Cd OS
O V3 fe
g Ov O - Of**mroQlCu1 cn-fl-t^ooo — <N r~ £j i/i
a. •"3
I 54.0
075
50.4
65
44.5
7415
37.83325
23.0
046
14.7
0305
4.64
141
6.25
245
14.24095
15.2
897
Ed Z 3
Si o
\o*-"0\"/if*ir-fs—. T ft ocnoo^r-u-i^rgmo mw>r*ft<Of*>mJ;owi ««■»©ftp^om^oao
is 1
ftvocif^icNp-ip-r-voft o ftv-)p-p«.ftir»~\oo
h06»O\lfllfl-tMN0O
HI 0.
s E 1
11 1
503
109994
10.7
4495
10.2
456
88301
82581
7.03
055
4.82
343
3 75
7595
3350185
90rnm — ooaor^m—• « O « ft N T (N -« —• m OO
fi co e* f*% ci f*i <*i fi (■*■> c"i
a &
s s a.
<3S
< 5
^
d
Ö c
2 a
a
p- CN vo P-I «o P* ft -. p» r- o m CJ -r P» pimu->ooftrnp»p-
S <o tn t pi m \d
p*p* — OTTraoci ft P- \0 PI •— *o o* t "
ooor-x"i — r*^oo oom\OT*coo\op* oftp-ciow>\oft _ CH ~- ~ — ~- O O O —• ÖÖOÖÖÖÖÖ
vto^-ft-vpjooro — «oftpimtnvo^r.. ©m—«ftp"*ooopim
5 *
5 !K
cc N »o m -« w o\ m w p> ro — (Nr-oofTtN ~-p»roop*w-»*omp» r*-p-p-p»vo\ov>Tr'i dodo" do odd
or-vovivomw-ift orrmpiop-p- — ■orooo\or^-tNC4oo ob— ^oodoo'Sin
(N
OOOOU-IOOP-OTPJ^O 3P» P» P- c*j ft p» oo \o *o o r- ^o >o *n
ri*w-*OM>oirtoo TrW»f*1V"l0OTQftO ftooft«rtOO*T»AO trtCNoooo — r*oO —
o-i/imTfl-wft-" ftft\omftvo«/ir** — "" >Ow-i<Nftw->vOftO — —■— oooo—•
ÖOÖÖÖÖÖÖÖ
— ..___ fN O O E _ -OOOOOO ol» 6 o 6 6 6 o d d ö p
5tr ■= •* r** — ftomr-p-*^^ « in (*- — r*-w-ip-=t=t=t *- OftftP-vO-V^t^t^
fe CN CN — — — — — %%%
5fc 3t =t
s s as
ooor»»Trr- — ^fsft^o TNOOO-M-O-ft « oi d - ^-ooftoor*
öoöddöoödd
& * * * 3fc =fc 33=
*r»r-ft»i->\00»03fc5t3t 0(*>v0 0f^p*o=t=a:=t oe>r-<NmoP"oo5t5t3t vOw-i*«-r4p-ror*S53t
at =3= at 5t 5t 3t
c-
=t st at m ^ ft ft ft-P- P* at =t =t
f*^ rn ci M ci f*S fi aj. 3t at ddoddddat=£=t
at a* at
f.2
at =t at at at at at at at
-NP4P0O<MM*g* «dft'odS«ow355
at at at at at at at at at
£ OW^(NP«-ftpOOO — p»ft
O f*l c*"> <*> f*1 t*l fl ^ *T w*i d d c> o o" d d d o d
OP^*0— CivO'/iftaOi-'-i
oooor*oooo^prrr*
a- "
Si — p^-rv-ieiOft-fOO p*\0*T\OftftfOw%P-fn mmmmr^tMtM — — —
Cc £ oooooooooo
1 OOOQOOO — — n oooooooooo
ododddoddd
Table A2. Garrett T2 Turbocharger Measured and Calculated Data for 125000 RPM for Tests Conducted on December 15,1997.

o00oopppp SOÄÄOOOOOO
o o p p p p o ö '© ö © o 00 so 00 oo SO SO _ _ -
.. ^ o> 00 w « - g %1 J^ 00 <0
_ ._ © ©go* 2 OpO ©fl|- b
0sO0©00©©tO — £J WJ SO ~ |>0 .fc IO to -O. Ln O0 £B wooowwOi'-wio pon -o\>iw^oooui- OsH
o p © p © bo so oo bo eo i^ w A ^ w
o p p pB — oo oo
_ _ W U* OJ w«. tO Os W — — •— \OOs©00-O.U»sv>tO
^1 -J s s es os io bo w w * *j — w so SO so oo so o w>
-O -O. -O yi
to to © 19^ 50
oo'©o© popp© U.W(OOOONlO\U<i;A OL*Os-JSO----tOpO©
©©©©©popp LnÜ«LrtLAs/»Ö\Os0\O\
O © © © © ! ?b
^\OOOV3«VO>0,P,0 WWWOtOOftsJ**; tüsJwaoAoooo^Ooo Q\sJUislO0M^»O9
i o © © © © iyi Ui (Ji Ui
© o © © © Lu !ik it». Jk. ifc> oo to os -- J^ w w A - -J WW00-0--AWO"
H n © © o © 0 © © © © J5
a OS a\ bs bs >». b\ bs os o\
© © S © © © © \o vi r; w w w N
* g "3
S J^ oo *. Crt
© o © o © © © © ©
VI 0 53
? © © © o © © © © - KJ i yi C7\ »J sj £■ -
£ -O. \0 W - W U> o ^ C\ — © OO LA O0 N> 2, *
« ,. M N W 2 3 w cj Ö w w
° hJ so o o w oo
to © 50
-fc V»
_ »t
— — _ — © © © © 3 0 so ©
I W O < •■ oo ^ tO ■&■ 5; — W -*J ^0 ■*> \o
p •^1 w w W O « »O 00
bs ift. © bs <-* io ■— IQ ^
£ O .U — Os Ä Oi N>
© © 0 © © © 0 © 0
OO W W «4 vl V> *J u» ~o © Os — so ©
so ©
o o © © 0 © © © © —* to Lo lo i* £. !&. ■O © O 0\ W OS vVS
3 *3 0 0 o\ 0 w w ^
£ M ui ui Ui O M oo A
© O © © 0 0 © © © §5 ° © © ö ö © © ©
Ä3 © (O
W Ul — W ÖS w w os to to UJ *. © ©s
53 "3
ui Jk Ui LA Ui ui Ui ä 0 00 0 p © © © w -^ to £ S) w 0 W w C> - 1? w W fk. C\ to LA -tx © to
53 Os os B
*3
o © 0 © © © © © © "3 Vi u> — to u» u> j». jx ^
s] O O sj i sj Oi 3 © ^j — j^ U> i-n *. A. •n
> P« PS
o
>
>
n U>U1WWWWU)U l>l
Os OS ospspspspspspsos ar*H
SS 00U>W«VO"-O\A B"
OB ?l 0
r" to « es 38
2.6949 2.7828 2.48137 2.77627 2.2136 2.22837 1.8588 1.82057
3| S3
CO cn e
ft <* S3
<^s]ooopMOOoo 4i.as>oN>;ft.S;5tPN
— Os *•<-«*■ 00 00 2 v*»"-«*— -J °° -. O 2 slUlWOOO^SO» OvO\W(OU«,ftN-
1 B3
5 73
P3 Ui ^
2 — to tOtOtOlONJtOtOW 0
— — SJWi^^J*.^ o>jyiwo*.wc< *-J KJ
O 5 <j» 00
c 1 © tO J». -J 06 00 0 w — ■a
££ os N — W 0\ A » ^ *° ^tOOsUJ-^OsOsW ^ n W ~ ^j w -j -J u>
b. "B
0 2
© — [Oi*>^.ÖsoososO-— (oLrtsoJ^LoujvoP
K. 53
f^»05
■— 0© Os — LO to -JtOOOOO — CsOSÄ. ^
0 58
^WWWtO., MS) OOOW^OO^WW
0 VO — 1J
ij*jto^os2©*° w«Ostol>>Oswto-j
"^ ^ 1^1 00
s* l^t A U) Ul Ln U) Jk
©-0 — u> — tosojg S3 £ £
votoso*.^J->JOsI,2 Bȟ!LJ
U' SO O Ln i bo M A w 1 |Q
uiUUiUiWWUiWt ol I 55ov)vo«oo«jviw>
WOOt.S)UlOOO^ WiAWaO^CiW l ^
OS U) WUSOOOS-OtO'O — B3 9 "
wiuiwii/iytWM.L« eN iS »IS so so sososovoooooggoo
bstotoö^obov'- w>OsWivO-J-S^ ^
Bl*5 to — zig V^t LA t/»w»L/»L«,-ns^»LnUt 0 u»^ U> to
n^ 05
I»A LA TiUlUlViUiUlViUl
g 00 00 0000-O^JOs—JOsOs OBC oe tO — ©ioio^-jcjooj-j
ft--O\00*OWlW £3 Slts LA w "0
50 63
yiWüiWl/WWW 0 w CA 0
^*^ Os sc l>j.— vO-OOsOs^<-n
H (OVOASO^O^lW n 5E
— 00 sieow%lN«-4y
Ä= ? 5J ft ^ s. s. s» « 3 ft p8
Ul w ^1 5 P «L
i"2 2 " c
ja B o ft > 73 ft PI 93
2 P3 > c 50
o >
Table A3(a). Garrett T2 Turbocharger Measured and Calculated Data for 50000 RPM for Tests Conducted on January 7, 1998.
38
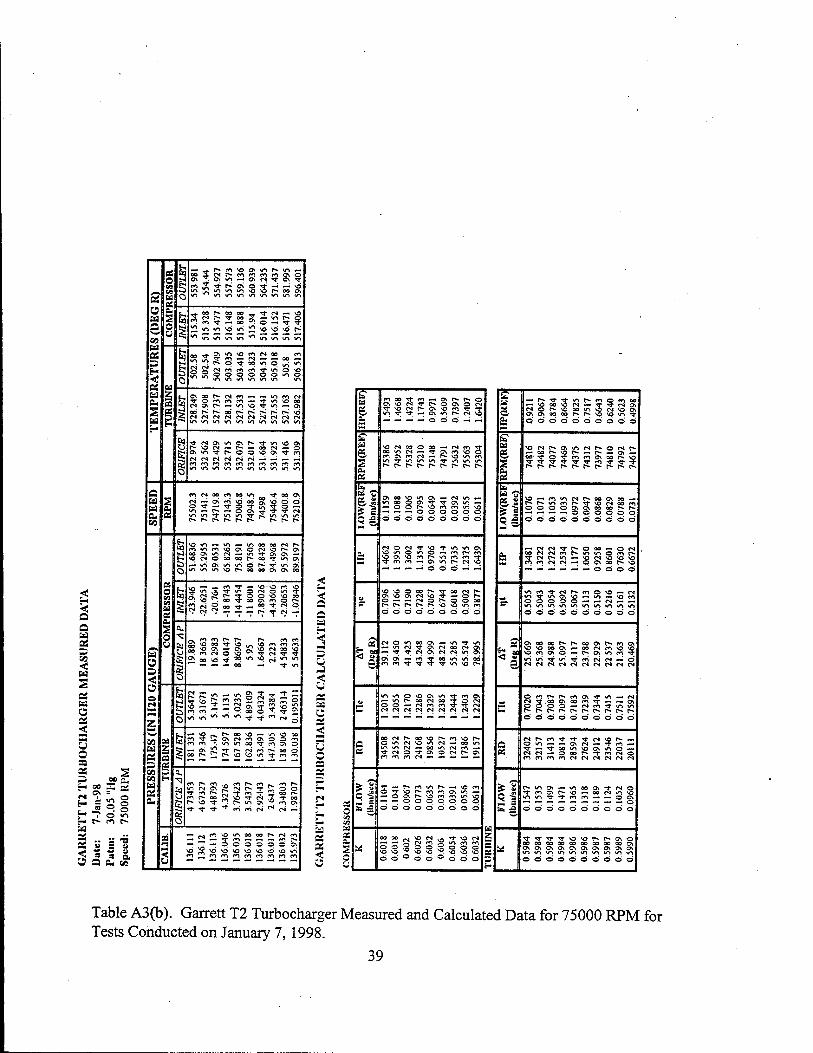
e Ed OS 1—i
55 Ed S as u a
u o sa
2 oo £
L. •? 2 ° r« c» m r~ Ed =* .. -- ■£ 3S u a a ■^ a s 8. O a a. »a
laslb ^«-.r-rnvooNwip-u-i —
o\~o\v>~o\c*^ro\Tf
«*>,>:W">iriWS\0,OP-OOa\
Ses ölfe Ed S
o
b _-.oop-oooo_.Trp* — \o Sc-jp^-rooST — u-ip'-Q
ri § 09 Ed OS b M-oim>omNM en
U)
5 e a
..P-O^TOOVIO^VI
SS(Nmmfn*^o«d SSoooooowio
n OS Cd z
1 ^■O^P^fO — t "« * « CMONP-—•«"»VO^T«") — C\ ?S oop-p-oop-p-p-r-p-vo
Ed MNNfMOtMNNNCJ vi^i/iirtwi/iin/iiriirt
E-
F
1 o\w>-3-p-oovoo\'<»'m NNNNNN----
irtm/iioifliflirt/iiflirt
Q m N oo m » w tj-ooo» Id JJ N-oirtWwSooci Ed S C* 09
b vO tn —• -n ~- vs co oo CM P*
It t- vocMO©oooP»ooTr--iO\ o
OS o CO GO fid
|
O «/*IV%W")\OP-OOOOONO\OO
b 5!
-5 — —. m -q- — \o-o m \p
r*cM^~-—.—.p-*r<N--
a. o M —.fidr^r** p* c*i ci
2j\ooo-r\o.~vommr-t
"meMOvo^Tfcs-V-*
u 8 Cd Ü i? 2oOVOTt»^^P(vj^'0
S § < o o tan
b --i coco^TVoooT-r^
z o ^^^-fl^^^fl^g
09 h fnm^«nw-)ooTmC\0 E;a~1 Ed Ai<* oop*i_p*\_>\0'/s-rr-tm es a
er. 03 a. c« H ■q Id es
~~-P-CO.rtmP~C'">f«_mP» wirMovgcMr-itJroo Trrnr-^:-rm42oor-
p-vo-r^p-w-iON^mcv 8 g ■<T'<T^"''f«S<*i(S<N|H — 05 O
5 — —,mvo»noooor-rM<"n ■"■ —Z ~ f t+> —* —• — m r- — . — OOOOOO0\
< u 1
Ed
Ed OS
< a
2^ Cd
& fc
O\VQCM-TP*OOSOCM
g-iT-w — avv^r^cMvo
ST Ed
6 2 _ OS
ooi/scM — TCscnvoo rAOsmcM — p-vomm
lw-1 TW^WTiOWiA P-P-P-P-P^P-P-P-P-
Ed
1 3
-3 c —
tn eoofttfaifl"- --■ oop*y_cif<>v->\o -«—.—.ooooo© 0 0 0000000
fe C*»OfM*Tvo-$-i/i«/iON \o-io-no — mp-m öft*Ofir*mfnmt
vovoooor--roocMP'*
o—• — CMOP»OOOO c-p-p-p-p-sovowtm ö d d ö ö d ö d ö
< OS a*
3
ii i
00(Mf«*oovor*.rrv\or*
Trc*iorro\Ofsr^o\ m "l n N -•—• — — ^*
3 VI VJ
c _
- 3\
i
— 00\r-^mrotn\0 — — OOOOOOO dddoddddd
X
2 _ ooSooSooo
dd°do0ddd
a
2
- R OO s WS P» m ? m oo
& C r^ VC or V oo OO r* va \a U"! T
s Q O o O O o o o o O
6? NO r>i r«. o\ */"! rq r-
p«-
f V? S ■V fi P* p» p- r^ P*
fee Bd
s II
"1" ^- „_ r- »ii m P*
ala o\ on OO p- o o
S =«c' o o O o o O O o o
I rs f*4 TT p- OO
Pi (N C* r<
cn m <N CN «—• o o\ OO p* «o
~ o o o o
»o m «N _ s «Tl
VI «/l «r» *n tn vs w> vt ir\ »n O o O o O O o o o o
£ ON no OO r» OO
< * VO CO OS o p» ON \r> M
S <n «I <s cs CM CN CJ CM CM CM CM CM
o f*l r- P- r*i s OO o\ 00 m
c CM r* r» r- r* r* P» P*
O o O o o o o O o o
C-l p* m * w-i CM f*S OO
r* <*\ m m ro CN CM CM CM PJ CM
-? 3
r- «^ ON — W*l no fM m
w-i VI TT T m O C7i
A O o O O O o O O o O
TT rr T rr vO VO P- P- so DO OO
Ui o\ O o\ 0\ !7\ o\ o\ H'O *n v> */") v> VS vr> vsl
1° o o o O o o o O
°
Table A3(b). Garrett T2 Turbocharger Measured and Calculated Data for 75000 RPM for Tests Conducted on January 7,1998.
39
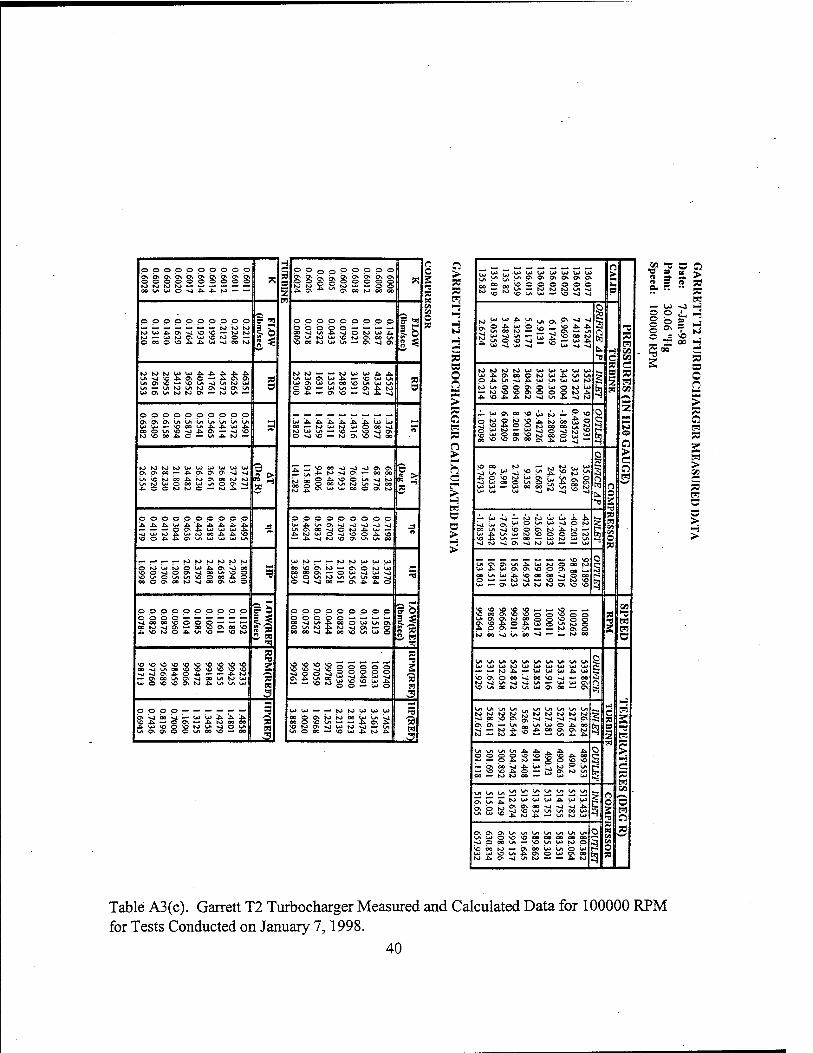
©©©©©popp©
©©o©oooo©© *
oo©©o©oooo :- ;— — — ;— ;- — iototo
w-wtoaw'OWO-'
U>0\LAN>tO 0\ — NJ L/i — ff
©©©popp©©©
00©(J>\0—lA.O\ — *J\O g
N>tON)tOWWU>U>U>U) 0\ ON OO — *.p\0\p\^l^J
uiMuoceuviOO\Ni
9 5 >
ooooo©©©© ©ü 'j; jk i w iu ^ !& A A ^fl -i
— —<.-- — (OK>tON>N> K)H
\OWOWW\OOWA ©i * 000^«N)N1000VW on
©ppppppp© p|? ö
00 W sl 0\ •- 00 \0 0\ 00 <Ol<S 13 Jh%ONi©.fc.Crt>ö — *0 Kl|S ^
oo«jyiosvjv0<0*0\0 vo I -mooiyiOvlOOUiWW WO««OMO^Vi7iUi
•
3 2 IS 3
Ol >1 W ->J "" WWJ^JkA. 3 1
S OB Ö
E 5
©p00©ppo©
©©O§0©©0© 6D^wO\eowo6oo
W
O0©0©0©©0 bböo© — ~ — -- 09sJUl£sJOIOUA ©1-ntJüJVOKJONOOLo
Iff «9
ks lit < Jo, <
WW- — IO U U)^ A
UOiUlUiOOtOUtWUi 7)
CO — K) U> tO U> O OO vl WWW« \o~ VO >J o\ 0-sj\0— IO Q\ vo %j n
gfSOC»WNJLft-^|00 ™^0\WU*00©ONN>
9 ja «^ 5
©ppppoo©© uiCtlnbvsl^lslsJ^J
OOOOOV-OWsJWvl
O NJ Nj oo - 0\ Ji. 4^ © 5
©0©©0©©0O ©oobb — — i- I— nsjuÄooowu) 9\ ECOOoJ^COtOVlW ©
5 b
£2SggSSSS 2
IB 3
be©b\totslbeuiln^4 oeo^Wi--^0\Jk «WO\*JWtOs)-W
>3 3 IB
> SS S3 PS -i H
S3 es O n
a so
> r o c
Pi
c >
n U > 2 | „OO — VOOOOOO© w j o
K>""*yiuio,»-J>J 3 | 45247
41837 96913 .1749 .9131 01177 32593 48707 05353 .6724 In
Ice See G
ft]
■B
1« IS
ION>N>NJWl»>UJWWW
s 5
l^1
tOwtOOOvOUiOlOU ce — ro\ovoo\oopto^
z IWOtQOÜÜÜ^^V 0
c
5 53 e
n 5 3
C \ooe w -^ »^ *•> i^i t»>
0627 689 5457 352
6087 358 2033 981 0333 4733 8
fc. P ■o N
so w
O
<x w b\ ^ P y *** :-» P N < WAUiMMVOOOOlO S3 •JW>10>>)lslW--W 50
o UtOlO^Ul^WNOaON) «3 oei^WAOeeoosjooo
3 W — Ov W 1/ K) M 9> O «
'COOC'O-.MOM« ce «000\Ü\000^00 3 3 (-«0\Ovroooo©,Ooo
iobo^wee,«l"'-woo O
U1WUIN)WU>WWWW -«WA'-WUUI*U \OI?IO00NJM\0SI"00
\OUICOK)VV)WO\00-?I &]
H N)tOIOtO^M>OIOtOK> ■*4oo'Oftg;Nisjs)>jo
„ fsi
s 1
2 SO 0\0\ — W a w» W O A »
IS C=3
©©©©'O'OÄ'O^.OO — — O £ N - g © \o «
u > ^ 3 H
— bvbovj^W', (oPui «"-MNOO — ^W l*>
i-
S3 Jl Pl
1 o n WW*0ÄKi4^— U M W Ei S
•0 P3 o so o
UlUO^^ODOOOOOOU sJ090l/i-*\OU)UI|>)0
o \ÜO0W— ONOOWUlOW UiWCUAO\OWO\OD so
-*
Ä= 2> es n ^ 5. 5. > rt = » 33 a. - -• S
i^ Pl
— UJ ~i >H O O i, — Ob? J o ^ T sä o = ^o . _ E« 1
§ § c o
P) so 2 p) >
pj
>
Table A3(c). Garrett T2 Turbocharger Measured and Calculated Data for 100000 RPM for Tests Conducted on January 7,1998.
40

D« 0450k RPM
Dec 04 75k RPM
Dec 04100k RPM
04125k RPM
Dae 15125k RPM Jan 0750k RPM
Jan 07 TSk RPM
Jan 07100k RPM
0.08 0.09 0.1 0.11
Referred Mass Flow (Ibm/sec)
Figure Al. Garrett T2 Turbocharger Turbine Total-to-Total Pressure Ratio vs Referred Mass Flow Rate.
-0«! 0450k RPM
-0« 04 75k RPM -OK 04100k RPM
-D«c 04125k RPM
-Dae 15125k RPM -Jan 07 50k RPM
-Jan 07 75k RPM
-Jan 07100k RPM
0.06 0.09 0.1 0.11
Referred Mass Flow (Ibm/sec)
Figure A2. Garrett T2 Turbocharger Turbine Total-to-Total Efficiency vs Referred Mass Flow Rate.
41
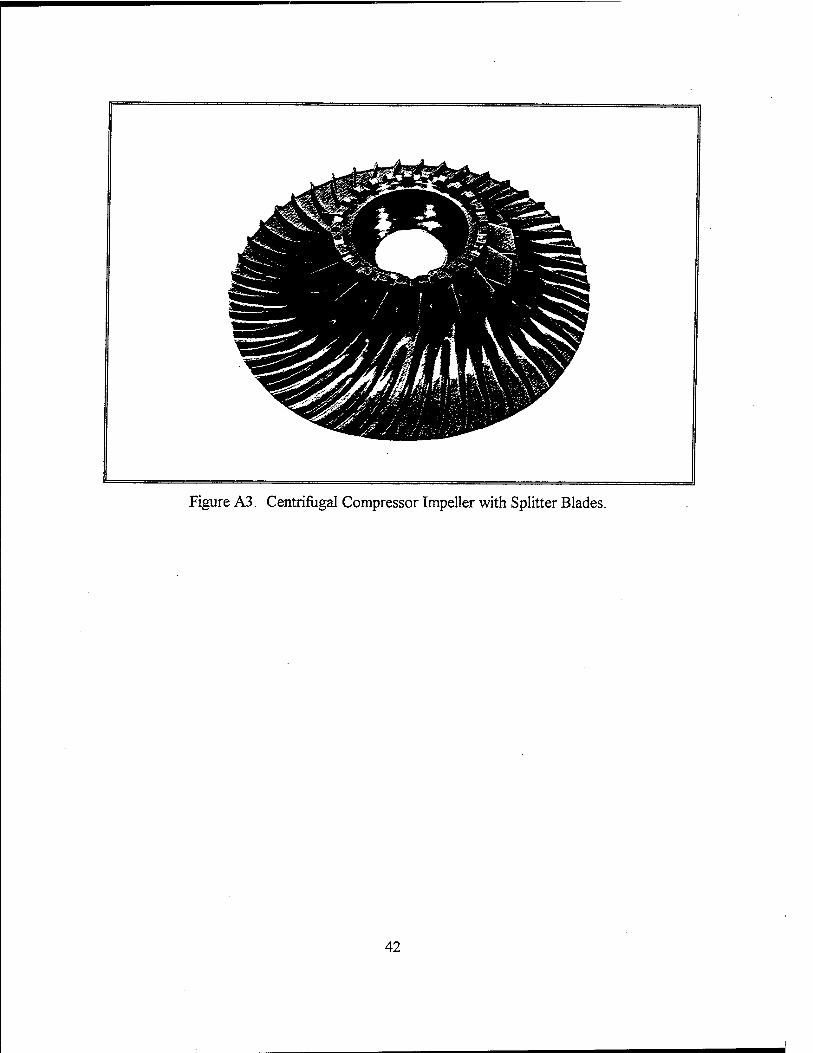
Figure A3. Centrifugal Compressor Impeller with Splitter Blades.
42

APPENDIX B. PLOTS OF FLOW COEFFICIENT AS A FUNCTION OF PIPE REYNOLDS NUMBER AND DIAMETER RATIO
H y
\ 1
ti ■»
i- i 0.63 X -V-
* . \ V- \\ * —K-
yXiX m x~ o E a
V ^1
U »1
* ^ o \ u. ", —ii ". **
•- ans ■ •
*-. 1 -. ^ — -. ^
■•■ .. - Ml —|— .-■ -• -- .
-4— = ̂ ^ .. _= -~, 1 ~*
aas -U 1 1
B«u*0.3
Batt-0.325
Betl"0.307S
3S0O 4S0Q
Reynolds Number, RD
Figure Bl(a). Flow Coefficient, K, as a Function of Pipe Reynolds Number and Diameter Ratio, Beta, for 4.026 in. Diameter Pipe, After Ref. [5].
1 « '. V 1 I I 0.6OB \ 1
» V
"\ \
.0.806 \ C S N.
u
c \ * .
N «sv
U N •-. *"— £ 0.604 \ 1
"-4 u. 1 •v s "- "■ - ~.
1 .. - --. 1 *• --.
■--
0.6O2 -- -
-T- 0.« J _l_i 1 | i i
B«t»-0.3
-- B«M1J25
---B«tl"<U07S
10000 15000 20000
Reynolds Number, RD
Figure Bl(b). Flow Coefficient, K, as a Function of Pipe Reynolds Number and Diameter Ratio, Beta, for 4.026 in. Diameter Pipe, After Ref. [5].
43

BeU=0.3 B«r0.32S B«U=0.3075
Figure B 1(c). Flow Coefficient, K, as a Function of Pipe Reynolds Number and Diameter Ratio, Beta, for 4.026 in. Diameter Pipe, After Ref. [5].
u S 0.586
5
S v 2^
ffi «0000 600000 800000
Reynolds Number, RD
III
Beto-0.3
M1-0.32S
B«a=0.X7S
Figure Bl(d). Flow Coefficient, K, as a Function of Pipe Reynolds Number and Diameter Ratio, Beta, for 4.026 in. Diameter Pipe, After Ref. [5].
44
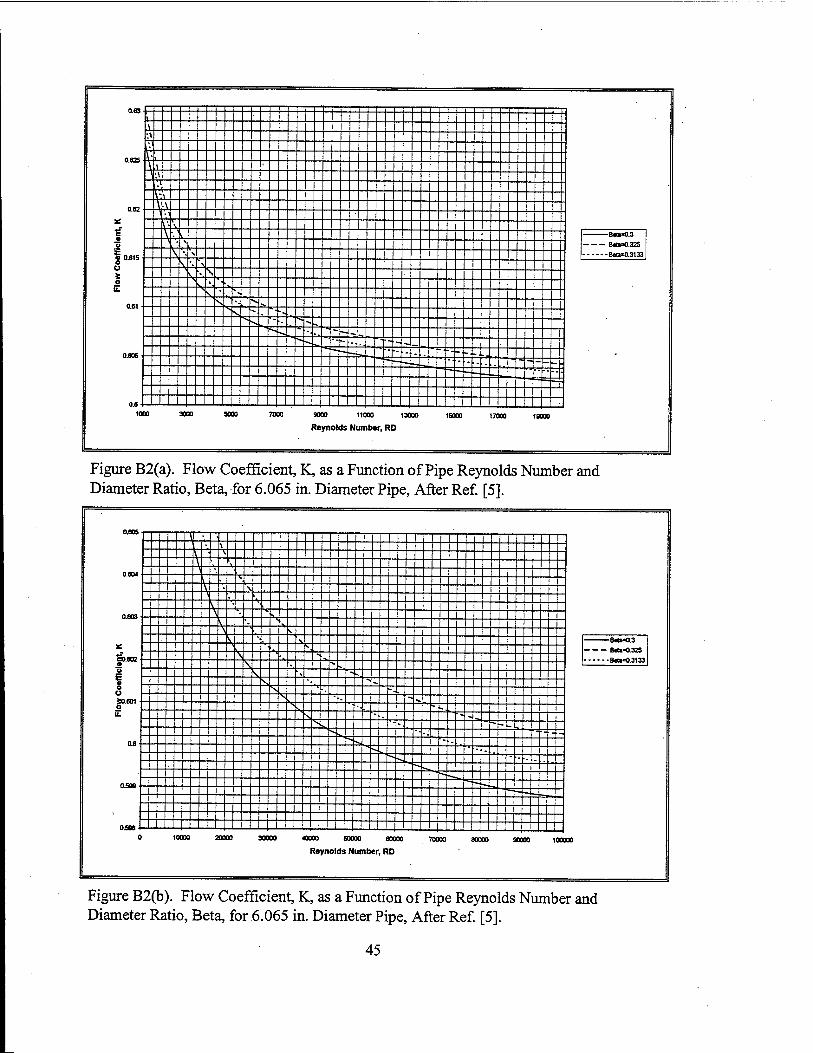
0.83 - I. \ ;\ ;■
0625 \ u \ '
•,\ ,• v 1 \ \ •'
v- N e \ ^ o
S V
o \ i '*, ^ o », *
«• s - , >,
N "- . , " ■- T
-■ .. *■* — ~^ "■ "■- - ^ _ .
L -•L.. "' *t - — "™ — t-i-
1 |
0.S- i1 —J- — 1
Satv-0.3
Mv0.325
B«B*0.3133
1000 3000 5000 7000 9000 11000 13000
Reynolds Number, RD 15000 17000 19000
Figure B2(a). Flow Coefficient, K, as a Function of Pipe Reynolds Number and Diameter Ratio, Beta, for 6.065 in. Diameter Pipe, After Ref. [5].
o.eos i i i i i i ii I i i i i i i ■ i i i i i i i ..... i
t-- ^ it f 5 - v _ _ ±
\ • "i i =tr i , =- v it — V V % it ±
- 3 ^ i, _ X ^ v *«- X it it
* — \ ■*, ^- > * "" S S - "*. E s. ■»_ -^ 1 ^ '■-, ""- o i^ —Ü.— -{• 1 J0.801 -L. "'- ~-*_ 1 1 I i_ O '*. '•-. "•■-. i
"■ ^ S- """-it i -+- V», *•_ h1-!- _ ) vv. "-_ "it ! _jJr=r+:
! ^^. | ", r. ^■^ 1 "; _j ) |
■—| _ TT~- - [ "-1
—1— —t— _J_ T"'~
_|_ _^_ , OJ» 1 1 1 1 1 Mil 1 ,_ 1 _L_ 1 _j_ _ _
: 8«U«0.3
B«t»-0.32S
B«U=0.3133
0 10000 20000 30000 «000 50000 60000 70000 80000 90000 100000
Reynolds Number, RD
Figure B2(b). Flow Coefficient, K, as a Function of Pipe Reynolds Number and Diameter Ratio, Beta, for 6.065 in. Diameter Pipe, After Ref. [5].
45

\
MM
:s: - — BX1-0.32S
---Be!»=8.3t33
100000 20COOO 300000 400000 500000 600000 700000 900000 900000 1000000
Reynolds Number, RD
Figure B2(c). Flow Coefficient, K, as a Function of Pipe Reynolds Number and Diameter Ratio, Beta, for 6.065 in. Diameter Pipe, After Ref. [5].
0.6 T,
| 1 -1
1
-+ — 0.590 ^J
: i
; i
V
0.SB6 -» 1 "*•• —. — — -- — _
c !l • ~ ~~ -- _. ^ 9 >
a -. —'* L- --. -3 ̂ — -- — TT -. ~* • —
0.597 £ -t — — ——
0.S96 — -
1 0.5« ■ — 1 ■ | 1
B«-0.32S
- - -SeU=0.3133
6000000
Reynolds Number, RD
Figure B2(d). Flow Coefficient, K, as a Function of Pipe Reynolds Number and Diameter Ratio, Beta, for 6.065 in. Diameter Pipe, After Ref. [5].
46
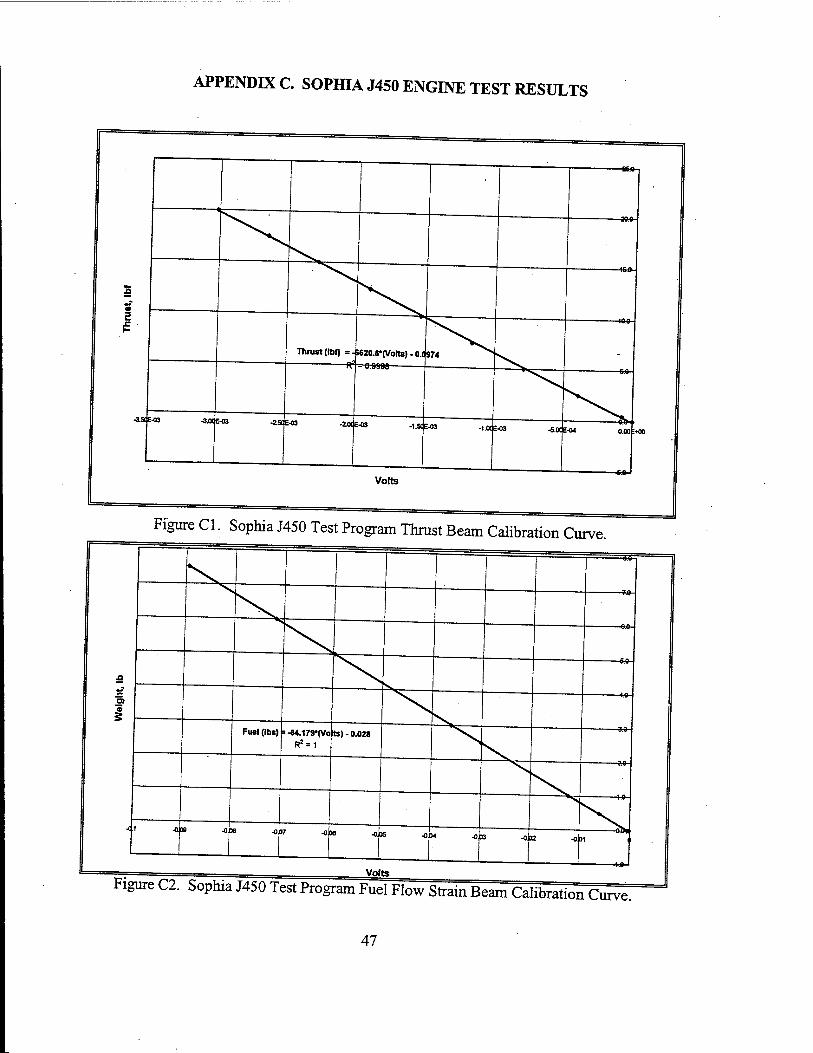
APPENDIX C. SOPHIA J450 ENGINE TEST RESULTS
eg
s
-3-S E-03 -3.« E4B -2.5t E-03
Thrust (Ibf) = £
->620. 8*(Votts) - 0.q974 ; 0.9998
Volts
1XE-C3 .L0CE-03 -5.K E-04 ftOO
Figure Cl. Sophia J450 Test Program Thrust Beam Calibration Curve.
Figure C2. Sophia J450 Test Program Fuel Flow Strain Beam Calibration Curve
47

> < fi
» 319 fi
u i. u io - o 5"
p to si so
0.279016762 0.276760578 0.271545526 0.285967021 0.280201001
"8 S" 3 r 5- 2 Ja la SJ
2 as «9 OS
2 5"
» n n
5" 5" 3
p io en
0.254323641 0.253293299 0.250895523 0.257471736 0.254862786
Mass Flow
(Ibni/sec)
p to en st
0.256931126 0.25589022 0.25346786 0.260111497 0.257475798
Mass Flow
(Ref.)
(Ibni/sec)
P3 H 13 93 D o 8S as as H s s n
c er • *
rs Ö orq «
JC as »I s«^
•si
ICs [ON M IN) to No las ■u ■u IsO
to 00 00 to
1
§: S3
7 SO 00
C5S S £ £ o H s s - « »TJ c er
is n £ • ate as ■«3 * "rr
> » «■
»^ A. Ul to — ^ fro o <»
•*■
2 o o o o
= 3 er
as
o to
281426756 271737846 273010592 .27427344
"1 si en "** "B
-1
C 3
**■
as re o o o o n to to to to rs 2
o LA LA LA LA as tO — — LA
SS 3 to tO OS — LA en si so O X» c ui si LA oo os
*■ SO LA O o, e as O -fc. si Ä. ~ * ■U SO J^ oo n
2 65 o. o o o
to to to to o LA LA LA LA
A A W si B '«I to Os O A. SO <C ST
SB « tn •— tO Ul •— en - A w o
00 SO — sj — oo si o oo to to oo
P*» . ....! w
C\ ICs ^~ |»— SO ICs ■u 00 Cs
Lrt sj w 00
£»
©
H (=3 05
50 O O
> to H S
LA £. Ul to — *s s m
s as
SO SO SO « so „ s. so
Ul
OO Os to 00
00 00
o SO
00 Ul to o
.75369 840646
a 5
31
S LA SO ^
•=1 s o o o © ^ «i
o o o o o e o o ui
o ui
o U>
o Ul O ! Ul i I
n » -u si LA LA j *1 as ST) Ul Os to ' O Os to OS O n ro to A. SO
w
n as _ - — O to si Os
u> Ul to sr n ;- SO
o Os
00 si 1 c CO
Ul Ul O si ! ■*1 as o X. si
si Ul LA J Os 2 O
00 »—• to so es 1 si OS to ■1 s sj so to
> < a
(FQ
J^ ui to —
O as ** -3 e
H ■J e K
as
&
e g, "=J e
»
»
ä7 «-^ S"
>* In en
9.5354 9.5917567
9.51882 9.5639097
I i
p o o Ul en
0.0034714 0.0034861 0.003514
Fuel Flow
(Ibni/sec)
U)
en
1.302890012 1.318421401 1.322707595
Sr
M 5
Table Cl. Sophia J450 Test Program Results for Runs 1 and 2 on March 24, 1998.
48
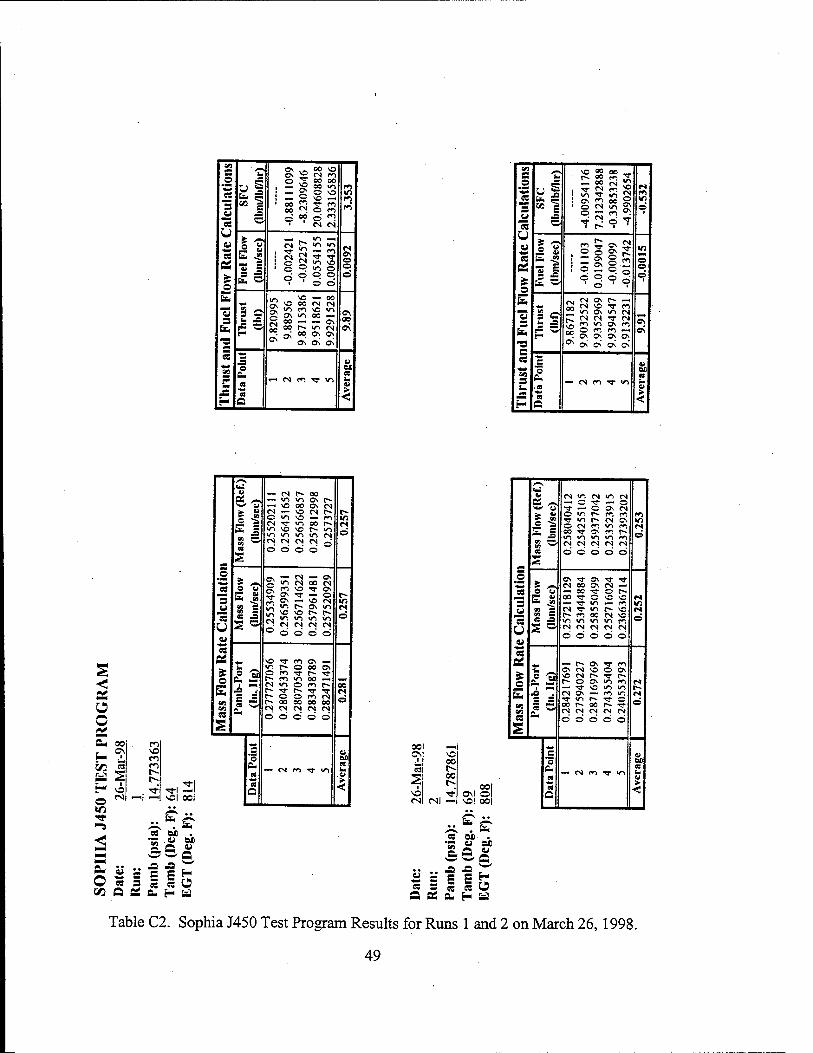
5 — "3 u 'S u s es
o Is.
3 fa
es
3 mm
«3
fa. s .a
-0.8
8111
099
-8.2
3096
46
20.0
4608
828
2.33
3165
836
f»5
Fuel
Flo
w
(lbn
i/scc
)
-0.0
0242
1 -0
.022
57
0.05
5415
5 0.
0064
351
rs ON © © ö
s ©
H 9.82
0995
9.
8895
6 9.
8715
386
9.95
1862
1 9.
9291
528
so
5 o
« ** « a
*■» CS m rr vo
u ex a
3
»9 S _o
3
S u OS
es
o Es.
"3 fa "S3 e es
4
-4.0
0954
176
7.21
2342
888
-0.3
5853
238
-4.9
9026
54
rs en in o
Fuel F
low
(l
bni/s
ec)
-0.0
1103
0.
0199
047
-0.0
0099
-0
.013
742
o o Ö
2 S
9.86
7182
9.
9032
522
9.93
5296
9 9.
9394
547
9.91
3223
1
ON
0\
Dat
a Po
int
— es en Tt <n
a ox 00
<
t/5
O
ao m Cs vo
m en en 2 NO ■*
CM ~*t -M
a. O xn
sol ool
^ . fa CS M . •= . « M
.. -a ä ^ e s £ H 3 s I O
CS B. H fa
/■^
«M*
£* «M es r~ oo
v> v-i ON r» NO 00 ON CM
II E s CS ~- NO CNI r- f» o «n NO en w CS rr v"> 00 r» CS w-i NO NO r» u-i o U-N w-i w-i rNi cs CNI CM ©
OS o o o o
s * ,-. ON
o ON T en <n
CS ©'
in CS CS 00
ON rs
CS o u en NO ^ ON
S a 03 A
ON T © r~ 3 ON — NO (N m
<n r- ON •ri rs
"3 NO NO V) o
u >: ^ CS cs CN) CS
o o o © eu CS
es ^ NO T en ON M s w-> r~ o 00 ON
(2 if o en ■q- r» ■f
3 p~ en «n 00 > *m <N V"l o en p» as
fa .3 r- TT r~ T ■rr rs a f
B.
f- O o m CS o r» DO 00 00 00
2 CM CS CNI CS CS cs
M o O o © ©
o o ex
SL, 03 rM en
> OS
c <
30 —«i ON NO
CT 00 IN
2 00
vo Tt CS CNI —
001
NO! OOI
fa -^N
M. . fa CS M. . •SUM
l£cu
* = I S Ü a OS a. H fa
r— 1 i «M 1 i £
es Nn fN Nn es 1 i —* o TT •— © i u f © ON cs
e FT;
e> © «n r~ en en m ■s TT U"N r^ es ON Ul
© rNl en vn en rs 00 TT r> en r- o VN w-i >r\ ^ CS CS <N CS cs © © © o ©
e «£
3 S
ON TT ON T "3- .^ CNI 00 ON CS SS O u 00 rr © r-
u, 04 00 TT o NO NO (S 3 "" TT w-t en \n u V) cs V in p- NO rs
r~ en 00 CM NO o cs w-i »n NO WN en U S O es cs cs cs es
© © © © © w cs
OS ^ _M p~ ON TT en
3
ON es NO © ON
o yw NO es l~ ^ r» t> © ON vn en (S
■fl- NO v\ r~ fa ^ CM ON en \n rs
T «-1 r^ TT o © OS
C 00 r~ 00 p- •rr
cn ^™* CS cs cs CS cs es 2
© © © © ©
^ 5 9 ox & w- es h* es •^ >• es
0 <
Table C2. Sophia J450 Test Program Results for Runs 1 and 2 on March 26,1998.
49

50

APPENDIX D. SOPHIA J450 TEST PROGRAM CHECKLISTS
SYSTEM CONFIGURATION CHECKLIST
1. Ensure that the test rig is configured in accordance with Figures 7 and 8 and that all devices are properly energized.
2. The fuel pump power supply should be ON with the timer on ZERO and the control knob turned fully CCW.
3. The fuel pump should be primed and the fuel supply hose should be clamped just ahead of the fuel pump.
4. Zero the thrust beam by connecting the CHANNEL 5 output of the signal conditioner to the DVM front panel. Once properly connected, adjust the ZERO KNOB accordingly until the DVM reads 0 mV. Once zeroed, restore the signal conditioner and DVM to their initial configuration.
5. Calibrate the fuel flow beam in the following manner:
5.1. Connect the strain gages (1 and 2) in a half Wheatstone bridge configuration as shown on the P-3500 cover panel.
5.2. Set the bridge push button to proper, Vz, position.
5.3. Depress AMP ZERO and adjust thumbwheel control to read ±0000.
5.4. Depress GAGE FACTOR and set range to 1.7-2.5.
5.4. Adjust GAGE FACTOR knob to 2.08 and lock the knob.
5.5. Depress RUN and set the BALANCE Control for a reading of ±0000. Lock the knob.
5.6. With a DVM connected to the P-3500 output, adjust the OUTPUT thumbwheel until the DVM reads 0 mV.
6. Open the Nitrogen bottle valve and adjust the pressure reducer at the bottle so that it reads 110 psi and adjust the pressure reducer at the rear of the CALSYS 2000 so that it reads 90 psi.
7. Set the CALSYS 2000 pressure range on the front panel so that the high, middle, and low ranges on CALMOD 1 are at 20,10 and 0 in. Hg (or close to it), respectively.
51

DATA ACQUISITION SETUP CHECKLIST
1. Turn on the power for the HP9000 computer system.
2. The first screen is the HP9000 Series 300 Computer Data Acquisition/Reduction System introduction.
3. Select F7, set the current time and date. The format is HH:MM:SS for the time and 23 Jan 1992 for the date.
4. Select F3, Old HP6944A Directory.
5. Select Fl,ZOC-14 Module Menu.
6. Select F4, Read CALSYS 2000 Calibration Pressures.
7. Select CALMOD 1 for scan.
8. Select 0, for CRT display.
9. If the high, middle, and low pressures displayed are correct, then select F2 to continue. If the calibration pressures are not correct, then select F2 to continue and repeat steps 6-8, until the correct pressures are displayed.
10. Select Fl, Scan 1-3 ZOC-14 Modules (32 ports each). The system will now load the default program "SCAN_ZOC-08".
11. Once "SCAN_ZOC-08" introduction screen is displayed, select the "STOP" key.
12. Select F5, LOAD and type "MICROJET".
13. Once "MICROJET" is loaded, select F3, RUN.
14. Once "MICROJET" introduction screen is displayed, select F3 for system setup.
15. Select 0 for hard drive ":,700" storage.
16. Select 1000 Hz for sampling rate.
17. Select 10 for samples per port.
18. Select 1 ZOC connected to Multi-programmer.
19. Select 5 for the number of desired runs. 52

20. Select 10 for the time interval (in seconds) between data runs.
21. Select 1, for CALMOD set for ZOC #1.
22. Select F4 to begin data acquisition.
ENGINE STARTUP AND OPERATION CHECKLIST
1. Connect the air-trigger to the J450. Ensure that the air compressor will provide at least 140 psi.
2. Ensure that the spark plug is wired correctly. The thick cable should be connected to the spark plug and the thin grounding cable should be connected to any bright metallic object on the engine.
3. The engine should now be ready to start.
4. Unclamp the fuel line.
5. Grasp the air supply handgrip valve firmly, the sound of rotation gradually becomes higher as the rotor rapidly increases in speed.
6. The rotation sound level should reach a very high pitch. If the sound level is not high or if you hear an abnormal sound, stop the engine.
7. Once the rotor sound level has peaked, push the red button on the igniter.
8. Turn on the timer to the fuel pump power supply and open the clamp on fuel supply line ahead of the pump.
9. Adjust the fuel pressure to 1.0 kg/cm2 (14 psi).
10. After combustion starts, continue the air supply from the compressor until the engine compressor pressure is over 0.3 bar (4.2 psi) on the compressor pressure gage, then release the red button of the igniter, and stop supplying the starting air. Now adjust the throttle/fuel pump pressure to 0.4 kg/cm2 (5.5 psi). The engine compressor pressure should be about 0.3 bar (4.2 psi).
NOTE: If engine does not start within 10 seconds, turn off fuel pump and cease air and spark. Allow sufficient time for the oil and fuel to drain from the engine through the combustor drain located at the bottom of the engine.
53
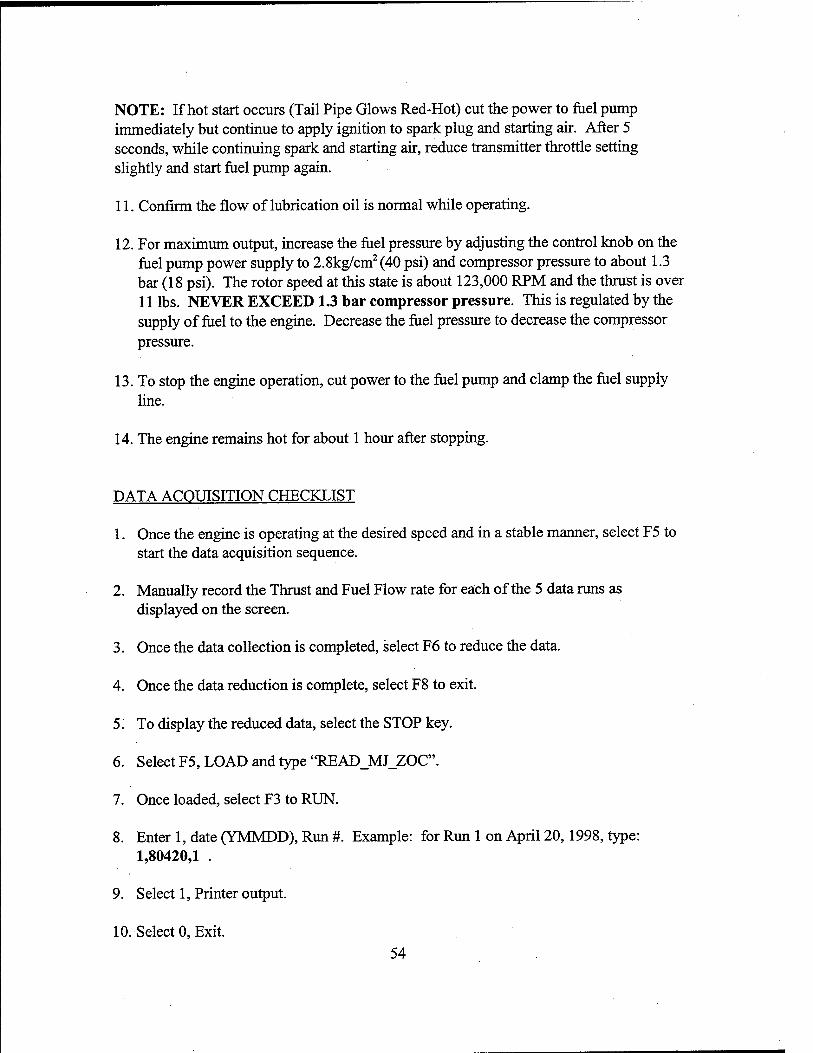
NOTE: If hot start occurs (Tail Pipe Glows Red-Hot) cut the power to fuel pump immediately but continue to apply ignition to spark plug and starting air. After 5 seconds, while continuing spark and starting air, reduce transmitter throttle setting slightly and start fuel pump again.
11. Confirm the flow of lubrication oil is normal while operating.
12. For maximum output, increase the fuel pressure by adjusting the control knob on the fuel pump power supply to 2.8kg/cm2 (40 psi) and compressor pressure to about 1.3 bar (18 psi). The rotor speed at this state is about 123,000 RPM and the thrust is over 11 lbs. NEVER EXCEED 1.3 bar compressor pressure. This is regulated by the supply of fuel to the engine. Decrease the fuel pressure to decrease the compressor pressure.
13. To stop the engine operation, cut power to the fuel pump and clamp the fuel supply line.
14. The engine remains hot for about 1 hour after stopping.
DATA ACQUISITION CHECKLIST
1. Once the engine is operating at the desired speed and in a stable manner, select F5 to start the data acquisition sequence.
2. Manually record the Thrust and Fuel Flow rate for each of the 5 data runs as displayed on the screen.
3. Once the data collection is completed, select F6 to reduce the data.
4. Once the data reduction is complete, select F8 to exit.
5. To display the reduced data, select the STOP key.
6. Select F5, LOAD and type "READ_MJ_ZOC".
7. Once loaded, select F3 to RUN.
8. Enter 1, date (YMMDD), Run #. Example: for Run 1 on April 20,1998, type: 1,80420,1 .
9. Select 1, Printer output.
10. Select 0, Exit.
54
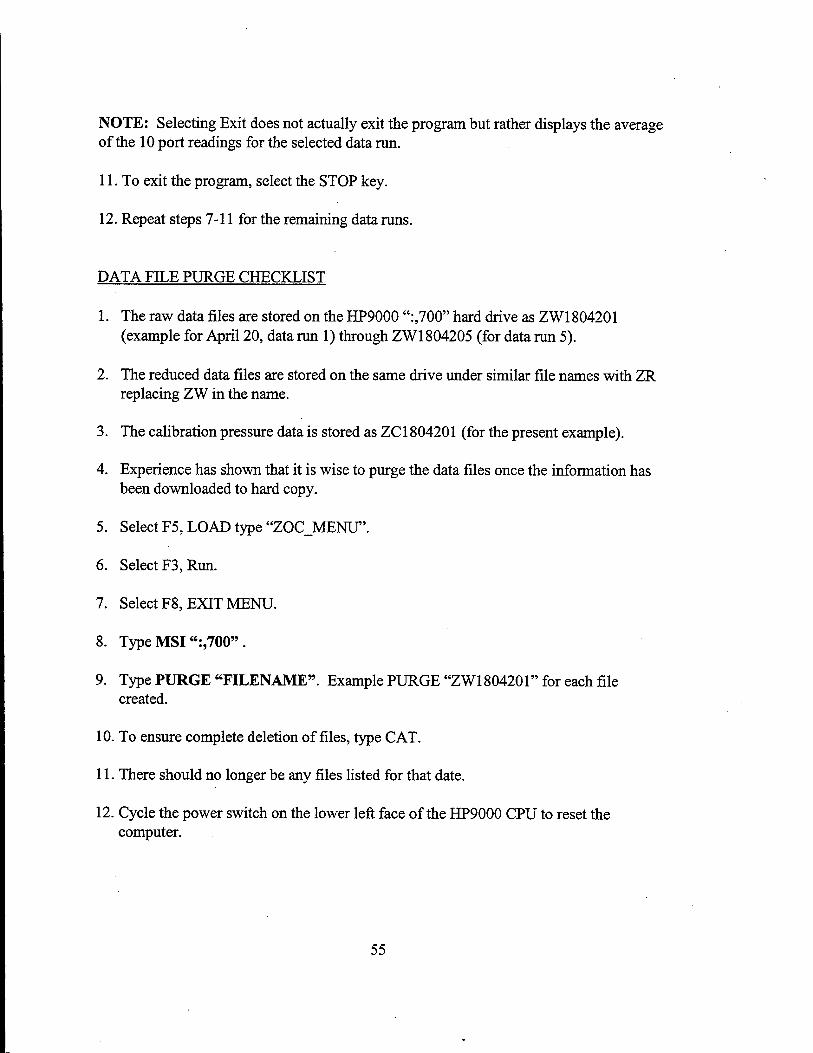
NOTE: Selecting Exit does not actually exit the program but rather displays the average of the 10 port readings for the selected data run.
11. To exit the program, select the STOP key.
12. Repeat steps 7-11 for the remaining data runs.
DATA FILE PURGE CHECKLIST
1. The raw data files are stored on the HP9000 ":,700" hard drive as ZW1804201 (example for April 20, data run 1) through ZW1804205 (for data run 5).
2. The reduced data files are stored on the same drive under similar file names with ZR replacing ZW in the name.
3. The calibration pressure data is stored as ZC1804201 (for the present example).
4. Experience has shown that it is wise to purge the data files once the information has been downloaded to hard copy.
5. Select F5, LOAD type "ZOC_MENU".
6. Select F3, Run.
7. Select F8, EXIT MENU.
8. Type MSI ":,700" .
9. Type PURGE "FILENAME". Example PURGE "ZW1804201" for each file created.
10. To ensure complete deletion of files, type CAT.
11. There should no longer be any files listed for that date.
12. Cycle the power switch on the lower left face of the HP9000 CPU to reset the computer.
55

56

APPENDIX E. PERFORMANCE PREDICTION
2
1.8
t.6
0 M O tc 2 12 3 »
0. 1 t. O B « e 0.8 a E 0 U 0.«
'—■ * ** Ifa. —•— 5O0O0RPM
-•-75000 RPM
-*—100000 RPM —H-12SO00RPM
^K*«jJC
-
S0Ky-M43a?*112*£ R*»0.995i
0.5591« » 1.1122 ^>>*>v
7SK:y--2a»21x,»0.0S6S(1
R1" 0.989 ♦ 0.0027x»1.2412
0.4
100K: y- -63.9S*1 ♦ 11438» R2-0.9823
-0.S19X* 1.4501
02
12SlCy«-111J8«,»38.89a R1» 0.971
["-4.246Bx-H.8191 1
o. . 0 "OS 0.1 0.15 02 0.25
Referred Mass Flow (Ibm/sec)
Figure El. Garrett T2 Comp ressor Pressure Ratio Map (Trimmed and Fitted).
1
0.8 >. U c o ü
£ •" 0.6 o
Q. s C o »
0.4
02
o.
'-*«-"* —•—50000 RPM
-•-75000 RPM
-*-100000RPM
-»«-125000 RPM
so C y - -839.38X1 ♦ 47 JBTx* ♦ 2 644SX» 0.528
7
R"» 0.6782
ilt y --251.77X1 ♦ 27.6871C2 ♦ RJ = 0.6828
.26dl x. 0.5716
OOK y » -110.93X* ♦ 22.169K1
R*» 0.7613
2SK: y «-76.9oaxJ ♦ 27.207X2
R2» 0.9784
0.08871* 0.6262
2^704xt 17067
0 0.05 0.1 0.1S 02 0.2
Referred Mass Row 5
Figure E2. Garrett T2 Compressor Efficiency Map (Trimmed and Fitted).
57
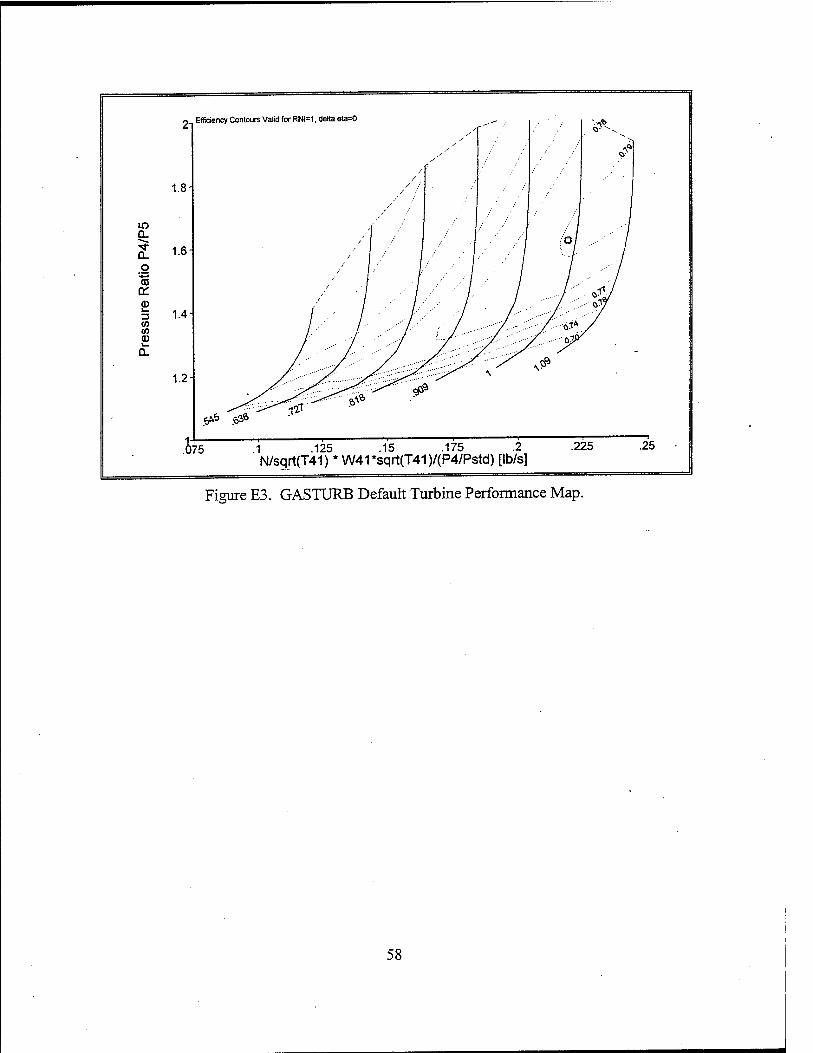
i Efficiency Contours Valid for RNI=1, delta eta=0
a.
ec
zs CO (0 0)
1.8
1.6
1.4
1.2-
fff> $&
!)75 .1 -125 .15 .175 .2 N/sqrt(T41) * W41*sqrt(T41)/(P4/Pstd) [Ib/s]
.225
Figure E3. GASTTJRB Default Turbine Performance Map.
.25
58
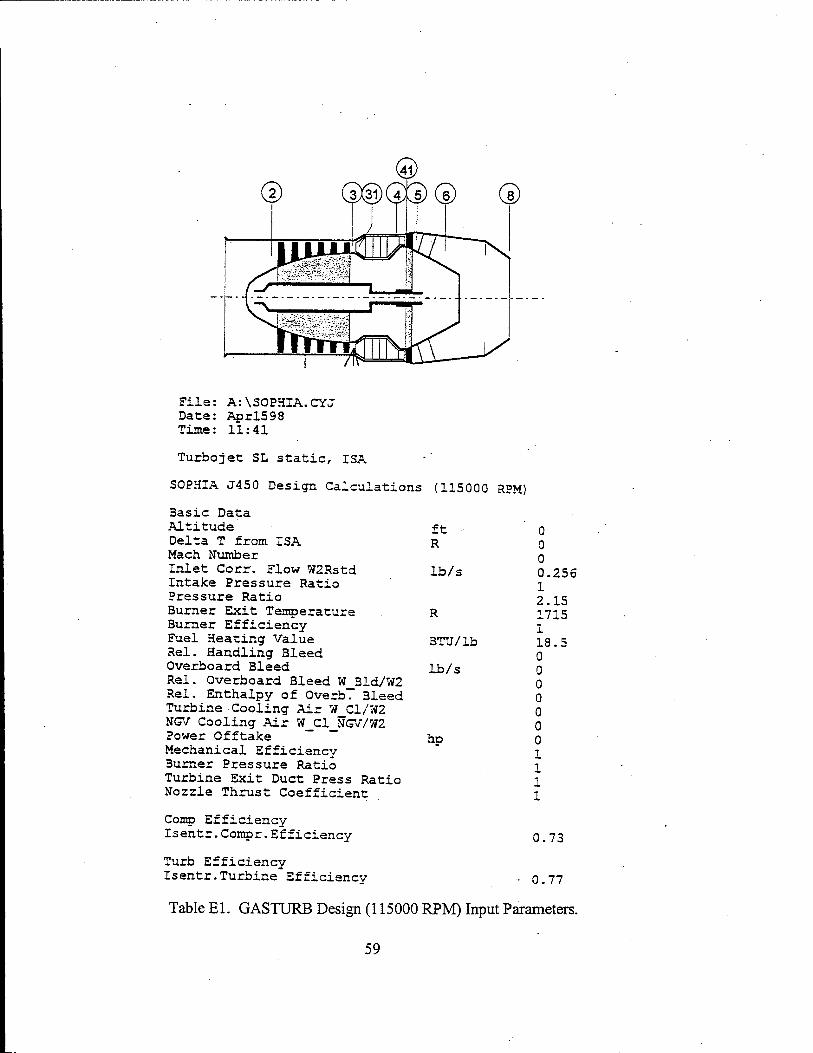
File: A:\SOPHIA.CYJ Date: Aprl598 Time: 11:41
Turbojet SL static, ISA
SOPHIA J450 Design Calculations (115000 RPM)
3asic Data Altitude Delta T from ISA Mach Number Inlet Corr. Flow W2Rstd Intake Pressure Ratio Pressure Ratio Burner Exit Temperature Burner Efficiency Fuel Heating Value Rel. Handling Bleed Overboard Bleed Rel. Overboard Bleed W_31d/W2 Rel. Enthalpy of Overb. 31eed Turbine Cooling Air W_Ci/W2 NGV Cooling Air W_C1_NGV/W2 Power Offtake Mechanical Efficiency 3urner Pressure Ratio Turbine Exit Duct Press Ratio Nozzle Thrust Coefficient
Comp Efficiency Isentr.Compr.Efficiency
Turb Efficiency Isentr.Turbine Efficiencv
ft - R
Ib/s
R
BTU/lb
Ib/s
hD
0 0 0 0.256 1 2.15 1715 1 18.5 0 0 0 0 0 0 0 1 1 1 1
0.73
0.77
Table El. GASTURB Design (115000 RPM) Input Parameters.
59
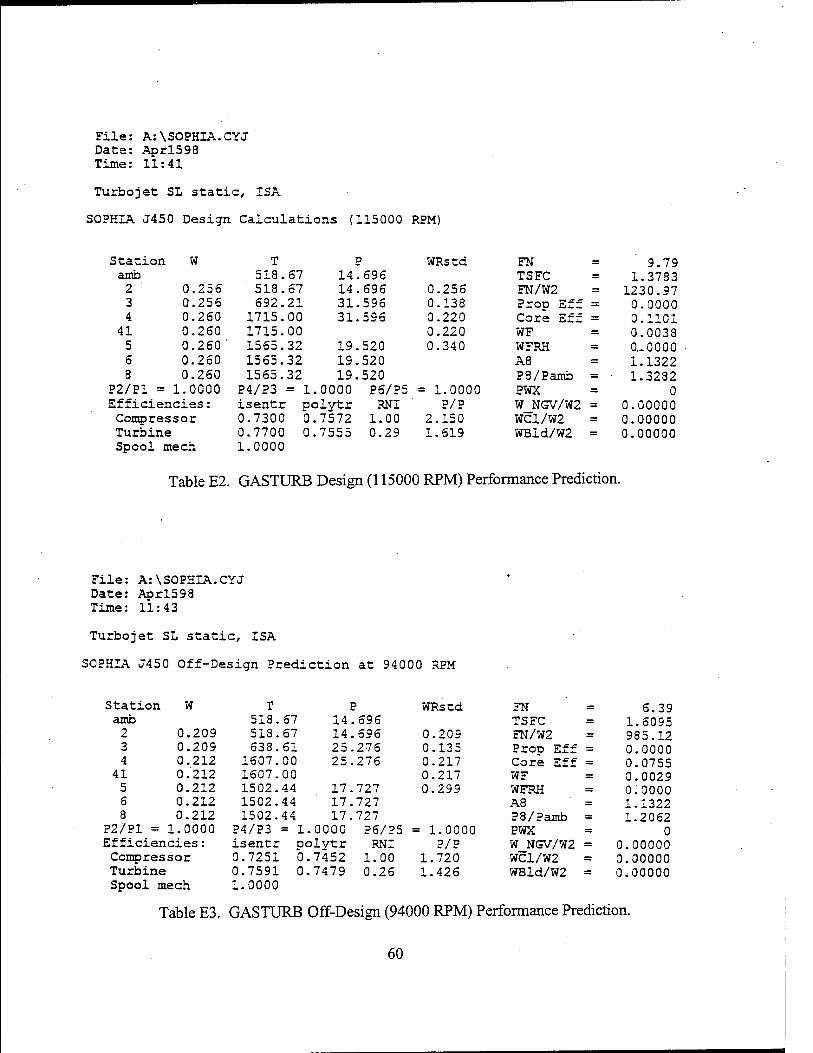
File: A:\SOPHIA.CYJ Date: Aprl598 Time: 11:41
Turbojet SL static, ISA
SOPHIA J450 Design Calculations (115000 RPM)
Station W T p WRstd FN = 9.79 amb 518.67 14.696 TSFC = 1.3783 2 0.256 518.67 14.696 0.256 FN/W2 = 1230.97 3 0.256 692.21 31.596 0.138 Prop Eff = 0.0000 4 0.260 1715.00 31.596 0.220 Core Eff = 0.1101
41 0.260 1715.00 0.220 WF = 0.0038 5 0.260 ' 1565.32 19.520 0.340 WFRH = 0..0000 6 0.260 1565.32 19.520 A8 = i.1322 8 0.260 1565.32 19.520 P8/Pamb = • 1.3232
P2/P1 = 1.0000 P4/P3 = 1 .0000 P6/P5 = 1.0000 PWX = 0 Efficiencies: isentr polytr RNI P/P W NGV/W2 = 0.00000 Compressor 0.7300 0 7572 1.00 2.150 WC1/W2 = 0.00000 Turbine 0.7700 0 7555 0.29 1.619 WBld/W2 = 0.00000 Spool mech 1.0000
Table E2. GASTURB Design (115000 RPM) Performance Prediction.
File: A:\SOPHIA.CYJ Date: Aprl598 Time: 11:43
Turbojet SL static, ISA
SOPHIA J450 Off-Design Prediction at 94000 RPM
Station W T P WRscd FN = 6.39 amb 518.67 14.696 TSFC = 1.5095 2 0.209 513.67 14.696 0.209 FN/W2 = 985.12 3 0.209 638.61 25.276 0.135 Prop Eff = 0.0000 4 0.212 1607.00 25.276 0.217 Core Eff = 0.0755
41 0.212 1607.00 0.217 WF = 0.0029 5 0.212 1502.44 17.727 0.299 WFRH = 0.0000 6 0.212 1502.44 17.727 A8 = 1.1322 8 0.212 1502.44 17.727 P8/Pamb = 1.2062
P2/P1 = 1.0000 P4/P3 = 1 .0000 P6/P5 = 1.0000 PWX = 0 Efficiencies: isentr polytr RNI P/P W NGV/W2 = 0.00000 Compres sor 0.7251 0 7452 1.00 1.720 WC1/W2 = 0.00000 Turbine 0.7591 0. 7479 0.26 1.426 WBld/W2 = 0.00000 Spool mech 1.0000
Table E3. GASTURB Off-Design (94000 RPM) Performance Prediction.
60

File: A:\SOPHIA.CYJ Date: Aprl598 Time: 11:44
Turbojet SL static, ISA
SOPHIA J450 Off-Design Prediction at 105000 RPM
Station W T p WRstd amb 518.67 14.696 2 0.233 518.67 14.696 0.233 3 0.233 663.81 28.228 0.137 4 0.236 1638.39 28.228 0.219
41 0.236 1638.39 0.219 5 . 0.236 1512.13 18.518 0.320 6 0.236 1512.13 18.518 8 0.236 1512.13 18.518
P2/P1 = 1.0000 P4/P3 = 1 .0000 P6/P5 = 1.0000 Efficiencies: isentr polytr RNI P/P Compressor 0.7326 0 7558 1.00 1.921 Turbine 0.7648 0 7518 0.28 1.524 Spool mech 1.0000
FN = 7.92 TSFC = 1.4642 FN/W2 = 1094.49 Prop Eff = 0.0000 Core Eff = 0-.0922 WF = 0.0032 WFRH = • 0.0000 A8. = 1.1322 P8/?amb = 1.2601 PWX = 0 W NGV/W2 = 0.00000 WC1/W2 = 0.00000 WBld/W2 = 0.00000
Table E4. GASTURB Off-Design (105000 RPM) Performance Prediction.
File: A:\SOPHIA.CYJ Date: Aorl598 Time: 11:45
Turbo-jet SL static," ISA
SOPHIA J450 Off-Design Prediction at 123000 RPM
Station W T p WRstd FN = 11.35 amb 513.67 14.596 TSFC — 1.3514 2 0.271 518.67 14.596 0.271 FN/W2 — 1349.53 3 0.271 713.63 34.200 0.136 Prop Eff — 0.0000 4 0.275 1802.63 34.200 0.220 Core Eff = 0.1230 41 0.275 ' 1802.63 0.220 WF — 0.0043 5 0.275 1636.22 20.387 0.3-52 WFRH = 0.0000 6 0.275 • 1636.22 20.387 A8 — 1.1322 8 0.275 1636.22 20.387 ?8/Pamb — 1.3873 P2/P1 = 1.0000 P4/P3 = 1 .0000 P6/P5 = 1.0000 PWX — 0 Efficiencies: isentr polytr RNI P/P W NGV/W2 —» 0.00000 Compressor 0.7248 0 7551 1.00 2.327 WC1/W2 = 0.00000 Turbine 0.7689 0 7533 0.29 1.678 WBld/W2 — 0.00000 Spool mech 1.0000
Table E5. GASTURB Off-Design (123000 RPM) Performance Prediction.
61

P3 H "B "8 55
00<= " •2 ° » * OQ &S
> < -r
IS
LA .b 1*1 tO —
9 K
e er
p (A U)
0.157233768 0.151487332 0.148124743 0.157396204 0.151031792
"3
s 5 Mrt "" "3 IS o
S as »9
2 S" $ SB »
» TO"
ST S* s
©
NO O
0.192963468 0.189404522 0.187290604 0.193063116 0.189119527
Mass Flow
(lbni/sec)
©
OB NO
0.191926562 0.188386741 0.186284182 0.192025675 0.188103277
s MK *»
O" M a 2 C o V) <
to j© IO ON
ON
o o o 73 13
oo
LA .b U) tO —
© © o © © to to to to to — to © to to ON Ul NO ON to NO ON NO Xt 00 — M- LA — LA oo «O © Ul OS NO .b Ul © ON © u> oo .b to Av OO 00 LA ON
© © © © to io to to
., u> to U> to sr LA u — NO 2 A ->1N0 2? Ul NO ~1 LA g LA — ~J O 12 NO NO U> -J ;~3 ~j .b o oo "^ LA ON — 00
© © to to to u> LA Ul A. NO to .u NO LA LA LA ON ON ON -O.
© © © to to to MUM •— © 00
-J •— NO NO © LA O © — ■b LA O go «u
a er
^3
P3 H •0 •0 55 % C5 » as TO 3 i
OP
I ate:
oo O r: M«<
n 55 9C TO
I« £ • as BS •S9 * «N
"5 JM.
en H I1-" MM MM MM * ON |VO *> VO f- o
00 ~N
5 73 •«J o 00 v/> 1 I o\ o
o o PS 70 05
z B S3 •53 o S3
2 n B *G S3 B
■ O
n H O z
> < fi
m LA -b Ul IO —
O m m n e
s at
as
a. •S3 s TO
©
» SS
Je
£_■ TO* C, 5" 5*
5.189706 5.1274176 5.1486571 5.1295639 5.1604156
a=ä er -i => 1
o © o w ON
0.0034675 0.001723 0.002537 0.0027937
Fuel Flow
(lbni/sec)
ÖB W OS
2.434559572 1.204763634 1.780530317 1.948936039
a er
1 »
> a H <J "!
LA X> Ul to — -9 S IB «S 5" 88
3 ~1 -J -O
~] >J MM
w en
© ON UJ NO ON
Ul NO ON to OO ON
Ul NO LA © ©
00
Ul u> to — © LA ON ON to — Xw 00
a tr
s
o O
Ö o © o to NO
u>
©
©
o © y <
© o u»
© Ul LA -O O
o u> LA -0
© ■ u> ;
S ' 1- n n
3 o re 00 NO LA ^^ n
So _. »_ tm^ fc— C5
-O MN. ^J LA n" LA X. to . OO ~1 © OO ■ 5. V) JJ^
ON Ul oo -o "*1 as ^J Ox ~J Ul j er O Ul NO MM 00 LA 2 ___.! ON Ul Xk Ul O I ON ■b 00
I., .b Ul NO v= 1
Table E6(a). Sophia J450 Off-Design Performance for 105000 and 94000 RPM Tests Conducted on April 14,1998.
62
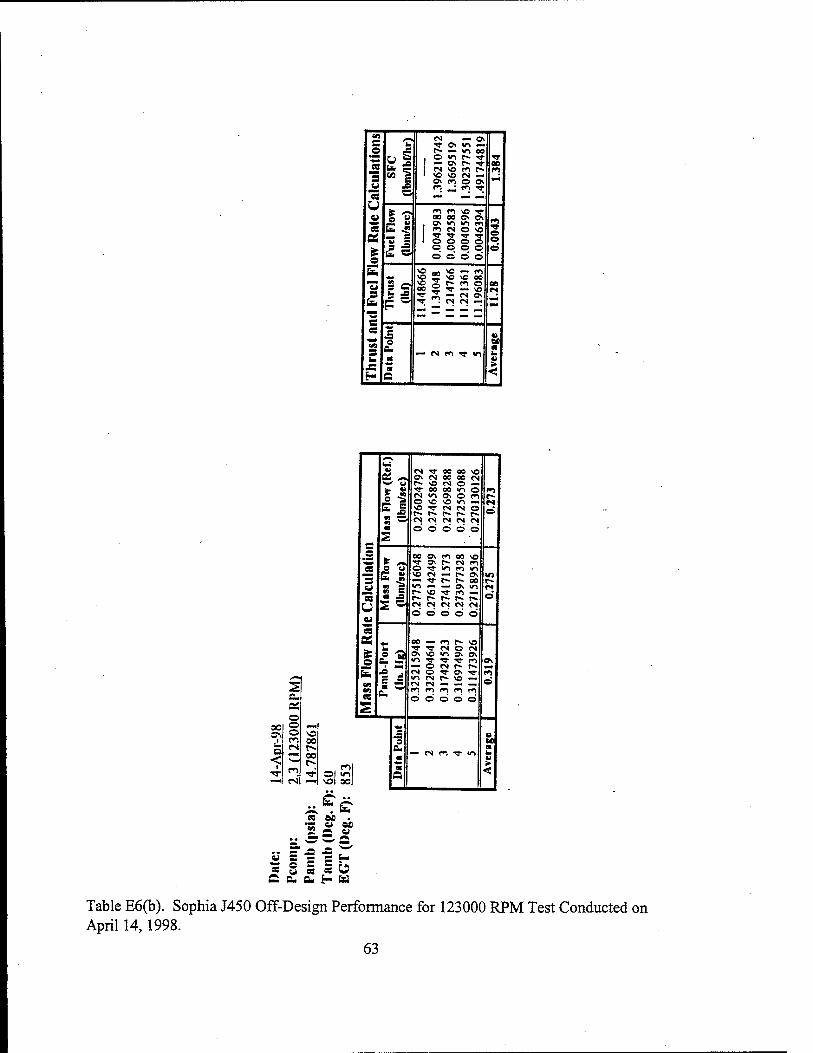
5fl es — o\ rr Ov «r> — o s t> -m oo
Ü © «n r~ ^ TT es ja ! — c\ f- ■«■ 00
Ua 1 es vo m r-» ri 3 ce e e N •>
0\ f*) © Ov c- n _; m v
es U
— — —
e E
1*1 fl vo ^ w u 00 00 Ov Ov f) t> es 1 !"> es O vo ©
© CS "5 i © © o o
© £ c © © © ©
© © ©' o' ©
U. \o
1.34
048
.214
766
.221
361
.196
083
*■ vo
S EE.
IM
P c- ■o ©
vo 00
ee es
es q V «« o at 3 u
■S
1:..
ft. ■ ■ Q
— es e»> ^ v>
5
2 a. ei ©
no © ■IM«
!7v o VO i m 00 a <
es 00
•<r r*> •*■
«■* es "^
^■N 4M
ei « fS TT 00 00 VO Ov N 00 » <v|
■v U r^ vo es © —
E J ^r oo oo in © f»> <s vv ov © ro f- © vo vo \n — IS VO T es CS O © t-* r* r* c-- r* « « (V) (V) M
OB © © © © ©
s o * ^ 00 ov m 00 vo
T Ov t— es m es o u © ^ «r> m m E| VO (N - t» Ov V3 3 — T t- r- oo t-
u-i — — Ov VO r« MO t n- o es r» c— r~ r~ r»> s *~ es es eS eS eS © © © © ©
es OS oo — en r** vo fc L. f f N O N
c2 ^ Ov VO «n Ov Ov o *n ^- ^ ^- r»> ov
— © es r~ r~ IB. ja es © ^ ov ^r rt s s m N MO - © 5 w es rs — — — 2 fi t^i f^i ei **i 1 s| o o © o o
.3 V O ei ft. ei
<• - N n v tn V
© <o a a <
vol ool
es M . •=; e> M
.. £ *■» vv
J3 —« ,
85 e u 5 £ H
MM e» 6- £- Es)
Table E6(b). Sophia J450 Off-Design Performance for 123000 RPM Test Conducted on April 14,1998.
63

64
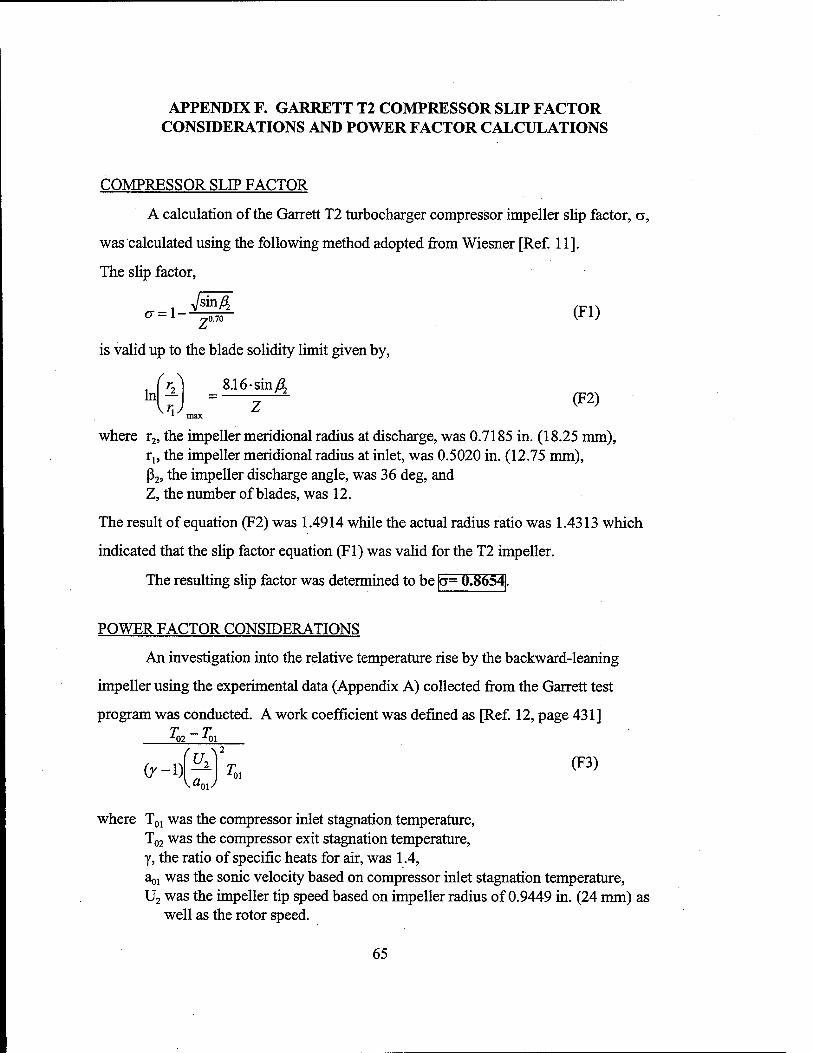
APPENDIX F. GARRETT T2 COMPRESSOR SLIP FACTOR CONSIDERATIONS AND POWER FACTOR CALCULATIONS
COMPRESSOR SLIP FACTOR
A calculation of the Garrett T2 turbocharger compressor impeller slip factor, a,
was calculated using the following method adopted from Wiesner [Ref. 11].
The slip factor,
yom^ ran <y = l- „0.70 (F1)
VsinA Z'
is valid up to the blade solidity limit given by,
\ ln^
1 max
8.16-sin £
where r2, the impeller meridional radius at discharge, was 0.7185 in. (18.25 mm), r„ the impeller meridional radius at inlet, was 0.5020 in. (12.75 mm), ß2, the impeller discharge angle, was 36 deg, and Z, the number of blades, was 12.
The result of equation (F2) was 1.4914 while the actual radius ratio was 1.4313 which
indicated that the slip factor equation (Fl) was valid for the T2 impeller.
The resulting slip factor was determined to be kj= 0.86541.
POWER FACTOR CONSIDERATIONS
An investigation into the relative temperature rise by the backward-leaning
impeller using the experimental data (Appendix A) collected from the Garrett test
program was conducted. A work coefficient was defined as [Ref. 12, page 431]
(F3) (r-i)
T -T
v<w T
where T01 was the compressor inlet stagnation temperature, T02 was the compressor exit stagnation temperature, y, the ratio of specific heats for air, was 1.4, a^ was the sonic velocity based on compressor inlet stagnation temperature, U2 was the impeller tip speed based on impeller radius of 0.9449 in. (24 mm) as
well as the rotor speed.
65

A flow coefficient was defined as [Ref 12, page 431]
w. rl m
U2 2ftr2bp2U:
(F4) 2^2
where m was the measured mass flow rate, r2 was the impeller exit radius 0.9449 in. (24 mm), b was the impeller blade height at exit 0.1969 in. (5 mm), p2 was the density of air at the compressor exit.
The density of air was calculated used the perfect gas relationship by assuming that the
flow velocity at the compressor exit was the same as the tip velocity. This assumption
allowed the determination of the static temperature and pressure at the compressor exit
using the isentropic relationships
T2 = T02\l + ^M2
y-\
Pl = RT2
(F5)
(F6)
(F7)
where P02 was the measured compressor exit stagnation pressure, T02 was the measured compressor exit stagnation temperature, M was the impeller tip Mach number, and R was the gas constant for air, 53.3 ft lbf/lbm deg. R.
Figure Fl illustrates the results of the equations F3 and F4 as they were applied to
the experimental data collected. As shown, an increase in mass flow caused a decrease in
work coefficient. These results were consistent with the Figure 9.6 [Ref. 12, page 431]
for backward-leaning impeller blades.
The compressor pressure ratio can be predicted using equation F8 [Ref. 12, page
432] and equation F9 [Ref. 13, page 93].
nc =
n,
i + 7e(r-i) \ao\J
1 w. rl
un tan/?2
r-\
i+„^ c,r„,
7
(F8)
(F9)
66
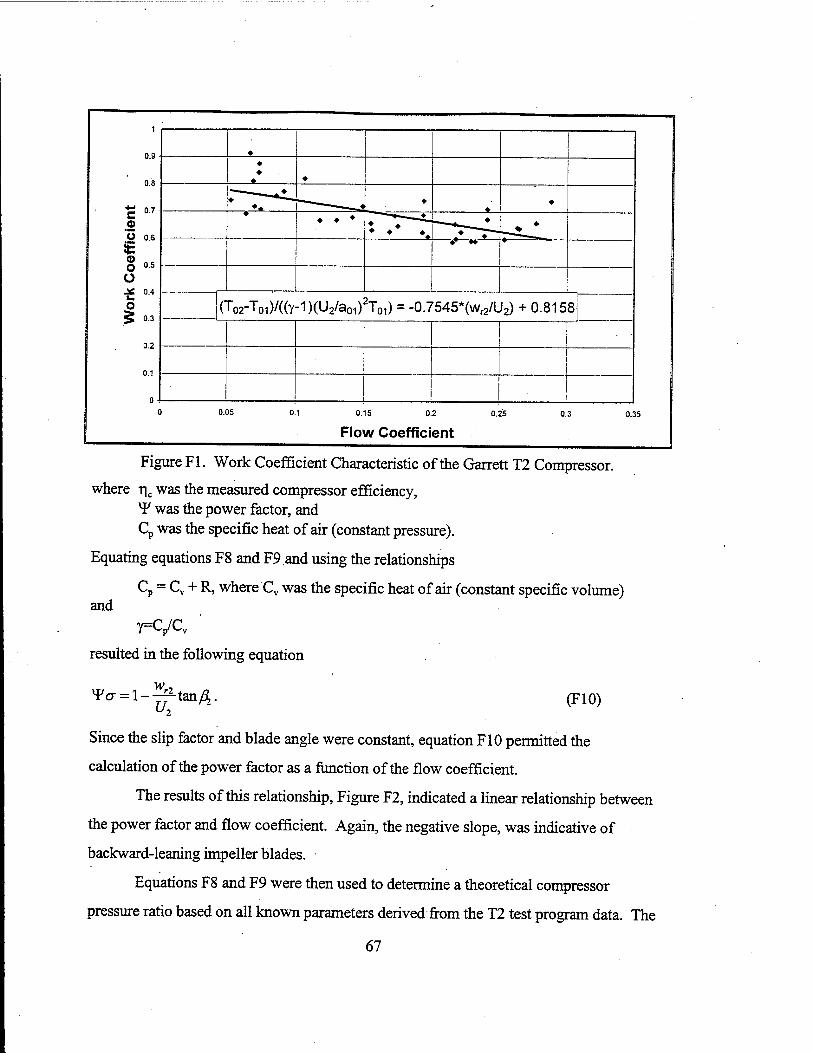
♦
♦ ♦
"K 07 ♦ — * ♦
♦ ♦
c .2 ü 06
♦ ♦ ♦
♦^t ^J^ o « 05
♦* **
ü
o 5 0-3
(Toa-ToO/CCy-IJCUa/ao!)2^^ = -0.7545*(wr2/U2) + 0.8158
0 •
0.15 0.2
Flow Coefficient 0.25 J
Figure Fl. Work Coefficient Characteristic of the Garrett T2 Compressor.
where t|c was the measured compressor efficiency, ¥ was the power factor, and Cp was the specific heat of air (constant pressure).
Equating equations F8 and F9 and using the relationships
Cp = Cv + R, where Cv was the specific heat of air (constant specific volume) and
y=Cp/cv '
resulted in the following equation
w. Tcr = l--^tan£_ (F10)
Since the slip factor and blade angle were constant, equation F10 permitted the
calculation of the power factor as a function of the flow coefficient.
The results of this relationship, Figure F2, indicated a linear relationship between
the power factor and flow coefficient. Again, the negative slope, was indicative of
backward-leaning impeller blades.
Equations F8 and F9 were then used to determine a theoretical compressor
pressure ratio based on all known parameters derived from the T2 test program data. The
67

results, Figures F3, F4, F5, F6, illustrate the experimental compressor pressure ratio
plotted with the theoretical compressor pressure ratios calculated using equation F8 from
Ref. [12], equation F9 from Ref. [13].
1.2
1
o 0.8 o <o ± 0.6 0)
a 0.4
0.2
0 4
V = -0.8401 '(w^/iy + 1.1563
0.05 0.1 0.15 0.2 0.25
Flow Coefficient
0.3 0.35
Figure F2. Garrett T2 Turbocharger Power Factor Plot.
1.2
a 1 DC
I °-8 0) 0)
a. 0.6 o 0) 0) o 0.4
£ 0.2
-►-Experimental -«-Equation F8 -*-Equation F9
I ■
o Ü
0 0.05 0.1 0.15 0.2 0.25 0.3 0.35
Flow Coefficient
Figure F3. Garrett T2 Turbocharger Compressor Pressure Ratio (50,000 RPM).
68

Experimental —- Equation F8 -*- Equation F91
(0 cc 0 i_ 3 (0 (0 a>
1.4
1.2
1
0.8
*5 0.6 o (0 (0 £ Q. E o ü
0.4
0.2
1 i " —u—•
0.05 0.1 0.15 0.2
Flow Coefficient
0.25 0.3
Figure F4. Garrett T2 Turbocharger Compressor Pressure Ratio (75,000 RPM).
a CC 0 u. 3 II) (0 0 v. Q. i_ O (0 (0 0 Q. E o o
1.8
1.6
1.4
1.2
1
0.8
0.6
0.4
0.2
0
-*- Experimental -*- Equation F8 -*- Equation F9 j
II
1 ~~"
0.05 0.1 0.15
Flow Coefficient
0.2 0.25
Figure F5. Garrett T2 Turbocharger Compressor Pressure Ratio (100,000 RPM).
69
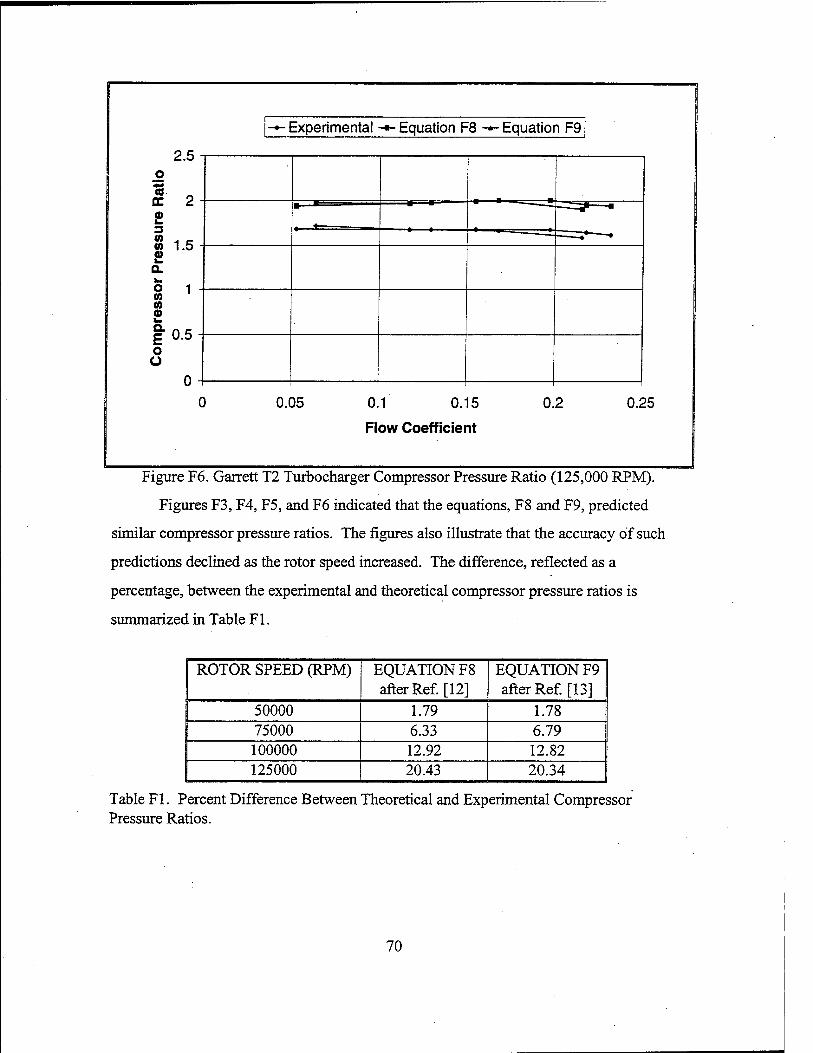
-*- Experimental -■- Equation F8 -*- Equation F9
a. 0) k. 3 (0 (0 o
l_ o 0) (0 0) l_ a £ o a
O -
——-^ 1 K - I .O
1 . I
u.o
0-
0.05 0.1 0.15
Flow Coefficient
0.2 0.25
Figure F6. Garrett T2 Turbocharger Compressor Pressure Ratio (125,000 RPM).
Figures F3, F4, F5, and F6 indicated that the equations, F8 and F9, predicted
similar compressor pressure ratios. The figures also illustrate that the accuracy of such
predictions declined as the rotor speed increased. The difference, reflected as a
percentage, between the experimental and theoretical compressor pressure ratios is
summarized in Table Fl.
ROTOR SPEED (RPM) EQUATION F8 after Ref. [12]
EQUATION F9 after Ref. [13]
50000 1.79 1.78 75000 6.33 6.79 100000 12.92 12.82 125000 20.43 20.34
Table Fl. Percent Difference Between Theoretical and Experimental Compressor Pressure Ratios.
70

LIST OF REFERENCES
1. Department of Defense, Unmanned Aerial Vehicles 1994 Master Plan.
2. Rodgers, C, Turbochargers to Small Gas Turbines?, Paper ASME 97-GT-200, Presented at the International Gas Turbine and Aeroengine Congress & Exhibition, Orlando, Florida, June 2-5,1997.
3. Lobik, D. P., Unmanned Aerial Vehicles: A Study of Gas Turbine Application, M.S.AE. Thesis, Naval Postgraduate School, Monterey, California, September, 1995.
4. Grossman, B. L., Testing and Analysis of a Transonic Axial Compressor, M.S.A.E. Thesis, Naval Postgraduate School, Monterey, California, September, 1997.
5. American Society of Mechanical Engineers, ASME Power Test Codes Supplement on Instruments and Apparatus, Part 5 Measurement and Quantity of Materials, Chapter 4, Flow Measurement by Means of Thin Plate Orifices, Flow Nozzles and Venturi Tubes, American Society of Mechanical Engineers, 1959.
6. JPX Jet Engines, TURBOREC T 240 Starting Procedures/Installation/Setting Up/Electronic Regulation/Pre-flight Instructions/Technical Specification Manual, February, 1993.
7. Sophia USA, Sophia J450 Turbine Engine Instruction Manual and Owner's Guide.
8. Wendland, R. A., Upgrade and Extension of the Data Acquisition System for Propulsion and Gas Dynamics Laboratories, M.S.A.E. Thesis, Naval Postgraduate School, Monterey, California, June, 1992.
9. Kurzke, J., GASTURB 7.0 for Windows, A Program to Calculate Design and Off- Design Performance of Gas Turbines, 1996.
10. Kurzke, J., Preparing Turbomachinery Maps for Performance Computer Programs, 1993.
11. Wiesner, F. J., A Review of Slip Factors for Centrifugal Impellers, Transaction of the ASME, October, 1967.
12. Hill, P. G., and Peterson, C. R., The Mechanics and Thermodynamics of Propulsion, Addison-Wesley Publishing Company, Inc., June 1992.
71
13. Cohen, H., Rodgers, G. F. C, Saravanamuttoo, H. I. H., Gas Turbine Theory, Second , Edition, Halsted Press, A John Wiley & Sons Company, 1973.
72
BIBLIOGRAPHY
Cheremisinoff, N. P., and Cheremisinoff, P. N., Compressors and Fans, Prentice Hall, Inc., 1992.
Dixon, S. L., Fluid Mechanics, Thermodynamics ofTurbomachinery, Pergamon Press, 1989.
Ferguson, T. B., The Centrifugal Compressor Stage, Butterworth & Company, 1963.
Van den Hout, F., and Koullen, J., The Design, Manufacture, and Successful Operation of a Very Small Turbojet Engine, Paper ASME 96-GT-456, Presented at the International Gas Turbine and Aeroengine Congress & Exhibition, Birmingham, United Kingdom, June 10-13,1996.
Wilson, D. G., The Design of High-Efficiency Turbomachinery and Gas Turbines, The Massachusetts Institute of Technology Press, 1984.
73

74
INITIAL DISTRIBUTION LIST
1. Defense Technical Information Center 8725 John J. Kingman Rd., Ste 0944 Ft. Belvoir, Virginia 22060-6218
2. Dudley Knox Library Naval Postgraduate School 411 Dyer Rd. Monterey, California 93943-5101
Chairman Department of Aeronautics and Astronautics Code AA Naval Postgraduate School 699 Dyer Road - Room 137 Monterey, California 93943-5106
4. Professor R. P. Shreeve Department of Aeronautics and Astronautics Code AA/SF Naval Postgraduate School 699 Dyer Road - Room 137 Monterey, California 93943-5106
Professor G. V. Hobson Department of Aeronautics and Astronautics Code AA/HG Naval Postgraduate School 699 Dyer Road - Room 137 Monterey, California 93943-5106
Glenn Madert, Program Manager Defense Airborne Reconnaissance Office Office of the Under Secretary of Defense, Acquisition & Technology Washington, DC 20301
Joint Projects and Demonstrations Directorate Attn: Ms. Malinda Page« (UPR1) Washington, DC 20361-1014
75
Naval Air Warfare Center - Aircraft Division Propulsion and Power Engineering 22195 Elmer Road Patuxent River, Maryland 20670-5304
ATTN: C. Gorton, Code 4.4.T, BLDG 106 1 J. Carroll, Code 4.4.3.2, BLDG 1461 1 C. Georgio, Code 4.4 1
LT Gilbert D. Rivera, Jr 2 735 Terrace Drive Las Vegas, New Mexico 87701
76