Embed Size (px)
Citation preview

CHARACTERIZATION OF LEGHAEMOGLOBINS
FROM LEGUME ROOT NODULES
by COLIN SIDNEY MASKALL
A thesis submitted for the degree of Doctor of Philosophy
of the University of London
1
College of Registration : IMPERIAL COLLEGE

CHARACTERIZATION OF LEGHAEMOGLOBINS FROM LEGUME ROOT NODULES
by
COLIN SIDNEY MASK ALL
ABSTRACT
Crude leghaemoglobin (Lb) was isolated from extracts of nitrogen-fixing root nodules of soybean (Glycine max) and cowpea (Vigna unguiculata) by (NH4) SO4 precipitation between 55% and 8O% saturation. It was purified2by column chromatography on DEAE-cellulose phosphate at pH 7.0. Two major ferric Lbs were obtained from soybean (Lba and Lbc) and one from cowpea. However, their electron paramagnetic resonance (e.p.r.) spectra suggested that they were contaminated with peroxidases, so a two-column procedure, involving chromatography on DEAE-cellulose phosphate at pH 8.0 and pH 5.8, was developed. This gave Lba, Lbc and cowpea ferric Lb containing very low levels of peroxidases.
The pyridine haemochromogen and cyanmethaemoglobin methods for estimating Lb were compared. Possible reasons for differences in the estimates are discussed.
E.p.r. spectra of the purified ferric Lbs at pH 7.0 (acid-metLbs) were quite similar to those of acid-metmyoglobin and haemoglobin, having prominent high-spin features very near g = 6 and g = 2. The width of the g = 6 absorption derivative was simi-lar to that for acid-methaemoglobin. Unlike acid-metmyoglobin, the acid-metLbs gave spectra with small low-spin absorptions near g _ 2.26, 2.72 and 3.14. E.p.r. spectra of the fluoride, azide, hydrox-ide and cyanide complexes of these ferric Lbs were very similar to the spectra of the corresponding myoglobin derivatives, indicating that the immediate environment of the iron in Lb and myoglobin is similar.
A large e.p.r. signal at g = 2 in all the crude Lb samples was shown to originate from nitrosyl Lb (LbNO). A soybean sample contained 27±3% LbNO.
The nitrogen-fixing ability of two Rhizopum strains with soybean (cultivar Chippewa) was compared at 27 C and 33°C day tem-peratures. Strain CC705 at 33°C fixed the least nitrogen and yielded the crude Lb containing the most LbNO.
Preliminary purification of crude chickpea Lb suggested that one major Lb was present. The optical spectrum of its Lb02 complex was similar to that of soybean LbO2.
2

3
Acknowledgements
The majority of the work for this thesis was carried out in the
Soil Microbiology Department of Rothamsted EScperimental Station, and
I would like to thank the head of that department, Dr. P. S. Nutman,
for allowing to use its facilities. Also, I greatly appreciated the
friendliness of the temporary and permanent members of staff of that
department during my stay there. Thanks are also due to my super-
visor, Dr. Peter Dart of Rothamsted, for laying the foundations of
the project; for his advice and suggestions and, above all, his
great enthusiasm. I would like to thank Dr. John Gibson of the
Chemistry Department, Imperial College, for being a conscientious
director of studies; for teaching me how to operate an e.p.r. spec-
trometer and for many discussions on the inorganic chemistry and
theory of e.p.r. relevant to the project.
I am very grateful to Dr. John Carpenter of the Plant Pathology
Dept. at Rothamsted for allowing me to use his electrophoresis
apparatus, and for much helpful advice on biochemical techniques.
My thanks also to Dr. John Day (Soil Microbiology Dept.) for his
helpful advice; to Mr. W. Lazarus and Miss Brenda Messer (Chemistry
Dept.) for doing, respectively, the amino acid analyses and the
ammonium ion determinations. I would also like to thank Mr. A. Osman
for his assistance with acetylene reduction assays and leghaemoglobin
determinations; Miss Sheila Smith for growing plants and, with Mrs.
Muriel Chandler and Miss Joan Crawley, for help with harvesting root
nodules.
My thanks to D. L. Harris, M.P.S., Three Crosses, Swansea, for
photographing the e.p.r. spectra and to Mr. Chris Moyse and Mr. Alun
Jones of the Biochemistry Dept., University College of Swansea, for
their assistance with, and advice on, the remaining photography. I

4
am grateful to Mrs. Ruth Hayden for drawing figures 8.6 and 8.7 and
for her advice and the loan of drawing equipment, and to Mrs. Jan
Jacob for her efficient typing services.
I would like to thank Prof. E. G. Brown and Dr. Chris Smith of the
Biochemistry Dept., Swansea, for their interest and encouragement.
Lastly, I would like to express my gratitude to my parents and Mr.
Joe Ling, and to my friends, for their interest, understanding and
support — 'Fondly I ponder You all: without You I couldn't have
managed even my weakest of lines.,a
a Quoted from 'A Thanksgiving' from THANK YOU FOG by W. H. Auden,
with the permission of the publishers,Faber and Faber Ltd.

CONTENTS
Page No.
Abstract 2
Acknowledgements 3
Location of Tables 11
Location of Figures 12
Abbreviations 17
Section 1 19
INTRODUCTION
1.1 Leghaemoglobin — historical background 19
1.2 Determination of the Lb content of root nodules
and its correlation with the amount of nitrogen
fixed 20
1.3 Biosynthesis and breakdown of Lb 22
1.4 Isolation and purification of Lb 26
1.5 Structure and molecular properties of Lb 29
1.6 Function of Lb 36
1.7 Electron paramagnetic resonance spectroscopy and
the study of haemoproteins
39 1.8 Objectives and scope of the present work
49 Section 2
51
MATERIALS AND METHODS
2.1 Chemicals 51
2.2 Buffers 51
2.3 Culture of Rhizobium 51
2.4 Plant culture 52
2.5 Isolation of crude Lb from root nodules 56 2.6 Estimation of Lb in solution 57
2.6.1 The cyanmethaemoglobin (CMHb) method 57
5

Page No.
2.6.2 The pyridine haemochromogen (Pyr) method
58.
2.7 Purification of Lb by column chromotography
60
2.7.1 Preparation of DEAE-cellulose columns
6o
2.7.2 Purification on columns at pH 7.0
61
2.7.3 Purification using two columns
62
2.8 Recording of optical and ultraviolet absorption
spectra 63
2.9 Polyacrylamide gel electrophoresis (PAGE) 63
2.9.1 Staining acrylamide gels for protein 65
2.9.2 Staining acrylamide gels for Lb and peroxidases 66
2.10 High voltage paper electrophoresis 67
2.11.1 Preparation of purified ferric Lb derivatives
for e. p. r. spectroscopy 67
2.11.2 E.p.r. spectroscopy 69
2.12 Amino acid analysis 69
2.13 Preparation of Lb02 by dithionite reduction 70
2.14 Preparation of nitrosyl leghaemoglobin (LbNO) 70
2.15 The estimation of iron in samples of crude Lb 71
2.16 Detection of superoxide dismutase in acrylamide
gels 72
2.17 Estimation of the Lb content of root nodules 72
2.18 The acetylene reduction assay for nitrogenase
activity of nodulated root systems 73
2.19 Determination of the nitrogen content of dried
plant material 74
RESULTS AND DISCUSSION
Section 3 75
Comparison of the cyanmethaemoglobin (CMHb) and
6

Page No.
pyridine haemochromogen (Pyr) methods for the
estimation of Lb
3.1 Introduction 75 3.2 The estimation of Lb in crude preparations 75 3.3 Determination of iron and Lb concentrations in
crude Lb
76 3.4 The Pyr and CMHb methods for the estimation of Lb
in whole nodules 79
3.5 Estimation of Lb before and after chromatography
of crude Lb at pH 8.0
79 3.6 Conclusion 86
Section 4 88 Purification of Lb at pH 7.0
4.1 Analysis of crude Lb by PAGE
88 4.2 Elution patterns of Lbs from DEAE-cellulose phos-
phate columns at pH 7.0 91
4.3 Amino acid analysis of cowpea Lb
98 4.4 E. p. r. spectroscopy of ferric Lbs purified on
DEAE-cellulose phosphate columns at pH 7.0
102
Section 5 107
Development of an improved method for purifying
Lb using two columns
5.1 Detection of peroxidases in samples of crude Lb
after PAGE
107
5.2 Purification of Lb on gradient-eluted D EAE-
cellulose phosphate columns at pH 5.8
109
5.3 Purification of Lb on a stepwise-eluted DEAE-
cellulose phosphate column at pH 8.0 113
7

Page No.
5.4 The two-column purification procedure for soybean
and cowpea Lb 124
5.4.1 Soybean Lb 124
5.4.2 Cowpea Lb 130
5.5 The effect of the 'black nodule' pigments on cow-
pea Lb 133
5.6 The green proteins in Lb preparations 137
5.6.1 Comparison of crude Lb from normal and stressed
nodules 137
5.6.2 Paper electrophoresis investigations 141
5.6.3 PAGE experiments and the possible nature of the
green proteins 141
Section 6 145
E. p. r. spectroscopy of ferric Lbs purified by the
two-column procedure and their derivatives
6.1 Acid-metLbs (ferric LbH2O at pH 7.0) 145
6.1.1 Description of spectra 145
6.1.2 Discussion 149
6.2 Differences between the e. p. r. spectra of acid-
metLbs purified at pH 7.0 and those purified by
the two-column procedure 151
6.2.1 High-spin features 151
6.2.2 Low-spin features 156
6.3 Ferric Lb fluorides (LbF-)
159
6.4 Ferric Lb hydroxides (Lb0H )
161
6.5 Ferric Lb azide and imidazole derivatives (LbN3
and Lblm) 162
6.5.1 Azides 162
8

Page No.
6.5.2 Imidazoles 165
6.6 Ferric Lb cyanide and nicotinate derivatives
(LbCN and LbNic) 176
Section 7 180
Presence of nitrosyl leghaemoglobin (LbNO) in
crude Lb preparations
7.1 Introduction 180
7.2 On the nature of the species responsible for sig-
nal R 180
7.3 Decay of signal R 182
7.3.1 Detection of superoxide dismutase activity in
legume root nodules 184
7.3.2 Ascorbate and the species responsible for sig-
nal R 185
7.4 E.p.r. data on signal R 186 7.5 Location of signal R in oxyleghaemoglobin (Lb02)
fractions and identification of nitrosyl leg-
haemoglobin as the species responsible 188
7.6 The nature of previously unidentified forms of
ferrous leghaemoglobin 192
7.6.1 The nitric oxide complex of ferric Lb 199
7.6.2 E.p.r. spectra of nitrosyl leghaemoglobin sam-
ples prepared with Na2S204 or ascorbic acid 200
7.7 Quantitative estimation of nitrosyl leghaemoglo-
bin in a crude Lb sample 202
7.8 Possible origins of nitrosyl leghaemoglobin 203
Section 8 207
The effect of plant growth temperature and
9

Page No.
Rhizobium strain on nitrogen fixation and Lb
content of nodulated soybeans
8.1 Introduction 207
8.2 Methods 207
8.3 Symbiotic performance (nitrogen fixation and Lb
content) of Chippewa soybean nodules formed by
Fthizobium strains CB1809 and CC705 at 27°C and
33°C
208
8.4 Optical absorption spectra of crude Lb prepara-
tions 215
8.5 Conclusion 221
Section 9 223
A preliminary investigation of leghaemoglobin
from chickpea (Cicer arietinum) nodules
9.1 Partial purification on DEAEF-cellulose phosphate
columns 223
9.2 Investigation of the main part of the major Lb
band 225
9.3 Conclusion 229
Section 10 230
GENERAL DISCUSSION
References 236
Publication
10

11
Location of Tables
TABLE Abbreviated Title and Page No.
No.
2.1 Host plant cultivars and Rhizobium strains used to nodulate
them 55
3.1 Concentration of Lb in extracts of whole nodules determined
by the CMHb and Pyr methods 80
3.2 Lb concentrations determined by the CMHb and Pyr methods be-
fore and after chromatography at pH 8.0 80
4.1 PAGE of crude Lb preparations 90
4.2 Elution pattern of soybean Lb from a column equilibrated with
2 mM phosphate buffer, pH 7.0 93
4.3 Optical absorption spectra of Lb fractions eluted from columns
atpH7.0 94
4.4 PAGE of Lb fractions eluted from columns at pH 7.0 97
4.5 Amino acid analysis of cowpea Lb. 100
4.6 Amino acid composition of cowpea Lb. 101
4.7 Effective g values of features in the e.p.r. spectra of ferric
Lbs purified at pH 7.0 105
5.1 PAGE of the fractions from the stepwise-eluted column at pH
8.0 120 and 121
6.1 Effective g values of high-spin ferric Lb derivatives and the
low-spin features in the acid-met Lb spectra 147
6.2 Separation of the extrema of the absorption derivative at g
6 for high-spin ferric Lb derivatives 148
6.3 Measured g values of low-spin ferric Lb derivatives 164
7.1 Effect of nodule extraction medium on the magnitude of signal
R 187
7.2 Optical absorption spectral data for ferrous Lb, Lb02 and LbNO
preparations 195 and 196

12
Location of Tables
8.1 Absorption maxima of the spectra of crude Lb preparations from
soybeans grown at 27 and 33°C 216
8.2 Comparison of the absorbances of the 01- and p peaks and the
trough between them for the spectra of 'Lb02' and untreated
Lb samples 220
Location of Figures
FIG. Abbreviated Title and Page No.
No.
1.1 Structure of (a) ferroprotoporphyrin IX and (b) Biliverdin
chelating iron 23
1.2 Approximately octahedral arrangement of the ligands to: (a)
ferrous iron in Mb02 and (b) ferric iron in acid-metMb 31
1.3 (a) Fh ergy level diagram of the d-orbital splitting of ferrous
or ferric iron in octahedral, tetragonal and rhombic ligand
fields. (b) Possible high-spin and low-spin states for
ferrous and ferric iron in an octahedral ligand field 34
1.4 Divergence of the energy levels of an electron in an applied
magnetic field and the magnetic resonance transition 42
2.1 Standard curve for the estimation of Lb by the cyanmethaemo-
globin method 59
3.1 Lb concentration of dilutions of a crude soybean Lb solution
determined by the cyanmethaemoglobin and pyridine haemo-
chromogen methods 77
3.2 Optical absorption spectrum of the pyridine haemochromogen
complex from a sample of crude soybean Lb 78
3.3 Optical absorption spectra of a sample containing LbcNO and
acid-metLbc subjected to the Pyr method 84
4.1 Acrylamide gels of crude soybean Lb preparations stained for
protein 89

13
Location of Figures
4.2 Acrylamide gels of crude Lb stained for Lb with an alcoholic
o-dianisidine reagent 92
4.3 Acrylamide gels of crude Lb preparations applied to columns
at pH 7.0, and the Lb fractions eluted from the columns 96
4.4 E. p. r. spectra of ferric Lbs purified on columns at pH 7.0 104
and 152
5.1 Acrylamide gels of crude soybean Lb stained for protein; for
Lb with an alcoholic o-dianisidine reagent and for peroxi-
dases 108
5.2 Acrylamide gels of crude soybean Lb chromatographed on columns
at pH 5.8, and ferric Lb fractions eluted from the columns
111
5.3 Optical absorption spectrum of the peroxidase fraction isolated
from crude soybean Lb 116
5.4 (a), (b) and (c) Acrylamide gels of crude soybean Lb applied to
a column at pH 8.0 and the fractions obtained from the column
by a stepwise elution programme 117 to 119
5.5 Acrylamide gels of Lbs purified at pH 7.0 and examined by e.p.r.
spectroscopy at 8-31 K 123
5.6 Acrylamide gels of crude Lb applied to columns at pH 8.0, and
the Lba plus Lbc fractions and the pooled peroxidase frac-
tions eluted from the columns 126
5.7 Acrylamide gels of soybean Merit-CC705 ferric Lbs eluted from
a column at pH 5.8 127
5.8 Acrylamide gels of soybean Altona-CB1809 ferric Lbs eluted from
a column at pH 5.8 128
5.9 Diagrammatic representation of acrylamide gels showing the puri-
fication of crude soybean Lb by the two-column procedure 129

14
Location of Figures
5.10 Acrylamide gels of crude cowpea Lb applied to columns at pH
8.0, and the ferric Lb and major ferrous Lb fractions eluted
from the columns 134
5.11 Acrylamide gels of cowpea ferric Lb eluted from a column at
pH 5.8 135
5.12 Diagrammatic representation of acrylamide gels showing the
purification of crude cowpea Lb by the two-column procedure
136
5.13 Acrylamide gels of crude soybean Lb extracted from the root
nodules of normal and stressed plants 139
5.14 Relative mobilities of cowpea Lb and the green protein con-
taminant in acrylamide gels of different concentration 143
6.1 E.p.r. spectra of ferric Lbs purified by the two-column proce-
dure 146
6.2 E.p.r. spectrum of the peroxidase fraction isolated from crude
soybean Lb 154
6.3 E.p.r. spectrum of soybean Lbc fluoride at pH 7.0 160
6.4 E.p.r. spectrum of cowpea ferric Lb hydroxide at pH 9.6 160
6.5 E.p.r. spectra of the azide derivatives of ferric Lbs at pH 7.0
163
6.6 Schematic representation of the interaction between the distal
histidine and azide in MbN3 166
6.7 E.p.r. spectra of the imidazole derivatives of ferric Lbs at
pH 7.0 167
6.8 Schematic representation of the proposed interaction between
the distal histidine and the imidazole at the 6th coordina-
tion position of the iron in one Lbclm complex 173
6.9 Scheme proposed by Momenteau et al. (1973) for the reaction of

15
Location of Figures
fluoride with a bis imidazole complex of deuterohaemin IX
dimethyl ester 173
6.10 Structures of the model compounds for: (a) the B-type and (b)
the H-type low-spin complexes of ferric Hb as proposed by
Peisach et al. (1973). (c) Structure of the H-type complex
of ferric Hb proposed by Peisach et al. (1975). 175
6.11 E.p.r. spectrum of cowpea ferric Lb cyanide at pH 7.4 177
6.12 E.p.r. spectrum of soybean Lbc nicotinate at pH 6.9 177
7.1 The e.p.r. signal R (from nitrosyl leghaemoglobin) 181
7.2 Decay of signal R and growth of the high-spin acid-metLb signal
at E = 6 with time in a crude Lb sample stored at 0°C 183
7.3 Q-band e.p.r. spectrum of signal R 189 _
7.4 E. p. r. spectrum of the nitrosyl derivative of ferrous Lbc
(prepared with NO gas) 191
7.5 Soret region of the optical absorption spectra of purified cow-
pea ferrous Lb and LbNO 197
7.6 Optical absorption spectra of a preparation of crude soybean Lb
in the 'ferrous' and ferrous NO forms 198
7.7 E.p.r. spectrum of the nitrosyl derivative of crude soybean
ferrous Lb prepared with Na2S204 and NaNO2 201
8.1 Amount of nitrogen fixed per plant with respect to time for
soybeans nodulated with Rhizobium strain CB1809 or CC705 and
grown at 27° or 33°C 209
8.2 Amount of nitrogen fixed per gram nodule fresh weight with res-
pect to time 210
8.3 Nitrogenase activity with respect to time 212
8.4 Amount of Lb per plant with respect to time 213
8.5 Amount of Lb per gram nodule fresh weight with respect to time
214

16
Location of Figures
8.6 Optical absorption spectra of crude 'Lb02' samples from the
four strain-temperature combinations 217
8.7 Optical absorption spectra of crude 'untreated' Lb samples from
the four strain-temperature combinations 218
9.1 Optical absorption spectra of the 02 and CO complexes of chick-
pea ferrous Lb 227
9.2 Acrylamide gels of crude chickpea Lb applied to a column at pH
8.0, and the major Lb02 fraction eluted from the column 228

A A
ATP
B. M.
C. u.
cv.
Abbreviations
absorbance (extinction) log (Ia/I)
Angstrom unit, 10 10m
adenosine 5' triphosphate
Bohr magneton
chart unit
cultivar
DEAE}-cellulose diethylaminoethylcellulose
EDTA ethylenediaminetetraacetate
frn fraction
G gauss
Qiz gigahertz (s-1)
Hb A adult human (normal) haemoglobin which consists of
2 c4 and 2 s subunits. Hb F, a major component of
foetal erythrocytes has 2 oL and 2 C subunits.
I ionic strength (moll)
kelvin
leghaemoglobin. The prefix 'ferrous' is omitted
from Lb02 and LbCO because only the ferrous protein
combines with 02 and CO. It is also omitted from
LbNO. Where the NO complex of ferric Lb is referred
to, the oxidation state of the Lb is always speci-
fied. Lba and Lbc are in the ferric state, unless
otherwise specified. Where the F-, OH , N3-, imida-
zole, CN and nicotinate complexes of Lb (and Hb and
Mb) are referred to, the protein is always ferric.
Mb myoglobin
MES 2-(N-morpholino) ethanesulphonIc acid
mol. wt. molecular weight
17
K
Lb

18
mW milliwatt
nm nanometer
n. m. r. nuclear magnetic resonance
202 partial pressure of oxygen
13.13-m- parts per million
6 m ll millimolar extinction coefficient
wavelength

19
Section 1
INTRODUCTION
1.1 Leghaemoglobin — historical background
An important factor contributing towards the value of leguminous
plants in agriculture is their ability to fix atmospheric nitrogen by
means of root nodules. These structures are formed by a symbiotic
association between the plant and bacteria of the genus Rhizobium.
When fixing nitrogen they always contain a red pigment. This was
first correctly identified as a haemoprotein by Kubo (1939) who iso-
lated the protein from a water extract of crushed soybean (Glycine
max) nodules. The optical absorption spectra of the protein and its
derivatives showed that it was similar to haemoglobin. Kubo also
demonstrated that the protein could be reversibly oxygenated and con-
cluded that it was involved in the aerobic respiration of the nodules,
acting as a store and carrier of 02.
The haemoglobin-like nature of the protein, especially the ability
to combine reversibly with oxygen, was confirmed by Keilin & Wang
(1945) for soybean nodules and by Virtanen (1945) for nodules of the
green pea (Pisum sativum). Virtanen & Laine (1946) proposed that the
protein be called 'leghaemoglobin' and that its function involved a
change in valency of the iron, coupled to the indirect conversion of
N2 to hydroxylamine which was then converted to the amino group of
aspartic acid. Keilin & Smith (1947) disagreed with this proposed
function for several reasons, the main one being that they were only
able to detect ferrous leghaemoglobin (ferrous Lb) and oxyleghaemo-
globin (Lb02) in soybean nodules. They concluded that Lb showed the
usual reversible binding of oxygen and that its activity was almost
certainly related to symbiotic N2 fixation.
Smith (1949b) considered that Lb might have an effect on the

20
oxygen uptake of nodule tissue, but was unable to demonstrate this
experimentally (see 1.6). For the next two decades the function of
Lb remained unclear. However, during this period much more informa-
tion on the structure of the protein and its in vivo status was
obtained, providing indications of its actual function.
1.2 Determination of the Lb content of root nodules and its
correlation with the amount of nitrogen fixed
No Lb-like protein has ever been isolated from nitrogen-fixing
root nodules of non-leguminous species. Although Davenport (1960)
obtained evidence from optical absorption spectra for a pigment
similar to haemoglobin in nodules of Casuarina cunninghamiana, he
could not extract it into aqueous solvents in order to purify it.
Legume root nodules occur which fix little or no nitrogen and are
termed ineffective. They do not usually contain Lb. For example,
Virtanen (1945) isolated a strain of Fthizobium leguminosarum which
formed ineffective nodules on pea roots and using this strain and
others of varying effectiveness, showed that for peas there was a
positive correlation between the Lb content of the nodules and their
nitrogen-fixing ability (Virtanen et al., 1947a & b). Nodules were
crushed in pyridine or pyridine plus sodium dithionite (Na2S204), in
order to obtain the pyridine haemochromogen complex (see 2.6.2) and
estimate the total haem content of the nodules. This was considered
to be a close approximation to the Lb content. However, it was noted
that if the nodules contained green pigment (see 1.3), this inter-
fered with the estimation (Virtanen et al., 1947a).
Smith (1949a) also used the pyridine haemochromogen method to
estimate the Lb in soybean and dwarf French bean (Fhaseolus vulgaris)
nodules, but he first ground them in water, then centrifuged the
extract and measured the Lb concentration in the supernatant. He

21
also showed that Lb was located in the large, bacteria-containing
cells of the central nodule tissue thought to be specifically
involved in nitrogen fixation. Using a microspectroscope, Smith
was unable to detect Lb in slices of ineffective soybean nodules.
Jordan & Garrard. (1951) used the pyridine haemochromogen method
on vetch (Viola sativa) and lucerne (Medicago sativa) nodules, and
Graham & Parker (1961), the cyanmethaemoglobin method (see 2.6.1) on
lupin (Lupinus digitatus) nodules, and confirmed the positive
correlation between nodule Lb content and the amount of nitrogen
fixed. Bergersen (1961), however, pointed out that this correlation
did not necessarily mean that Lb was the agent of nitrogen fixation
in the nodule. He demonstrated a significant positive correlation
between the haem content of the individual nodules, estimated by the
method of Virtanen et al. (1947a & b), and the total volume of the
bacteroidacontaining cells of the central tissue. Bergersen con-
cluded that haem and hence Lb concentration was correlated with the
amount of nitrogen fixed because it was determined by the volume of
tissue actively fixing nitrogen.
Wilson & Reisenauer (1963) made several criticisms of the pyridine
haemochromogen method, including cloudiness of nodule extracts and
instability of the coloured complex. They described fully a
cyanmethaemoglobin method and its application to soybean, pea, vetch
and lucerne nodules. Their cyanmetleghaemoglobin complex was stable
for up to 6 h, and almost certainly much longer. Schiffman & Lbbel
a Bacteroids are the symbiotic form of Rhizobium bacteria. They exhibit extensive biochemical, and often morphological, differences from the usually-occurring, free-living form of Rhizobium from which they develop. Most importantly, they develop the ability to fix nitrogen by means of the enzyme nitrogenase; an ability which free-living rhizobia do not possess when cultured on many media (Bergensen, 1969).

22
(1970) modified this method for peanut nodules and noted that it was
apparently unaffected by green pigment in the nodules.
1.3 Biosynthesis and breakdown of Lb
The nodule bacteroids do not appear to contain Lb (Smith, 1949a).
Cells of free-living (cultured) Rhizobium japonicum contain a
soluble haemoglobin-like protein (Rhizobium haemoglobin), but it is
antigenically different from Lb and absent from soybean nodule
bacteroids derived from the same bacteria (Appleby 1969a). Cutting
& Schulman (1968), using antibodies against the two major soybean Lbs
(see 1.4), showed that soybeans grown in absence of rhizobia did not
contain Lb, confirming that Lb is a product of the symbiotic
association. Lb was absent from the leaves, stems, roots and
bacteroids of nodulated soybeans but was, however, present in the
plant cytoplasmic fraction of the nodules. Moreover, nodules pro-
duced by effective and ineffective bacterial strains cross-reacted
with the Lb antibodies to a similar extent, suggesting that the
genetic information which specifies the apo-Lbs resides in the host
plant.
Dilworth (1969) confirmed this by investigating two different
legumes: yellow lupin (Lupinus luteus L.) and serradella (Ornithopus
sativus Brot.), which were effectively nodulated by the same strain
of Rhizobium lupini. The Lb was extracted and analysed by chroma-
tography on DEAE-cellulose acetate columns and by polyacrylamide gel
electrophoresis (PAGE). The number of distinct Lbs and their
behaviour on chromatography and PAGE was different for each legume.
Yellow lupins nodulated by two different Rhizobium lupini strains
gave the same pattern of Lbs.
Like Mb and Hb, Lb has protohaem IX as its prosthetic group (see
Fig. 1.1.a and section 1.5). The origin of this has been investigated.

(a)
23
(b)
FIG, 1.1 Structure of (a) ferroprotoporphyrin IX (protohaem IX)
usually called haem. (When the iron is ferric the compound is
referred to as haemin.) (b) Biliverdin chelating iron. Virtanen &
Miettinen (1949) proposed that the prosthetic group of Legchole-
globin was similar to, but not identical with, this compound.
(Abbreviations: M, methyl; V, vinyl and P, propionate.)

24
Soybean nodule homogenates incorporate the 04-carbon atom of glycine
and the carbon atoms of acetate into haem (Richmond & Salomon, 1955).
Using intact soybean and cowpea (Vigna unguiculata) nodules and cell-
free soybean nodule extracts, Jackson & Evans (1966) showed that
ō -amino laevulinate (ALA) was also incorporated into haem. Propion-
ate, succinate and o4-ketoglutrate were incorporated too, and it was
assumed that they gave rise to succinyl CoA which, with glycine,
gives rise to ALA.
Cutting & Schulman (1969) attempted to determine whether the
bacteroids or plant cells were responsible for Lb-haem synthesis.
They centrifuged soybean nodule homogenates to prepare soluble
(plant cytoplasmic) and particulate fractions and measured the in-
corporation of 4-14C-labelled ALA into haem. The particulate fraction (mainly bacteroids and devoid of plant mitochondria) was
responsible for 70-80% of the haem synthesizing activity of the
unfractionated homogenates. The plant cytoplasmic fraction, however,
had negligible activity. Combining the two fractions (i.e. a recon-
stituted homogenate) restored the activity to that of the unfraction-
ated homogenate. Some of the radioactive haem synthesized by an
unfractionated homogenate was incorporated into Lb. The bacteroids
thus appear to have the major role in the elaboration of haem for Lb.
Very little is known about the breakdown of Lb in nodulated
legumes ageing under unstressed conditions. Virtanen (1945) noted
that Lb - containing nodules of pea plants put into the dark turned
irreversibly green within 2-3 days. Virtanen & Laine (1946) found
that a longer period in the dark was required for soybean nodules.
They observed that pea nodules began to turn green at the end of
flowering and nodules formed by poorly effective bacterial strains
often contained green pigment, as well as Lb, at an early stage of

25
their development. Nodules formed by very effective strains also
contained green pigment as well as Lb if the plants were grown under
unfavourable (stressed) conditions.
Virtanen & Laine precipitated the soluble green pigment (protein)
from pea nodules between approximately the same (NH4)2604 concentra-
tions as they used to precipitate Lb. Iron was liberated from the
green pigment using dilute hydrochloric acid in the presence of 02
and they deduced from this that the iron was in the ferrous state in
the pigment. However, they also obtained evidence for the iron being
in the ferric state. They concluded that the green pigment was a
precursor of the bile pigments, resembling choleglobin. Lemberg et
al. (1938) prepared choleglobin from a solution of haemoglobin (Hb)
and ascorbic acid in phosphate buffer, pH 7.6,`exposed to air.
Subsequently, Virtanen & Miettinen (1949) proposed the name
'legcholeglobin' for the green pigment from pea nodules and, using
acetic acid, isolated from green nodules a pigment having a spectrum
similar to that of the bile pigment biliverdin. They concluded that
the porphyrin ring of legcholeglobin was broken, being similar,
though not identical, to biliverdin, whose structure shown in Fig.
l.l.b. However, they were unable to isolate a similar compound from
the senescing nodules of field-grown soybeans, and suggested that the
globin was denatured as the green pigment formed from Lb in soybean
nodules.
Smith (1949a) observed green pigment in ineffective soybean
nodules which appeared to be devoid of Lb. He suggested that this
might be due to the formation of Lb, followed by its almost immediate
breakdown.
Placing plants in the dark in order to produce green pigment in
their nodules does not necessarily indicate the pathway of breakdown

26
of Lb under 'normal' growth conditions. However, Swaraj & Garg
(1970) made the interesting observation that addition of ascorbic
acid to the rooting-medium delayed the greening of effective nodules
on chickpeas (Cicer arietinum). Since soybean root nodules contain
2-3 times the concentration of ascorbic acid present in the roots
(Virtanen & Jorma, 1945), this compound may have a role in preventing
the breakdown of Lb.
1.4 Isolation and purification of Lb
Kubo's (1939) procedure for isolating Lb involved macerating soy-
bean nodules in water, centrifuging the extract and fractionating
the supernatant by precipitation with (NH4)2SO4. Virtanen et al.
(1947) used basically the same method, noting that simply crushing
the nodules liberated the Lb in solution. By repeated precipitations
between 66% and 75% saturation with (NH4)2SO4 at pH 7.0, they
obtained a preparation, predominantly metLb (ferric Lb), which they
claimed was 80-85% pure. Similarly, Ellfolk (1960a) ground frozen
soybean nodules in distilled water, using (NH4)2504 between 55% and
80% saturation to precipitate Lb, maintaining the pH just above 5
during precipitation.
In order to isolate Lb in its ferrous form, Thorogood (1957)
homogenized soybean nodules in alkaline buffer under N2 or H2 and
performed the (NH4)2504 fractionation under N2 or H2. Abel & Bauer
(1962) recommended homogenizing nodules in 3 N (NH4)2504 solution
(adjusted to pH 9.0) in a non-oxidizing atmosphere, and then pre-
cipitating the Lb by further addition of (NH4)2504.
Dilworth (1969), on homogenizing nodules of yellow lupin and
serradella in 0.1 ,'I potassium phosphate buffer, pH 6.8, obtained crude
Lb preparations which contained considerable amounts of both ferric Lb
and Lb02. Appleby (1969c) demonstrated that the higher the pH of the

27
extraction buffer, the greater the percentage of Lb02 in the crude
Lb isolated. More than 70% Lb02 was present at pH 7.9, but only
about 5% at pH 5.5. Autoxidation was considered to be responsible
for the production of ferric Lb.
However, the possibility that quinones (produced by the oxidation
of plant phenolic compounds) might oxidize ferrous Lb to ferric Lb
has also been noted (Keilin & Smith, 1947). Consequently, in an
attempt to isolate Lb in a state close to that in which it occurs in
vivo, Appleby (1969b) crushed soybean nodules in 10 mM phosphate
buffer, pH 6.4, containing Polyclar AT and under an atmosphere of N2.
Polyclar adsorbs phenolic compounds (section 2.5) and 02 is required
by the enzyme polyphenol oxidase, which catalyzes the oxidation of
these compounds.
By means of moving-boundary electrophoresis in a Tiselius appara-
tus, Ellfolk & Virtanen (1950) were able to separate a crude soybean
ferric Lb preparation into a faster and a slower-migrating component.
These were both haemoproteins, being present in approximately equal
amounts and having isoelectric points at about pH 4.4 and pH 4.7.
Thorogood & Hanania (1963) prepared these components by paper electro-
phoresis at pH 8.5 in sodium veronal buffer and Cutting & Schulman
(1969) used preparative PAGE.
However, ion-exchange chromatography has been the method most
frequently used to prepare purified Lbs. Many of the methods have
been based on that of Ellfolk (1960a), who used a column of DEAE-
cellulose equilibrated with acetate buffer of pH 5.2 and ionic
strength 0.01 to purify crude Lb from soybean nodules. This buffer
eluted a band designated a, followed by a faint, broad band
designated b (starting-buffer elution). Then, addition of NaC1 to
this buffer was used to increase its ionic strength to 0.02-0.03.

28
At an ionic strength of 0.03 a very sharp band, c, followed by a
small, sharp band, d, was eluted. A brown band remained on top of
the column. The two major fractions, Lba and Lbc, appeared to be
homogeneous as judged by electrophoresis in a Tiselius apparatus. Lba
being the electrophoretically slower component and Lbc the faster
one. Lbb and Lbd represented only a small percentage of the total
Lb. Electrophoresis of Lbb produced several components, while Lbd
appeared to consist of two components.
Dilworth (1969) also used DEAE-cellulose columns equilibrated with
13 mM sodium acetate buffer, pH 5.2, to separate the components of
crude Lb from yellow lupin and serradella nodules. He employed
starting-buffer elution, but increased the concentration of the
acetate buffer to 25 mM and 50 mM (pH 5.2) in a stepwise elution
programme, rather than adding NaC1 to the starting buffer. This
method resolved ferric Lb and Lb02 components.
Appleby (1969c) separated the ferric components of crude soybean
Lb (Lba, Lbc and Lbd) and their ferrous oxy forms (Lba02, Lbc02 and
Lbd02) on a column of DEAE-Sephadex equilibrated and developed with
13 mM sodium acetate buffer, pH 5.2. This column also resolved the
ferric Lbs into low-spin (haemichrome) and high-spin forms (see Fig.
1.3.b and section 1.7). Appleby considered that the low-spin form
was probably a complex of ferric Lb with a low-molecular-weight
ligand.
Buffers other than acetate have occasionally been used for the
ion-exchange chromatography of crude Lb. For example, a DE AC-
Sephadex column equilibrated with 10 mM phosphate buffer, pH 6.4, and
developed with this buffer, followed by a linear gradient of in-
creasing NaC1 concentration in the same buffer, produced discrete
Lbc and Lbc02 fractions (Appleby, 1969b).

29
1.5 Structure and molecular properties of Lb
The earliest estimate of the molecular weight of soybean Lb,
from sedimentation and diffusion studies of a crude preparation, was
34,100. Determinations of iron content indicated two haem groups per
molecule (Virtanen et al., 1947). Using the same techniques, plus
osmotic pressure measurements, Ellfolk & Virtanen (1952) concluded
that the electrophoretically faster component of soybean Lb had a
molecular weight of approximately 17,000 and one haem group. They
noted its resemblance to myoglobin (Mb).
Ellfolk and co-workers have made a considerable contribution to
the information available on Lb structure and properties. From
sedimentation and diffusion measurements the molecular weights of Lba
and Lbc were determined as 15,400 and 16,800 respectively (Ellfolk,
1960b). Amino acid analysis gave values of 15,429 (Lba) and 16,695
(Lbc) (Ellfolk, 1961a). It revealed that the two components had a
similar amino acid composition, with small but significant differ-
ences in the number of six of the residues. Neither component
contained cysteine (like Mb) or methionine. Both had a low histidine
content of two residues per molecule (unlike Mb and Hb).
Ellfolk considered that the two major soybean Lb components were
individual proteins and indeed tryptic peptide patterns indicated
that genetically different systems were responsible for the synthesis
of the two proteins (Ellfolk, 1962).
Protohaem IX is the prosthetic group of Lba and Lbc (Ellfolk &
Sievers, 1965) and of cowpea Lb (Jackson & Evans, 1966).
Preliminary information on the sequence of Lba was obtained by
Ellfolk & Sievers (1969) for the two tryptic peptides containing the
histidine residues of the molecule. Their results were slightly
erroneous, as shown by Aggarwal & Riggs (1970). Ellfolk & Sievers

30
noted that neutral amino acid residues were distributed around the
two histidines, as is found for Hb. Aggarwal & Riggs pointed out
that leucine 88 of the p chain of human Hb, an invariant residue in
other haemoglobins, was also present in Lba. They suggested that the
sequence of Lba might be homologous with those of the animal
haemoglobins and that its haem group was probably partially 'buried'
in a hydrophobic pocket, as in animal haemoglobins.
Ellfolk & Sievers (1965) examined the attachment of the haem
group to the apoprotein (globin) of Lba by investigating the recom-
bination of various haems with the apoprotein. They concluded that
the vinyl groups at positions 2 and . 4 of protohaem IX (see Fig.
l.l.a) were involved in hydrophobic bonding with the apoprotein and
that only one propionic acid side chain (at position 7) seemed to be
necessary for the recombination reaction. They did not speculate as
to whether the other propionic acid side chain (at position 6) was
involved in stabilizing the apoprotein-haem interaction.
Protonation of one of the haem's propionic acid side chains is
probably involved in the cleavage of the haem and apoprotein of Lba
by acidic buffers (Sievers & Ellfolk, 1970); a conclusion consistent
with the previous findings of Ellfolk & Sievers (1965).
The optical absorption spectra of Lb and its derivatives have
played an important role in identifying the pigment (Kubo, 1939) and
providing indications as to its molecular structure and function
(Appleby, 1969b & c). Various ligands can combine with Mb and Hb to
form derivatives (complexes). This involves the 6th coordination
position of the iron atom(s) of the protein (see Fig. 1.2). This is
vacant in the ferrous proteins and occupied by 02 when they are per-
forming their physiological function. The ferric proteins are unable
to combine with oxygen. Their 6th coordination position is always

5th N
proxima[ N his tidine H
(a)
6th o
0
N\
Fe
N
N
H H N
O/
N
N/ Fe\ N
FIG. 1.2 Approximately octahedral arrangement. of the
(b) ligands to: (a) ferrous iron in Mb02 and (b) ferric iron
in acid-metMb. (The four Ns represent the protoporphyrin IX.) The distal histidine of Mb can replace the water
molecule in acid-metMb giving an endogenous haemichrome (ferrihaemochrome).

32
occupied; usually by a water molecule — the acid-met form. Various
anions e.g. F-, CN-, N3 and OH- can replace this water molecule.
Using crude soybean Lb preparations, Kubo (1939) measured the
position of the absorption bands of ferrous Lb, Lb02, LbCO, acid-metLb
(ferric LbH2O) and ferric Lb fluoride and cyanide (LbF- and LbCN-).
Other workers, including Keilin & Wang (1945) and Virtanen & Laine
(1952) using crude preparations and Appleby (1969b), using Lbc and
Lbc02 fractions (section 1.4), obtained similar values to those of
Kubo. The Lb optical spectra closely resemble those of the corres-
ponding derivatives of Mb and Hb, suggesting that the immediate
environment of the iron atom in the three proteins is similar.
The optical spectrum of ferric Lb is pH-dependent because acid-
metLb and alkaline-metLb (ferric Lb hydroxide) have different spectra.
The transition from one form to the other is represented:
ferric LbH20
ferric LbOH + H+
acid-metLb
ferric Lb hydroxide
The pK for this transition was determined by Ellfolk (1961b) as 8.34
for Lba and 8.16 for Lbc. He noted that these values were similar
to those determined for ferric Hb (8.1-8.6) and slightly different
from those determined for ferric Mb (8.8-8.9).
Ellfolk (1960a) also noted the formation of a green complex when
acetic acid buffer was added to a solution of acid-metLb. He studied
the formation of this complex by an analysis of optical spectra,
concluding that undissociated acetic acid was combining with the
ferric Lb (Ellfolk, 1961b). He also found that propionic, butyric
and valeric acids (at pH 4.8) formed complexes with ferric Lb which
had similar spectra to that of the acetic acid complex. However, at
the same concentration they did not combine with ferric Mb. Because
all four carboxylic acids had a similar affinity for ferric Lb,

33
Ellfolk concluded that the protein's haem group was more accessible
than that of Mb, being on the surface of the molecule rather than
buried within it.
Optical and electron paramagnetic resonance (e.p.r.) spectra vary
with the spin-state of the iron in ferric haemoproteins (see Fig.
1.3.b and section 1.7). These two techniques, in conjunction with
magnetic susceptibility measurements, have been used to study the
spin-state of the iron in various Lb derivatives. Ehrenberg &
Ellfolk (1963) found no significant differences between the magnetic
susceptibilities of the same derivative of Lba and Lbc. Effective
magnetic moments ceff) calculated from the susceptibility data
(obtained at 20°C) indicated that LbCN- was completely low-spin and
Lbr and Lb acetate were predominantly, if not entirely, high-spin.
Ferrous Lb at pH 10.5 was completely high-spin. The values were
similar to those found for the corresponding derivatives of other
haemoglobins.
Theµeff of acid-metLb was 4.64 B.M. ; that of ferric LbOH- 3.50
B.M.. These values fall between those found for completely low-spin
and completely high-spin derivatives. The difference optical spectrum
of ferric Lb0H at 8°C and 38°C showed that the proportion of low-
spin form increased as the temperature decreased. A similar effect
was observed for acid-metLb, indicating that both derivatives were
temperature-dependent equilibrium mixtures of high and low-spin forms.
The e.p.r. spectrum of Lb acetate, recorded at 77K, gave an
absorption near ā = 6 which is typical for high-spin haem compounds.
That of acid-metLb had a similar, but less intense absorption at E
6, having the same shape as the absorption from acid-metMb. A
comparison of these two absorptions indicated that at 77K, 35-50% of the acid-metLb was in the high-spin form. The magnetic susceptibility

34 X2 -y2
(eg )
z2
f
i z2 x2 2 / - y, xy,XZ,yZ
6'o
. (t ag) \.
FREE ION OCTAHEDRAL TETRAGONAL RHOMBIC
FIG. 1.3.a Energy level diagram of the d-orbital splitting of
ferrous or ferric iron in octahedral, tetragonal and rhombic
ligand fields.
FERROUS (d6 ) FERRIC (d5 )
—1 -?- -t
-t-
--I- t1- -- -r -1- -4-47- -r- 1-1- 11 -1-1- -1- 11-
HIGH-SPIN LOW-SPIN HIGH -SPIN LOW-SPIN
FIG. 1.3.b Possible high-spin and low-spin states for ferrous and
ferric iron in an octahedral ligand field.
yz
xz
xy

35
data suggested that at 20°C about 60% of the acid-metLb and 25% of
the ferric LbOH was high-spin. These values were consistent with
the results of the temperature difference optical spectra.
In a further study of the low-spin form of acid-metLb, Ellfolk &
Sievers (1967) thoroughly dehydrated an acid-metLba preparation and
dissolved it in anhydrous glycerol. The optical spectrum was of the
haemichrome (ferrihaemochrome) type, and very similar to that given
by acid-metMb subjected to the same treatment. Addition of water gave
a spectrum indicating the formation of acid-metLb.
Addition of neutral salts in high concentration (e.g. 4 M NaC104)
to a solution of acid-metLba at pH 5.0 also produced a haemichrome
spectrum. Dilution or dialysis restored the original acid-metLba
spectrum.
Freshly-harvested soybean nodules were homogenized in 20 mM
phosphate buffer, pH 5.6, the extract centrifuged and the optical
spectrum of the supernatant recorded. This was very similar to those
of the haemichrome preparations. Precipitation of crude Lb from the
supernatant by (NH4)2SO4 followed by dissolution of the precipitate
in phosphate buffer, pH 5.6, gave a preparation consisting of haemi-
chrome plus acid-metLb. Ellfolk & Sievers concluded that the in vivo
(native) form of Lb was a haemichrome (or haemochrome) which was un-
stable and could be converted to acid-metLb during purification. By
analogy with Mb, they suggested that the 5th and 6th coordination
positions of the ferric iron in the haemichrome were occupied by the
imidazole groups of (respectively) the proximal and distal histidines.
This is defined as an endogenous haemichrome, and the only two
histidine residues in the molecule (Ellfolk, 1961a) will be ligated
to the iron atom.
Appleby (1969b), however, recorded directly the optical spectra of

36
soybean nodules under near-physiological conditions, demonstrating
convincingly that Lb occurs in vivo as a high-spin ferrous protein
with a spectrum similar to that of ferrous Mb, not a haemochrome-type
spectrum. He suggested that Lb probably functioned as an 02-trans-
porting protein. Soybean nodules homogenized at their natural pH of
6.4 gave extracts containing a high proportion of Lb02 (section 1.4).
Ferrous Lb and acid-metLb prepared from this Lb02 had Mb-like high-
spin optical spectra. Appleby (1969c) went on to show that ferric Lb,
produced by autoxidation of ferrous Lb when soybean nodules were
homogenized at pH 5.5 (section 1.4), could be separated into high-
spin and low-spin (haemichrome) forms. The low-spin form appeared to
be a complex of ferric Lb with an unknown low-molecular-weight ligand.
The haemichrome extracted by E lfolk & Sievers (1967) was therefore
almost certainly this complex and not an endogenous haemichrome. This
illustrates the ease with which an artifact can be generated from
native Lb and give rise to erroneous ideas about the nature of the
protein in vivo. This can then lead to erroneous conceptions of the
function of Lb. For example, Appleby (1969c) pointed out that haemi-
(haemo)chromes usually function as electron carriers, not 02 carriers.
His careful work on the in vivo state of Lb has contributed signif i-
cantly to a better understanding of the protein's function.
1.6 Function of Lb
Washed bacteroids isolated from soybean nodules are able to reduce
nitrogen to ammonia i.e. fix nitrogen (Bergersen & Turner, 1967;
Koch et al., 1967) and therefore contain the enzyme nitrogenase.
Because these bacteroids were free of Lb, theories proposing a direct
involvement of the haemoprotein in nitrogen fixation had to be dis-
carded. Such theories included: Lb-catalysed conversion of nitrogen
to hydroxylamine (Virtanen & Laine, 1946 — section 1.1); electron-

37
donation from Lb to a nitrogen-fixing system located on the membrane
envelope surrounding a bacteroid or group of bacteroids (Bergersen,
1960) and ferrous Lb actually being the nitrogenase (Hanstein et al.,
1967).
From his original investigations, Kubo (1939) proposed that Lb
acted as a store and carrier of 02 (section 1.1). However, convincing
experimental evidence for this has been difficult to obtain.
Lind & Wilson (1941) demonstrated that 0.01-0.0 ā CO inhibited
nitrogen fixation by nodulated red clover plants, 0.05% CO causing
almost complete inhibition. However, the same concentrations of CO
had no effect on the assimilation of N from NH4 NO3 by uninoculated
(i.e. non-nodulated) plants.
Keilin & Wang (1945) determined the p02 required for half-oxygena-
tion (21-(02)) of a crude soybean Lb sample as less than 0.1 torr and
found that the affinity of the protein for CO was about 37 times that
for 02. They concluded that the inhibition observed by Lind & Wilson
(1945) was due to a combination of the nodule Lb with CO. Smith
(1949b), however, using nodulated clover plants with their roots
immersed in a liquid medium containing dissolved 02 and N2, was unable
to demonstrate any decrease in the rate of 02 uptake after the intro-
duction of CO at a concentration (equivalent to 0.02 atm) sufficient
to combine with almost all the nodule Lb. This apparent non-involve-
ment of Lb02 in 02 uptake by nodules increased the credibility of the
alternative theories of Lb's function.
Smith (1949b) stated: "It is difficult to see how stationary
haemoglobin can have any direct effect upon a diffusion gradient of
dissolved oxygen within the nodule after a steady state has been
reached." However, in 1960 Scholander reported an enhanced rate of
02 diffusion through Hb and iib solutions. A specific transrort

38
process, involving the haemoprotein molecules and operating in
addition to the simple diffusion of 02 through the solvent, was
responsible. This process is called facilitated diffusion.
Appleby (1962) redetermined the 21(02) of crude soybean Lb as
0.050 torr, confirming that the protein had a very high affinity for
02. The optical spectra of young nodules cooled in liquid N2
indicated the presence of a mixture of ferrous Lb and Lb02, suggest-
ing a very low 02 concentration inside the nodule. Appleby
speculated that the Lb might function as an 02-transporting protein.
He was, however, unwilling to claim this as its only function because
of the findings of Smith (1949b).
In 1964, Yocum briefly reported the optical spectroscopic
examination of half nodule sections under physiological conditions.
Changes in the amounts of ferrous Lb and Lb02 were readily observable
and he suggested that Lb acted by facilitating the diffusion of 02 to
the nodule bacteroids.
Appleby (1969b) confirmed these observations, detecting a revers-
ible oxygenation of ferrous Lb in soybean nodules. No evidence for
the occurrence of an oxidation-reduction cycle or the formation of a
spectroscopically-distinguishable N2 complex of Lb was obtained. He
concluded that, in vivo, Lb appeared to transport 02 (section 1.5).
Although the 02 concentration within the nodule appears to be very
low, the bacteroids require 02 in order to fix N2 (Bergersen & Turner,
1967). Cell-free extracts of bacteroids require ATP (generated by
oxidative phosphorylation in intact bacteroids) for nitrogen fixation,
and their activity is destroyed by 02 (Koch et al., 1967). The above
observations give most support to the proposed 02-transporting
function of Lb. Moreover, Lb's very high 02 affinity may protect the
bacteroids' nitrogenase from 02 inactivation.

39
Recently evidence has been obtained that CO does inhibit nodule
respiration. Tjepkema & Yocum (1970) briefly reported that at very
low 02 concentrations the respiration rate of very thin soybean
nodule slices was halved when the Lb was combined with CO. They
also concluded that Lb functioned by facilitating 02 diffusion within
the nodule.
An important question related to this proposed function is the
precise location of Lb within the bacteroid-containing cells of the
nodule. In soybean, bacteroids occur in groups of 4 to 6 enclosed in
a membrane envelope (sac) originating from the host cell (Bergersen,
1969). Bergersen (1960) originally proposed that the Lb was located
inside the membrane envelopes. However, Dart (1968) disagreed with
this. Utilizing the peroxidase activity of glutaraldehyde-fixed Lb,
he concluded from electron microscopic observations that the Lb was
in the cytoplasm outside the membrane envelopes.
Dilworth & Kidby (1968) grew serradella nodules in the presence
of 59Fe. From an electron microscopic examination of autoradiographs
of thin fixed sections of these nodules, they concluded that the Lb
was enclosed in the envelopes. However, the resolution of this
method makes such a conclusion difficult to sustain.
It is, of course, possible that Lb occurs in both places. However,
its precise location remains in dispute. If the Lb is in the
cytoplasm, facilitated diffusion should occur over a relatively long
distance; if it is confined to the membrane envelopes, this distance
will be much shorter.
1.7 'Electron paramagnetic resonance spectroscopy and the study of
haemoproteins
Ingram & Bennett (1955) applied the technique of electron para-
magnetic resonance (e.p.r.) spectroscopy to pastes of Hb and Mb

40
derivatives and single crystals of phthalocyanine derivatives. They
noted the following advantages of this type of spectroscopy, particu-
larly in relation to the complexes of transition metal ions with
large organic ligands.
1. Only the paramagnetic ion and its immediate surroundings deter-
mine the nature of the spectrum; the rest of the molecule, which is
diamagnetic, does not interfere. This is in contrast to other types
of spectroscopy (e.g. infrared), where very complex spectra are
obtained.
2. Unlike magnetic susceptibility measurements, the splitting of an
individual energy level can be studied separately, and there is no
need for simplifying assumptions to interpret the results.
3. E.p.r. spectroscopy is a more sensitive technique than magnetic
susceptibility measurements and good spectra can be obtained from
small single crystals. (Complexes of metal ions with organic ligands
rarely yield large crystals). The spectrum often changes consider-
ably with changes in the angle between the applied magnetic field and
the crystalline (molecular) axis. Consequently, much extra informa-
tion can be obtained, relative to bulk-susceptibility measurements.
Another advantage of e.p.r. spectroscopy is the information that
can be obtained from the hyperfine structure often observed in e.p.r.
signals. This originates from magnetic coupling of the spin of the
unpaired electron with the spins of nearby magnetic nuclei and is
designated hyperfine coupling. The number and nature of the inter-
acting nuclei can then be determined.
Ingram & Bennett showed that acid-metHb, acid-metMb and the fluor-
ide derivatives of ferric Hb and Mb gave e.p.r. spectra which had
effective & values near 6.0. From magnetic susceptibility measure-
ments these derivatives had been classified as 'essentially ionic';

they are now designated 'high-spin' (see Fig. 1.3.b). However, ferric
ions in strongly ionic crystals gave a g value of 2.0, so the e.p.r.
measurements demonstrated that the earlier description of the bonding
in these ferric Hb and Mb derivatives was inadequate.
The azide derivatives of ferric Hb and Mb gave spectra where the g
value varied from 2.2 to 2.8. This appeared to support the previous
classification of these derivatives as 'essentially covalent'. They
are now, however, designated 'low-spin' — Fig. 1.3.b. This was the
first demonstration that e.p.r. spectra are characteristic for the
spin-state of the iron in ferric haemoproteins.
The g factor of the electron is related to the magnetogyric ratio,
Ō , by the equation: ils
a
where 1.1 is h/21r (h is Planck's constant) and $ is the Bohr magneton.
It has a value of 2.0023 for a free electron. Bennett et al. (1957)
described g as the spectroscopic splitting factor; a measure of the
rate at which the energy levels of a paramagnetic atom diverge with
increasing applied magnetic field. This situation is illustrated in
Fig. 1.4. Electromagnetic radiation of the appropriate frequency, y ,
can produce a transition from the lower to the higher energy level.
The spectroscopic situation is then described by the equation:
b y - EAR
where H is the strength of the magnetic field. Thus, g values can
easily be determined from the e.p.r. spectra.
For most free radicals the g value is close to the free-spin value
of 2.0023. The small departures observed ± 0.01) are due to orbi-
tal magnetism adding to or subtracting from the spin magnetism of the
electron. The orbital magnetism in these and in other paramagnetic
centres with a non-degenerate ground state is quenched (i.e. reduced

42
Applied magnetic field
FIG. 1.4 Divergence of the energy levels of an electron in an
applied magnetic field and the magnetic resonance transition.

4.3
to zero) in first order, but acquires a small value through spin-
orbit coupling to a relatively distant excited state. The magnitude
of the shift in g value depends in part on the magnitude of the spin-
orbit coupling constants of the atoms involved, and in part on the
energy of the interacting excited state. The spin-orbit coupling con-
stant increases markedly with increasing atomic number, its sign being
positive or negative, depending upon whether the valence shell is less
or more than half-filled. Consequently, in transition-metal complexes
the main cause of the shift in & value, which may be positive or
negative and rather larger than that observed for free radicals
(approx. ± 0.3) is the metal ion. However, heavy atoms in the ligands
may also be partly responsible.
The effect of the excited state is as follows. As the applied
field is moved around a molecule, the spin magnetic moment will always
align itself parallel to this field. However, the magnitude and
direction of the orbital magnetic moment will vary with the direction
of the applied field, because different orbitals will be involved for
different directions of the field. The g value will therefore vary
with the direction of the applied field and is in fact a tensor, hav-
ing nine components. These can be reduced to three components, the
principal g values: gx, gy and gz, which are in three mutually per-
pendicular directions. They provide information about the order and
relative spacing of the energy levels, and hence about the strength
and symmetry of the environment of the unpaired electron.
Very large shifts in g value (approx. ± 1.5) are observed in some
transition-metal complexes (e.g. those of low-spin ferric ions), but
these are due to an electron rotating between two orbitals which are
similar in energy. In these orbitally degenerate ground states there
is a net orbital momentum which gives rise to orbital magnetism. It

44
is then not possible to treat the spin and angular momenta independ-
ently, and the above approach is no longer applicable. Instead, the
total angular momentum of the ground state (L + S) must be considered
to be affected both directly by the applied field and indirectly
through spin-orbit coupling. In this way very large g shifts may
occur.
If there is more than 1 unpaired electron in the molecule i.e. S> ā
(often the case for transition-metal ion complexes), zero-field split-
ting may occur. This is caused by asymmetry (distortion) of the
ligand field surrounding the metal ion and separate sub-states result.
For high-spin Fe3+ (S = 5/2) in acid-metHb and Mbxthere are three sub-
states: ±z, 13/2 and =5/2. The difference in energy between them is
large, because of the considerable tetragonal (axial) distortion of
the complex (Fig. 1.3.a). When, such as in this case, an odd number
of electrons is present, the spin degeneracy of the sub-states remains
and they are referred to as Kramers doublets. Their spin degeneracy
can only be removed by a magnetic field. In acid-metHb and Mb the
energy separation of the three Kramers doublets is much greater than
the energy of the microwave quanta at X-band (where y is approx. 9.2
GHz), so the only e.p.r. transitions possible are in the individual
doublets themselves. In practice, the only transition observed is in
the lowest Kramers doublet. This has effective values of 6.0 and
2.0, indicative of highly axial symmetry. They are called effective
values because more than 1 electron is responsible for the transition,
but the situation is considered as if it were caused by only one elec-
tron.
The advantages of e.p.r. spectroscopy have been exploited in exten-
sive studies of single crystals of the derivatives of ferric Mb and Hb.
For acid-metMb and acid-metHb, Bennett et al. (1957) determined the

45
orientation of the haem planes in relation to each other and to the
axes of the crystal. They did this as follows.
The effective g values of the e. p. r. spectra of the two derivatives
were found to vary between 6.0 and 2.0, depending on the direction of
the applied magnetic field. (Measurements were made at 20 K.) Apply-
ing the field in any direction in the plane of a haem group gave an
effective g value of 6.0 (defined as 41). Applying it along the normal
to a haem plane gave a minimum effective g value of 2.0 (defined as
gll ). By rotating the magnetic field around each crystalline axis in
. turn and measuring the geff values, the direction of the normals to
the haem planes (and thus the haem plane orientations) in relation to
the crystalline axes were determined.
The large g value variation enabled a very accurate determination
of the orientations when no other methods for doing this were avail-
able. The findings were useful in the analysis of the results from
X-ray-crystallographic studies of Hb and Mb.
The g value variation in relation to the haem plane in a crystal of
ferric Mb azide has also been determined (Gibson & Ingram, 1957). The
E values were distributed around the free-spin value, the maximum, gZ
= 2.80, being in the direction of the normal to the haem plane, the
other two, gx = 1.72 and gz = 2.22, being in the plane of the haem.
From these g values, Griffith (1957) calculated the relative ener-
gies of the three t2g orbitals. The dXY
orbital was found to be the
lowest-lying, with the dXZ next and then the dyZ. The separation
between the dXZ and dXY orbitals and the dyZ and dXZ orbitals was
about the same. This is a consequence of a rhombic distortion of the
ligand field surrounding the iron (see Fig. 1.3.a). Griffith went on
to suggest that the energy of the dyZ orbital was raised byyr-inter-
action with the p orbital of the N atom of the imidazole ring of the

46
proximal histidine bonded to the iron (Fig. 1.2). If this p orbital
interacts with the d 1Z orbital of the iron, the plane of the imidazole
ring should be parallel to the xz plane. Consequently, the direction
of Ex in the haem plane should be parallel to the projection of the
imidazole ring on that plane.
Helckē et al. (1968) checked Griffith's suggestion by repeating the
e.p.r. measurements of Gibson & Ingram and comparing the results with
the data which had become available from X-ray crystallography. They
confirmed that the projection of the imidazole ring on the haem plane
-was approximately parallel to the direction of Ex, but found that the
direction of Es was not exactly parallel to the haem normal. This was
explained by suggesting that the first N atom of the azide ion was
unable to replace exactly the oxygen of the H2O molecule in the acid-
met derivative,because of the influence exerted by the surrounding pro-
tein molecule. The displacement of this N atom would only have to be
0.4; a distance below the resolution of the X-ray measurements.
The above investigations demonstrate how e.p.r. spectroscopy can
provide information on the electronic structure of the iron and indi-
cate some details of the geometry of its surroundings.
Many other haemoproteins have not so far yielded large crystals,
so their solutions have been studied by e.p.r. spectroscopy..
Ehrenberg (1962) investigated several haemoproteins in frozen solution.
His spectra are presented as the first derivative of the absorption
with respect to the magnetic field strength — the most common way of
representing the spectrum. The g values measured from the spectra of
ferric Mb azide (recorded at 77 K) and acid-metMb (recorded at 167 K)
agreed well with the corresponding values previously obtained from
single crystals.
From magnetic susceptibility measurements, ferric myeloperoxidase

47
H2O appeared to be high-spin like acid-metMb. However, its e.p.r.
spectrum had a a = 6 absorption which differed considerably from the
corresponding absorption of the acid-metMb spectrum in being split into
two features at & = 6.3 and g = 5.3 (Ehrenberg, 1962). A similar split-
ting has also been observed for ferric horseradish peroxidase H2O
(Blumberg et al., 1968). It is due to rhombic distortion of the ligand
field of the iron (Fig. 1.3.a). E.p.r. spectroscopy therefore immedi-
ately indicates a difference between the environment of the iron in
ferric Mb and these peroxidases. Some abnormal (mutant) human haemo-
• globins also give e.p.r. spectra where the g = 6 absorption is broad-
ened (relative to that of the Hb A spectrum) because of rhombic distor-
tion (Bemski & Nagel, 1968).
E.p.r. spectroscopy has been used to observe changes in the relative
amounts of high-spin and low-spin forms of a particular haemoprotein
derivative with respect to temperature. Ehrenberg (1962), using e.p.r.,
demonstrated that ferric MbOH was a temperature-dependent equilibrium
mixture of high and low-spin forms, with decreasing temperature favour-
ing the low-spin form. Ehrenberg & Ellfolk (1963), from a comparison
of e.p.r. spectra recorded at 77 K, concluded that acid-metLb was 35-506
high-spin at that temperature (section 1.5). Magnetic susceptibility
measurements at 20°C indicated that about 60% of this derivative was
high-spin. In fact most, if not all ferric haemoprotein derivatives
are temperature-dependent equilibrium mixtures of high and low-spin
forms. E.p.r. does, however, have limitations when applied to the
study of mixtures of spin-states (Smith & Williams, 1970). E.p.r.
spectra of haemoproteins must be recorded at temperatures below 100 K
(and often below 77 K) because the absorptions broaden considerably at
higher temperatures due to fast spin-lattice relaxation times. How-
ever, since the position of the equilibrium between the spin-states is

48
usually temperature-dependent, low-temperature measurements are not
necessarily applicable to the room-temperature situation.
Secondly, an absence of low-spin signals at 77 K does not mean that
the derivative is entirely high-spin. Some low-spin derivatives (e.g.
ferric MbCN — Ehrenberg, 1962) do not give spectra at 77 K, and even
below 40 K their absorptions may be weak. Thus, a careful search at
very low temperatures may be required to detect some low-spin species.
An absence of an absorption near g = 6 at 77 K does, however, indicate
that the derivative is completely low-spin. The corresponding peak at
- 2.0, however, might have disappeared due to fast relaxation at
this temperature.
E. p. r. and optical absorption spectra can give indications as to
the nature of the axial ligands in a ferric haemoprotein derivative.
If one of the axial ligands is known (for example, when the protein
forms a spectroscopically distinguishable complex with an anion, this
usually occupies the sixth coordination position of the iron), the
e.p.r. spectrum of this derivative can be compared with that of a
derivative having the same sixth ligand and a known fifth ligand. The
fifth ligand of Hb and Mb is the imidazole group of a histidine resi-
due. In this way, Seamonds et al. (1972) concluded that the 5th
ligand to the iron in the monomeric haemoglobin from the common blood-
worm (Glycera dibranchiata) was a histidine imidazole. They compared
the e.p.r. spectra of the CM , N3 and OH derivatives of the ferric
protein with those of the corresponding derivatives of ferric Hb and Mb.
However, if both axial ligands are unknown, it is impossible from
the e.p.r. spectrum to predict their nature with any certainty.
E. p. r. and optical absorption spectroscopy of ferric Hb A and its
isolated chains have been employed in an attempt to investigate the
polypeptide chain-mediated interaction of the haem groups in Hb

49
(Banerjee et al., 1969). This interaction is responsible for the co-
operativity observed when ferrous Hb combines with oxygen.
E. p. r. has also been used to study the reactions of haemoprotein
enzymes, for example cytochrome c peroxidase (Yonetani et al., 1966).
The scope of the e.p.r. studies of a haemoprotein can sometimes be
extended by replacing the iron in the protein with another transition
metal ion. For example, coboglobin — bovine haemoglobin containing
cobalt (Co2+) instead of iron — will still bind 02, although its
affinity for 02 is about 3 times lower than that of the native haemo-
. globin. Unlike Hb, the deoxy and oxygenated forms of coboglobin give
e.p.r. spectra. These suggest that the structure of oxycoboglobin can
be formally described as a superoxide anion bound to low-spin Co3+ i.e.
the unpaired electron of low-spin Co2+ is located mainly on the 02
(Hoffman & Petering, 1970).
1.8 Objectives and scope of the present work
This introduction has dealt with the literature published before
the end of 1970, when the experimental work was begun. Since then,
new information on Lb has become available. Where relevant, this is
referred to in the results and discussion sections.
The main aim of the present work was to isolate Lbs, taking pre-
cautions to protect them from plant-phenolic compounds, and then to
purify these proteins by a method not involving prolonged exposure of
them to the relatively low pH (5.2) most commonly employed. The e.p.r.
spectra of the purified ferric Lbs and their derivatives were then
recorded at low temperatures and compared with the spectra of the
corresponding derivatives of Mb and Hb (section 6). This enabled a
comparison of the immediate environment of the iron atom in Lb with
that in Mb and Hb, known from X-ray crystallography.
Section 2 describes all the methods used, while section 3 compares

50
the two methods employed for estimating Lb, as applied to Lb prepara-
tions of varying degrees of purity. Initially, purification on DEAE-
cellulose phosphate columns was performed at pH 7.0 (section 4), but
later an improved method was developed, involving columns at pH 8.0
and 5.8 (section 5). All the e.p.r. spectra of crude Lb preparations
showed a large signal at g = 2. The nature of the species responsible
for it was investigated (section 7).
Section 8 describes a comparison of the symbiotic performances of
two strains of FI-iizobium with soybeans grown at 27°C and 33°C. Nodule
. Lb contents and optical absorption spectra of isolated crude Lb were
also compared. Attempts were made to purify crude Lb from chickpea
nodules (section 9).

51
Section 2
MATERIALS AND METHODS
2.1 Chemicals
All chemicals were of analytical grade unless otherwise stated and
were usually obtained from BDH Chemicals (Poole, England). Sources of
other chemicals were:
Sephadex Pharmacia (G.B. ), London W.5.
DEAF-cellulose Whatman Products, H. Reeve Angel, London 2.0.4.
Polyclar AT GAP (Great Britain) Ltd., Manchester.
Nicotinic Acid Sigma (London) Chemical Co., Kingston-upon-Thames, Surrey.
Solutions wore made up in single-distilled water from an all-glass
still (quartz elements) unless otherwise stated.
2.2 Buffers
Phosphate buffers were obtained by mixing 0.1 M stock solutions of
Na2HPO4 and KH2r04 in the proportions required to give the desired pH
(Ca ori, 1955). This buffer solution was then diluted as required with
distilled water.
Sodium acetate-acetic acid buffers were prepared by mixing 0.2 M
solutions of sodium acetate and acetic acid according to the data
given by Dawson et al. (1969).
Glycine-NaCH buffer, pH 9.6, was prepared by mixing 50 ml of 0.2 M
glycine (chromatographically homogeneous) and 22.4 ml of 0.2 M NaOH
(Laboratory Reagent) and diluting to 200 ml with distilled water
(Gcmo%_i , 1955).
2.3 Culture of Phizobium
Preparation of Yeast Mannitol Broth and Agar (YMB and YNA) . YMB
contains th f Ilowing:
Ot (Taboratory `oagent) t 2: 0.5

CaC1-.6H20
"gSO4.7H2O
Fe01 3
Yeast Extract ('Difco')
0.2 g
0.1 g
0.01 g
1.0 g
52
Mannitol (Laboratory Reagent) 10.0 g
Dist. water to 1 Litre
IH adjusted to 6.8-7.0
YMA contains 10 g agar ('Oxoid' No. 1) per litre of YAC.
Both media were autoclaved at 15 psi for 20 min.
Mother cultures of Rhi zobium were maintained on slants of YMA.
Flasks of Yid were inoculated either from a slant culture or with the
contents of a freeze-dried ampoule, and incubated with shaking at 25°C.
2.4 Plant culture
NUTRIENT SOLUTIONS
Plants grown in the glasshouse or in controlled-environment cabinets
were supplied a nitrogen-free solution (Dart 8: Pate, 1959).
pH 6.2 solution:
K2HF04 (laboratory Reagent) 0.224 g
KH2FOir
MgSO4. 7H20
- Fe as [Fe FDTA H20J
Trace Element solution
CaSO4 powder (anhydrous)
per litre of de-ionized water.
The 7H 6.8 solution was as above except that the potassium phos-
phates were replaced by 0.4 g K2HF04.
Thu trace element solution contained per litre:
0.293 g
0.2 g
8.4 mg
1.0 ml
0.8 g
Mn C12. 4H 20 1.81g
or MnS01r.4H20 2.03 g

CuSO4. 5H20
zriSO4. 7H 20
H3BO3
Na2i o04.2H2°
CoSO4.6H2o
0.08 g
0.22 g
2.86 g
0.025 g
o.053 g
53
Soybeans (Glycine max), cultivars Chippewa, Merit and Norchief and
cowpeas (Vigna unguiculata), cv. Poona, were grown in the glasshouse
in boxes of Perlite (British Gypsum, Sussex), an expanded volcanic
glass. The Perlite was soaked in full-strength, pH 6.8, nitrogen-free
culture solution before the seeds were planted. Seeds were surface-
sterilized by rinsing quickly with 95% ethanol,followed by immersion
for 3 ruin in a 0.28% solution of HgC12. After draining off the HgC12
solution, the seeds were rinsed six times with tap water and inoculated
with the required Rhizobium strain by immersion in a broth culture for
2-3 min. The seeds were then planted as quickly as possible. Plants
were watered with culture solution diluted with tap water to one
quarter strength. The tap water contained 7 p.p.m. N as NO3-. Ini-
tially some difficulty was experienced in nodulating cowpeas. However,
by using pH 6.2 culture solution instead of pH 6.8, good nodulation
was obtained. Plants were given supplementary lighting (16 h day,
15000 lx) from October to March, using warm-white fluorescent tubes.
Temperatures were maintained at about 27°C (day) and 24°C (night).
Cowpeas were also grown in 15 cm diameter pots containing a mix-
ture of washed quartz sand and quartz grit (2:1 v/v) in Saxcil con-
trolled-environment cabinets. The mixture was steam-sterilized for
1.5 h before use and soaked in full-strength culture solution prior to
planting the seeds. Plants were watered with culture solution diluted
to one quarter strength with de-ionized water and given extra de-
ionized water when necessary. Vigna mungo and Vigna radiata 11-2r.2 also

grown in sand-grit in controlled-environment cabinets. Temperatures
were similar to those of the glasshouse. The day-length was 16 h,
with illumination (25000 lx) from warm-white fluorescent tubes.
To study the effect of temperature of growth on Lb content and
nitrogen-fixing ability of soybeans, plants (cv. Chippewa) were
grown in sand-grit in Saxcil cabinets as described above. Tempera-
tures of 27°C or 33°C (night temperature 3°C cooler) were employed.
The following additional procedures were included. The seeds were
sieved and only those of 5-6 mm diameter were used. To avoid deple-
tion of CO2 in the cabinets during conditions of maximum photosyn-
thesis, a CO2 injection system was employed. Gas-O-Mat meters were
set up to sample the cabinets' atmosphere and inject CO2 when
necessary, to maintain its concentration at 310 p.p.m.-325 p.p.m. (the
ambient concentration). The CO2 concentration in the cabinets was
checked with an infra-red gas analyser.
Soybeans, cultivars Altona and Merit, and chickpeas (Cicer
arietinum), Kabuli type, were also grown in the field at Woburn,
Bedfordshire, in a light, sandy soil containing only small amounts of
available N. (Nodules from these plants were easily harvested and
freed from soil). Seeds were surface-sterilized, and just before
planting immersed for a few minutes in a broth culture of the required
Rhizobium diluted with an equal volume of 20% (w/v) sucrose solution.
The soil did not contain any indigenous rhizobia capable of nodulating
these species.
The various host plant-Rhizobium combinations which were used
during the investigations are collected in Table 2.1.
Plants were harvested during the flowering to early pod-fill stage;
glasshouse-grown 8-10 weeks after sowing; controlled-environment
cabinet-grown, 6-8 weeks after sowing; field-grown, 10-14 weeks aft-.r

Table 2.1 Host plant cultivars and Rhizobium strains used to
nodulate them
Host plant Rhizobium strain
Glycine max
Cultivar Chippewa CB1809, CC705
Merit CC705
Altona CB1809, CC705
Morchief CB1809
Vigna unguiculata
Cultivar Poona SU318, CB756
CB756
CB756
CB1189
Vigna mungo
(Black gram)
Vigna radiata
(Green gram)
Cicer arietinum
Kabuli type
.55

56
sowing.
2.5 Isolation of crude Lb from root nodules
Plants were dug up and the roots and nodules washed with tap water.
Nodules were picked as soon as possible after harvesting the plants,
and stored on ice. When it was not possible to pick the nodules with-
in a few hours of harvesting, the tops of the plants were removed and
the nodulated roots stored on ice. Nodules were usually crushed on
the same day that they were picked. Some were stored in liquid N2, or
occasionally in a deep-freeze at -30°C, and crushed later (within 3
months).
Nodules were crushed using a 'Pirie press' (Pirie, 1961), or a
press based on the modified Pirie press of McArthur & Miltimore (1964).
Using the Pirie press, about 50 g of nodules could be crushed into
40 ml of extraction medium. The modified Pirie press held about 80 g
of nodules and up to 80 ml of extraction medium.
Extraction medium:
7 g ascorbic acid was dissolved in 40 ml water and the solution
neutralized with 10 r•1 NaOH (Laboratory reagent). Forty ml of 0.1 M
phosphate buffer, pH 7.2, and 2 ml of 0.1 M MgC12 solution were then
added and the volume made up to 200 ml with water. Final concentra-
tions were: 0.2 M sodium ascorbate, 20 mM phosphate buffer and 1 mM
2+ with a final pH of about .~ g , 7.0. 10% (w/v) Polyclar AT (insoluble
cross-linked polyvinylpyrrolidone) was added to the medium (Koch et
al., 1967). Fhenolic compounds are brought into contact with pro-
teins when plant tissues are homogenized. They combine reversibly
with proteins by hydrogen-bonding and are also oxidized to quinones
which can combine covalently with proteins. Ascorbate reduces
quinones to phenols and Polyclar AT cobmines with (adsorbs) the
ihenols by hydrogen-bonding. In this way plant lroteins can re pTo-

57
tooted during extraction procedures (Loomis & Battaile, 1966).
However, in later soybean nodule czushings and all the chickpea
nodule crushings, sodium ascorbate and MgC12 were omitted from the
extraction medium without any obvious deterioration of the extracted
Lb occurring.
Both press and extraction medium were cooled to near 0°C before use.
Nodules were loaded into the barrel of the press and N2 gas bubbled
through the extraction medium in the bottom chamber and up through the
nodules for at least five minutes. They were then homogenized by
being forced through the annular gap by the piston. The annular gap
was adjusted to approximately 9/ILA, for the Pirie press, and 10/2 for
the modified Pirie press. The shearing forces disrupted the nodule
cells, but phase contrast microscopy showed that the bacteroids
remained intact. The homogenate was collected in a N2-flushed flask
cooled on ice. All subsequent manipulations were performed on ice, or
in a coldroom (0-4°C). The homogenate was then filtered through two
layers of bolting cloth to remove coarse debris and centrifuged at
12000 g for 10 min in gas-tight tubes previously flushed with N2. The
clear red supernatant was fractionated with (NH4)2SO4, and the fraction
precipitating between 55% and 80% saturation (crude Lb) saved
(Sllfolk, 1960a). (The protein solution was added to the required
weight of solid (:1114)2S0L+, stirred gently under nitrogen for at least
one h and then centrifuged at 12000 .E for 10 min ). The 55% saturated
solution in cowpea Lb preparations was filtered (Whatman No. 1 paper)
to remove light-coloured floating material. The precipitate of crude
Lb was dispersed in 60% saturated (A (NH4)2SO4 solution and stored
in liquid N2 until required.
2.6 Estimation of Lb in solution
2.6.1 The cyanmethaemoglobin (=lb) method

58
The Lb is oxidized to the ferric form with K3Fe(CN)6 and the
cyanide complex formed.
Lb solution (0.1-0.5 ml) was added to a 10 ml volumetric flask and
the volume made up to 10 ml with Drabkin's solution which has the
following composition:
52 mg KCN
198 mg K3Fe(CN)6
1.0 g NaHCO3
Distilled water to one litre
pH approx. 9.0 (Wilson & Reisenauer, 1963).
The absorbance of this solution was read at 540 nm against a blank
consisting of an appropriate volume of buffer made up to 10 ml with
Drabkin's solution. The amount of Lb per 10 ml of solution was then
found from a standard curve of absorbance against mg Hb/10 ml (Fig.
2.1). The standard curve was determined using B.D.H. cyanmethaemo-
globin standard solution diluted with Drabkin's solution and read
against Drabkin's solution. The BDH standard solution is made up in
a buffered diluent having the following composition:
50 mg KCN
200 mg K3Fe(CN)6
140 mg KH2PO4
Nonidet P40 (BDH) 1 ml
Distilled water to one litre
pH 7.0-7.4
For greater consistency, this solution was used in later estima-
tions of Lb. The same Lb solution diluted equally with either
Drabkin's solution or the buffered diluent gave almost identical
optical spectra which had the same absorbance at 540 nm.
2.6.2 The pyridine haemochromogen (Pyr) method

1.0 2.0 3.0 4.0 5-0 6.0
Lb(m g110m1)
ABS
ORB
AN
CE A
T 5
40 n
m
FIG. 2.1 Standard curve for the estimation of Lb by the cyanmethaemoglobin method.

60
In this method the haemoprotein is denatured with NaOH solution and
pyridine combines with the haem group. Reduction with Na2S204
produces a pyridine haemochromogen — two molecules of pyridine co-
ordinated to ferrous haem at the 5th and 6th coordination positions of
the iron.
Equal volumes of Lb solution and an alkaline pyridine reagent (0.2 M
in NaOH and 4.2 N in pyridine) were mixed and transferred to a cuvette.
A small amount (not more than 3 mg/ml) of Na2S204 (Laboratory Reagent
grade) was added, and the cuvette gently rotated to dissolve and mix
the Na2S204 without aerating the solution. The absorbance of the solu-
tion was immediately recorded at 556 nm against a reagent blank. (No
Na2S204 was added to the blank). A little more Na2S204 was then added
and the absorbance recorded again. The concentration of the Lb solu-
tion was then calculated using a value of 34.6 for E m M at 556 nm of
the pyridine haemochromogen (Paul et al., 1953) and assuming a mole-
cular weight of 16000 for Lb.
2.7 Purification of Lb by column chromatography
2.7.1 Preparation of DEAE-cellulose columns
Purified Lbs were obtained by chromatography on columns of DEAE-
cellulose phosphate. The columns were prepared according to the
manufacturer's instructions. Pre-swollen microgranular exchanger, type
DE52, was equilibrated with phosphate buffer ten times stronger than
the buffer used in the final stage of column equilibration (the start-
ing buffer). After degassing the suspension and removing the fines
from it, the column was poured and packed by the pumped-flow method.
All the suspension was poured into the column and immediately buffer
was pumped through the column at a rate of 45 ml/cm2 cross-sectional
area/h. Starting buffer was pumped through until the conductivity and
pH of the effluent buffer was the same as that of the starting buffer.
61
All buffers pumped through the columns were degassed and stored under
N2 to remove dissolved CO2' because carbonate and the bicarbonate ions
combine with the DEAE groups of the exchanger. The pH of the dilute
(2 mM) starting buffers used to equilibrate the columns was different
from that stated, because their buffering capacity decreases at high
dilution. For example, 2 mM phosphate buffer, nominally pH 8.0, had
an actual pH of approx. 7.7.
2.7.2 Purification on columns at pH 7.0
Initial chromatographic separations were performed at pH 7.0 as
. follows. Desalting was performed at room temperature, all other pro-
cedures in the coldroom (0-4°C). DEAE-cellulose columns (2 x 12 cm)
were equilibrated with 2 mM phosphate buffer (nominally pH 7.0) and
loaded with 80 mg Lb (estimated by the CHHb method). The Lb sample
was prepared by thawing the precipitate of crude Lb, dissolving it in
1 mM phosphate buffer (nominally pH 7.0) and desalting the solution on
a 2 x 28 cm column of Sephadex G-25, (fine or medium type), equilibra-
ted with the same buffer. The solution was allowed to stand overnight
on ice, and then centrifuged at 17000 g for 10 min to remove the small
amount of insoluble material present. The solution was then loaded
onto the colu,nn and washed in with 3 x 1 ml of 2 mM phosphate buffer,
pH 7.0. A linear gradient of pH 7.0 phosphate buffer (2 mill-20 mM,
500 g of each buffer) was then used to elute the column. With later
columns the sample was equilibrated with 2 mM buffer on the Sephadex
column and the DEAE-cellulose column eluted with 200-300 ml of this
buffer before connecting the gradient. Elution was performed at a rate
of 40 ml/h and 4 ml fractions were collected. The column effluent was
monitored at 280 nm with a Gilson UV detector and recorder. Thbos
containing a particular Lb fr,2ction tiers pooled and the 2olution con-
centrated by ultrafiltration ower an Anicon U1:10 me i -ran:.

62
High Wycombe, Bucks.). Aliquots of the concentrated ferric Lb frac-
tions were frozen in e.p.r. tubes in liquid N2 and stored in liquid N2.
The remainder of the ferric Lb fractions, the Lb02 fractions and the
minor fractions were stored at -30°C.
2.7.3 Purification using two columns
Since chromatography at pH 7.0 did not give sufficiently pure Lb
samples, another method was developed involving one column separation
at pH 8.0, followed by another at pH 5.8. The crude Lb was dissolved
in 20 DIN phosphate buffer, pH 7.0, and left for 1 h on ice. The Lb
solution was then centrifuged at 20000 for 10 min, and the small
brown pellet of insoluble material discarded. The clear supernatant
was then desalted on a Sephadex column as before, and concentrated by
ultrafiltration over a UM10 membrane to a volume of less than 3.5 ml.
It was then passed down a small column of Sephadex C-25 to remove any
remaining traces of salt. Because only ferric Lb derivatives give
e.p.r. spectra, crude soybean and cowpea Lbs (but not chickpea Lb),
were oxidized to the ferric form with K3Fe(CN)6. Oxidation and
separation of ferro and ferricyanide from the ferric Lb was performed
using a method similar to that of Geyer & Lemberg (1971). The Lb
solution was added to solid K3Fe(CN)6 to give 4 mmoles of K3Fe(CN)6
per mmole of Lb. The solution was stirred gently for 2 h at approxi-
mately 4°C and then passed through a 2 x 28 cm column of Sephadex C-25
(fine) equilibrated with 100 mM phosphate buffer, pH 7.4. The first
three-quarters of the red-brown ferric Lb band (free from ferrocyanide)
was saved. This was then equilibrated on a Sephadex column with 2 mM
phosphate buffer, nominally pH 8.0, (the starting buffer for the first
column) and left on ice overnight. The solution was then centrifuged
at 29000 for 20 min to remove the small amount of insoluble protein
present. About 60 mg of this Lb (estimated by the Pyr method) :ra.s then

63
loaded on to a DEAF-cellulose phosphate column (2.2 x 10 cm) equilibra-
ted with 2 mM phosphate buffer, pH 8.0. elution with this buffer,
followed by stepwise elution at pH 8.0 at a flow-rate of 80 mi/h,was
employed. Fractions of 1.5-3.0 ml were collected. Those containing
ferric Lb were pooled and concentrated by ultrafiltration. Bright-red
Lb02 fractions were also separated on this column. Normally two
columns at pH 8.0 were run to provide sufficient ferric Lb for one pH
5.8 column.
The ferric Lb solution from the pH 8.0 columns was then equilibrated
on a Sephadex column with 2 mM phosphate buffer (nominal pH 5.8), the
starting buffer of the second DEAE-cellulose column. About 80 mg Lb
(Fyr estimation) was loaded on to this 2.2 x 18 cm DEAE-cellulose
column which was then eluted with starting buffer, and a linear gradi-
ent of 2 mM-20 mM phosphate buffer, pH 5.8 (500 g of each buffer).
Further elution with 20 mM phosphate buffer, pH 5.8, was employed when
necessary. Elution was performed at a rate of 80 ml/h for starting
buffer elution and 50 ml/h for the gradient. The column effluent was
monitored at 280 nm as before. Five ml fractions were collected. The
fractions containing an individual Lb were pooled, concentrated by
ultrafiltration, and stored in liquid N2 until required.
2.8 Fecording of optical and ultraviolet absorption spectra
Optical (visible) and ultraviolet absorption spectra were recorded
on a Fye Unicam 3F8000 Ultraviolet Recording Spectrophotometer. The
wavelength calibration gras checked using Holmium and Didymium filters.
When the calibration was inaccurate, wavelength values were corrected
using the mid-values of the wavelength range given in the instruction
manual for the Holmium and Didymium peaks.
2.9 Polyacrylamide gel electrophoresis (PAGE)
a A Shandon Analytical Polyacrylemide Cel Electrophoresis apFluz; w,a,s

3(b)
0.14 g
100 ml
64
used (Shandon Scientific Co. Ltd., Willesden, London N.W.10). Small-
pore and large-pore gel solutions were made by mixing the appropriate
stock solutions, and the gels cast in 5 x 75 mm tubes. A discontin-
uous tris-glycine system was most frequently used: small-pore gel
7.5% acrylamide, pH 8.9; reservoir buffer, tris-glycine, pH 8.3. The
solutions for the small-pore and large-pore gels were prepared as
follows. Stock solutions were made up according to the Shandon
instruction leaflet and were similar to those of Davis (1964).
Acrylamide, N, N'-Met'nylenebisacrylamide (BIS) AND N, N, N' , N'-Tetra-
methylethylenediamine (LMED) were all Laboratory Reagent grade.
STOCK SOLUTIONS
1(a) 1(b)
TRIS 36.3 g THIS 5.7 g
1M HC1 48 ml 0.33 M H3PO4 25.6 ml
TENED 0.46 ml Water to 100 ml
2(a) 2(b)
Acrylamide 30 g Acrylamide 10 g
BIS 0.8 g BIS 2.5 g
K3Fe(CN)6 15 mg Water to 100 ml
Water to 100 ml
3(a)
Riboflavin 4 mg Ammonium
Water to 100 ml Persulphate
Water to
Small-pore Large-pore Stock Duffer soln. Solution Solution for reservoirs
1 part 1(a) 1 part 1(b) TRIS 6 g
2 parts 2(a) 2 parts 2(b) Glycine 2.8.9 g

4 parts 3(b)
1 part water
1 part 3(a)
4 parts water
Water to 1 litre
Dilute 1 in 10 for use
65
7.5% acrylamide gels of pH 6.6 were also used occasionally. pH 8.9
gels of different acrylamide concentration were made by varying the
amount of acrylamide in solution 2(a) and varying the amounts of BIS
and K3Fe(CN)6 to keep the relative proportions the same.
Protein samples, 10-200 /4g in 2-10 AL1 were added to 20 AL1 of 50%
sucrose solution and layered on top of the large-pore gel. Occasion-
ally 20 µ 1 protein samples were used, and a few crystals of sucrose
added to increase the solution's density. The gels were usually run
for 60 min in a coldroom at a voltage of 200 V and a current of 5 mA
per gel. They were then removed from their tubes and the Rm values of
the Lb bands measured before staining. This was done because the
bromophenol blue marker band disappears during both of the methods used
to destain the gels. Since Lb is a coloured protein, the values
can be measured before staining the gels. Distances were measured with
a pair of dividers and a clear plastic ruler. The error in the dis-
tance measurements was 1:0.25 mm.
2.9.1 Staining acrylamide gels for protein
The gels were placed in a solution of amido black, 1% (w/v) in 7%
(v/v) acetic acid, for 1 to 2 h. They were then destained electro-
lytically, or by repeated rinsings in 7% (v/v) acetic acid when it was
important to avoid possible movement of bends (which may occur during
electrolytic destaining). The gels were stored in 7% (v/v) acetic
acid. When R values of purified Lbs had to be measured after dcstain- 1
ing, haemin was added to the protein-sucrose solution before starting
electrophoresis. Usually a band was visible out •n front of the pro-
tein 1::,_ld.s gels of crude Lb preparations. Haemin added to thos e
gels -!ncroas s the int'on:eity of this band ('.. J. 711 rth, personal

66
communication). Thus, it was usually possible to measure the RM of
bands in crude gels after destaining. The distance moved by the
bromophenol blue band was not measured before staining if RM values
were calculated from measurements made after destaining, because gels
change in length during staining-destaining. 5 p- 1 of a solution of
haemin (250 p.g/ml) was added to each protein sample, giving 1.25 pg
haemin per gel. The haemin migrates with the bromophenol blue which
marks the boundary of the leading ion (chloride). It is not removed
during destaining, remaining as a dark, narrow band.
2.9.2 Staining acrylamide gels for Lb and peroxidases
To detect Lb, the alcoholic o-dianisidine reagent of Owen et al.
(1958) was used. Under the conditions used, Lb behaves as a peroxi-
dase, whereas true peroxidases are not usually active and thus do not
stain. After removal from their running tubes, the gels were incubated
in 0.15 M sodium acetate buffer, pH 4.7, for 30 min at room temperature
and then in an o-dianisidine reagent for 15-30 min at room tempera-
ture. The reagent was made as follows: 100 mg o-dianisidine
(Laboratory Reagent) was dissolved in 70 ml absolute ethanol. Then
10 ml of 1.5 M sodium acetate buffer was added, followed by 18 ml of
water. Immediately before use, 2 ml of H202 (100 volume strength) was
added. After removal of the reagent, the gels were rinsed twice with
0.15 M sodium acetate buffer and stored in this buffer. Lb bands
stained orange-brown, the colour being stable.
The method used to detect peroxidases was similar to that of
Seevers et al.(1971). Lb also stains as a peroxidases in this method,
but true peroxidases have a much greater peroxidase activity per,u g
protein than Lb has. The method is thus much more sensitive for
peroxidases than for Lb. An aliquot of a 1% solution of o-dianisidine
in methanol was added to 0.2 M sodium acetate buffer, pH 5.0, to give

67
a final concentration of 1 mM. The gels were incubated in this
solution for 1 h at room temperature (with one change of solution),
rinsed in distilled water and then incubated in a 1.3 mM solution of
H202 in 0.2 M sodium acetate buffer, pH 5.0, made up just before use.
The gels were left in this solution until the bands developed their
maximum stable intensity of orange-brown colour (usually 15-40 min).
The gels were then removed, rinsed in distilled water and stored in 7%
(v/v) acetic acid.
Gels stained with amido black or for peroxidase activity were
photographed in glass tubes (160 mm long, 7 mm i.d.) containing 7% v/v
acetic acid. The tubes were illuminated from below with diffuse light.
2.10 High voltage paper electrophoresis
Electrophoresis was performed on a Shandon High Voltage Electro-
phoresis apparatus using Whatman 3MM paper and sodium veronal
buffer, I = 0.05 and pH 8.5 (Thorogood & Hanania, 1963). The buffer
was prepared by adding 18.42 g of diethylbarbituric acid to 1500 ml of
distilled water, followed by 7 ml of 40% (w/v)NaOH. When the acid had
dissolved, more NaOH solution was added until the pH reached 8.5. The
volume was then made up to 2 1. The paper was 60 cm long and the
origin 20 cm from the cathode end. Lb solutions were applied as 1 cm
streaks on the origin, allowing 2 cm between streaks and 3 cm at each
end, the paper being no wider than necessary. Runs lasting 35 min
were performed at 15°C and 5 kV. The paper was removed, air-dried for
1 h and then observed under ultraviolet light. It was then stained
for protein by the method of Kunkel & Tiselius (1951).
2.11.1 Preparation of purified ferric Lb derivatives for e.p.r.
spectroscopy
All procedures were performed at 0-4°C. Approximately 0.3-0.5 ml
of purified, concentrated Lb solution (12-18 mg) was passed down a

68
column (1.2 x 18 cm) of Sephadex G-25 (fine) equilibrated with the
appropriate buffer. 20 mM phosphate buffer, pH 7.0, was used'for
acid-met (ferric LbH2O) derivatives. Other derivatives were prepared
by dissolving the following compounds in the same buffer.
Ratio of Ligand Derivative Compound used Haem (approx.)
Fluoride NaF 10 : 1
Azide NaN3 (Laboratory Reagent grade) 5 : 1
Cyanide KCN 3 : 1
Imidazole (Laboratory Reagent grade) 10 : 1
To prepare the nicotinate derivative, the required weight of
nicotinic acid (dried under reduced pressure in the presence of P205)
was dissolved in about 40 ml of distilled water and the pH adjusted to
7.0 with 1 M NaOH. The voluuac was made up to 50 ml, and 50 ml of 40
mM phosphate buffer, pH 6.8, added. The concentration of nicotinate
in the solution was such that nicotinate:haem was approximately 3:1.
The pH of the solution was measured as 6.9. (The pH of the KCN
solution was 7.4. That of the imidazole solution was also 7.4, and
was adjusted to pH 7.0 with 0.3 M H3F04.) To prepare the hydroxide
derivatives, the column was equilibrated with glycine-NaOH buffer,
pH 9.6. Formation of the nicotinate and imidazole derivatives was
checked spectrophotometrically.
The solutions of these derivatives were concentrated using dry
Sephadex G-25 (coarse) as follows. The solution was added to the
required weight of Sephadex in a glass tube having a sinter near the
bottom. After 10 min the tube was centrifuged in a 10 ml conical
centrifuge tube for 5 min at 500 E. This separated the concentrated
Lb solution from the Sephadex. A small amount of Lb remained in the
Sephadex and the sinter. When necessary, this process was repeated
to reduce the volume to approximately 0.3 ml (Lb concentration about

69
1-2 mM). This solution was then introduced into an e.p.r. tube and
frozen and stored in liquid N2.
2.11.2 E. p. r. spectroscopy
X-band e.p.r. spectra were recorded on a Varian E-12 e.p.r. spectro-
meter using 100 kHz field modulation. Samples were placed in a quartz
insert mounted in the cavity. Samples run at temperatures above 77K
were cooled by a stream of N2 gas passed through a spiral cooled in
liquid N2. The sample temperature was varied by means of a Varian
variable temperature accessory. Samples to be run below 77K were al-
ways checked first at temperatures above 77K. Samples run at tempera-
tures below 77K were cooled by He gas boiled directly from liquid He.
The sample temperature was measured using a copper-constantan thermo-
couple, one junction in melting ice, the other just below the sample
in the quartz insert. This thermocouple had been previously calibrated
against a germanium resistance. The frequency of the microwave radia-
tion was measured with a wavemeter. Field measurements were usually
made on the apparatus, or by distance measurements on the charts. g
values were calculated from the formula E = 0.71114921 where L is the H
frequency in GHz and H is the field in k gauss (see 1.7).
2.12 Amino acid analysis
Solutions of purified Lb were dialysed against distilled water and
then freeze-dried. To pyrex tubes containing a known weight (about
2.5 mg) of the protein was added 6 M HCl (1 ml acid:2 mg protein). The
contents of the tubes were then frozen in an isopropanol-solid CO2 mix-
ture and the tubes evacuated. Thawing, re-freezing and evacuation
were employed to remove dissolved air from the acid. Tubes containing
frozen solution were evacuated to 1 mm Hg pressure and sealed.
Hydrolysis was performed at 108°C for either 20 h or 70 h. The cooled
tubes were then opened and their contents filtered through a sinter to

70
remove insoluble material. HC1 was removed from the samples by
evaporation in a desiccator containing NaOH pellets. Small quantities
of water were then added to the samples from time to time and they
were frozen at-30°C C and placed in the desiccator which was then re-
evacuated. This removes all traces of HC1. The amino acids were
separated on a Technicon NC1 amino acid analyser. Tryptophan was not
determined.
2.13 Preparation of Lb02 by dithionite reduction
Samples of crude Lb or ferric Lb were reduced on a column of
Sephadex G-25 (fine or medium) banded with Na2S204 solution (Dixon &
McIntosh, 1967). The column was equilibrated with 20 mu+I phosphate
buffer, pH 7.0, and the Na2S204 (12 mg per 100 mg Lb) dissolved in 0.5
or 1 ml of this buffer and applied to the column, followed by 0.3 ml
buffer. The Lb solution was then added and the column eluted with
buffer. As the Lb passed through the Na2S204 zone it was reduced to
ferrous Lb. All the Lb was in the bright-red Lb02 form when it came
off the column. This procedure ensures that the Lb is in contact with
Na2S204 for the minimum length of time.
2.14 Preparation of nitrosyl leghaemoglobin (LbNO)
The method was similar to that of Henry & Banerjee (1973). The
oxyleghaemoglobin solution (about 1.7 ml) in 20 mM phosphate buffer,
pH 7.0, was introduced into a Thunberg tube which was placed on ice.
Repeated evacuation and refilling with 02-free N2 was used to deoxy-
genate the Lb02. (The solution was allowed to warm up to room
temperature with gentle swirling after introducing the N2). NO gas
(min. purity 99%, from Matheson Gas Products, Cambrian Chemicals,
Croydon CR9 3QL, Surrey, U.K.) was passed through a column of solid
KOH (to remove the higher oxides of N) and introduced into the Thunberg
tube to a pressure of just less than 1 atm. The NO was allowed to
71
react with the Lb solution at room temperature for 15-20 min. The
tube was then cooled in ice, gently evacuated and flushed with N2
several times to remove all excess NO. The LbNO solution was trans-
ferred aerobically to an e.p.r. tube. (No dissociation of NO from the
complex should occur during this operation — Henry & Banerjee, 1973).
The many evacuations caused a large decrease in volume of the Lb
solution, so about 0.1 ml of distilled water was added to it in the
e.p.r. tube to make the volume up to 0.3 ml. The e.p.r. tube was then
frozen in liquid N2.
2.15 The estimation of iron in samples of crude Lb
The method used was that of Cameron (1965). Solutions were made up
in double-distilled water.
Reagents were: HC104 (redistilled) 70% (w/v)
H202 30% (w/v)
Hydroxylammonium chloride -- 10% (w/v) solution
1,10-Phenanthroline — a 0.5% solution in 50% (2-Phenanthroline) ethanol
Pyridine
The Lb sample, not more than 0.1 ml of solution, containing 10-50pg
iron, was introduced into a 10 ml volumetric flask. Then 0.1 ml of
HC104 and 0.1 ml of H202 were added, and the sample digested at 100°C
for 30 min. The flasks were removed from the bath, allowed to cool and
0.1 ml of hydroxylammonium chloride solution added to reduce the iron
to the ferrous state. After 5 min, 1 ml of the o-phenanthroline solu-
tion was added, followed by 1 ml of pyridine. The solution was made up
to 10 ml with double-distilled water and its absorbance at 509 nm read.
The absorbance of a reagent blank was subtracted from the sample value.
The ferrous o-phenanthroline complex forms rapidly and is stable for
several weeks. The amount of iron in the sample was calculated using a
value of 11.0 for E mM of the ferrous-o-phenanthroline complex.

72
2.16 Detection of superoxide dismutase in acrylamide gels
The method of Beauchamp & Fridovich (1971) was used. Polya.cryla-
mide gel electrophoresis was performed by the usual method, except that
both small-pore and large-pore gels were photopolymerized with ribo-
flavin and K3Fe(CN)6 was omitted from the small-pore gel. (7.5%
acrylamide gels of pH 8.9 were used). After removal from the running-
tubes the gels were soaked in a 2.45 mM solution of nitro blue
tetrazolium (NBT) for 20 min, followed by immersion for 15 min in a
solution containing 28 mM TEMED, 2.8 x 10⁻² mM riboflavin and 36 mM
phosphate buffer, pH 7.8. The gels were then placed in small, dry
test tubes and illuminated for 5-15 min (using a 60 W transparent tube
light). They became uniformly blue, except at positions where a
superoxide dismutase band occurred. When the distinction between the
clear and blue zones was most apparent, the number of clear zones was
noted.
2.17 Estimation of the Lb content of root nodules
A large number of nodule samples were analysed at one time and this
necessitated leaving the treated nodule extracts at 0°C for several
hours before measuring their absorbances. Since haematins degrade
rapidly in aqueous alkali (Falk, 1964), the pyridine haemochromogen
method was unsuitable, and a cyanmethaemoglobin (CMHb) method (see
2.6.1) was used (Schiffmann & Lobel, 1970; Wilson & Reisenauer, 1963).
Nodulated roots were washed with tap water and the nodules picked,
blotted dry and weighed as quickly as possible. Either all of the
nodules in a sample were crushed, or a sub-sample of 0.4-0.7 g.
Nodules were placed in a 13 x 150 mm test tube, 3 ml of Drabkin's
solution added, and the nodules then crushed using a glass rod. The
supernatant was decanted into a 10 ml conical centrifuge tube along
with 2 x 1 ml and 0.5 ml washings with Drabkin's solution of the solid

73
sediment.
This extract was then centrifuged at room temperature for 15 min at
500 E. The resulting supernatant was transferred to a 10 ml volume-
tric flask, made up to volume with Drabkin's solution and mixed
thoroughly. About 5 ml of this solution was then centrifuged at
20000 E at 4°C for 30 min to sediment the bacteroids. The absorbance
of the clear supernatant at 540 nm was then recorded using Drabkin's
solution as a blank. These supernatants were often left overnight on
ice before absorbance measurement. The amount of Lb per 10 ml
volumetric flask was then read from a standard curve (see 2.6.1) and
the Lb content of the nodules (mgg fresh wt.) calculated.
2.18 The acetylene reduction assay for nitrogenase activity of
nodulated root systems
The methodology was similar to that described by Dart et al (1972).
Plants were harvested at about 10.00 h and as much as possible of the
rooting medium shaken from the nodulated roots. The plant tops were
cut off and the nodulated roots placed in 60 ml or 120 ml glass
bottles which were then sealed with a rubber septum and metal screw-
top lid having a hole in the middle for gas injection and removal.
The larger the root system, the larger the bottle used, to prevent a
significant decrease in 02 tension during the incubation. The bottles
were then returned to the controlled-environment cabinet in which the
plants had been growing and 5 to 10 min allowed for temperature equili-
bration. Ten per cent (v/v) of the air in the bottles was then
removed by syringe and an equal volume of acetylene injected. After
30 min incubation, 1 ml gas samples were removed in disposable plastic
syringes which were sealed by plunging the needle into a rubber bung.
These samples were analysed for ethylene and acetylene on a Perkin-
Elmer Fll gas chromatograph employing a Porapak N column at 100°C with

74
N2 as carrier gas and a hydrogen-air flame ionization detector.
The ethylene concentration was taken as being proportional to peak
height. During each analysis a standard mixture of 101 v.p.m. ethy-
lene in argon was used to calibrate the gas chromatograph. The amount
of ethylene (ink mol) produced per hour was then calculated as follows:
Sample C2H4 gas volume of 0.101 x 2 X
X peak (c.u.) sample bottle (ml)a 22.4 x standard C2H4
peak (c.u.)
a Measured by displacement with water from a burette after the assay.
. The original ethylene concentration in the acetylene gas was deter-
mined from blank sample bottles containing only 10% acetylene in air.
As this was less than 1% of most sample ethylene values, no blank
correction was incorporated into the calculation above.
After measurement of the gas volume of the sample bottle, nodule
fresh weight and Lb content were determined (see 2.17).
2.19 Determination of the nitrogen content of dried plant material
The tops and root systems (minus nodules) of plants which had been
assayed for nitrogenase activity were dried for at least 8 h in a
forced-draught oven at 80°C and then weighed. The top and root system
of each plant were then combined and subjected to Kjeldahl digestion.
However, if the weight of plant material exceeded 1.5 g, this was
ground in a microhammer mill (Glen Creston Ltd., Stanmore, Middlesex),
the powder mixed thoroughly and a 0.7 g sub-sample of it digested.
Samples were digested for 3 h after clearing and the volume of the
solution made up to 350 ml. Ammonium ion concentrations were then
determined with a Technicon Auto Analyser (5 ml sample injection)
using an indophenol colour reaction based on the method of Varley
(1966).

RESULTS AND DISCUSSION
Section 3
Comparison of the Cyanmethaemoglobin (CMHb) and pyridine haemochro-
mogen (Pyr) methods for the estimation of Lb
3.1 Introduction.
To estimate the Lb content of root nodules the cyanmethaemoglobin
(CMHb) method was used in preference to the pyridine haemochromogen
(Pyr) method (section 2.17). It was considered that a non-Lb iron-
containing compound might be present in crude Lb (section 7.2) and
that this would probably interfere with the CMHb estimation of Lb.
The CMHb method was therefore checked by comparing it with the Pyr
method (section 2.6.2).
3.2 The estimation of Lb in crude preparations
For a crude cowpea-CB756 Lb sample the values for Lb concentration
obtained were:
CMHb method — 3.20 mg/ml
Pyr method* — 2.75 mg/ml
(Assuming a mol. wt. of 16i500 for cowpea Lb — section 4.3.)
Thus, the value given by the Pyr method was only 86% of that given by
the CMHb method. The symbol P was adopted to denote this percentage
value. The reason for this considerable difference was investigated
further.
A solution of crude soybean Chippewa-CC705 Lb was desalted on a
Sephadex 0-25 column and concentrated by ultrafiltration over an
Amicon UM2 membrane which has a nominal molecular weight cut off of
1,000. Any low-molecular-weight iron-containing proteins present
should thus be retained. This concentrated solution was then diluted
with 20 mM phosphate buffer, pH 7.0, and the Lb concentrations deter-
mined by both methods. For the Pyr results a value of 16,000 was
75

76
taken as the average molecular weight of the soybean Lbs.
Lb concentration plotted against the dilution (Fig. 3.1) showed a
consistent difference between the values obtained by the two methods.
The average value of P was about 89%. The pyridine haemochromogen
spectrum of the most concentrated Lb sample gave a value of 2.85 for
the ratio: absorbance at oC peak: absorbance at minimum betweeno<. and
3 peaks. A sample of crude soybean Altona-CB1809 Lb, which had a P
value of 83%, and the pyridine haemochromogen spectrum shown in Fig.
3.2 gave a ratio of 2.87.
This ratio is a sensitive index of degradation and contamination
by impurities having a non-specific absorption. For recrystallized
myoglobin the value is 3.47 (Falk, 1964).
The pyridine haemochromogen spectrum thus indicated the presence
of impurities which may be responsible for the different values given
by the two methods. A low-molecular-weight iron-containing protein
might be one such impurity.
3.3 Determination of iron and Lb concentrations in crude Lb
A solution of crude soybean Merit-CC705 Lb was equilibrated with
phosphate buffer, pH 7.0, on a Sephadex G-25 column and concentrated
by ultrafiltration over a UM2 membrane. Samples (0.1 ml) of the con-
centrated solution were analysed for iron (section 2.15) and the Lb
concentration of diluted samples determined by the CMHb and Pyr
methods. The results were:
Iron concentration 184 ,ag/ml
Lb concentration: CMHb 52 mg/ml
Pyr 47 mg/ml
Iron concentrations calculated from the Lb concentrations were:
CMHb method Pyr method
181 pg/ml 164 ,g/mi (calculated directly from the
pyridine haemochromogen concen-tration)

FIG. 3.1 Lb concentration of dilutions of a crude soybean Lb solution
determined by the cyanmethaemoglobin (O O) and pyridine haemochromogen
(010----0) methods.

0.25 0.50
DILUTION FACTOR
1.0 0.75
8.0
6.0
E
0 4 . 0 z 0 U
J
2.0
FIGURE 3.1
IIIMII
MO

78
I I 1 i
500
X (nm) 600
1-0
0.5
FIG. 3.2 Optical absorption spectrum of the pyridine haemochromogen
complex from a sample of crude soybean Altona CB18O9 Lb.

79
If the CMHb method is assumed to be specific for Lb, non-Lb iron
constitutes less than 2% of the total iron in the crude preparation.
However, if the Pyr method is more specific for Lb than the CMHb
method, the latter is considerably overestimating the Lb concentra-
tion.
3.4 The Pyr and CMHb methods for the estimation of Lb in whole
nodules
Soybean Chippewa-CB1809 nodules (0.5-0.6 g) were extracted with
10 mM phosphate buffer, pH 7.2, (method as in section 2.17), and the
concentration of Lb in the supernatant from the final centrifugation
determined. Three samples from the same batch of nodules were
analysed and the Lb per g nodule fresh weight calculated (Table 3.1).
The difference between the two methods was much greater than for
desalted solutions of crude Lb. An extract of whole nodules is a
much more complex mixture than a desalted crude Lb preparation, and
this may account for the greater discrepancy.
3.5 Estimation of Lb before and after chromatography of crude Lb at
pH 8.0
Lb concentration was measured before and after DEAE-cellulose
phosphate chromatography at pH 8.0 for crude soybean and cowpea Lb
preparations. For soybean Lb, P was 83-86% before chromatography (in
agreement with previous results) and about 92% afterwards (Table 3.2).
Also, K3Fe(CN)6 oxidation of the crude Lb increased P from 83 to 89%.
In contrast, the value of P for crude cowpea-CB756 was lower after
chromatography at pH 8.0. The value of P after chromatography at pH
8.0 was similar for all the Lb preparations.
Crude Lbs contained the following impurities:
(i) peroxidases (section 5.1)
(ii) non-haem iron (section 6.2.1)

80
Table 3.1 Concentration of Lb in extracts of whole nodules deter-
mined by the CMHb and Pyr methods
Nodule mg Lb/g nodule fresh wt. (Pyr/CMHb) x 100 fresh wt. (g) CMHb Pyr
0.604 8.90 5.63 63
0.589 8.83 5.35 61
0.607 9.40 5.85 62
Table 3.2 Lb concentrations determined by the CMHb and Pyr methods
before and after chromatography on DEAE-cellulose phosphate at pH 8.0
Lb concentration (mg/ml)
SAMPLE
CMHb
Crude Lb
Pyr P%
Ferric Lb from chromatography
CMHb Pyr P%
Soybean Altona-CB1809 Lb
Soybean Merit-CC705 Lb
Same sample after oxidnb
Cowpea-CB756 Lb(b' c)
(b d) Cowpea-CB756 Lb ,
5.3
22.4
14.2
7.30
8.00
4.5
18.6
12.6
6.96
7.65
86
83
89
95
96
2.7
4.5
6.80
2.5
4.1
6.18
92a
91a
91e
a Lba and Lbc pooled.
• Oxidized with K3Fe(CN)6 — section 2.7.3
• Moderate haemin band on PAGE.
d Intense haemin band on PAGE.
e Both cowpea samples combined after chromatography.

81
(iii) 'free' haemin (section 2.9.1)
(iv) green proteins (section 5.6)
(v) a non-haemoprotein (section 4.1)
Most of the peroxidases, all the non-haem iron, 'free' haemin and non-
haemoprotein contaminant were removed from the ferric Lb fractions by
chromatography at pH 8.0. The green proteins, however, were not.
The non-haemoprotein should not contribute towards the difference in
the values for Lb concentration given by the two methods. Neither
should the peroxidases, because they will be estimated as Lb by both
methods.
A fraction from a soybean Altona-CB1809 Lb preparation (fraction 9
in section 5.3), which contained most of the peroxidases and all the
non-haem iron (section 6.2.1) gave a pyridine haemochromogen spectrum
similar to that of the original crude Lb, with peaks at 554 nm (4),
524 nm (J) and 417 nm (s). These wavelengths agree fairly well with
those of the protohaem IX pyridine haemochromogen complex: 557 nm,
526 nm and 418.5 nm (Falk, 1964), suggesting that, like Lb, these
peroxidases also have protohaem IX as their prosthetic group. If so,
they will give the same complex as Lb in the Pyr method.
Peroxidases'form cyanide complexes which have very similar optical
spectra to those of the cyanide complexes of ferric Hb and Mb (Keilin
& Hartree, 1951; Smith & Williams, 1970). Adding the buffered diluent
of the CMHb method to an aliquot of the above Altona-CB1809 peroxidase
fraction 9 changed its optical spectrum, with a shift in the Soret
peak from 406 nm to 416 nm, close to that for ferric LbCN (417 nm —
Sternberg & Virtanen, 1952). A slight peak also formed between 510
and 550 nm. Thus, these peroxidases form cyanide complexes which have
optical spectra similar to that for ferric LbCN and will be estimated
as Lb by the CMHb method.

82
The fast-moving band seen on PAGE of crude Lb preparations (e.g.
Fig. 5.10) is thought to be haemin (see section 2.9.1). This is
assumed to be protein-bound, but it is obviously distinct from the
haem group of Lb since it is separated from all the proteins in crude
Lb by PAGE. It is thus referred to as 'free' haemin. This may be
why P is greater for crude cowpea-CB756 Lb than it is for crude soy-
bean Lb (see Table 3.2), since PAGE showed that the crude cowpea Lb
preparations contained a higher concentration of this 'free' haemin.
The decrease in P for cowpea Lb fractions derived from chromatography
at pH 8.0 is probably due to the removal of this 'free' haemin. In
the Pyr method, this 'free' haemin will be converted to the pyridine
haemochromogen and thus estimated as Lb.
Because the nature of the binding of this haemin to protein is not
known, it is difficult to speculate as to what complexes will form in
the CMHb method. However, this haemin may contribute less towards
the absorbance at 540 nm than the same amount of haemin present as
Lb. This would explain the higher value of P when 'free' haemin is
present.
Nitrosyl leghaemoglobin (LbNO) present in crude Lb, while not
strictly an impurity, may be partly responsible for the difference in
values for Lb concentration given by the two methods (sections 4.4
and 7.5). Table 3.2 shows that P increases when crude soybean Merit-
CC705 Lb is 'oxidized' with K3Fe(CN)6 (section 2.7.3). K3Fe(CN)6
converts only some of the LbNO in crude Lb preparations to acid-metLb
(section 7.5). Chromatography at pH 8.0, however, removes all the
LbNO from the ferric Lb fractions, so this may be why P increases
after chromatography.
The presence of LbNO should not cause any problems in the CMHb
method, since this is performed at room temperature where the

83
dissociation of LbNO will be sufficiently rapid to enable oxidation
of all the ferrous Lb (section 7.5), with consequent conversion of
all the Lb in a crude preparation to the stable ferric LbCN complex.
However, in the Pyr method, a mixed pyridine-ferrohaem-NO complex
may form from LbNO. This should be much more stable than pyridine
haemochromogen, by analogy with the pyridine-ferrohaem-CO complex
(Wang, 1961). This latter complex has an optical spectrum of the
haemochromogen type, but its extinction coefficient at 556 nm is much
lower than that of the pyridin e.haemochromogen (Alben & Caughey,
1968). The corresponding NO complex should therefore have a similar
spectrum.
To test these predictions, a sample known to contain LbcNO and
acid-metLbc (section 7.6.1) was estimated by the Pyr method. The
optical spectrum of the sample was recorded 3 min after adding the
Na2S204 and looked similar to that of pyridine haemochromogen (Fig.
3.3, trace 1). On standing, the absorbance of the 04-and /3 peaks
increased, reaching a maximum after about 20 min. The final spectrum
resembled more closely that of pyridine haemochromogen (cf. Fig. 3.3,
trace 2 with Fig. 3.2). The Lb concentrations calculated from the
initial and final spectra were 2.54 mg/ml and 3.05 mg/ml respectively.
These spectra suggest that some pyridine-ferrohaem-NO is formed
initially, the rest of the haem being in the pyridine haemochromogen
form. On standing, the mixed complex is completely converted to the
pyridine haemochromogen. Any NO which dissociates from the mixed
complex will be reduced by the Na2S204 present (Hardy & Knight, Jr.,
1967). Pyridine will then occupy the vacated sixth coordination
position of the ferrohaem.
The methodology of the Pyr estimation is thus critical. Since the
absorbance at 556 nm is read immediately after the addition of

0.6
0.2
0.4
1
84
500
X (nm)
FIG. 3.3 Optical absorption spectra of a sample containing LbcNO
and acid-metLbc subjected to the Pyr method. Spectra were recorded
after adding the Na2S2O4 : 1,3 min later; 2,20 min later, after
which no further change in the spectrum was observed. (Intermediate
spectra were recorded but are omitted from the figure for the sake
of clarity.)
600

85
Na2S204, an erroneously low reading may be obtained for a crude Lb
sample if it contains appreciable amounts of LbNO. As the sample
absorbance was always read within 5 min of adding the Na2S204, it is
not known whether it would have increased on standing. The spectra
above show that this is possible. This would explain, in part, the
different values given by the Pyr and CMHb methods.
It is not clear why P is less than 100% after chromatography at pH
8.0. The only significant impurity detected in the ferric Lb
fractions from the pH 8.0 columns was the green protein; probably a
. product of Lb catabolism (section 5.6.3). The ratio: absorbance at of
peak : absorbance at the trough between °Land 13 peaks for the pyridine
haemochromogen spectrum of one ferric Lb fraction was 2.91, indicative
of contamination (section 3.2). If the green protein contributes more
towards the CMHb estimation of Lb than it does towards the Pyr
estimation, this will account for the difference in Lb concentration
values between the two methods.
The absorbance at 540 nm of the B.D.H. standard cyanmethaemoglobin
solution (section 2.6.1) was 0.39. This value was in agreement with
that calculated by taking E, at 540 nm of HbCN as 11.0 and the
molecular weight of human Hb as 64,500 (van Assendelft & Zijlstra,
1975). This confirms the accuracy of the standard curve for the CMHb
method and suggests that the difference between the values obtained
by the two methods is caused by contaminants in the sample.
Virtanen & Laine (1946) concluded that the green pigment in legume
root nodules resembled choleglobin and contained either ferrous or
ferric iron (section 1.3). However, in model systems the degradation
of haem appears to occur via its ferrous form (Brown & King, 1976),
so it is reasonable to assume that in vivo the green pigment contains
ferrous iron. Its prosthetic group may form a bispyridine complex,
86
but this will have a different optical absorption spectrum from that
of pyridine haemochromogen (because of the modified porphyrin' ring),
probably having a much lower absorbance at 556 nm than pyridine
haemochromogen.
In the CMHb method the iron in the green protein will probably be
oxidized to the ferric state by K3Fe(CN)E and then combine with CN
giving a complex which may have a spectrum with an appreciable
absorbance at 540 nm. Thus, the presence of the green protein in a Lb
sample would result in a greater overestimation of Lb by the CMHb
method than by the Pyr method.
3.6 Conclusion
For crude Lb samples, the Lb concentration given by the Pyr method
may be too low and that given by the CMHb method may be too high.
The Pyr method is probably more accurate than the CMHb method for Lb
samples which have been purified on DEAE-cellulose phosphate columns
at pH 8.0 and contain green protein. This could be checked by analys-
ing these samples for iron and using PAGE to determine the relative
amounts of green protein and Lb. The amount of Lb iron could then be
calculated and compared with the values obtained from the Pyr and
CMHb methods.
The low value given by the Pyr method compared to the CMHb method
for the Lb concentration in extracts of whole nodules (section 3.4)
may be due to the presence of a relatively high concentration of LbNO
in these extracts. Since LbNO decays gradually at 0°C (section 7.3),
there should be less LbNO in crude Lb preparations than in extracts
of whole nodules,because some of it will decay during purification.
Thus, the accuracy of the particular method depends on the nature
of the Lb sample. The lower the purity of the sample, the greater
the difficulty in obtaining a realistic value for Lb concentration.

87
The Pyr method should be modified when LbNO is present by leaving the
sample until the absorbance at S56 nm reaches a maximum.

88
Section 4
Purification of Lb at pH 7.0
4.1 Analysis of crude Lb by PAGE
Solutions of crude Lb in 1 or 2 mM phosphate buffer, nominally
pH 7.0, were analysed by PAGE. RM values of the red Lb bands were
usually measured before staining, but were also measured relative
to the haemin band after staining. On staining with amido black,
gels of all the crude soybean Lb preparations showed two Lb bands
(see Fig. 4.1). From the RM values (Table 4.1) the two bands were
taken as representing the same two Lbs in each case; the electro-
phoretically slower and faster components of Ellfolk (1960a). The
Lb pattern in soybean did not vary with any of the plant cultivar-
bacterial strain combinations examined. These results are in
agreement with those of Cutting & Schulman (1971). Dilworth
(1969) obtained similar results for other host species.
Only one Lb band was found for the two Rhizobium strain (SU318
& CB756) - cowpea (cultivar Poona) combinations and for CB756 -
Vigna mungo. The RM values of the Lb band in the two cowpea pre-
parations were similar (Table 4.1), so it was assumed that the
same Lb was produced in each case. Vigna mungo Lb has an RM value
similar to that of cowpea Lb, but this does not necessarily mean
that it closely resembles cowpea Lb. Crude Lb from CB756 - Vigna
radiata gave two Lb bands having different RM values from those of
the soybean Lb bands and the Lb bands of the other Vigna species.
Gels of crude soybean Norchief-CB1809, Chippewa-CC705 Lb and
the crude Lbs from other species investigated were stained for Lb
using the o-dianisidine reagent of Owen et al. (see 2.9.2). In
every case the number of Lb bands observed was the same as that
found by noting the number of red bands before staining (see Fig.

89
Fig. 4.1
4610 ism. MID
411111. 011111.
1 2 3 4 5 6
Acrylamide gels of crude soybean Lb preparations stained for protein
with ainido black (section 2.9.1). (All gels shown in the photographs
have an acrylamide concentration of 7.5% and were electrophoresed at
pH 8.9 — section 2.9.) 1, Merit-CC705; 2, Altona-CB1809; 3,
Altona-CC705; 4, Chippewa-CC705; 5, Chippewa-CB1809; 6, Norchief-
CB1809. Band z and the green protein contaminant band between the Lb
bands are indicated.

0.59
Legume-strain combination
Cowpea-S018
Cowpea-CB756
V. mungo-CB756
V. radiata-CB756
Rm values for the Lb fraction(s)
0.64 (2)
o.66 (1)
0.64 (1)
0.77 (2)
90
Table 4.1 PAGE of crude Lb preparations
Soybean cultivar - RM values of the Lb Fractions
Fthizobium strain combination Slower Faster
Merit-CC705 0.56 0.73 (2)a
Altona-CB1809 0.56 0.75 (3)
Norchief-CB1809 0.54 0.72 (2)
Chippewa-CB1809 0.51 0.70 (1)b
Chippewa-CC705 0.51 0.69 (3)b
Cowpea (Vigna unguiculata, cv. Poona), Vigna mungo and Vigna
radiata Lb
a The number in parenthesis is the number of determinations used
to calculate the mean.
b RM values measured after long storage of the gels. This may
account for the slightly lower values.

91
4.2) .
Several minor bands were visible in the amido black-stained
gels of the crude Lb preparations, showing that contaminating pro-
teins were present. One major contaminant band (designated band z
and arrowed in Fig. 4.1), present in large amounts in some
preparations, did not stain with the o-dianisidine reagent, showing
that it was not a minor Lb. However, in the o-dianisidine-stained
gels, one faint orange band was seen in the Norchief-CB1809 and
Cowpea-SU318 and CB756 gels (Fig. 4.2). These bands are probably
peroxidases retaining some activity at low pH (see 2.9.2).
4.2 Elution patterns of Lbs from DEAE-cellulose phosphate columns
at pH 7.0
A typical pattern of elution of soybean Lb fractions from a DEAE-
cellulose phosphate column at pH 7.0 is shown in Table 4.2. A
narrow brown-grey band always remained on top of the bed after all
the Lb fractions had been eluted.
For cowpea Lb a brown-red fraction was eluted first, followed by
a bright-red fraction and then two, or sometimes three, pink-red
minor fractions. Thus cowpea Lb has only one major brown-red
fraction and one major bright-red fraction, as against two of each
for soybean. However, a minor Lb may have been present, but column
loadings were too small for this to be detected.
The contents of the tubes at the middle of each eluted Lb peak
were pooled, and the optical absorption spectrum of the solution
recorded as soon as possible. The first brown-red fraction from
the soybean Lb column had a spectrum typical of predominantly high-
spin ferric Lb (Table 4.3), while the major bright-red fractions
had spectra similar to, but not identical to, that of Lb02. For
example, the oC peak was at a slightly shorter wavelength than

Fig. 4.2
92
•
1 2 3 4
Acrylamide gels of crude Lb stained for Lb with the alcoholic o-
dianisidine reagent of Owen et al. (1958) -- section 2.9.2. 1 & 2,
soybean Norchief-CB1809; 3, soybean Chippewa-CC705; 4, cowpea-
SU318. The position of the faint bands (probably peroxidases) is
indicated.

Fractiona
1st fraction brown-red
93
Table 4.2 Elution pattern of soybean Merit-CC705 Lb from a
DEAE-cellulose column equilibrated with 2 mM phosphate buffer,
pH 7.0
2nd fraction bright-red
3rd fraction brown-red
4th fraction bright-red
Vol. of buffer required to begin eluting fraction from column
Approx.' volume of fraction (ml)
60 ml starting - buffer 50
120 ml of gradient 60
320 ml of gradient 90
536 ml of gradient 90
Minor fraction Eluted before the end of
Not determined pink-red
the gradient
a 200 ml of starting buffer was pumped through before connecting
the gradient.

94
Table 4.3 Optical absorption spectra of soybean and cowpea Lb
fractions eluted from columns of DEAE-cellulose phosphate at
pH 7.0
Lb fraction Band Position (nm)
cc )3
Comments Zr
Soybean Merit-CC705
1 628 564(sh) 527(sh) 495.5 402 Spectra recorded
2 569.5 541 413 within 3 h of elution
3 Sample too dilute 403 from column
4 571 541 411
Minor
Soybean
568(sh) 536 403a Spectra recorded after several days storage and ultra-filtration
Norchief-CB1809
2 626a 568(sh) 535 N.D. at 0-4 C
4 629a Sample too dilute 404
Cowpea-CB756
626 562(sh) 531 b 403 Spectra recorded
1
2 572 540 412.5 within 12 h of elution from column
(sh) indicates shoulder.
a Sample has autoxidized.
b Only a small peak present.
N.D. - not determined.

95
expected. Later work showed that nitrosyl leghaemoglobin
(LbNO) was present in all the bright-red, 'Lb02' fractions (see
7.5). Wavelengths of the peaks of the spectra of these fractions
are consistent with the present of LbNO. The spectra of the minor
fraction from the Merit-CC705 column and fractions 2 and 4 from
the Norchief-CB1809 column indicate the presence of ferric Lb
(Table 4.3). This is due to the autoxidation of Lb02 in these
ferrous fractions during storage and ultrafiltration (see 5.5).
The spectrum of the cowpea brown-red fraction differed from
that of high-spin ferric Lb because a peak was present at S31 nm
instead of a shoulder. However, this is probably due to contamin-
ation with a small amount of the bright-red Lb02 fraction. E.p.r.
investigation of the ferric fraction from a similar column
confirmed this (see 4.4).
PAGE of the Lb fractions eluted from a soybean Merit-CC705 Lb
column, and of the crude Lb applied to it, showed that the first
two fractions eluted had the same RM value as that of the slower Lb
component (see Fig. 4.3 and Table 4.4). The third fraction had an
RM value similar to that of the faster component. Thus, in soybean
Lb, the ferric and ferrous forms of the electrophoretically slower
Lb are eluted first, followed by the ferric and ferrous forms of
the electrophoretically faster Lb. This order of elution is in
agreement with that found by Ellfolk (l960a) for a DEAE-cellulose
acetate column at pH 5.2. Using his terminology the second fraction
eluted from the column was designated Lba02, and the fourth Lbc02.
Ellfolk (1960a) also detected smaller b and d fractions of
ferric Lb. The elution profile of crude soybean Lb published by
Appleby et al. (1975) confirmed Ellfolk's observation and demon-
strated that the amounts of these ferric Lbs were small compared to

96
Fig. 4.3
-does°
1 2 3 4 5 6 7 8 9
Acrylamide gels of crude soybean and cowpea Lb preparations applied
to DEAE-cellulose phosphate columns at pH 7.0 and the Lb fractions
eluted from the columns. The gels were stained with amido black.
1, crude soybean Merit-CC705; 2, Lba (2)A1); 3, Lba (5µl); 4,
Lba02; 5, Lbc (2p1); 6, Lbc (5)A1); 7, crude cowpea-CB756; 8,
ferric Lb; 9, Lb02. The haemin band in gel 7 is indicated.

Table 4.4 PAGE of soybean and cowpea Lb fractions eluted
from DEAE-cellulose phosphate columns at pH 7.0
Lb sample RM values of components
Slower Faster
Soybean Merit-CC705
Crude 0.56
0.73 frn l 0.55
frn 2 0.55
frn 3 0.74
Cowpea-CB756
Crude o.66
frn 1 0.63
frn 2 0.65
Values are the mean of 2 determinations.
No haemin band was visible in the gels of the fractions from
the columns (see Fig. 4.3).
97

98
Lba and Lbc (Lbc consists of Lbcl + Lbc2). Fractions b and d
were not detected in the elution profiles of the pH 7.0 columns or
in acrylamide gels of the major fractions from these columns. This
is presumably because the amount of Lb applied to the columns was
relatively small,. so these fractions would only be present in very
small amounts and may have been eluted with the 'Lb02' fractions.
With cowpea Lb, the ferric form of the single Lb is also eluted
before the ferrous form (Fig. 4.3 and Table 4.4). Once again a
minor Lb may be present in crude cowpea Lb, but it will only be
present in relatively small amounts and thus not be detected.
PAGE of the soybean Lb fractions Lba and Lbc (amido black-stained
gels) showed that they were contaminated with other proteins (Fig.
4.3). The Lba fraction had one contaminant band running slower
than the Lb band, and another faint band running faster. The Lbc
fraction had four faint contaminant bands.
4.3 Amino acid analysis of cowpea Lb
Samples from the major ferric Lb fraction of cowpea-CB756 Lb
purified at pH 7.0 were analysed. After hydrolysis a relatively
large amount of insoluble black material remained —more than was
expected from the breakdown of tryptophan. It was thus not possi-
ble to calculate accurately the weight of each amino acid residue
per 100g of protein. However, the weights of each amino acid
residue in the whole sample were totalled and this value taken as
representing the weight of protein hydrolysed to amino acids. The
value will be too low because the contributions of tryptophan
(completely destroyed), some of the serine and threonine (partially
destroyed) and some of the isoleucine and valine (not completely
released from peptides after 20h hydrolysis) cannot be included.
Values of grams of amino acid residue per 100g protein were then

99
calculated. Mean values were then used to calculate the molar
ratios of the amino acid residues (Table 4.5), except for shrine
and threonine, where zero-time values were obtained by extrapola-
tion. For proline, valine and isoleucine the 70h hydrolysis
value was taken.
Assuming 2 arginine, 4 isoleucine and 3 proline residues per
molecule, the number of residues of each amino acid per Lb molecule
was calculated (Table 4.6). Some doubt exists as to the number of
residues per molecule for the amino acids : alanine, aspartic acid
plus asparagine, glutamic acid plus glutamine, leucine, lysine,
tyrosine and valine. Assuming three tryptophan residues per mole-
cule (Ellfolk, 1961a) and one haem group, the molecular weight of
the protein was calculated to be between 16,000 and 17,100.
The amino acid composition of cowpea Lb is strikingly similar to
that of the major Lb from the root nodules of snake bean — Vigna
sinensis (L.) Savi ex. Hassk ssp. sesquipedalis (L.) (Broughton &
Dilworth, 1971). The two proteins appear to differ slightly only
in their contents of alanine, glycine, isoleucine and serine (see
Table 4.6). A comparison of the sequences of these two proteins
would be very interesting. Since on taxonomic grounds the plants
appear to be closely related, extensive similarities in the
sequences of these two Lbs might be expected.
Broughton & Dilworth (1973) compared the amino acid compositions
of the major Lbs from yellow lupin, serradella, soybean and snake
bean. In common with mammalian myoglobins, all had high alanine,
aspartic acid plus asparagine, glutamic acid plus glutamine, leucine,
lysine, serine and valine contents and no cysteine. These authors
deduced from their comparisons that snake bean Lb (and thus also
cowpea Lb) was related to the soybean Lbs. This result is not un-

Table 4.5 Amino acid analysis of cowpea Lb. Grams of amino
acid residue per 100g of protein
Amino acid
Time of hydrolysis Mean or extrapolated
value MOLAR RATIOa
20h 70h
Ala 12.67 12.54 12.61 0.1774
Arg 2.00 1.99 2.00 0.0128
Asp+Asn 10.46 10.91 10.69 0.0929
Cys 0 0 0 0
G1u+Gln 11.50 11.26 11.38 0.0881
Gly 3.85 3.79 3.82 0.0669
His 1.85 1.95 1.90 0.0139
Ile 2.82 2.98 2.98b 0.0263
Leu 10.42 9.99 10.21 0.0902
Lys 13.91 13.23 13.57 0.1059
Met 0 0 0 0
The 7.03 6.70 6.87 0.0467
Pro 1.91 2.02 2.02b 0.0208
Ser 3.81 3.16 4.07c 0.0467
Thr 3.85 3.51 3.98c 0.0394
Tyr 4.86 5.13 5.00 0.0306
Val 9.06 10.85 10.85b 0.1094
a g residue per 100g protein =- residue MW.
b The 70h value only.
c Value obtained by extrapolation to zero time.
100

Table 4.6 Amino acid composition of cowpea Lb. Number of
amino acid residues per molecule
Amino acid
No. of residues calculated on the basis of the following assumed composition
ARG(2) ILE(4) PRO(3)
Nearest integer
Ala 27.70 26.98 25.59 26-28 (30)a
Arg 2.00 1.95 1.85 2 (2)
Asp+Asn 14.52 14.12 13.40 13-15 (15)
Cys 0 0 0 0 (0)
Glu+Gln 13.76 13.39 12.71 13-14 (13)
Gly 10.45 10.17 9.65 10 (11)
His 2.16 2.11 2.00 2 (2)
Ile 4.10 4.00 3.79 4 (3)
Leu 14.10 13.72 13.01 13-14 (14)
Lys 16.54 16.11 15.27 15-17 (16)
Met 0 0 0 0 (o)
The 7.30 7.10 6.74 7 (7)
Pro 3.26 3.16 3.00 3 (3)
Ser 7.30 7.10 6.74 7 (8)
Thr 6.16 5.99 5.68 .6 (6)
Tyr 4.78 4.65 4.41 4-5 (5)
Val 17.10 16.64 15.78 16-17 (16)
a Number of residues per molecule for the major Lb from snake bean
(Broughton & Dilworth, 1971) given for comparison.
101

102
expected, since the tribes from which these plants come, the
Phaseoleae and Glycineae respectively, have many attributes'in
common.
Snake bean and cowpea Lb differ from the soybean Lbs in having
only three proline residues per molecule (the soybean Lbs have
five). Proline disrupts the oC -helical structure of proteins,but
interestingly, circular dichroism studies of soybean Lba and snake
bean Lb show that they have a similar e4 -helix content and overall
polypeptide chain conformation (Hurrell et al., 1976).
4.4 E. p. r. spectroscopy of ferric Lbs purified on DEAE-cellulose
phosphate columns at pH 7.0
Samples of the two soybean ferric Lbs and the ferric and
ferrous forms of the major cowpea Lb (see 2.7.2 for preparation)
were examined by e.p.r. spectroscopy at liquid N2 temperatures
(86-100K). The ferric Lbs were assumed to be in the acid-met form
(ferric Lb H20).
The Lba samples gave spectra with a signal at g = 6, but no
signal in the E = 2 region. The same is found for acid-metMb and
Hb at 77K (Curd et al., 1967 & Nakano et al., 1971). The Lbc
samples, however, showed the E = 6 signal and also a large narrow
signal in the , = 2 region. This signal was identical to one
which had been previously observed in all samples of crude soybean
and cowpea Lb examined by e.p.r. spectroscopy at 86-100K. It was
later shown to originate from ferrous LbNO (nitrosyl leghaemoglobin
--see section 7.5) and is referred to hereafter as signal R. The
major cowpea ferric Lb showed a signal at g = 6 and a small signal
at E = 2, probably representing a trace of the species responsible
for signal R (see 4.2). The major ferrous Lb fraction from the
same column showed a small E = 6 signal indicating some autoxidation

103
of the Lb02, and a massive signal R.
The e.p.r. spectra of these ferric Lb samples were then
recorded at liquid He temperatures (8-31K). Typical spectra are
shown in Fig. 4.4 and the a values measured from all the spectra
are collected in Table 4.7.
The spectra differed markedly from that of acid-metHb recorded
at 20-40K (Nakano et al., 1971) in the following ways.
1. They had a broader absorption derivative at a = 6.
2. The spectra of the Lba samples had a a = 2 absorption which was larger than that observed in the spectra of acid-metMb and
acid-met Hb.
3. The Lbc samples, which showed signal R in their e.p.r.
spectra at liquid N2 temperatures, had a a = 2 signal which was
larger than that of the Lba samples (cf. spectra (b) & (a) of Fig.
4.4). This is because of the presence of signal R. A large
signal R was still observed when the spectrum of the cowpea
ferrous Lb sample was recorded at 10K. The signal had almost the
same shape as it had at 86-100K. This means that the az value of
high-spin Lbc cannot be measured accurately from these spectra (see
Table 4.7).
4. They all showed pronounced low-spin absorptions near a = 1.72, 2.28 and 2.73 (see Table 4.7). Similar absorptions were present
in the spectra of acid-metHb recorded at 4.2-40K (Nakano et al.,
1971), but they were much smaller relative to the size of the a =
6 absorption derivative. The e.p.r. spectrum of acid-metMb at
77K has no low-spin absorptions, this derivative being entirely
high-spin at these temperatures (Iizuka & Kotani, 1969).
5. These Lb spectra also contained another low-spin absorption
near a = 3.08 (Table 4.7) which is not present in the acid-metHb

FIG. 4.4 E. p. r. spectra of ferric as purified on DEAE}-cellulose
phosphate columns at pH 7.0. The Lbs were assumed to be in the acid-
met form. (a) soybean Merit-CC705 Lba at 8 K; (b) soybean Norchief-
CB1809 Lbc at 31 K and (c) cowpea-CB~56 Lb (second sample — see
Table 4.7) at 20 K. Microwave power: (a) & (b) 0.02 mW; (c) 2 mW.
For all the e.p.r. spectra shown (except that of Fig.7.3),
the relationship between £ value and magnetic field
strength (H) is illustrated by the following values :
• H(kG)
6.00 1.10
4.30 1.53
3.10 2.12
2.70 2.43
2.26 2.91
2.00 3.29
1.73 3.80

c
i 1
Fig. 4.4
2.5 H (kG)
1.5 3.5
104
r

Table 4.7 Effective g values of the high-spin and low-spin
features in the e.p.r. spectra of ferric Lbs purified at pH 7.0
Lb sample
gx
High-spin features
gZ gy
Soybean Merit-CC705 Lba 6.00 6. oo 2.00
Soybean Norchief-CB1809 Lba 5.97 5.97 2.00
Soybean Merit-CC705 Lbc 6.00 6.00 a
Soybean Norchief-CB1809 Lbc 6.00 6.00 a
Cowpea-CB756 ferric Lb 6.00 6.00 2.00
Cowpea ferrous Lbb 6.02 6.02 a
Cowpea-CB756 ferric Lb (second sample)
5.96 5.96c 1.99
Low-spin features
Soybean Merit-CC705 Lba 1.72 2.28 2.73 3.08 Soybean Norchief-CB1809 Lba 1.74 2.26 2.72 3.08
Soybean Merit-CC705 Lbc 1.75 2.25 2.70 d
Soybean Norchief-CB1809 Lbc 1.74 2.26 2.71 3.07
1.86 2.19 2.52
Cowpea-CB756 ferric Lb 1.73 2.25 2.71 3.06
1.87 2.19 2.52
Cowpea-CB756 ferric Lb (second sample)
1.70 2.24 2.72 3.06
A small absorption at g = 4.3 was present in all the spectra. a Impossible to measure accurately because signal R was present.
b Autoxidation producing ferric Lb.
c A feature at g = 5.46 was clearly resolved. d Only a slight absorption was present.
105

106
spectra.
6. One Lbc sample and one cowpea ferric Lb sample showed a set
of low-spin absorptions near g = 1.86, 2.19 and 2.52 (see Table
4.7 and Fig 4.4(b)) which appear to be from ferric Lb hydroxide
(see 6.4). However, they are much larger than the corresponding
absorptions which are just visible in the spectrum of acid-metHb
recorded at pH 7.0 and 20K and originate from ferric Hb hydroxide
(Nakano et al., 1971).
7. All these Lb spectra showed a small absorption at E = 4.3.
A similar but smaller absorption is just visible in the acid-metHb
spectra.
Some of the differences between these Lb e.p.r. spectra and
those of Hb and Mb were thought to be due to contamination of the
Lb samples with peroxidases, so a new purification procedure was
developed in an attempt to separate peroxidases and the species
responsible for signal R from the ferric Lbs (section 5). The
nature and possible origin of the differences described here is
discussed in section 6.
Provided that any contaminants do not have e.p.r. spectra which
obscure the spectra of high-spin ferric Lb, high-spin Lba and
ferric cowpea Lb both have g values close to 6.0 and 2.0, and high-
spin Lbc has Ex and g__ values close to 6.0 (Table 4.7). These Lb
derivatives thus resemble high-spin acid-metHb and Mb (Nakano et
al., 1971; Bennett et al., 1957).

107
Section 5
Development of an improved method for purifying Lb using two columns
5.1 Detection of peroxidases in samples of crude Lb after PAGE
The peroxidases of legume root nodules have been the subject of
only a few investigations (e.g. Moustafa & Flux, 1966).
One minor band was present after alcoholic o-dianisidine staining
(the reagent of Owen et al.) of the crude soybean Lb and cowpea Lb
gels (section 4.1). It may be due to a peroxidase enzyme, although
these are not supposed to react with this reagent at this pH. It was
probably not a minor Lb because no red band was visible before stain-
ing. Since it was important that the purified Lb fractions be free of
peroxidase contaminants, a sensitive method of detecting peroxidases
was required to monitor the purification procedure.
7.5% acrylamide gels, loaded with crude soybean Chippewa-CC705 Lb
and run at pH 8.9, were stained with either alcoholic o-dianisidine
(for Lb) or for peroxidases by the method of Seevers et al. (1971) —
see section 2.9.2. As expected, the gels stained for Lb showed one
minor band in addition to the two Lb bands. Those stained for peroxi-
dases showed two orange-brown bands corresponding to the Lb bands.
These bands were distinct, but widened by diffusion (Fig. 5.1). At
least five contaminant bands were visible above the Lb bands, and
possibly another between the Lb bands. The bottom part of these gels
was a faint yellow-brown colour, as was a gel run without a sample.
This is due to ammonium persulphate, the catalyst used to polymerize
the small-pore gel.
During the first stage of staining for peroxidases —incubation in
the solution of o-dianisidine in acetate buffer — two brown bands
appeared. On addition of the H202 in acetate buffer these bands became
more intense, staining like peroxidases. They may be oxidase enzymes

Fig. 5.1
108
:1 1 2 3 4 5 6
Acrylamide gels of crude soybean Chippewa-CC705 Lb stained for
protein with amido black (gels 1 & 2); for Lb with the alcoholic
o-dianisidine reagent (gels 3 & 4) and for peroxidases by the method
of Seevers et al. (1971) — section 2.9.2 (gels 5 & 6). The Lb
bands in gels 5 & 6 are broadened by diffusion: the position of
their centres is indicated.

109
(Maehly, 1954) and are referred to hereafter as 'oxidase' bands. Lb
bands do not stain during this first stage, so at pH 5.0 Lb has no oxi-
dase activity towards o-dianisidine. This is contrary to the sugges-
tion of Thorogood (1963) that ferric Lb has a "primitive" oxidase
capacity at acid pH.
Samples of the same crude Lb preparation were run in 7.5% acrylamide gels at pH 6.6. Gels were stained either with amido black, or for
peroxidases. During the first stage of the staining for peroxidases,
one brown 'oxidase' band appeared after about 15 minutes. It corres-
ponded to a faint band just above the slow Lb band in the amido black-
stained gels. After incubating the gels in H202-acetate buffer, the
'oxidase' band was sharp and distinct. The Lb bands were orange-brown
and diffuse, difficult to distinguish against the background. A yel-
low-brown band, also visible on amido black staining, was present in
front of the fast Lb band.
The method of Seevers et al. is thus very suitable for checking the
Lb fractions for contamination by peroxidases.
5.2 Purification of Lb on gradient-eluted DEAE-cellulose phosphate
columns at pH 5.8
Introduction
From the position of the 'oxidase' bands in the pH 8.9 and pH 6.6
gels it was deduced that the single 'oxidase' band visible in the pH
6.6 gels would have no net charge at a pH of about 6.o. A DEAE-cellu-
lose column at pH 5.8 should thus separate this contaminant from the
Lbs (which should still be negatively charged, having isoelectric
points of 4.7 (Lb a) and 4.4 (Lb c) (Ellfolk & Virtanen, 1950) . The
'oxidase' should not bind to the exchanger, but the Lbs should bind
about as tightly as they do at pH 7.0
Sample preparation and column separation

110
Two DEAE-cellulose columns equilibrated with 2 mM phosphate buffer,
nominally pH 5.8, were used to purify crude soybean Altona-CB1809 Lb.
Column 1 (1.1 x 12 cm) was loaded with 18 mg Lb (Pyr estimation);
column 2 (2.2 x 15 cm) with 36 mg Lb (Pyr estimation). Both columns
were eluted with starting buffer, followed by a linear gradient of 2-
20 mM phosphate buffer, pH 5.8. The gradient volumes were: 1, 2 x
125 ml; and 2, 2 x 500 ml.
The sample for column 1 was equilibrated with 2 mM phosphate buffer,
pH 5.8, on a Sephadex G-25 column, left overnight on ice and centri-
fuged (see 2.7.2) before being loaded onto the column. The sample for
column 2 was oxidized with K3Fe(CK)6 (see 2.7.3) to increase the
amount of ferric Lb in it, before being loaded onto the column in 2 mM
phosphate buffer, pH 5.8.
Both columns showed the same elution pattern. The Lb fractions
were eluted in the same order as they are at pH 7.0. The starting
buffer eluted the Lba, and the gradient eluted Lba02 followed by Lbc.
Further elution with 20 or 30 mM buffer was required to elute Lbc02
(in contrast to the pH 7.0 columns). The Lb02 fractions from column 2
were not expected and indicated that not all the Lb02 had been oxidi-
zed.
Purification achieved by columns 1 and 2
The fractions (concentrated by ultrafiltration) were analysed by
PAGE and gels stained either for protein or peroxidases. Amido black-
stained gels of Lba and Lbc from column 1 showed a contaminant band
just above the Lb band. Several faint contaminant bands were visible
near the top of the Lba gel. Gels of Lba and Lbc from both columns,
stained for peroxidases, showed contaminant bands above the Lb bands.
However, the level of peroxidase contamination was much lower than in
crude Lb (cf. gels 3, 4, 6 & 7 with gels 2 & 5 of Fig. 5.2), and no

Fig. 5.2
111
1 2 3 4 5 6 7
Acrylamide gels of crude soybean Altona-CB1809 Lb chromatographed
on columns 1 and 2 at pH 5.8, and ferric Lb fractions eluted from
the columns. Gel 1 stained with amido black, gels 2-7 for peroxi-
dases. 1 & 2 crude Lb applied to column 1; 3 & 4, Lba and Lbc
respectively, eluted from column 1; 5, crude Lb applied to column
2; 6 & 7, Lba and Lbc respectively, eluted from column 2.

112
'oxidase' bands were seen during the staining of the Lba and Lbc gels.
Two peroxidase bands, seen in the large-pore gel of the crude lb gels,
were not present in the Lba and Lbc gels. K3Fe(CN)6 oxidation did not
appear to have an adverse effect on the ferric Lbs as judged from a
comparison of the elution patterns of the two columns and PAGE of the
ferric Lbs eluted from them.
E. p. r. spectra of Lba and Lbc from both columns, recorded at liquid
N2 temperatures, gave the expected g = 6 signal, but no signal at g =
2. Thus the species responsible for signal R in Lbc fractions from
the pH 7.0 columns either decays rapidly at acid pH, or is effectively
separated from the Lbc fractions by chromatography at pH 5.8.
Chromatography at pH 5.8 thus effects a considerable purification
of the ferric Lbs. To obtain ferric Lbs of greater purity, it was
decided to employ another DEAF1-cellulose phosphate column at a differ-
ent pH, as well as the pH 5.8 column.
The stability of Lb at pH 5.8
Thorogood (1957) believed that Lb was converted into a soluble
green pigment by exposure to mildly acidic conditions. In her electro-
phoretic separations (1963), green protein was separated from the Lb
after a few minutes electrophoresis at pH 8.6. The following soybean
Altona-CB1809 Lb samples were examined by high voltage paper electro-
phoresis at pH 8.5 (section 2.10). Loadings were approx. 200p.g.
1. Crude Lb in phosphate buffer, pH 7.0, stored in the deep-freeze at -30°C
2. Lbk, stored under the same conditions
3. Lba stored in phosphate buffer, pH 7.0, in liquid N2
4. Lbs a and c in pH 5.8 buffer, stored in liquid N2
No fast-moving green spots were seen during, or at the end of,
electrophoresis. After drying, the paper was stained for protein (see
2.10). The spots of Lba and Lbc (samples 2-4) showed some tailing,

113
but no other spots were present. With the crude Lb sample, a spot
which had migrated cathodally was present and some insoluble material
at the origin. However, these spots were not green before staining,
so chromatography at pH 5.8 and storage at pH 5.8 in liquid N2 do not
cause any detectable conversion of ferric Lbs to green proteins.
Two samples from the same crude Altona-CB1809 Lb preparation, both
stored in 2 mM phosphate buffer at -30°C, one at pH 8.0, the other at
pH 5.8, were examined as for the previous run. No green material was
observed either during, or at the end of, electrophoresis. After
staining, only the Lb spots were visible, plus some colour between the
slow Lb (Lba) spot and the origin. However, more material remained at
the origin for the pH 5.8 sample than for the pH 8.0 sample. Thus,
more deterioration of the sample had occurred during storage at pH 5.8.
It was therefore considered inadvisable to leave Lb preparations at
0°C and pH 5.8 for long periods.
5.3 Purification of Lb on a stepwise-eluted DEAD-cellulose phosphate
column at pH 8.0
A pH of 8.0 was chosen for the other column of the two-column puri-
fication because it is well away from pH 5.8 and likely to cause a
considerable change in the net charge of many of the contaminants in
crude Lb at pH 5.8.
At pH 7.0 the Lb fractions have a lower affinity for the exchanger
than they do at pH 5.8 (section 5.2). At pH 8.0, 65-70% of the DEAE-
cellulose is in the positively charged form, whereas at pH 5.8 about
90% is positively charged. Thus, at pH 8.0 the Lb fractions can be
expected to have a lower affinity for the exchanger than they have at
pH 7.0
No commitment was made at this stage as to the order of the two
columns, but it was decided to use stepwise elution for the first one,

114
because sharp peaks of protein (and therefore relatively concentrated
fractions) are eluted. Although the resolving power of this method is
low, this is not a serious problem with protein mixtures consisting of
only a few components differing widely in their affinity for the
exchanger (Peterson, 1970).
DEAE-cellulose acetate chromatography at pH 5.2 (Ellfolk, 1960a;
Dilworth, 1969) was not considered, because this pH is well below the
physiological pH of the soybean nodule (Appleby, 1969b).
Elution pattern of the column
The column (2.2 x 8.0 cm) was equilibrated with 2 mM phosphate buf-
fer, nominally pH 8.0. Crude soybean Altona-CB1809 Lb (40 mg — CMHb
estimation) in the same buffer was loaded on to the column which was
eluted at a flow rate of 80 ml/h. The column effluent was monitored
at 280 nm. The following fractions were collected and concentrated by
ultrafiltration.
Protein fraction Eluant buffer Comments
1. Non-Lb protein 2 mM Probably the 'cationic' protein of the paper electrophoresis runs (section 5.2).
2 mM Front of Lba fraction
2 mM Middle of Lba fraction
2 mM Tail of Lba fraction
2 mM Very dilute fraction
2 mM buffer elution was continued until nearly 1006 transmission was
recorded.
A third of the bed was then occupied by tightly-adsorbed components;
not an overloading for a stepwise-eluted column (Peterson, 1970).
6. Lbc 10 mM These two fractions overlapped
7. Lbc02 10 mM
After fraction 7 had been eluted, a bright-red minor Lb fraction was
2. Lba
3. Lba
4. Lba
5. Lba02

115
visible about half-way down the bed and a brown band about 1 cm deep
remained at the top of the bed.
8. Minor Lb fraction 20 mM
9. Non-Lb protein
100 mM A very sharp peak of protein
Before ultrafiltration, fraction 9 was diluted with an equal volume of distilled water to protect the Amicon membrane. During the concentra-
tion process its spectrum was recorded (Fig. 5.3). The Soret peak was
at 408 nm and the solution was yellow-brown suggesting that this frac-
tion was a peroxidase or, more likely, a mixture of peroxidases. After
the final elution, a dark-brown area about 5 mm deep was visible at the top of the bed.
PAGE of the eluted fractions
The distribution of peroxidases in the various fractions is given
in Table 5.1 — see also Figs. 5.4.a, b and c. The peroxidases which
come off the column in fractions 1-5 have either a small net positive
or a small net negative charge at pH 8.0. Those which are positively
charged at pH 8.0 are probably responsible for the cationic spot visi-
ble after paper electrophoresis of crude Lb at pH 8.5 (section 5.2).
When the gels of crude Lb and fractions 8 and 9 were stained for peroxidases an orange 'oxidase' band appeared. This has thus been
removed from the major Lb fractions, along with a considerable number
of peroxidases, by the pH 8.0 column.
E. p. r. spectra of the eluted fractions
The spectra were recorded at liquid N2 temperatures. The crude Lb
applied to the column had a large signal at g = 6 from high-spin ferric iron, the signal R at E = 2 and a signal at E = 4.3.
Fraction 2 — Lba. Only the expected E = 6 signal was present. Fraction 5 — Lba02. Only signal R was present. Fraction 6 — Lbc. The expected E = 6 signal was present, but also

FIG. 5.3 Optical absorption spectrum of the peroxidase fraction (fraction 9)
isolated from crude soybean Altona-CB1809 Lb. (The sample was in approx. 50 mM
phosphate buffer, pH 8.0.)

1.8
1.4
1.0
400
500
600 X(nm)

Fig. 5.4.a
141111411.
37::Ag 41110 AID
MOP 41110
117
1 2 3 4 5 6 7
Figs. 5.4.a, b and c. Acrylamide gels of crude soybean Altona-
CB1809 Lb applied to a DEAE-cellulose phosphate column at pH 8.0
and the fractions obtained from the column by a stepwise elution
programme. Gels 2, 4 & 6 stained with amido black; gels 1, 3, 5
& 7 stained for peroxidases. 1, crude Lb; 2, frn 1; 3, frn 1;
4, frn 2; 5, frn 2; 6, frn 3; 7, frn 3. Note the peroxidase
band between the two Lb bands in gel 1 and the band in the large-
pore gel of gel 3.

Fig. 5.4.b
118
1 2 3 4 5 6 7
1, crude Lb; 2, frn 4; 3, frn 4; 4, frn 5; 5, frn 5; 6, frn 6;
7, frn 6. Gels 2, 4 & 6 stained with amido black; gels 1, 3, 5 &
7 stained for peroxidases.

Fig. 5.4.c
119
1 2 3 4 5 6 7
1, crude Lb; 2, frn 7; 3, frn 7; 4, frn 8; 5, frn 8; 6, frn 9;
7, frn 9. Gels 2, 4 & 6 stained with amido black; gels 1, 3, 5 &
7 stained for peroxidases. Band z is visible in gel 6, and the
large peroxidase band in gel 7 corresponds to the band seen between
the two Lb bands in the crude Lb gels.

120
Table 5.1 PAGE of the fractions from the stepwise-eluted DEAE-
cellulose phosphate column at pH 8.0
F ractiona Method of gel staining
For peroxidases Amido black
1. A faint Lba band + 1
narrow and 1 broad band
above the Lb band. 1 band
in large-pore gel.
A very faint Lba band.
The broad peroxidase band
consisted of several pro-
tein bands.
2. An intense Lba band + the A faint Lba band.
same contaminants as in 1.
3. Lba band more intense than Lba band more intense
in 2. Same contaminants than in 2 + a faint band
as in 1. just above it.
4. Lba band was fainter than
in 3. Same contaminant
bands as in 1-3, but
fainter.
5. A moderately intense Lba02
band and the broad band
present in 1-4, now faint.

121
Table 5.1 Continued
Fractions Method of gel staining
For peroxidases Amido black
6. An intense Lbc band + 2 Only the Lbc band was
narrow and 1 broad visible.
contaminant bands.
7. An intense Lbc02 band
Only a faint Lbc02 band
and 2 (possibly 3) con- was visible.
taminant bands.
8. A faint minor Lb band
having the same RM value
as Lbc + 4 contaminant
bands.
9. (No red Lb bands were Only 1 band, band z (sec-
visible before staining). tion 4.1) was visible. It
One large distinct band did not correspond to any
and 5 others. of the peroxidase bands.
a Fig. 5.4.a shows the gels of fractions 1-3; 5.4.b those of fractions
4-6 and 5.4.c those of fractions 7-9.

122
a small signal R, probably because this fraction and fraction 7 (Lbc02)
overlap.
Fraction 7 — Lbc02. A large signal R was present, plus a E = 6
signal, again probably due to the overlap with fraction 6.
Fraction 8 — Minor Lb fraction. Signal R was present, but no g = 6
signal.
Thus, signal R is associated only with the Lb02 fractions. Because
of this, the Lb02 fractions from column 2 (see 5.2) were also examined
by e.p.r. spectroscopy. Both Lba02 and Lbc02 had a signal R, and also
a g = 6 signal, probably due to the autoxidation of Lb02 during frac-tion collecting and ultrafiltration. Thus, a 'ferric' Lb fraction
exhibiting signal R (e.g. Lbc isolated by chromatography at pH 7.0 —
see 4.4) is contaminated with an Lb02 fraction.
Material remaining at the top of the column
A dark-brown band, similar to that observed by Ellfolk (1960a),
remained at the top of the pH 8.0 column. The top of the pH 5.8 col-
umns was grey; while that of the pH 7.0 columns was grey-brown. These
bands are probably due to 'free' haemin (section 3.5) and denatured Lb.
Peroxidase contamination of Lbs purified on DEAE-cellulose phosphate
columns at pH 7.0
These ferric Lbs had been examined by e.p.r. spectroscopy at 8.31 K
(section 4.4). PAGE with staining for peroxidases showed that the Lba
fractions were slightly more contaminated with peroxidases than the
Lba from the pH 8.0 stepwise-eluted column; cf. gels 1-3 of Fig. 5.5
with gel 7 of Fig. 5.4.a. However, the Lbc fractions purified at pH
7.0 were noticeably more contaminated than those from the pH 8.0 col-
umn; cf. gels 4-6 of Fig. 5.5 with gel 7 of Fig. 5.4.b. This demon-
strates the advantage of purifying Lbs at pH 8.0 rather than pH 7.0
and indicates that peroxidases may be responsible for some of the fea-

123
Fig. 5.5
2 3 4 5
8
Acrylamide gels of soybean and cowpea Lbs purified on DEAE-cellulose
phosphate columns at pH 7.0 and examined by e.p.r. spectroscopy at
8-31 K. The gels were stained for peroxidases. 1, Merit-CC705 Lba;
2, Merit-CC705 Lba; 3, Norchief-CB1809 Lba; 4, Merit-CC705 Lbc;
5, Merit-CC705 Lbc; 6, Norchief-CB1809 Lbc; 7, cowpea-CB756 ferric
Lb; 8, cowpea-CB756 Lb02.

124
tures of the e. p. r. spectra of the pH 7.0-purified samples (see 4.4).
5.4 The two-column purification procedure for soybean and cowpea Lb
It was decided to chromatograph the crude Lb (after K3Fē(CN)6 oxi-
dation) on a column at pH 8.0 eluted by the stepwise method, followed
by a column at pH 5.8 eluted with starting buffer and a linear gradient
of 2-20 mM buffer (for method see 2.7.3). The initial chromatography
at pH 8.0 will remove many of the contaminants. Further purification
should then be achieved with the pH 5.8 column and by performing this
step last, the length of time that the protein is exposed to acid pH
can be kept to a minimum (section 5.2).
Ferric Lb nicotinate in crude Lb preparations
The low-spin complex of ferric Lb with a low-molecular-weight lid
and, produced when soybean nodules are homogenized at pH 5.5 (section
1.5; Appleby, 1969c) has been shown to be ferric Lb nicotinate
(Appleby et al., 1973).
Since all preparations of crude Lb were obtained by crushing nodules
into a buffer of about pH 7.0, taking precautions to prevent formation
of ferric Lb, it was considered that very little ferric Lb nicotinate
would be present in these preparations (section 1.4; Appleby, 1969c).
Thus, no steps were taken to 'strip' the Lb of nicotinate before the
chromatographic separation.
5.4.1 Soybean Lb
Crude Altona-CB1809 Lb and Merit-CC705 Lb were purified by this
method. Fractions containing the two major ferric Lbs were selected
by eye, pooled and concentrated. The pH 5.8 columns were eluted with
starting buffer until all the Lbg had come off and the gradient was
then connected. This did not completely elute Lbc, so elution was con-
tinued with 20 mM phosphate buffer, pH 5.8, until all this fraction had
come off the column.

125
Isolation and investigation of the peroxidase fraction
The pH 8.0 columns were eluted with 20 mM phosphate buffer to remove
two minor Lb fractions and then 100 mM phosphate buffer to elute the
peroxidases. Fractions containing these peroxidases isolated from soy-
bean Merit-CC705 Lb were pooled, dialysed against 10 mM phosphate buf-
fer, pH 7.0, for 36 h and concentrated by ultrafiltration. The yellow-
brown solution was stored in liquid N2 and later examined by e.p.r.
spectroscopy (section 6.2.1). This peroxidase preparation was very
concentrated and on PAGE, the amido black-stained gel, gel 7 of Fig.
5.6, showed the major contaminant band z and at least 11 minor bands
not visible in the previous peroxidase fraction examined (Table 5.1).
The gel stained for peroxidases showed about six bands, similar to the
previous peroxidase fraction, the major one being broad and intense and
present in the crude Lb gel between the two Lb bands — cf. gels 8 & 4
of Fig. 5.6.
Purity of Lba and Lbc eluted from the pH 8.0 column
The preparation obtained by pooling the Lilac and Lbc fractions from
the Merit-CC705 pH 8.0 column was examined by PAGE. Fig. 5.6 shows the
purification achieved -- cf. gels 1 & 4 (crude Lb) with gels 2, 3, 5 &
6 (Lba + Lbc). Amido black-stained gels of (Lba + Lbc) showed as major
contaminants: a distinct band, which may have peroxidase activity,
just above the Lba band and a fainter band, having no peroxidase acti-
vity, approximately mid-way between the two Lb bands.
Purity of Lba and Lbc eluted from the pH 5.8 column
Gels of Lba and Lbc eluted from the pH 5.8 columns showed that these
fractions were only slightly contaminated with peroxidases; cf. gels 3
& 5 of Fig. 5.7 with gel 4 (crude Merit-CC705 Lb) of Fig. 5.6 and gels
2 & 5 of Fig. 5.8 with gel 1 (crude Altona-CB1809 Lb) of Fig. 5.4.a.
Similar gels stained with amido black had no bands corresponding to
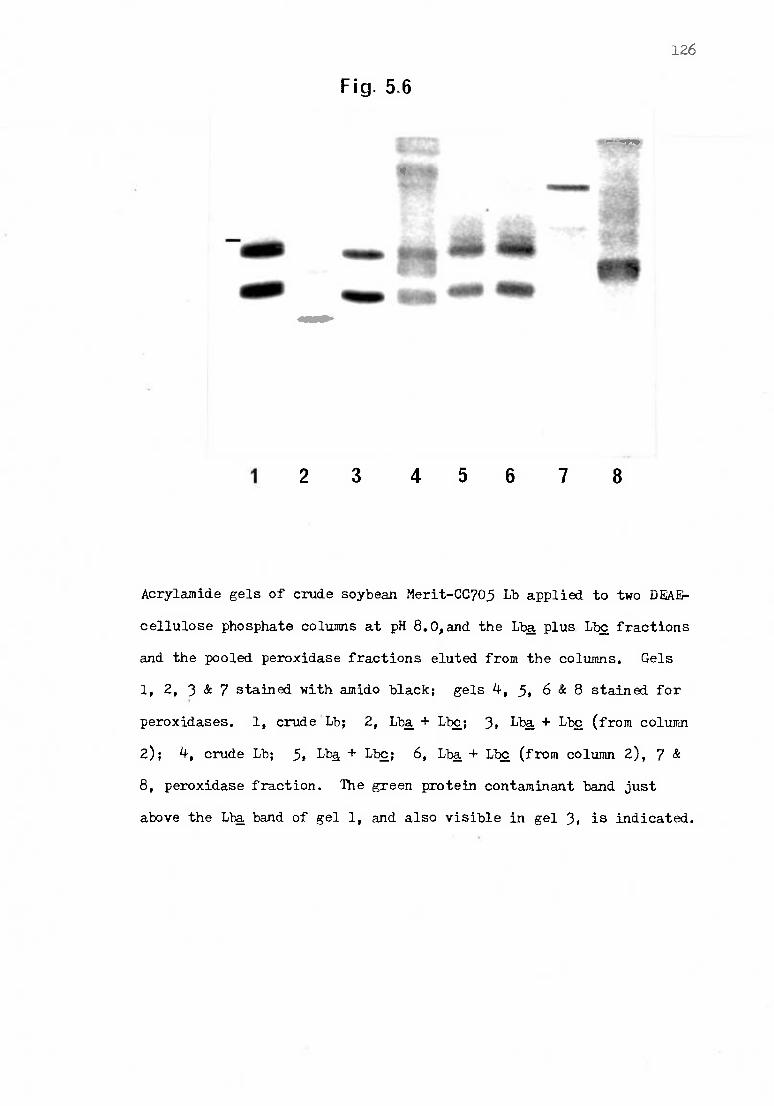
*1111 411111 Aim. Ile MID gap 411111"Wit OOP
Fig. 5.6
w..
126
1 2 3 4 5 6 7 8
Acrylamide gels of crude soybean Merit-CC705 Lb applied to two D EAF-
cellulose phosphate columns at pH 8.0,and the Lba plus Lbc fractions
and the pooled peroxidase fractions eluted from the columns. Gels
1, 2, 3 & 7 stained with amido black; gels 4, 5, 6 & 8 stained for
peroxidases. 1, crude Lb; 2, Lba + Lbc; 3, Lba, + Lbc (from column
2); 4, crude Lb; 5, Lba + Lbc; 6, Lba + Lbc (from column 2), 7 &
8, peroxidase fraction. The green protein contaminant band just
above the Lba, band of gel 1, and also visible in gel 3, is indicated.

127
Fig. 5.7
1 2 3 4 5
Acrylamide gels of soybean Merit-CC705 ferric Lbs eluted from a
DEAE-cellulose phosphate column at pH 5.8. Gels 1, 2 & 4 stained
with amido black; gels 3 & 5 stained for peroxidases. 1, Lba; 2,
Lba; 3, Lba; 4, Lbc; 5, Lbc. The green protein contaminant band
is clearly visible above the Lba band in gels 1 & 2. However, in
gel 4 the large Lbc band partly obscures the very faint band of the
green protein contaminant associated with Lbc. This contaminant
band is, however, clearly visible in gel 4 of Fig. 5.8.

Fig. 5.8
128
1 2 3 4 5
Acrylamide gels of soybean Altona-CB1809 ferric Lbs eluted from a
DEAF-cellulose phosphate column at pH 5.8. Gels 1, 3 & 4 stained
with amido black; gels 2 & 5 stained for peroxidases. 1, Lba;
2, Lba; 3, Lbc; 4, Lbc; 5, Lbc. The green protein bands can be
seen in gels 1, 3 & 4.

FIG. 5.9 Diagrammatic representation of acrylamide gels showing the purification of
crude soybean Lb by the two-column procedure. The diagram is based on the gels photo-
graphed for Figs. 5.6 & 5.7. Cr, crude Lb; 8.0, Lbs + Lbc eluted from the column at
pH 8.0; 5.8a and 5.8c, Lila and Lbc respectively, eluted from the column at pH 5.8;
0, origin; A, gels stained with amido black; B, gels stained for peroxidases by the
method of Seevers et al. (1971). For A the relative intensity of the bands is indica-
ted by the degree of shading; for B the cross-hatched bands are intense, the hatched
bands moderately intense and the stippled bands faint.

I-

130
these peroxidases, showing that the actual amount of them was very
small. The column at pH 5.8 appeared to have removed three contaminat-
ing peroxidases from the Merit-CC705 Lba + Lbc preparation obtained
from the pH 8.0 column. The overall purification is represented in
Fig. 5.9. However, a distinct contaminant band was visible above the
Lb bands in amido black-stained gels of Lba and Lbc from Altona-CB1809
Lb (gels 1 & 4 of Fig. 5.8), and above the Lba band from Merit-CC705
Lb (gels 1 & 2 of Fig. 5.7). (A very faint band was present above the
Lbc band.) It can be seen from Figs. 5.7 and 5.8 that these bands had
no peroxidase activity.
Before the gels of the purified Lbs from Altona-CB1809 Lb were
stained, a green band corresponding in position to the distinct con-
taminant band above Lbc was visible. A grey band just above the Lba
band was also visible. No corresponding bands were visible before
staining the gels of the purified as from Merit-CC705 Lb, presumably
because these contaminants are present in lower concentration in these
preparations. Because of this, these Merit-CC705 Lb preparations were
used for e.p.r. investigations at liquid He temperatures (section 6).
These contaminants may represent breakdown products of Lb, possibly
being similar to the green protein of Virtanen & Laine (1946) -- sec-
tions 1.3 & 5.6). That associated with Lba was visible as a band just
above the Lba, band in amido black-stained gels of crude Lb e.g. gel 1
of Figs. 5.2 & 5.6. That associated with Lbc was probably responsible
for a faint band sometimes visible approximately mid-way between the
two Lb bands — see gels 1 & 3 of Fig. 4.1. These contaminants are
therefore not generated from Lb during the purification procedures.
5.4.2 Cowpea Lb
Crude cowpea-CB756 Lb was also purified by this method. Some
strains of Rhizobium, including CB756, which nodulate legumes in the

131
cowpea cross-inoculation group, produce nodules which are pink when
young, but which darken with age. When mature, the inside of these
nodules is a very dark-red colour. These so-called 'black nodules'
contain a pigment, or pigments, in addition to Lb (Cloonan, 1963).
Ihizobium strain SU318 does not produce black nodules On cowpeas (see
5.5).
When the crude Lb precipitate was dissolved in 20 mM phosphate
buffer, pH 7.0, the solution was a very dark-red colour and contained
dark-red flecks of material which only dissolved slowly. After cen-
trifugation,about the same amount of insoluble material as in crude
soybean Lb samples was present. However, it was a darker colour, pre-
sumably due to the presence of the 'black nodule' pigments. Brown
and purple-pink pigments were seen in the low-molecular-weight fraction,
when the supernatant was desalted on a Sephadex G-25 column. The Lb
band was the usual colour. However, when the Lb sample for a pH 8.0
column was equilibrated with 2 mM phosphate buffer, pH 8.0, (after
K3Fe(CN)6 oxidation), left overnight at 0°C and then centrifuged, a sub-
stantial brown pellet formed. Dissolving this pellet in 100 mM phos-
phate buffer, pH 7.2, gave a solution with a greenish tinge, suggesting
the presence of breakdown products of Lb. The 'black nodule' pigments
present in these crude Lb preparations may thus adversely affect the
Lb.
Elution pattern of the pH 8.0 columns
Soon after beginning elution with starting buffer, a small protein
peak was eluted. It probably corresponds to fraction 1 of the soybean
pH 8.0 stepwise column (section 5.3). The single ferric Lb fraction
was eluted with the starting buffer. When it had all come off the col-
umn, 10 mM phosphate buffer, pH 8.0, was used to elute the single major
ferrous Lb fraction. Another bright-red fraction, assumed to be a fer-

132
rous minor fraction, was visible on the column. After elution of the
major Lb fractions, a large chocolate-brown band remained on top of
the bed.
The yield of ferric Lb from the pH 8.0 columns was smaller than
expected. This is presumably related to the large band left on top of
the bed. Gels of the crude Lb applied to one column (e.g. gel 7 of
Fig. 5.10) showed a pronounced haemin band (section 2.9.1), indicating
the presence of a large amount of 'free' haemin in this preparation.
This haemin must bind firmly to the exchanger, since no haemin bands
are visible in gels of the purified Lbs (see Fig. 5.10 and Table 4.4)
or gels of other protein fractions from the pH 8.0 columns. It will
contribute towards the estimate of Lb in the crude Lb sample, causing
an overestimate of the actual amount of Lb present (section 3.5). De-
natured Lb probably also binds firmly to the exchanger, and will be
estimated as Lb in the crude sample. The 'black nodule' pigments in
the crude Lb preparations may cause some Lb to be denatured, thus
accounting for the low yield of eluted Lb.
Elution pattern of the pH 5.8 column
About 430 ml of starting buffer was pumped through the column, after
which about 16% of the bed was occupied by tightly adsorbed protein.
(Normally this would mean that the column is overloaded for good reso-
lution, but since only the major component in the sample.(ferric Lb) is
required, this loading can be tolerated). After about 500 ml of the
gradient had been pumped through the column, half the Lb peak had been
eluted. Only a single Lb peak, tailing slightly, was visible on the
ultraviolet absorption trace of the column effluent.
Purity of the cowpea Lb fractions eluted from the pH 8.0 column
The purification achieved can be seen by comparing gels 3 & 4 with
gels 1 & 2 (crude Lb) and gels 9 & 10 with gels 7 & 8 (crude Lb) of

133
Fig. 5.10. During the staining for peroxidases, the same 'oxidase'
band appeared in the gels of the crude Lb and the ferrous fraction (cf.
the soybean Lb column — 5.3). The ferric fraction was only slightly
contaminated with peroxidases, whereas the ferrous fraction was more
heavily contaminated (cf. gels 4 & 6 of Fig. 5.10). This demonstrates
one advantage of purifying cowpea Lb as its ferric form. Since ferric
Lbs have a lower affinity for DEAE-cellulose than their ferrous forms,
they can be eluted using a more dilute buffer. This buffer will be a
less powerful eluant for those peroxidases tightly bound to the ex-
changer at pH 8.0 (cf. sections 5.3 & 5.4.1).
Purity of the cowpea ferric Lb eluted from the pH 5.8 column
In Fig. 5.11 the gels stained for peroxidases (gels 2 & 4) showed
only one faint band in addition to the large Lb band. Comparing these
gels with gels 4 & 10 of Fig. 5.10 (the ferric Lb from the pH 8.0 col-
umns) showed that the pH 5.8 column had further decreased the level of
peroxidase contamination. Fig. 5.12 shows diagramatically the overall
purification achieved. This Lb was considered pure enough for investi-
gation by e.p.r. spectroscopy at liquid He temperatures.
Before the gels were stained, a greenish band was noticed just above
the Lb band. It stained with amid() black (gels 1 & 3 of Fig. 5.11) but
did not have peroxidase activity. Soybean Lba and Lbc purified by the
same method contain a similar contaminant (section 5.4.1).
5.5 The effect of the 'black nodule' pigments on cowpea Lb
Because of the possible effects of the 'black nodule' pigments on
cowpea Lb (section 5.4.2), a sample of crude cowpea Lb from SU318
nodules was chromatographed similarly to cowpea-CB756 Lb on a DEAE-
cellulose phosphate column at pH 8.0. After centrifugation of the
crude Lb dissolved in 20 mM phosphate buffer, pH 7.0, the pellet looked
like that from crude soybean Lb samples. (Unlike the CB756 Lb, the SU318

Fig. 5.10
134
1 2 3 4 5 6 7 8 9 10
Acrylamide gels of crude cowpea-CB756 Lb applied to two DEAE-
cellulose phosphate columns at pH 8.0 and the ferric Lb and major
ferrous Lb fractions eluted from the columns. Gels 1-6, column 1;
gels 7-10, column 2. Gels 1, 3, 5, 7 & 9 stained with amido black;
gels 2, 4, 6, 8 & 10 stained for peroxidases. 1 & 2, crude Lb; 3
& 4, ferric Lb; 5 & 6, the major ferrous Lb fraction; 7 & 8, crude
Lb; 9 & 10, ferric Lb. The intense haemin band indicated in gel 7
is just visible in gel 8.

Fig. 5.11
111
1 2 3 4
Acrylamide gels of cowpea ferric Lb eluted from a DEAE-cellulose
phosphate column at pH 5.8. Gels 1 & 3 stained with amido black;
gels 2 & 4 stained for peroxidases. (The amount of protein loaded
on to gel 3 was twice that loaded on to the other gels.) The
green protein contaminant band is clearly visible in gels 1 & 3.
135

FIG. 5.12 Diagrammatic representation of acrylamide gels showing the purification of
crude cowpea Lb by the two-column procedure. The diagram is based on the acrylamide
gels photographed for Figs. 5.10 & 5.11. 8.0, cowpea ferric Lb eluted from the column
at pH 8.0; 5.8, cowpea ferric Lb eluted from the column at pH 5.8; H, haemin band.
Other abbreviations and shading conventions as for F ig. 5.9.

:r:
of
..
'.
.. ..
~~~ .~ '.'
<
::: :.-:
::"":"
136
o
~ ~~: : ~
()
~ :::
: i
.,
I .'
, •
;
l ~i:
: ~
. ~I
I!I~ .
16
~ 1
1·1
I~ -.
to
. Ul-------------1
:....
a.. N
1 .
.' ~
t"~ir:.\"::".: .. ::
:"":::~ ~ 1
~
OJ 1
~ ~i;~/:
-} i::16
I ~
; 1m
::~:
cP
:::
' ...
.
o

137
Lb sample was not oxidized with K3Fe(CN)6.) After centrifugation of
the crude Lb equilibrated with 2 mM buffer, only a small brownish-red
pellet was present in contrast to that present in the CB756 sample
(see 5.4.2). On eluting the column, more ferric Lb than ferrous was
present because autoxidation of Lb02 occurs after desalting. Recently
Rifkind (1974) has shown that very low concentrations of Cut+ catalyze
the oxidation of Hb02. Copper is present in the soluble fraction of
nodule homogenates (Cartwright & Hallsworth, 1970) and probably also
catalyzes the oxidation of Lb02, possibly being responsible for the
'autoxidation' of desalted crude Lb preparations.
The ferrous fraction was concentrated and stored in liquid N2. One
minor fraction was eluted with 10 nM buffer. The column was then
drained and observed. In daylight a second minor fraction was visible
as a faint pink band about 1 cm from the top of the bed. About 5 mm
from the top of the bed was a yellowish region, probably due to peroxi-
dases. On top of the bed was a brown zone about 1 mm thick. It was
much smaller than those remaining on top of the beds of the CB756 Lb
columns. Thus, the 'black nodule' pigments may be indirectly respons-
ible for the large brown zones present at the top of these beds, per-
haps by causing denaturation of some of the ferric Lb.
Although the 'black nodule' pigments may affect a certain propor-
tion of the cowpea ferric Lb, this protein purified from CB756 nodules
had a liquid-He-temperature e.p.r. spectrum almost identical to that of
the protein purified from SU318 nodules (section 6.1.1).
5.6 The green proteins in Lb preparations
The greenish-coloured contaminant bands just above the Lb bands in
gels of purified Lbs may be breakdown products of Lb.
5.6.1 Comparison of crude Lb from normal and stressed nodules
The root nodules of soybeans or cowpeas which have been severely

138
wilted turn irreversibly green. Green pigment is present in nodules
of pea plants grown under unfavourable conditions (section 1.3).
Crude Lb extracted from green soybean nodules was examined to see if
it showed the greenish contaminant bands on PAGE. One batch of soy-
beans (Altona-CB1809) grown in the field at Woburn had experienced
prolonged dry conditions. When the nodules of the plants were examined,
they were either completely green inside, or contained green as well
as pink Lb-containing areas. Some of these 'stressed' nodules were
harvested, along with 'normal' nodules having no obvious green pigment,
from later-sown plants which had not wilted. Both batches of nodules
were crushed on the same day into a medium which did not contain
ascorbate, and the crude Lb isolated. The precipitates from the 55%
(4)2504 saturation step appeared as follows: normal — pinkish fawn,
and stressed — khaki green. The crude Lb (80% saturation) precipi-
tates had the following appearance: normal — red, and stressed —
brown. They were dissolved in 20 iaM phosphate buffer, pH 7.0, and de-
salted on _a Sephadex G-25 column equilibrated with the same buffer.
The normal Lb solution was bright-red, the stressed Lb solution brown-
red. Their optical absorption spectra were recorded as soon as possi-
ble after desalting and were basically similar, indicating a mixture of
ferric Lb and Lb02. Some LbNO may also be present, but this will not
be detectable (see 7.6). However, the spectrum of the normal Lb sample
had a more pronounced peak at 533 nm than the spectrum of the stressed
Lb sample, indicating a greater proportion of Lb02 in the normal sample.
PAGE of the two samples
Figure 5.13 shows that the Lb bands in the amido black-stained,
stressed Lb gels were less intense than those in the normal Lb gels.
(cf. gels 2 & 1). However, the green protein bands in both sets of
gels appeared to be of about the same intensity, suggesting that there

Fig. 5.13 139
t. ons*Ihriars,
441440-
4'4iy- +4
1 2 3
Acrylamide gels of crude soybean Altona-CB1809 Lb extracted from
the root nodules of normal plants (gels 1 & 4) and plants stressed
by wilting (gels 2 & 3). Gels 1 & 2 stained with amido black;
gels 3 & 4 stained for peroxidases.

140
is more green protein/mg Lb in the stressed Lb sample. The two green
contaminant bands were visible in the gels of the stressed Lb sample
before staining, whereas they are not usually visible in gels of nor-
mal Altona-CB1809 Lb before staining. Thus an increase in the concen-
tration of the green proteins is associated with an increase in the
rate of Lb breakdown, suggesting that the green proteins may be break-
down products of Lb. In previous soybean Lb preparations examined,
the intensity of these bands, relative to the Lb bands, varied between
preparations. This suggests that the amount of the green proteins
present depends on the age and conditions of growth of the plants.
Other differences between the amido black-stained gels of the two
samples were: (1) The band due to the major non-peroxidase contamin-
ant (band z) and the haemin band are more intense in the stressed Lb
gel than they are in the normal Lb gel. (ii) A very narrow band was
present just above band z in the stressed Lb gel,but not in the normal
Lb gel.
On staining the stressed Lb gels for peroxidase activity, two 'oxi-
dase' bands appeared during the first stage of the procedure. These
had been observed previously when staining gels of normal Altona-CB1809
Lb preparations (e.g. in section 5.2). However, a faint band also
appeared in the stressed Lb gel, just above the slowest 'oxidase' band.
When staining was completed, the stressed Lb gel appeared different
from previous gels of normal Altona-CB1809 Lb. Four peroxidase bands
in the stressed Lb gel were more intense, relative to the Lb bands,
than the corresponding bands in the normal Lb gels (cf. gels 3 & 4 of
Fig. 5.13).
PAGE thus showed differences between the protein patterns of normal
and stressed nodules and the presence of a higher concentration of
'free' haemin, relative to Lb, in the stressed nodules. This may be

141
due to an abnormal pattern of breakdown of Lb in the stressed nodules.
5.6.2 Paper electrophoresis investigations
Column-purified samples of cowpea-SU318 and CB756 ferric Lb, which
showed a green protein band on PAGE, and samples of normal and stressed
Altona-CB1809 Lb were subjected to high voltage paper electrophoresis
at pH 8.5 (section 2.10). Loadings of 100-200,u-g protein were used.
Results
No green bands were visible during or after electrophoresis. On
staining the paper for protein (see 2.10), some colour was seen behind
the single Lb band in both cowpea Lb samples. This may be tailing of
the band, Or the green protein detected by PAGE and (or) peroxidases.
The absence of discrete bands of green protein suggests that the elec-
trophoretically mobile green proteins observed by Thorogood (1957) are
different from the green proteins present in the samples investigated
here.
5.6.3 PAGE experiments and the possible nature of the green proteins
The cowpea-SU318 ferric Lb sample examined by paper electrophoresis
was subjected to PAGE at pH 8.9 in gels of different acrylamide concen-
tration after the method of Hedrick & Smith (1968). Between different
PAGE experiments the sample was stored in liquid N2. Haemin was used
to enable measurement of the RM values of the Lb and green protein
bands after staining-destaining (section 2.9.1). 12.5%, 10%, 7.5%, 5%
and 3% acrylamide gels were run; the distance moved by the haemin band
was respectively 28, 30, 31, 31 and 35 mm. For all the acrylamide con-
centrations the bis:acrylamide ratio was the same (section 2.9). The
gels were destained electrolytically, taking about 2.5 h.
RM values for the two proteins at the various gel concentrations
were measured, and a set of 100 log (RM x 100) values calculated for
each protein at each gel concentration. The mean of 4 replicate values

142
was then calculated; variation about the mean was approximately f 2%
in all cases. At 5% and 3% acrylamide only one band, widened by
diffusion, was visible, so values were calculated from R. values
measured for the top and bottom of the band. In the 7.5% gels, haemin
runs with the bromophenol blue band. The variations in the distance
moved by the haemin band between the 12.5% and 5% gels is only slightly
greater than that observed by Hedrick & Smith (1968) for bromophenol
blue.
Using the method of least squares on the values for 7.5%, 10% and
12.5% gels, the slopes and intercepts of the best-fitting straight
lines were calculated. The values for the 3% and 5% gels were not
included because only a single band was present. For the Lb line the
slope was -3.78, the intercept 209.9 and the coefficient of correlation
-0.998. For the green protein line the slope was -5.12, the intercept
215.3 and the coefficient of correlation -0.996.
The two lines were drawn and extrapolated to 3% acrylamide (Fig.
5.14). The experimental points are included in this figure; the bars
at the 3% and 5% gel concentrations represent the upper and lower
edges of the single band.
The lines intersect and cross at 4.0% acrylamide. However, Fig.
5.14 shows that at 396 acrylamide the single band has not moved as far
as is predicted by extrapolation of the two lines. This may be be-
cause the haemin band moves further at 3% than it does at the other
concentrations, making the RM value at 3% low compared to the other
values.
From a consideration of the ways in which the green protein might
differ from Lb, it was concluded that it had a slightly greater mole-
cular size but the same charge as Lb. At a sufficiently low acryla-
mide concentration the 'sieving' effect of the gel on both proteins will

FIG . 5.14+ Relative mobilities of cowpea Lb (O CO
and the green protein contaminant 07-----11) in acryla-
mide gels of different concentration.

143
FIGURE 5.14.
IL
2.0 4.0 6.0 B•0 10.0 12-0
ACRYLAMIDE CONCN. OF GEL (%)
100 L
OG (R
M x
1 00
)
200
180
150
160
190
170

144
be the same, and they will then migrate together because they have the
same charge.
If the green protein is a product of Lb catabolism, being similar
to the green protein of Virtanen & Laine (1946), it may contain a haem
group which has been modified by oxidation of one of the methine
bridges (see 1.3 and Fig. l.l.b). A change in the structure of the
haem group can cause a change in the conformation of myoglobin (Andres
& Atassi, 1970). Therefore, by analogy, the green protein may have
the same apoprotein as Lb, but a less compact tertiary structure. It
would thus have a molecular weight and charge almost identical to that
of Lb, but a 'looser' conformation. This would result in it being
sieved more than Lb in the more concentrated acrylamide gels, giving
rise to a separate band just above the Lb band, and migrating with the
Lb in the gels of lower concentration.
The PAGE results are thus consistent with the suggestion that the
green proteins are breakdown products of Lb.

145
Section 6
E. p. r. spectroscopy of ferric Lbs purified by the two-column'
procedure and their derivatives
Purified ferric soybean Lba and Lbc and ferric cowpea Lb were
obtained as described in section 5.4. Derivatives of these Lbs
were then prepared and their e.p.r. spectra recorded (see 2.11.1
& 2) .
HIGH-SPIN DERIVATIVES
6.1 Acid-metLbs (ferric LbH2O at pH 7.0)
6.1.1 Description of spectra
The e.p.r. spectra of the acid-met derivatives of the two soy-
bean Lbs and cowpea-CB756 Lb at 10-20K were basically similar (see
Fig. 6.1.a, b and c), resembling quite closely the spectra of acid-
metHb and Mb. The effective E values of the prominent high-spin
features of the spectra were very close to 6.0 and 2.0 (see Table
6.1).
The e.p.r. spectra and E values of cowpea-CB756 Lb at pH 5.8 and
cowpea-SU318 Lb at pH 7.0 were almost identical to those of cowpea-
CB756 Lb at pH 7.0 (Table 6.1). The cowpea-SU318 Lb sample was
purified on a single DEAE-cellulose phosphate column at pH 8.0 and
its e.p.r. spectrum thus shows that one column at pH 8.0 gives
cowpea ferric Lb pure enough for detailed e.p.r. investigations.
The width (separation of the extrema) of the absorption deriva-
tive at g = 6 in the acid-metLb spectra was approx. 40-50G. These
values are similar to that for acid-metHb (see Table 6.2). Cooling,
the Lb samples to 1.6K would slightly decrease the width of the =
6 absorption (Peisach et al., 1971). The width of this feature in
the soybean acid-metLbc spectrum at 86-90K was approx. 80G. This
acid-metLbc spectrum showed no trace of signal R, in contrast to

FIG. 6.1 E. p. r. spectra of ferric Lbs purified by the two-column
procedure. The samples were at 1B 7.0 (acid-metLbs). For the
e. p. r. spectra shown in section 6, the soybean ferric Lbs are from
Merit-CC705 nodules and the cowpea ferric Lb from Poona-CB756
nodules. (a) soybean Lbk at 13 K; (b) soybean Lbc at 11 K; (c)
cowpea Lb at 20 K. A microwave power of 2 mW was used. Small low-
spin absorptions are visible in all three spectra.

Fig. 6.1
a
146
V
C
1 0.5 1.5 2.5 3.5 4.5
H (kG)

147
Table 6.1 Effective g values of high-spin ferric Lb derivatives
and the low-spin features in the acid-metLb spectra
E values Derivative
4xy Zz
Acid-met, pH 7.0
Soybean Lba 5.99 5.99 2.00
Soybean Lbc 6.01 6.01 2.00
Cowpea-CB756 Lb:
at pH 7.0 5.99 5.99 2.00
at pH 5.8 5.98 5.98 2.00
Cowpea-SU318 Lba 5.97 5.97 1.99
Fluorides, pH 7.0 Superhyperfine splitting (G)
Soybean Lba 6.04 6.04 2.00 43 ± 2
Soybean Lbc 6.04 6.04 2.00 43 ± 2
Cowpea-CB756 Lb 6.05 6.05 2.00 43 ± 2
g values of the low-spin features in the acid-metLb spectra
'z
,b
Soybean Lba 2.26 2.72 3.14
Soybean Lbcc 2.28 2.73 3.14
Cowpea-CB756 Lb
at pH 7.0 2.24 unresolved 3.10
Spectra were recorded at 8-40K. Soybean Lbs were from Merit-CC705 nodules.
a Sample purified on a single DEAE-cellulose phosphate column at pH 8.0
b From a second low-spin species.
c An absorption near .g = 1.74 x) was just detectable.

148
Table 6.2 Separation of the extrema of the absorption derivative
at g = 6 for high-spin ferric Lb derivatives and the peroxidase
fraction
Derivative Temperature (K) Separation (G)
ACID-MET
Purified using one column at pH 7.0.
Soybean Merit-CC705 Lba 8 127 ± 2.5 Soybean Norchief-CB1809 Lbc 31 111 f 2.5
Cowpea-CB756 Lb 20 125± 2.5 (second sample - see Table 4.7)
Purified using two columnsa
Soybean Merit-CC705 Lba 13 50 ± 2.5
Soybean Merit-CC705 Lbc 11 45 ± 2.5
Cowpea-CB756 Lb 20 40 ± 2.5 Cowpea-SU318 Lb 20 40 i' 2.5
Acid-metHbb 1.6 41 (approx.)
Acid-metHbb 1.6 36 (approx.)
FLUORIDE, pH 7.0
Soybean LbaF' 11 70 ± 2.5
Soybean Lbcr 9 65 ± 2.5 Cowpea-CB756 LbF- 20 75 ± 2.5
Ferric HbF-b 1.6 61 (approx.)
Ferric MbF'-b 1.6 56 (approx.)
Peroxidase fractions 30 55 ± 2.5
The samples are those of Tables 4.7 and 6.1.
a Samples at pH 7.0 b Peisach et al., 1971
c From crude soybean Merit-CC705 Lb

1149
the spectra of acid-metLbc fractions purified at pH 7.0 (see 4.4).
The absorption derivative at = 2 of all the acid-metLb spectra
was comparable in size to that of the spectra of acid-metHb (Nakano
et al., 1971; Peisach et al., 1971) and acid-metMb (Tamura et al.,
1973).
The very small absorption near g,= 4.3 in the acid-metLb spectra
was probably due to a background absorption in the quartz insert
(see the blank trace of Fig. 6.11).
Small low-spin absorptions nears = 2.73 and 2.28 were present
in the soybean Lba and Lbc spectra, being slightly more pronounced
in the Lbc spectrum (cf. Fig. 6.1.a and b). An absorption near E = 1.74 was just detectable in the spectrum of Lbc. Interestingly,
in all the cowpea acid-metLb spectra a small absorption was present a.
nears = 2.28, but no absorption was detectable near g = 2.73. All
the acid-metZb spectra showed a small low-spin absorption near E
3.1 (see Table 6.1). It was most pronounced in the cowpea Lb
spectra.
Low-spin signals near g = 2.73, 2.28 and 1.74 were present in
the spectrum of soybean acid-metLbc recorded at 86K, but no low-
spin signals were detected in the corresponding spectra of soybean
Lba and cowpea Lb, probably because these samples were less
concentrated than the Lbc sample. Although no precise measurements
were made, a comparison of the e.p.r. spectra of acid-metLbc and
LbcF- (predominantly, if not entirely, high-spin) indicated that
about 20 ± 5% of the Lbc was in the high-spin form.
6.1.2 Discussion
The effective g values of the soybean and cowpea high-spin acid-
metLbs are very similar to those for acid-metHb (Bennett et al.,
1957; Gibson et al., 1958) and show that these derivatives, like
aThe low-spin species responsible for these absorptions (see 6.5.2) thus represents a smaller proportion of the Lb in the cowpea acid-metLb samples than it does in the Acid-metLba and Lbc samples.

150
acid-metHb and acid-metMb, have highly axial symmetry. More
recent measurements on single crystals of acid-metHb and Mb have
shown that these derivatives do not possess completely axial
symmetry. For example, in type A crystals of sperm whale acid-met
Mb, the E value in the haem plane varies from 5.98 ± 0.01 to
5.86 ± 0.01 (Helckē et al., 1968).
In contrast to these acid-metLb spectra (Fig. 6.1), the e.p.r.
spectrum of acid-met Lba at 1.6K published by Appleby et al. (1976)
shows a much broader absorption derivative near g = 6, indicating
the presence of three high-spin species. One has nearly axial
symmetry with sx = gy = 5.9, while the other two show departures
from axial symmetry (rhombic distortion). One has s values of
6.22 and 5.48; the other (more rhombically distorted) has one g
value at 5.03, while the second (low-field) g value is unresolved.
Small low-spin absorptions, similar to those at s = 2.73 and
2.28 in the acid-metLb spectra, are present in the spectrum of
acid-metHb (at pH 7.0) recorded at 20K by Nakano et al. (1971).
These low-spin absorptions are slightly stronger, relative to the
s = 6 absorption, than those in the acid-metLb spectra, an absorp-
tion near E = 1.70 being clearly visible. However, unlike the Lb
spectra, there is no absorption nears = 3.1 in this acid-metHb
spectrum. Nakano et al. also found that these low-spin absorptions
were almost undetectable at 77K (in contrast to soybean acid-metLbc)
but became clearly observable at 40-20K and were strongest at 20K.
This is because the low-spin state has a longer relaxation time
than the high-spin state.
From magnetic susceptibility measurements, Nakano et al. (1971)
estimated that below 77K acid-metHb was 30% high spin, 70% low-spin.
Ehrenberg & Ellfolk (1963) have provided evidence that acid-metLb

151
exists as a thermal equilibrium mixture of high and low-spin forms.
By comparing the e.p.r. spectra of acid-metLb and ferric Lb acetate
(which they found by magnetic susceptibility measurements to be
predominantly, if not entirely, high-spin), they estimated that at
77K acid-metLb was about 35-502 high-spin. However, from the
optical spectrum of soybean acid-metLba recorded at 77K, Appleby
et al. (1976) concluded that only a small proportion of this deriva-
tive was high-spin. Their e.p.r. spectrum of acid-metLba, recorded
at 1.6K, confirmed this. It had large (relative to the broadened
absorption derivative near E = 6) low-spin absorptions at g = 3.02,
2.69 and 2.24.
The e.p.r. spectra of acid-metLb in Fig. 6.1 differ significantly
from the spectrum of Appleby et al., having more high-spin charac-
ter, no broadening of the E = 6 absorption derivative and much
smaller low-spin absorptions. Possible reasons for these differ-
ences are discussed in 6.2. However, the acid-metLb e.p.r. spectra
of Fig. 6.1 closely resemble the acid-metHb e.p.r. spectra of
Nakano et al.(197l), but differ from the e.p.r. spectrum of acid-
metMb in possessing low-spin absorptions.
6.2 Differences between the e.p.r. spectra of acid-metLbs purified
at pH 7.0 and those purified by the two-column procedure
6.2.1 High-spin features
From Fig. 4.4 (reproduced from section 4.4) and Table 6.2 it can
be seen that the acid-metLb samples purified at pH 7.0 have a much
broader absorption derivative at g = 6 than the samples purified
by the two-column procedure. In one spectrum (Fig. 4.4 c) a
feature at g = 5.46 was clearly resolved. The rhombically distor-
ted species responsible for it is almost certainly present in the
other two spectra of this figure, where its presence is indicated

FIG. 4.4 E. p. r. spectra of ferric Lbs purified on DEAD-cellulose
phosphate columns at pH 7.0. The Lbs were assumed to be in the acid-
met form. (a) soybean Merit-CC705 Lba at 8 K; (b) soybean Norchief-
CB1809 Lbc at 31 K and (c) cowpea-CB756 Lb (second sample — see
Table 4.7) at 20 K. Microwave power: (a) & (b) 0.02 mW; (c) 2 mW.

152
Fig. 4.4
C
I I I 2.5
H (kG) 1.5 3.5

153
by the shoulder on the absorption derivative. High-spin acid-
metLb of nearly axial symmetry makes up the rest of the E = 6
absorption derivative in the spectra. This rhombically distorted
species is probably identical to the species with g values of 6.22
and 5.48 detected by Appleby et al. (1976) in the spectrum of acid-
metLba (see 6.1.2) .
It was originally thought that the broad absorption derivative
at g = 6 might be due to contamination with peroxidases (see 5.3).
The peroxidase fraction isolated from crude soybean Merit-CC705 Lb
(see 5.4.1) was equilibrated with 20 mM phosphate buffer, pH 7.0,
and concentrated as for the Lb derivatives. Its e.p.r. spectrum at
30K is shown in Fig. 6.2. The width of the absorption derivative
at g = 6 was about 55G, only slightly greater than that of the
acid-metLbs purified by the two-column procedure (Table 6.2). It
is therefore very unlikely that peroxidases are responsible for the
broadened absorption derivative at g = 6.
It is noteworthy that the = 6 feature of the peroxidase
fraction's spectrum is relatively narrow, since this feature in the
e.p.r. spectra of the isoenzymes of horseradish peroxidase shows a
pronounced splitting indicative of considerable rhombic distortion
(Tamura & Hori, 1972). Like Lb, the horseradish peroxidase
isoenzymes have protohaem IX as their prosthetic group (Shannon et
al., 1966). This is probably also the case for the peroxidase
fraction isolated from crude soybean Altona-CB1809 Lb (see 3.5).
The e.p.r. spectrum of the peroxidase fraction thus indicates that
the environment of the iron atom in these peroxi ses is different
from that in horseradish peroxidase. It would/be interesting to
SJw, k the e.p.r. spectra, of the peroxidase fraction at pH 11. 0 ,
and at pH 7.0 in the presence of cyanide/Fran, those of the corres-

Fig. 6.2
1 1 I 0.5 1.5 2-5
H (kG)
154
E. p. r. spectrum of the peroxidase fraction isolated from crude soybean
Merit-CC705 Lb. The sample was at pH 7.0. Temperature approx. 30 K,
power 2 mW.

155
ponding horseradish peroxidase derivatives obtained by Tamura &
Hori (1972) and Blumberg et al. (1968).
The broadened absorption derivative at = 6 in the acid-metLbs
purified at pH 7.0 is most probably due to the presence in these
samples of Lb which has a different conformation from that of high-
spin acid-metLb of nearly axial symmetry. This suggestion is
supported by the following observations.
When ferric Hb is incubated in 0.8M phosphate buffer, pH 8.3, or
in pyridine solution buffered at pH 7.0, the e.p.r. spectrum of the
resulting preparation contains a rhombically distorted high-spin
species (Peisach & Blumberg, 1971). These rather drastic treat-
ments alter the structure of the globin, and the rhombic distortion
observed can be a sensitive measure of the effect of the protein
environment on the haem iron atom. Rhombic distortion does not
necessarily mean that the four pyrrole N atoms in the xy plane (the
haem plane) are arranged asymmetrically. It can mean that the
interaction of the globin with the haem asymmetrically orients the
5th or 6th ligand, thus removing the degeneracy between the dXZ and
dyZ orbitals. A similar effect can be produced by a distortion of
the configuration of the haem (Rifkind, 1973).
The change in structure (conformation) of the globin of Lb in
the pH 7.0-purified samples is probably due to an unexpectedly high
ionic strength in these samples which were concentrated by ultra-
filtration over Amicon UM10 membranes (see 2.7.2). (About 50 -
100 ml of dilute ferric Lb solution was concentrated to approx.
1 ml). UM10 membranes possess equal numbers of positive and nega-
tive charges on their surface and may bind phosphate ions (personal
communication from Amicon). This binding may then decrease the
rate at which phosphate ions pass through the membrane, causing an

156
unexpected increase in ionic strength as the protein solution is
concentrated.
Such an increase in ionic strength would account for the broader
absorption derivative at = 6 in the acid-metLb spectra of the pH
7.0-purified samples.
Although ferric Lbs purified by the two-column procedure were
similarly concentrated by ultrafiltration, they were then equili-
brated with 20 mM phosphate buffer, pH 7.0, and reconcentrated
using dry Sephadex before their e.p.r. spectra were recorded (see
2.11.1). This should have produced ferric Lb in buffer of very
nearly pH 7.0 and a concentration of 20 mM. The conformation of
the high-spin acid-metLb in these preparations would be such that
their low-temperature e.p.r. spectra would have nearly axial
symmetry.
The e.p.r. spectra of the acid-metLbs purified at pH 7.0 show an
absorption at = 4.3 which is larger than that of the Lbs purified
by the two-column procedure. Also, the spectrum of the soybean Lba
sample purified at pH 7.0 (which had no signal R) had a larger
= 2 absorption than that of the Lba sample from the two-column
purification (cf. Figs. 4.4.a & 6.1.a). The spectrum of the
peroxidase fraction has pronounced absorptions at E = 4.3 and near
E = 2 (Fig. 6. 2) , suggesting that the Lb samples purified at pH 7.0
are contaminated with components of this fraction. The absorption
at = 4.3 is presumably from non-haem iron and not from peroxida-
ses (Blumberg et al., 1968). These differences demonstrate the
advantage of using the two-column purification procedure.
6.2.2 Low-spin features
The acid-metLbs purified at pH 7.0 had low-spin absorptions near
E = 1.72, 2.28, 2.73 and 3.08 which were much larger than the

157
corresponding absorptions in the spectra of the Lbs purified by
the two-column procedure. The absorptions at E = 1.72, 2.28 and
2.73 originate from an endogenous dihistidyl haemichrome (see 6.5)
and that at E = 3.08 is either from ferric Lb nicotinate or a
second endogenous haemichrome or both (see 6.6). The relative
strength of these low-spin absorptions is again thought to be due
to conformational changes in the Lb caused by the high ionic
strength of the pH 7.0-purified samples. In the case of the
absorption at E = 3.08, it may also be due to a higher concentra-
tion of nicotinate in these samples (see 6.6).
The acid-metLb spectrum of one soybean Lbc sample and one cow-
pea ferric Lb sample showed relatively large absorptions from
ferric Lb hydroxide (see 4.4). These absorptions are absent from
the corresponding spectra of Lb samples purified by the two-
column procedure. The most probable reason for this difference is
that the pH of the above-mentioned pH 7.0-purified samples was
greater than 7.0.
When protein solutions in 5-40 mM phosphate buffer, pH 7.0,
were concentrated over Amicon UM10 membranes, an increase in pH of
0.3-0.5 pH units was observed. UM10 membranes bind protons, and
their possible binding of phosphate ions (see 6.2.1) may also be
involved in this increase in pH.
Other workers have noted the effect of ionic strength on the
Mossbauer and e. p. r. spectra of haemoproteins.
Winter et al. (1972), referring to unpublished work, found that
the M6ssbauer spectra of acid-metHb and ferric HbOH' were very
sensitive to small changes in the protein produced by variations in
ionic strength. They therefore concentrated their Hb derivatives
by a method which avoided exposing them to high concentrations of

158
buffer salts. (A dialysis tube containing a solution of the
derivative was buried in dry Sephadex G-25 and left at 4°C.)
Appleby et al. (1976) demonstrated the sensitivity of the e.p.r.
spectrum of acid-metLba to ionic strength when they found that
increasing the salt concentration of the solution at pH 7.0 (to
0.2M potassium phosphate buffer) increased the proportion of the
species having a g value of 3.02 and decreased the proportion of the
Lb0H- derivative. This effect is presumably due to a change in
conformation of the Lb (see also 7.5).
The above suggestions on the effect of ionic strength on the
e.p.r. spectrum of acid-metLb could be checked by equilibrating
samples of Lb purified by the two-column procedure with concentrated
phosphate buffers at pH 7.0 (e.g. 50 mM, 0.1M and 0.2M) and compar-
ing their e.p.r. spectra with those of Figs. 6.1 and 4.4.
6.2.3 Features of the acid-metLba e , p, r. spectra
The acid-metLba e.p.r. spectrum of Appleby et al. (1976) has
features which are present in the e.p.r. spectra of acid-metLb
samples purified at pH 7.0, but only weakly represented in, or
entirely absent from, the spectra of the acid-metLb samples purified
by the two-column procedure. These are: high-spin absorptions near
g = 6.22 and 5.48 (see 6.2.1) and relatively large low-spin absorp-
tions at g = 2.69, 2.24 (from the major low-spin species) and 3.02
(from the minor low-spin species). These features in the spectra of
the pH 7.0-purified samples are thought to be due to conformational
differences between these Lbs and those purified by the two-column
procedure.
The assumed difference in conformation between the acid-metLba of
Appleby et al. and that purified by the two-column procedure may be
due to the acetate buffer of relatively low pH (5.2) used by Appleby

159
et al. to purify their Lba. At pH 7.0 and 25°C, 1M sodium acetate
causes a slight denaturation of ferric Mb (Ibanez & Herskovits,
1976) and in the pH range 4.6-2.9, 20 mM sodium acetate buffer
causes subtle changes in the tertiary structure of bovine serum
albumin, undissociated acetic acid binding to side-chain carboxyl
groups of the protein (Cann, 1971). Appleby et al. used a gradient
of 10-100 mM buffer to elute the ferric Lbs from their DEAE-
cellulose column; conditions which are less extreme than those
described above. However, Lb is less stable than Mb towards urea
denaturation (Ellfolk et al., 1974) and the association between the
haem group and globin is weaker in Lb than it is in Mb (Nicola et
al., 1975). Thus, the acetate buffer may produce small conforma-
tional changes in the Lba which are not freely reversible when this
buffer is exchanged for MES or potassium phosphate to produce the
acid-metLba derivatives used in the e.p.r. investigation.
To check this possibility, acid-metLb samples purified by the
two-column procedure should be dialysed against a range of acetate
buffers (10-100 mM) at pH 5.2 and 4°C for about 12h, and then
equilibrated with 20 mM phosphate buffer, pH 7.0; reconcentrated
(see 2.11.1), and their e.p.r. spectra recorded. Controls would be
dialysed against phosphate buffers at pH 7.0.
6.3 Ferric Lb fluorides (LbF-)
The fluoride derivatives of the three Lbs gave very similar
e.p.r. spectra (Fig. 6.3 and Table 6.1) which were almost identical
to the spectra of ferric MbF- and ferric HbF- (Peisach et al., 1971).
The values near 6.0 and 2.0 and the absence of low-spin signals
indicate that the fluoride derivatives possess nearly axial symmetry
and are predominantly, if not entirely, high-spin at low tempera-
tures.

160
Fig. 6.3
0.5 1.5
2.5 3.5
H (kG) E. p. r. spectrum of soybean Lbc fluoride (LbcF) at pH 7.0. Tempera-
ture 9 K, power 2 mW. The insert shows the expanded doublet at g = 2 (due to the fluoride superhyperfine splitting) from the main spectrum.
Field sweep of main spectrum 4 kG; of insert, 400 G.
Fig. 6.4
3.0 H (kG)
1.0 2.0 4.0 5.0
E. p. r. spectrum of cowpea ferric Lb hydroxide (Lb0H ) at pH 9.6.
Temperature 20 K, power 0.02 mW.

161
The width of the absorption derivative at E = 6 was about 70G;
approximately 20G greater than that for the corresponding acid-metLb
derivatives. An increase of the same magnitude is found on going
from acid-metMb and Hb to the corresponding fluoride derivatives
(Table 6.2).
The LbF e.p.r. spectra are consistent with the magnetic suscep-
tibility measurements of Ehrenberg & Ellfolk (1963) on LbdF'.
These authors concluded that LbcF- was 100%cor nearly 100%, high-
spin at room temperature. However, an absence of low-spin e.p.r.
signals does not necessarily mean that a ferric haemoprotein
derivative is entirely high-spin (Smith & Williams, 1970).
A very weak absorption nears = 3.1 was present in the spectrum
of LbaF-, but this probably originates from a trace of Lb nicotinate
in this sample (see 6.6). Presumably, insufficient fluoride was
present in the sample to displace all the nicotinate from the Lba.
The doublet at = 2 (Fig. 6.3) proves that the fluoride is
ligated to the haem iron atom of Lb. The value of the superhyper-
fine splitting measured from this feature was 43 ?' 2G for all three
Lb fluorides (Table 6.1), very close to that found for HbF- and
MbF1- — approx. 44G (Peisach et al., 1971).
The LbaF- e,p.r. spectrum of Appleby et al. (1976) was almost
identical to the LbF" spectra discussed above, and gave a super-
hyperfine splitting value of 44G.
LOW-SPIN DERIVATIVES
6.4 Ferric Lb hydroxides (LbOH-)
All three ferric Lb hydroxides gave similar e.p.r. spectra with
very similar L values (Fig. 6.4 and Table 6.3). Buffer of pH 9.6
was used to prepare these derivatives to avoid the change in
structure of the Lbs which is likely to occur at higher pH values.

162
It is known that sperm whale ferric Mb undergoes a considerable
change in apparent helical content on going from pH 11.4 to 12.5 and
its low-spin e.p.r. spectrum changes slightly, the change being
reversible on addition of acid (Gurd et al. 1967 and see Table 6.3).
The LbOH- E values were nearer to those of MbOH- at pH 12.5-12.8
than to those of MbOH- at pH 11.3 and below. However, it is not
possible to conclude anything about the structure of the globin of
Lb from this.
The values of the Lb hydroxides agree well with those of a low-
spin complex seen in the spectra of a soybean Lbc and a cowpea
ferric Lb sample purified at pH 7.0 (see Table 4.7) indicating that
this complex is ferric LbOH-.
6.5 Ferric Lb azide and imidazole derivatives (LbN3 and LbIm)
6.5.1 Azides
The three LbN3 complexes gave similar low-spin spectra (Fig. 6.5)
which had very similar sets of g values, closely resembling those
for the azide derivative of type A Mb crystals (Helckē et al., 1968)
and frozen solutions of MbN3 (Hori, 1971) —see Table 6.3. MbN3
and LbN3 have lower-than-axial symmetry, i.e.they exhibit rhombic
distortion.
However, the spectrum of LbcN3 differed slightly from those of
1,19253- and cowpea LbN3-, having noticeably broader features at g =
1.72 and 2.79. This may be because Lbc consists of two distinct
proteins, Lbcl and Lbc2, whose optical spectra at 20°C in MES buffer,
pH 5.2, indicate that they both have a high-spin and a low-spin
component, with the proportion of high-spin component being slightly
greater in Lbc1 (Appleby et al., 1975). If the Lbc1N3 and Lbc2N3
e.p.r. spectra differ only slightly, they will overlap so much that
a broadened spectrum results, rather than two distinct spectra.

Fig. 6.5
a
b
3.0 H (kG)
4-0
163
1.0 2.0
E. p. r. spectra of the azide derivatives of soybean and cowpea ferric
Lbs (L103-) at pH 7.0. (a) LbeN3- at 37 K and 20 mW; (b) LbaN3- at
37 K and 20 mW; (c) cowpea LbN3 at 20 K and 0.02 mW.

Table 6.3 Measured g values of low-spin ferric Lb derivatives compared with those of some Mb and Hb derivatives
DERIVATIVE LEGHAEMOELOBIN
Mb and Hb Reference
ffix
Hydroxide, pH 9.6
Soybean Lba 1.86 2.19 2.51 Mb 1.84 2.14 2.57 Soybean Lbc 1.84 2.19 2.54 Mb 1.85
2.17 2.54
Cowpea Lb 1.86 2.18 2.51 Hb 1.83 2.17 2.56
Azide, pH 7.0
Soybean Lba 1.72 2.21 2.77 Mb 1.71 2.19 2.82 Soybean Lbc 1.72 2.21 2.79 Mb 1.72 2.22 2.80 Cowpea Lb 1.72 2.20 2.79 H-type 1.67 2.26 2.80a
Imidazole, pH 7.0
Soybean Lbc
1.67 2.27
1.49 2.27
2.77b Mb 1.53
2.93 Hb 1.43 2.26 2.29
2.91
2.93 Cowpea Lb 1.68 2.27 2.77 B-type 1.47 2.26 2.95a
Cyanide, pH 7.4
c 1.93 3.33 Mb 0.93 1.89 3.45 Cowpea Lb
Nicotinate, pH 6.9 Soybean Lba c 2.17 3.07 Soybean Lbc 1.23 2.18 3.14 Cowpea Lb c 2.15 3.11
pH 11.3 pH 12.8 Curd et al. (1967)
pH 10.0 Nakano et al. (1971)
Helckg et al. (1968) Hori (197l Blumberg & Peisach (1971a)
Hori (1971) Rein et al. (1975) Blumberg & Peisach (1971a)
Hori (1971)
Spectra were recorded at 8-40K. Soybean Lbs were from Merit-CC705 nodules, cowpea Lb from CB756 nodules.
a a values characteristic of the particular type of endogenous low-spin compound of Hb.
Two sets of absorptions were present, plus an absorption at g = 1.99.
c Unresolved.

165
Different LbcN3 spectra may arise because the extent of the inter-
action between the distal histidine and the haem iron should be
greater in Lbc2 than in Lbc1. (Lbc2 has the most low-spin com-
ponent and this is presumably formed by the distal histidine bonding
(interacting) with the haem iron). In consequence, there may be a
slight difference in the extent of the interaction between the
distal histidine and the azide in the two LbcN3 complexes. McCoy &
Caughey (1970) suggested such an interaction to explain the
presence of two types of MbN3 complex. Figure 6.6, taken from
Maxwell & Caughey (1976) illustrates this type of interaction, where
the iron-bound nitrogen of azide assumes a positive character and
acts as acceptor for electron donation from the electron pair of the
unprotonated imidazole nitrogen of the distal histidine, (an n-a donor - acceptor interaction). A slight difference in this inter-
action will result in a difference in the electron density at the
iron in the two LbcN3 complexes, giving rise to slightly different
e. p. r. spectra.
6.5.2 Imidazoles
The spectra of soybean Lbclm and cowpea LbIm are shown in Fig.
6.7. The cowpea LbIm spectrum resembled those of cowpea LbN3 and
soybean LbaN3 , with g values close to those of the LbN3 deriva-
tives, the greatest difference being in the g.x values (Table 6.3).
However, soybean Lbclm had a complex spectrum, showing two sets of
low-spin absorptions and a pronounced absorption at g = 1.99. This
absorption was visible in the spectrum recorded at 80K, although no
absorption was present at g = 6. Thus it does not originate from
high-spin ferric Lb.
One of the Lbclrn species had g values almost identical to those
of cowpea LbIm and very close to the characteristic g values for an

/H
:N
166
FIG. 6.6 Schematic representation of the donor-acceptor type of
interaction between the distal histidine and azide in MbN3 as
proposed by McCoy & Caughey (1970). (Based on a figure of Maxwell
& Caughey; 1976.)

a
b
1·0 2'0
Fig. 6.7
3·0 H (kG)
167
4'0
E.p. r. spectra of the imidazole derivatives of ferric Lbs (LbIm) at
Iii 7.0. (a) soybean L~Im at 32 K; (b) cowpea LbIm at 40 K. 'lbe
power was O. 2 mW. 'DIe small absorption from a speci es having a B-type
spectrum is indicated in the cowpea LbIm spectrum.

168
H-type low-spin Hb complex (haemichrome) as defined by Blumberg &
Peisach (1971a). The g values of these two LbIm complexes are
different from those of MbIm and HbIm. The other Lbclm species had
g values close to those of MbIm and HbIm and those of the
characteristic B-type low-spin Hb complex as defined by the same
authors (see Table 6.3). Interestingly, there is a slight trace of
this B-type spectrum in the cowpea LbIm spectrum (indicated by the
arrow on Fig. 6.7). The B-type of low-spin complex was originally
discovered by treating ferric Hb A with salicylate, a process which
produces an irreversibly denatured haemichrome where the 6th ligand
is provided by the protein. According to Blumberg & Peisach, it can
also be produced by imidazole which, like salicylate, denatures the
protein. Presumably because of this, these authors added histidine
and not imidazole to ferric Hb A to produce a dihistidyl Hb complex
having the same g values as endogenous low-spin complexes of
isolated oC chains of Hb A and Hb H (o r chain tetramer) . These
endogenous complexes are reversible haemichromes and classified as
H-type complexes (Blumberg & Peisach, 1971b). Imidazole buffers can
cause localized reversible denaturation of enzymes, for example
phosphorylase b. L-histidine, however, has only a slight denaturing
activity on this enzyme (Hedrick et al., 1969).
In the H-type endogenous complexes, the distal histidine bonds
with the iron. For the B-type complexes, the 6th ligand to the iron
was not identified (Blumberg & Peisach, 1971a).
Cowpea LbIm and one soybean Lbclm species had g values near 1.68,
2.27 and 2.77, close to those of one of the low-spin species seen in
the spectra of the acid-metLb samples purified at pH 7.0 (see 4.4
and Table 4.7) and by the two-column procedure. The gy values of
the above LbIm complexes are nearer to the g values of the low-spin

169
acid-metLb species than they are to the gz values of the LbN3
complexes (cf. Tables 4.7 and 6.3). This suggests that the Lblm
complexes are suitable 'models' for the low-spin acid-metLb species,
and that this species is probably a dihistidyl (bis-imidazole)
haemichrome. As in the H-type endogenous haemichromes of the oL
and /-' chains of Hb A, the histidine distal to the iron atom
approaches close enough to bond with it. This is in agreement with
the suggestion of Appleby (1974 ) and Appleby et al. (1976) that the
major low-spin acid-metLb species is a dihistidyl haemichrome.
It is not clear why the soybean Lbclm sample shows two sets of
low-spin absorptions. Rein et al. (1975) presented e.p.r. evidence
for two low-spin components of acid-metHb. One component (Isomer I)
had g values of 1.51, 2.22 (approx.) and 2.92, similar to those of
the B-type low-spin Hb. The other (Isomer II) had g values of 1.67,
2.22 (approx.) and 2.77, similar to the H-type low-spin Hb. These
two sets of g values are close to the g values for the two low-spin
species in LbcIm (Table 6.3). Rein et al. explained their results
by suggesting that the two low-spin components of acid-metHb were
different conformational isomers of an intramolecular bis-imidazole
complex. They said that this was because various positions of the
imidazole planes of the two histidines bonded to the iron were
possible. However, this is not considered a likely explanation for
the two Lbclm species.
Caution is necessary in the interpretation of the results of
Rein et al. Isomer I was not detected by Nakano et al. (1971) in
their e.p.r. studies of acid-metHb. These authors found only one
low-spin complex of acid-metHb, having g values of 1.70, 2.20 and
2.80, similar to those of Isomer II. Rein et al. used nitrite
treatment of intact red cells to oxidize their Hb. However, nitrite

170
is not recommended for the oxidation of Hb since it reacts
irreversibly with this protein (Uchida & Klapper, 1970). Blumberg
& Peisach (1971b), after incubating intact red cells with isotonic
nitrite, used e.p.r. to demonstrate the presence of several low-
spin forms of ferric Hb in addition to high-spin ferric Hb. These
low-spin forms included both reversible and irreversible endogenous
haemichromes. Thus, Isomer I is probably an artifact of the nitrite
oxidation procedure and may be an irreversible haemichrome.
The similarity of the E values of HbIm (Rein et al., 1975) and
MbIm (Hori, 1971) to those of the B-type low-spin Hb raises the
question as to whether these compounds are complexes of native Hb or
irreversible haemichromes, the Hb being in a denatured state.
Winter et al. (1972), on the basis of paper electrophoresis of
dialysed HbIm samples, suggested that a significant amount of de-
naturation of the protein occurred on formation of this complex.
These authors concluded that the bulky imidazole ligand could not
bond with the haem iron without irreversibly changing the protein's
conformation. They did not compare imidazole's action to that of
salicylate as Blumberg & Peisach do.
The LbIm samples should have been checked for possible denatura-
tion. Rein et al. and Hori did not check their imidazole deriva-
tives for denaturation and do not say what ratio of imidazole:
haemoprotein was used to prepare them. The LbIm derivatives were
made using a relatively low concentration of imidazole (Lb:Im was
approx. 1:10). Recording the optical spectra of the LbIm samples
and concentrating them took less than 1 h, whereas Winter et al.
took 5-8 h to concentrate their HbIm samples. After concentration,
the ratio of Lb:Im should have been between 1:2 and 1:3. E.p.r.
spectra of the samples at 80K showed no signal at g = 6, indicating

171
that most, if not all, of the Lb was complexed with imidazole. This
rapid method of preparation should decrease possible denaturation.
The LbIm complexes having the H-type spectrum are thus considered to
have an N atom of imidazole occupying the sixth co-ordination
position of the iron (Blumberg & Peisach, 1971a), with the Lb in its
native conformation or a conformation close to the native one and
capable of returning to it when the imidazole is replaced by a water
molecule. The B-type Lbclm spectrum may then indicate that one
component of Lbc is very susceptible to imidazole denaturation.
However, Lbs may not be denatured easily by imidazole because
they can accommodate bulky ligands; for example the aliphatic
carboxylic acids: propionate, butyrate and valerate (Ellfolk, 1961b)
and nicotinate (Appleby et al., 1973). This is because Lb's haem
pocket has a greater flexibility than Mb's; its haem group being in
less intimate contact with the protein side chains than is that of
Mb (Nicola et al., 1975). This may therefore explain why cowpea
LbIm and one Lbclm complex have different e.p.r. spectra from those
of MbIm and HbIm. If Lb is able to bind imidazole without under-,
going denaturation, the two Lbclm e.p.r. spectra may arise because
Lbc consists of Lbcl and Lbc2.
Azide binds to Mb without detectably changing the protein's
tertiary structure, but many bulky ligands cause changes in the
orientation of side chains and the haem without significantly alter-
ing the crystal dimensions (Magnusson, 1971). Thus, in the Lbclm
complexes, the bound imidazole's interaction with the distal
histidine's imidazole group may differ significantly between Lbc1Im
and Lbc2Im, resulting in different e.p.r. spectra. The nature of
this interaction may be hydrogen-bonding between the lone pair on
the unprotonated imidazole N of the distal histidine and the H of

172
the NH group of the imidazole bound to the haem iron. Thus, this
interaction, illustrated in Fig. 6.8, differs slightly from that pro-
posed for the LbcN3 complexes (Fig. 6.6).
Support for this type of interaction comes from the e.p.r. results
of Momenteau et al. (1973). They recorded the e.p.r. spectrum of bis-
imidazole deuterohaeOX dimethylester, measuring .g values of 1.53,
2.27 and 2.93, similar to those for a B-type low-spin Hb complex.
Increasing additions of tetraethylammonium fluoride (TEAF) produced in
sequence three low-spin complexes: I, II and III as demonstrated by
their e.p.r. spectra. The g values of I were of the B-type, those of
II and III of the H-type (e.g. III had E values of 1.77, 2.26 and 2.70).
Fig. 6.9 illustrates the reaction scheme proposed by these authors.
Momenteau et al., from this and other evidence, suggested that F-
interacts specifically with the NH group of the imidazole ring. They
further suggested that this interaction would decrease the basicity
of the imidazole, thereby increasing the positive charge on the iron
and changing the e.p.r. spectrum such that the anisotropy of the
tensor decreased. Fluoride may thus be acting here in a manner some-
what similar to that in which the distal histidine is presumed to
interact with the imidazole bound at the sixth co-ordination position
of the iron the the LbcIm complexes. In one complex the distal
histidine may hydrogen bond with the NH group of the bound imidazole.
In the other complex this interaction may be absent.
However, the model complexes of Peisach et al. (1973) must also be
considered in connection with the two LbcIm e.p.r. spectra. These
authors prepared the following compounds: bis-imidazole haem (haemin
chloride and imidazole were melted together), which gave an e.p.r.
spectrum having .E values of 1.51, 2.24 and 3.02. A similar melt,
which also contained a small amount of solid NaOH, gave an e.p.r.

173
:N/
FIG. 6.8 Schematic representation of the proposed hydrogen-bonding
interaction between the distal histidine and the imidazole bound
at the 6th coordination position of the iron in one Lbclm complex
Im (Im-F ) (Im-F1 F-
F- 1 F F- 1
DFe DFe > DFe > DFe DFe Im Im Im I Im
Im Im (Im-F ) (Im-F F-
FIG. 6.9 Scheme proposed by Nomenteau et al (1973) for the reaction
of fluoride (added as tetraethylammonium fluoride) with a bis
imidazole complex of deuterohaemin IX dimethyl ester (DFe).

174
spectrum having values of 1.72, 2.26 and 2.78. These authors
considered the first compound to be a model for the B-type low-spin
Hb complexes, and the second to be a model for the H-type complexes.
In a later paper these compounds were also considered to be models
for (respectively) the minor and major low-spin species in the acid-
metLba e.p.r. spectrum (Appleby et al. 1976—see also 6.2.3).
Interestingly, a similar absorption to the one at g = 1.99 in the
spectrum of Lbclm is present in the bis-imidazole haem spectrum of
Peisach et al. (1973), but not commented upon by them. They conclu-
. ded that the model compound with the B-type spectrum had both
imidazoles protonated at N1, whereas the compound with the H-type
spectrum had one imidazole with no proton on this atom (see Fig.
6.10.a & b). This was considered to be the basis for the difference
between the low-spin ferric haemoglobin complexes in groups B and H
of Blumberg & Peisach's classification scheme (1971a). In a later
paper, Peisach et al. (1975) show the H-type low-spin haemoglobin
with both imidazole N1 atoms unprotonated (Fig. 6.10.c).
Peisach (1975) has suggested that the proximal histidine of Hb
and Mb can be deprotonated because its N1 atom has a hydrophobic
environment (the side chains of three leucine residues). Alteration
of the hydrophobicity of this environment can then cause protonation
of the N, giving rise to a B-type e.p.r. spectrum. According to this
hypothesis, the B-type spectrum of HbIm and MbIm would arise by
imidazole denaturing the proteins and altering the environment of N1
of the proximal histidine's imidazole sufficiently to allow it to be
protonated. A difference in the hydrophobicity of the environment
of the proximal histidine between Lbcl and Lbc2 may thus be respons-
ible for the two Lbclm e.p.r. spectra.
However, it is considered more likely that the proposed differ-

H N
2(
3N
5
H
N./
4
N\ N
Fe
N\ Fe
N~
Fe
N N N N N \N
4
N
5
H
(a)
(b) (c) FIG. 6.10 The structures of the model compounds for: (a) the B-type and (b) the H-type low-spin complexes of
ferric Hb as proposed by Peisach et al. (1973). The structure proposed by Peisach et al. (1975) for the H-type
low-spin complex of Hb (an endogenous haemichrome) is shown in (c).

176
ences in hydrogen-bonding between the distal histidine and the bound
imidazole are responsible for the two spectra.
To test some of the hypotheses discussed above, it would be
necessary to separate the Lbc components and record the e.p.r.
spectra of their azide and imidazole derivatives, checking the imida-
zole derivatives for possible denaturation. However, this cannot be
done without exposing these proteins to acetate buffer during their
separation (Appleby et al., 1975) and this may alter their conforma-
tion (see 6.2.3) and consequently the e.p.r. spectra of their
derivatives. It would, however, be possible to record the e.p.r.
spectrum of the L-histidine complex of unfractionated Lbc, where
protein denaturation could be ruled out.
6.6 Ferric Lb cyanide and nicotinate derivatives (LbCN- and LbNic-)
Cowpea LbCN- and the nicotinate derivatives of the three Lbs gave
no detectable e.p.r. spectra at liquid N2 temperatures. At 26K,
however, cowpea LbCN- gave a low-spin spectrum, indicative of a
greater anisotropy of the g tensor than is found for the LbN3
complexes (Fig. 6.11 and Table 6.3). The high-field g value, Ex,
was not resolved, but the gz and gz values were fairly similar to the
corresponding g values for a frozen solution of MbCN-, where the gx
value has been quoted as 0.93 (Hori, 1971). This region of the
cowpea LbCN- spectrum was scanned, but this feature is extremely
difficult to detect with an apparatus employing 100kHz field modula-
tion. Blumberg has observed it in frozen MbCN- solutions using a
rapid passage apparatus (personal communication to J. F. Gibson).
At 10-20K the nicotinate derivatives of all three Lbs gave similar
e.p.r. spectra with the Ez and values for the three derivatives
being quite similar (Fig. 6.12 and Table 6.3). Only from the
spectrum of LbcNic was the Ex value measurable. The appearance and

-o 2.5
177
Fig. 6.11
5.0 H (kG)
7.5
E.p.r. spectrum of cowpea ferric Lb cyanide (LbCN) at pH. 7.4. Tem-
perature 26 K, power 200 mW. The blank trace (B) is the spectrum of
the solution used to prepare the LbCN (20 mM phosphate buffer, pH 7.0,
containing 3.6 mM KCNifinal pH, 7.4) recorded under the same conditions.
Note the absorption near g = 4.3 in B.
Fig. 6.12
J
I I 1 i 1.5 4.0 6.5 9.0
H (kG)
E.p.r. spectrum of soybean Lbc nicotinate (LbcNic-) at pH 6.9. Tem-
perature 20 K, power 0.02 mW.

178
E values of the LbcNic spectra show that they resemble the LbCN-
spectrum rather than the spectra of the other low-spin Lb derivatives.
These observations are in agreement with those of Appleby et al.
(1976), who found g values of 1.15, 2.10 and 3.11 for LbaNic- and
demonstrated convincingly that the N atom of nicotinate bonds with
the haem iron.
The £ values of the three LbNic derivatives suggest that the
absorption near E = 3.1 in the spectra (recorded at 10-20K) of the
acid-metLbs purified by the two-column procedure originates from a
trace of LbNic (see 6.1.1). An acid-metLbc sample which showed
this absorption in its spectrum recorded at 11K no longer showed it
at 86K, although the other low-spin absorptions were still present
(see 6.1.1). This observation is consistent with the above sugges-
tion.
No steps were taken in either of the Lb purification procedures to
'strip' the Lb of any nicotinate which may have been present (Appleby
et al., 1975).
Compared with the e. p. r. spectra of the acid-metLb samples puri-
fied by the two-column procedure, the relatively greater strength of
the absorption near g = 3.08 in the spectra of the acid-metLb
samples purified at pH 7.0 may be due to either a higher concentration
of nicotinate in these samples, or to their presumed high ionic
strength, or to both (see 6.2.2). During the two-column purification
procedure the crude Lb was passed through Sephadex G-25 columns at
pH 7.4 and pH 8.0. This should have decreased the concentration of
any nicotinate present, because the affinity of ferric Lb for nicotin-
ate decreases with increasing pH (Appleby et al., 1973). The .g
values of the minor endogenous dihistidyl haemichrome in the acid-
metLba spectrum of Appleby et al (1976) were: 1.34, 2.24 and 3.02.

179
If a larger proportion of this species was present in the acid-metLb
samples purified at pH 7.0, a stronger absorption near E = 3.08 would
result.
To test the above suggestions it would be necessary to strip crude
Lb of any endogenous nicotinate using the method of Appleby et al
(1975). Then, Lba and Lbc could be purified from it by the two-
column procedure and the e.p.r. spectra of their acid-met derivatives
recorded. Attempts could then be made to produce, or increase the
size of, an absorption near E = 3.08 by 'perturbing' the conformation
of the proteins with higher concentrations of buffer (see 6.2.2).

180
Section 7
Presence of nitrosyl leghaemoglobin (LbNO) in crude Lb preparations
7.1 Introduction
The preliminary observations on signal R (Fig. 7.1) are detailed
in section 4.4. Attempts were made to identify the species responsi-
ble for this signal. Unless otherwise stated, all the e.p.r. spectra
were recorded at 86-100 K.
Reduction of a sample of crude Merit-CC705 Lb with Na2S204 on a
Sephadex G-25 column (section 2.13) did not affect the size of the
signal. (A comparison was made with a control sample.). A similar
result was obtained for another aliquot of the same crude Lb sample
oxidized for 10 min at 20°C with 2 moles K3Fe(CN)6 per mmole Lb.
The presumed ferric Lb was completely separated from ferro and ferri-
cyanide as described in section 2.7.3.
7.2 On the nature of the species responsible for signal R
It was thought that a low-molecular-weight iron complex or a low-
molecular-weight iron-containing protein, other than Lb, present in
crude Lb preparations might be responsible for signal R. However,
almost all the iron in a crude Lb preparation could be accounted for
by Lb, according to the estimation by the CMHb method (section 3.3).
The CMHb method, however, could be estimating a low-molecular-weight
non-Lb iron-containing protein as Lb.
To identify such a low-molecular-weight protein, a crude soybean
Chippewa-CC705 Lb sample (0.5 ml) was passed through a column (1.2 cm
x 16 cm) of Sephadex G-50 (superfine grade), equilibrated with 50 mM
phosphate buffer, pH 7.0. Fractions were collected and their e.p.r.
spectra recorded. As the concentration of Lb in the fractions
increased, so did the size of signal R. It was not present in the
yellow zone which came off the column just in front of the Lb band.

FIG. 7.1 The e. p. r. signal R (from nitrosyl leghaemoglobin).
(a) E. p. r. spectrum of crude soybean Chippewa-CC705 Lb showing
the large signal R at p; . 2. Temperature 93 K, power 200 mW, gain
of main spectrum x 1000 and of signal R, x 63. (b) Ekpanded
spectrum of signal R from a similar crude soybean Chippewa-00705
Lb preparation. Temperature 86 K, power 200 mW, field sweep 400 G,
gain x 40.

I I I I
I I 2.5
1 1.5 0.5
Fig. 7.1
I 3.5 4.5
3.05 314 3.23 3.32 3.41
H (kG)
I
b

182
This was presumed to consist of peroxidases, by analogy with the
fractionation of crude Lb on Sephadex G-200, obtained by Moustafa &
Flux (1966).
Analysis of the fractions by PAGE, with amido black-staining,
showed that those which had no signal R contained only non-Lb pro-
teins. The dilute tail fraction of the Lb band, which showed a
small but definite signal R, contained no detectable contaminant
proteins.
These results strongly suggest that the species responsible for
signal R is a form of Lb.
7.3 Decay of signal R
After storage of a solution of crude soybean Merit-CC705 Lb at
-30°C for about 8 months (with one thawing and refreezing), signal R
had disappeared. To monitor the decay of the signal, a sample of
crude soybean Altona-CB1809 Lb was equilibrated with 2 mM phosphate
buffer, pH 5.8, on a column of Sephadex G-25 and left under air and
on ice. Samples (0.3 ml) were removed periodically, introduced into
e. p. r. tubes and immediately frozen in liquid N2. The e. p. r. spectra
were then recorded and the magnitude of signal R and the signal at
= 6 measured. Plotting the magnitude of these signals against time
(Fig. 7.2) showed that signal R had completely disappeared after
about 4 days. During this period the size of the g = 6 signal
increased considerably. (Only a small 'bump' was present in the
spectrum of the initial sample).
It is therefore likely that the decay of the species responsible
for signal R is directly, or indirectly, related to the formation of
acid-metLb. It was assumed that the Lb02 in the crude Lb preparation
was undergoing autoxidation to acid-metLb (see 5.5) while signal R
was disappearing.

6.0 Z CD II 6.0
J F—
4.0 U
U- 0 w 0
2.0 12 2
en O
0
0
4.0
2.0
60
TIME (h)
0 80 100 120 20 40
0
102
x M
AGNI
T UDE
OF
SIG
NAL R (
c.ua
FIG. 7.2 Decay of signal R and growth of the high-spin acid-metLb signal at g = 6 with time in a crude
soybean Lb sample stored at 0°C.

184
An aliquot of the crude soybean Merit-CC705 Lb sample above, which
had lost the species responsible for signal R, was reduced with
Na2S204 on a Sephadex G-25 column (see 2.13). Its e.p.r. spectrum
showed no absorptions near E = 6, and only a small absorption near
E = 2, which did not resemble signal R.
The sample used for this spectrum was thawed in the e.p.r. tube.
The tube was then put on ice and 02 bubbled through the Lb solution
for 2 min. It was then refrozen in liquid N2 and its e.p.r. spectrum
recorded again. The only change in the spectrum was the appearance
of a small bump in the s = 6 region, indicating that some autoxida-
tion of the Lb02 had occurred.
7.3.1 Detection of superoxide dismutase activity in legume root
nodules
The autoxidation of bovine oxyhaemoglobin produces the superoxide
anion radical (Wever et al., 1973), so it is reasonable to assume
that the autoxidation of Lb02 will also produce this species.
However, the autoxidation of Lb02 in crude Lb preparations may also
be brought about by Cut+ acting catalytically (section 5.5). In this
process,superoxide (02 ) is not thought to be produced (Rifkind,
1974). It was considered that 02 might be related to the species
responsible for signal R.
The enzyme superoxide dismutase catalyzes the dismutation of
superoxide anions to hydrogen peroxide and oxygen:
02 + 02 + 2H —~ H202 + 02
It is present in all respiring cells, serving to protect them against
the deleterious effects of 02 (Fridovich, 1975).
Root nodules of Vigna radiata (freshly harvested) and soybean
Altona-CB1809 (stored for 6 weeks at -30°C) were assayed for the
presence of superoxide dismutase. Nodules (1 g fresh wt. per 3 ml

185
medium) were added to ice-cold 50 mM phosphate buffer, pH 7.8, con-
taining 10% (w/v) Polyclar. They were crushed with a glass rod in a
centrifuge tube at 0°C for about 1 min. The homogenate was then
centrifuged at 20,000 a for 10 min at 4°C and the clear supernatant
removed and stored in liquid N2.
Samples (10 and 20 /x1) of the thawed supernatants were then NNW
electrophoresed on acrylamide gels which were then assayed for 02
dismutase activity (see 2.16). After 30 min the Vigna samples showed
2 clear zones and the soybean samples showed 5. Other less distinct,
clear zones became apparent later, but were probably due to peroxi-
dases. The mobilities of the 02 dismutase bands, relative to
bromophenol blue, were: Vigna radiata, 0.58 and 0.68; soybean, 0.43,
0.60, 0.65, 0.71 and 0.81. The greater number of bands in the soy-
bean sample may result from the storage of these nodules at -30°C,
causing the release of bacteroid Oz dismutases during the extraction.
Thus, 02 dismutase activity is present in the soluble (plant -
cytoplasmic) fraction of soybean and Vigna radiata nodules, and almost
certainly also in the nodules of other legumes. It therefore seems
unlikely that 02 is involved in producing the species responsible
for signal R.
7.3.2 Ascorbate and the species responsible for signal R
A relatively high concentration of ascorbate (0.2 M) was present
in the medium used to extract soybean and cowpea root nodules (section
2.5). To see if ascorbate could produce the species responsible for
signal R, a sample of crude soybean Merit-CC705 Lb02,with no signal R,
was mixed with an equal volume of extraction medium containing
ascorbate and stirred for 3.5 h at 10°C. The ascorbate was then
removed on a column of Sephadex G-25, the Lb fraction concentrated by
ultrafiltration and the e.p.r. spectrum of a 0.3 ml sample recorded.

186
No signal R and no signal at g = 6 were observed. Any ferric Lb
produced by autoxidation will be reduced back to the ferrous state by
ascorbate, Lb's redox potential being more positive than that of
ascorbate (Henderson & Appleby, 1972).
Soybean Altona-CC705 or Altona-CB1809 nodules were crushed into
the usual extraction medium minus MgC12; into this medium minus
ascorbate (20 mM phosphate buffer, pH 7.2, plus 10% (w/v) Polyclar)
and into phosphate buffer only. The crude Lb was then isolated,
desalted on a column of Sephadex G-25 equilibrated with 20 mM phos-
phate buffer, pH 7.2, and 0.3 ml of the solution in an e.p.r. tube
frozen in liquid N2. The e.p.r. spectra showed that the magnitude of
signal R per mg Lb was only slightly greater in the sample extracted
in the presence of ascorbate than it was in the other two samples
(Table 7.1). Clearly, Polyclar and exogenous ascorbate (nodules
contain ascorbate — section 7.8) do not produce the species
responsible for signal R.
7.4 E. p. r. data on signal R
The shape of signal R in the e.p.r. spectra of many different Lb
preparations was always very similar. At high microwave power levels
(200 mW) the signal was found to be saturating. It was asymmetric
(Fig. 7.1), the lower lobe being longer and more narrow than the
upper lobe. The g value was measured at the point where the base line
crossed the sinal. Various determinations of this value were made,
the most accurate being that from a crude soybean Chippewa-CC705 Lb
sample (g = 2.017), where the microwave frequency was accurately
measured with a wavemeter.
When the spectrum of a similar Lb preparation was recorded at room
temperature, the g value was found to be about 2.014 and the upper
lobe of the signal was longer than the lower lobe. Less fine struc-

Table 7.1 Effect of nodule extraction medium on the magnitude of signal R
Extraction medium and soybean nodule type
Size of signal R (chart units)
Size of signal at E= 6 (chart units)
Lb concentrationa (mg/ml)
Size of signal R per mgLb
20 mM phosphate buffer, pH 7.2, + 0.2 M
1.34x 1ō 1 0.68 x 10⁻³ 9.40 4.75x1ō2
Na ascorbate + 10% (w/v) Polyclar. Altona-CC705
Phosphate buffer + 1.39x 1ō1 1.56 x 10⁻³ 11.35 4.08 x 10⁻²
Polyclar. Altona-CC705
Phosphate buffer only. 1.17 x 1 i ō 1.52 x 10⁻³ 9.30 4.19 x 10⁻²
Altona-CB1809
a Determined by the CMHb method.

188
ture was apparent in the expanded spectrum. Spectra recorded with a
15 min interval between them showed that the signal was decaying and
would have disappeared within 2 h (cf. the decay observed at 0°C -
section 7.3).
E.p.r. spectra of another crude Chippewa-CC705 Lb sample were
recorded at Q-band at 99 K. Microwave power levels of 20 mW and
200 mW were employed, and the microwave frequency measured as
35.810 GHz. Signal R, which had the usual shape at X-band, appeared
as shown in Fig. 7.3, the fine structure being much more clearly
resolved than it was at X-band. Three g values, designated X, Y and
Z (see Fig. 7.3), were measured from each of the spectra and very
good agreement between the sets of values was obtained. The values
were:
X 2.025 ± .002
Y 2.002 ± .001
Z 1.978 ± .002
The e.p.r. spectrum of the sample (still in the Q-band e.p.r. tube)
was recorded again at X-band and 100 K. Signal R was the same shape
as it was before the 4-band run.
7.5 Location of signal R in oxyleghaemoglobin (Lb02) fractions and
identification of nitrosyl leghaemoglobin as the species responsible
During the development of the two-column purification procedure,
all the Lb fractions from DEAE-cellulose phosphate columns at pH 5.8
and 8.0 were examined by e.p.r. spectroscopy (see 5.2 and 5.3).
This showed that signal R was associated only with the Lb02 frac-
tions. The e.p.r. spectrum of an Lb-free peroxidase fraction from
crude soybean Lb did not show signal R (section 6.2.1).
Because the species responsible for signal R appeared to be a form
of ferrous Lb and persisted in crude Lb which had been 'oxidized'

Fig. 7.3
x
z
189
12 -3 12.5 12.7 H (kG)
12.9 13.1
Q-band e. p. r. spectrum of signal R from a sample of crude soybean
Chippewa-CC705 Lb. Microwave frequency 35.810 CH, power 20 mW, tem-
perature 99 K. The fine structure of the signal is more clearly re-
solved than it is at X-band (cf. Fig. 7.1. b).

190
with K3Fe(CN)6 (section 5.2), it was thought that this species might
be nitrosyl leghaemoglobin (LbNO). For K3Fe(CN)6 to oxidize Hb02
and Mb02, it has been postulated that the 02 must first dissociate
(Antonini et al., 1965). This presumably also applies to Lb02.
Since Hb and Mb have a higher affinity for NO than for CO (Antonini
& Brunori, 1971) and Lb has a higher affinity for CO than 02 (Imamura
et al., 1972), it is presumed that Lb also has a higher affinity for
NO than for CO. Thus the very stable LbNO complex should be oxidized
only very slowly at 4°C by K3Fe(CN)6. Keilin & Hartree (1937) found
that HbNO was only slowly oxidized to acid-metHb by K3Fe(CN)6.
A published e.p.r. spectrum of the nitrosyl derivative of human Hb
(HbNO) at 77 K (Kon, 1968) was very similar to signal R. For
example, the g value of one of the features of the HbNO signal was
1.986, while that of the corresponding feature of signal R in a
spectrum of crude Chippewa-CC705 Lb was measured as 1.985.
A sample of Merit-CC705 Lbc purified on a DEAF-cellulose phosphate
column at pH 8.0 was converted to Lbc02 (section 2.13). This
oxyleghaemoglobin solution, which had no signal R in its e.p.r.
spectrum, was then converted into LbcNO (section 2.14). The e.p.r.
spectrum of this LbcNO preparation recorded at 90 K had no signal at
E = 6, but it did have a massive signal at g = 2. The expanded
spectrum of this signal was very similar in overall shape and g
values to signal R (cf. Figs. 7.4 and 7.1.b). It was thus concluded
that signal R originates from LbNO. However, the signal of Fig. 7.4
clearly shows the beginnings of three hyperfine lines. Kon (1968)
observed a pronounced three-line hyperfine splitting, due to the
nitrogen nucleus of 14N0, when HbNO was treated with sodium dodecyl
sulphate. Later, using n.m.r. and e.p.r. to investigate model com-
plexes, he suggested that this hyperfine splitting was due to the

Fig. 7.4
3.04 3.12 3.20 3.28 3.36
H (kG)
E.p.r. spectrum of the nitrosyl derivative of soybean Merit-CC705
ferrous Lbc prepared with NO gas. Temperature 90 K, power 200 mW,
field sweep 400 G, gain x 32. The close similarity to signal R (cf.
Fig. 7.1.b) and the beginnings of three hyperfine lines (due to the
nitrogen nucleus of the 1+ 110) can be seen.
191

192
breaking, or strong distortion, of the bond between the haem iron and
the imidazole N at the iron's 5th coordination position (Kon, 1975).
Addition of inositol hexaphosphate to HbNO changes the e.p.r.
spectrum of the complex. A prominent three-line 14N hyperfine
splitting appears, quite similar to that observed in the spectrum of
the sodium dodecyl sulphate-treated complex. Maxwell & Caughey
(1976), using infrared, e.p.r. and optical spectroscopy, provided
evidence that this change was due to the cleavage of the bond between
the proximal histidine and haem iron in two of the four subunits of
HbNO.
This suggests that the difference between the spectra in Figs. 7.4
and 7.1.b may arise from a difference in protein conformation; the
bonding between the proximal histidine and haem iron being slightly
weaker in the LbcNO preparation. A conformational change could bring
about a slight 'pulling away' of the proximal histidine from the
iron. This difference in conformation could be produced by the
relatively high ionic strength of the LbcNO sample (approx. 0.12 M
phosphate buffer, pH 7.0,) caused by a six-fold decrease in volume
during its preparation (section 2.14).
To test thisI the sample was passed down a column of Sephadex G-25
(fine), equilibrated with 20 mM phosphate buffer, pH 7.0. The e.p.r.
spectrum of the LbcNO band showed a signal at .g = 2 almost identical
to signal R, giving support to the suggestions above. Differences
between the e.p.r. spectra of some acid-metLb samples can also be
attributed to differences in protein conformation, caused by differ-
ences in ionic strength (section 6.2.1 & 2).
7.6 The nature of previously unidentified forms of ferrous leghaemo-
globin
E.p.r. spectroscopy at 86-100 K is a very sensitive method for

193
detecting LbNO in preparations of crude Lb, since none of the other
Lb complexes }mown to occur in crude Lb give a large signal at g - 2.
LbNO might have been present in the crude Lb preparations of other
investigators, but would have remained unrecognized because its opti-
cal spectntll is similar to that of LbO 2 (Sternberg &: Vi rtan en , 1952),
often present in crude Lb preparations.
APpleby (1969C) found that soybean Lb'!02 preparations occasionally
gave an unusual optical spectrum when deoxygenated with N~SZ04. This
unexpected form of ferrous Lb~ had a cOMplex spectruna: a Soret peak
at 418 nm with a shoulder at 430 nm, plus a peak at 560 nm with a
shoulder at 545 nm. When the same Lbl!P2 preparation was stored for 5 o days at 0 C and Na2S204 added, a conventional high-spin ferrous Lbl!:
spectrum was obtained (a single Soret peak at 427 nm plus a single
peak at 555 nm). The LbNO in a sample" of crude soybean Lb stored at
oOe disappeared after about 4 days (section 7.3). This prompted an
examination of the optical spectra of Na2SZo4-treated Lb samples
posessing a large LbNO e.p.r. signal (see Table 7.2). For crude soy
bean Chippewa-CC705 Lb, the :resulting ferrous Lb spect:rum (la of Table
7.2) had a peak at 418 nm, with a shoulder at 425 nm and a single peak
at 552 nm. A cowpea-SU318 'Lb02 ' fraction from a DEAE-cellulose phos
phate column at pH 8.0, treated with NaZS204 (4b of Table 7.2), gave a
similar spectrum, with a peak at 415 nil, a shoulder at 426 rna and a
peak at 554 nm showing a trace of a shoulder at about .561 nm.
These spectra thus resemble the unusual ferrous LbA spectrum of
Appleby (1969c) in the So:ret region. However, they differ from it in
the longer-wavelength peak, probably because the samples contain less
of the species responsible for the unusual spectrum. The absorption
bands at 418 and 415 rna and .561 nm are presUIlably from this species.
Ferrous Lb obtained from soybean ferric Lb£ and cowpea ferric Lb had
the conventional high-spin ferrous Lb spectrum with peaks at 424 nm

194
and 555 nm (samples 2b & 5a of Table 7.2).
Thus the unusual ferrous Lba spectrum of Appleby is similar to
spectra of samples containing LbNO. When more Na2S204 and a few
crystals of NaNO2 were added to the Na2S204-treated cowpea 'Lb02'
sample (sample 4b) — a method used to prepare the NO complexes of
ferrous haemoproteins (Yonetani et al., 1972), the peak at 415 nm
shifted to 413 nm, increasing in intensity and losing its shoulder at
426 nm (sample 4c and Fig. 7.5). The peak at 554 nm split into two
peaks at 542 nm and 568 nm. Thus, the peak at 415 nm is due to LbNO,
and the shoulder at 426 nm to high-spin ferrous Lb. The slight
shoulder near 561 nm is also presumably from LbNO.
The NO derivatives of crude soybean ferrous Lb and ferrous Lbc
prepared in the same way gave spectra with peaks at 414 nm, 545 nm
and 568 nm (samples lb & 2c and Fig. 7.6). These values agree well
with those found by Sternberg & Virtanen (1952). Thus the peak at
418 nm and the shoulder at 545 nm in the unusual ferrous Lba spectrum
of Appleby (1969c) are almost certainly from LbaNO.
Appleby (1974) has suggested that the findings of Melik-Sarkisyan
et al. (1970) may indicate the presence in vivo of an uncharacterized
ligand of ferrous Lb. These workers extracted Lb from yellow lupin
nodules at pH 7.0 (20 mM tris-HC1 buffer) in the presence of Capron
powder which, like Polyclar, adsorbs phenolic compounds. The optical
spectrum of the unfractionated supernatant from their nodule homogen-
ate had absorption bands at 418 nm, 539 nm and 566 nm. The fraction
of this supernatant precipitating between 55% and 80% (NH4)2SO4
saturation (cf. section 2.5) was desalted on a column of Biogel R-10,
equilibrated with 10 mM tris-HC1 buffer, pH 7.0, or 20 mM phosphate
buffer, pH 6.3. This crude Lb solution gave an optical spectrum with ,572 nm
absorption bands at 412 nm, 500 nm, 543 nm/and 630 nm. The bands at

4a. Cowpea-SU318
'Lb02' fraction°
4b. 4a + Na2S204
Lb02 + LbNO •
Ferrous Lb +
LbNO
571 539 409
415 + sh
@ 426 554d
195
Table 7.2 Optical absorption spectral data for ferrous Lb, Lb02 and
LbNO preparations
Sample Derivatives Band position (nm) present
°C A
la. Crude soybean
Chippewa-CC705 Lb Ferrous Lb 552
+ Na2S204 + LbNO
lb. la + NaNO2 LbNO 569 545 414
2a. Soybean Meritr-CC705 Lbc02 574 537 410 Lbc02a
2b. 2a + Na2S204 Ferrous Lbc 555 424
2c. 2b + NaNO2 LbcNO 568 545 414
3a. Soybean Merit-CC705
LbcNOb
3b. 3a + Na2S204
LbcNO + sh @ sh @
acid-metLbc 614 566
LbcN0 + N.D.
ferrous Lb
535 404
416 + sh @ 425
418 + sh
@ 425
4c. 4b + NaNO2 LbNO
5a. Cowpea-SU318 Ferrous Lb
ferric Lbe+ Na2S204
5b. 5a + NaNO2 LbNO
Lb samples were in phosphate buffer of pH 7.0. or 8.0 and diluted with
20 mM buffer, pH 7.0, when necessary. A blank means the band is absent;
sh indicates a shoulder or weak band; N.D. — not determined.
568
555
413
424
413

Footnotes to Table 7.2
a Prepared from ferric Lbc from a DEAF-cellulose phosphate column
at pH 8.0 by reduction on a Sephadex column (section 2.13).
b Prepared from NO and Lbc02 from the same stock solution as sample
2a (section 2.14).
o The bright-red fraction from a DEA -cellulose phosphate column at pH 8.0.
d A trace of a shoulder was present at about 561 nm.
196
e The ferric Lb fraction from the same column as sample 4a.

413
197
1.3
1.1
0-9
0.7
0.5
350 400
450 (nm)
FIG. 7.5 Soret region of the optical absorption spectra of puri-
fied cowpea-SU318 ferrous Lb and LbNO.
, Spectrum of the
'Lb02' fraction from a DEAF-cellulose phosphate column at pH 8.0
plus Na2S204 (sample 4b of Table 7.2).--- — , Spectrum of the same
sample after addition of more Na2S204 and a few crystals of .NaNO2
to produce the LbNO complex (sample 4c of Table 7.2).

FIG. 7.6 Optical absorption spectra of a preparation of crude soybean Chippewa-CC705 Lb
in the 'ferrous' and ferrous NO forms. , Spectrum of the preparation in 20 mM
phosphate buffer, pH 7.0, after addition of Na2S204 (sample la of Table 7.2). The posi-
tion of the al. peak (at 552 nm) and the slight shoulder on it near 561 nm indicate the
presence of some LbNO, as does the appearance of the Soret peak (not shown, but see Table
7.2).— — — , Spectrum of the same sample after addition of more Na2S204 and a few cry-
stale of Na NO2 to form the NO complex -- sample lb of Table 7.2. (The sample was
diluted to record the top part of the Soret peak.)

1.3
1.1
0.9
0.7
0.5
0.8
0.6
0.4
02
0 5 50
a(nm) 450 400 5 00 700 600 650
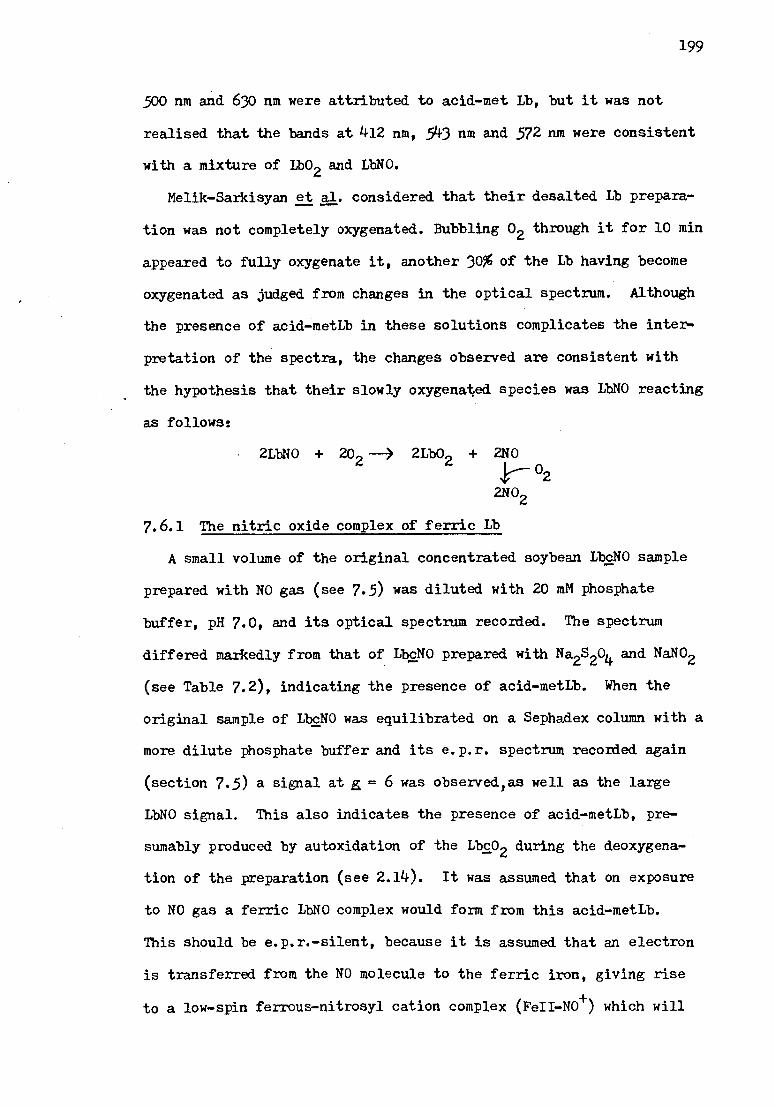
• 2LbNO + 202 2Lb02 + 2N0
~-- 02 2NO2
199
500 nm and 630 nm were attributed to acid-met Lb, but it was not
realised that the bands at 412 nm, 543 nm and S72 nm were consistent
with a mixture of Lb02 and LbNO.
Melik-Sarkisyan et al. considered that their desalted Lb prepara-
tion was not completely oxygenated. Bubbling 02 through it for 10 min
appeared to fully oxygenate it, another 30% of the Lb having become
oxygenated as judged from changes in the optical spectrum. Although
the presence of acid-metLb in these solutions complicates the inter-
pretation of the spectra, the changes observed are consistent with
the hypothesis that their slowly oxygenated species was LbNO reacting
as follows:
7.6.1 The nitric oxide complex of ferric Lb
A small volume of the original concentrated soybean LbcNO sample
prepared with NO gas (see 7.5) was diluted with 20 mM phosphate
buffer, pH 7.0, and its optical spectrum recorded. The spectrum
differed markedly from that of LbcNO prepared with Na2S204 and NaNO2
(see Table 7.2), indicating the presence of acid-metLb. When the
original sample of LbcNO was equilibrated on a Sephadex column with a
more dilute phosphate buffer and its e.p.r. spectrum recorded again
(section 7.5) a signal at = 6 was observed,as well as the large
LbNO signal. This also indicates the presence of acid-metLb, pre-
sumably produced by autoxidation of the Lbc02 during the deoxygena-
tion of the preparation (see 2.14). It was assumed that on exposure
to NO gas a ferric LbNO complex would form from this acid-metLb.
This should be e.p.r.-silent, because it is assumed that an electron
is transferred from the NO molecule to the ferric iron, giving rise
to a low-spin ferrous-nitrosyl cation complex (FeII-N0+) which will

200
be diamagnetic. This mechanism has been proposed for the NO com-
plexes of ferric horseradish peroxidase and cytochrome c peroxidase
(Yonetani & Yamamoto, 1973).
Thus ferric LbNO exposed to excess NO for 20 min at room tempera-
ture was not reduced to ferrous LbNO. Wittenberg et al.(1967) noted
that ferric MbNO was also stable for several hours in the presence
of NO at room temperature. However, after 20 min exposure, ferric
HbNO was reduced to HbNO (Kon, 1968; Keilin & Hartree, 1937).
The NO dissociates relatively easily from ferric HbNO (Keilin &
Hartree, 1937), in contrast to ferrous HbNO. The ferric LbNO complex
is likely to behave similarly, so that passing the original 'LbcNO'
preparation through a Sephadex column (7.5) would have separated the
NO from the ferric Lb, resulting in a mixture of acid-metLb and
ferrous LbNO.
7.6.2 E.p.r. spectra of nitrosyl leghaemoglobin samples prepared
with Na2S204 or ascorbic acid
LbNO was prepared by adding solid Na2S204 (2-3 mg ) to 0.5 ml of
Lb solution, followed by a few crystals of NaNO2 (Yonetani et al.,
1972). A colour change to cherry red indicated formation of the LbNO
complex. The solution was transferred to an e.p.r. tube and immedi-
ately frozen in liquid N2.
Samples were prepared from crude soybean Chippewa-CC705 Lb and
Merit-CC705 Lbc02 (derived from ferric Lbc -- section 2.13) and their
e.p.r. spectra recorded. The only absorption present was a large
signal at g = 2, recognizable as an LbNO signal. However, it was
more structured than the signal shown by the sample prepared with NO
gas (cf. Fig. 7.7 and Fig. 7.1.b and see 7.5), exhibiting a prominent
three-line hyperfine splitting due to 14N0. This difference is attri-
buted to the relatively high ionic strength of these samples, caused

201
Fig. 7.7
I I 3.0 3.1
I 3.2
H (kG)
I I 3.3 3.4
FIG. 7.7 E. p. r. spectrum of the nitrosyl derivative of crude soy-
bean Chippewa-CC705 ferrous Lb prepared with Na2S204 and NaNO2.
Temperature 90 K, power 20 mW, field sweep 1 kG, gain X 200.
This spectrum shows a prominent 3-line ne N hyperfine splitting.

202
by the addition of Na2S204 and NaNO2 (see 7.5).
Ascorbic acid is able to reduce crude soybean ferric Lb,and it
also rapidly reduces nitrite to nitric oxide in acid solution (Woolum
et al., 1968). As expected, solid ascorbic acid and NaNO2 added to a
solution of crude soybean Chippewa-CC705 Lb gave a sample showing the
large LbNO signal at E = 2 with the three prominent 14N hyperfine
lines. This signal closely resembled that of HbNO in 10 mM phosphate
buffer, pH 7.0, containing 20 mM Na salicylate (Kon, 1968). Its
overall shape, however, was slightly different from that of the spec-
trum of the Na2S204-treated sample. This may be the result of some
denaturation of the Lb in the ascorbate-treated sample, which is
presumed to have a lower pH than the Na2S204-treated sample.
7.7 Quantitative estimation of nitrosyl leghaemoglobin in a crude Lb
sample
The amount of LbNO was determined in a sample of crude soybean
Chippewa-CC705 Lb from nodules of 8-week-old plants grown in a con-
trolled-environment cabinet at 27°C (section 2.4).
The crude Lb precipitate was dissolved in ice-cold 20 mM phosphate
buffer, pH 7.0, and stored on ice. The Lb solution was desalted at
4°C on a column of Sephadex G-25, equilibrated with the same buffer,
and 0.3 ml of the eluted Lb band introduced into an e.p.r. tube and
frozen and stored in liquid N2. This preparation took 4 h, during
which time there will be a small decrease in the amount of LbNO
(section 7.3.1). The Lb concentration of another aliquot of the Lb
solution was estimated by the Pyr method. The e.p.r. spectra of the
Lb sample and 0.3 ml of a suitably diluted Cut+-EDTA standard solution
were then recorded under as nearly as possible identical conditions.
A microwave power level of 20 mW was employed to avoid saturation
(see 7.4).

203
Using a double integration method, the area under each e.p.r.
absorption was calculated. Then from the equation:
No. of unpaired spins in Lb sample Area under LbNO absorption
No. of unpaired spins in Cut+ EDTA standard
Area under Cut+-EDTA absorption
the number of unpaired spins, i.e. the number of NO molecules, in the
Lb sample was calculated. The Lb concentration of the sample was
adjusted to the equivalent CMHb-method value (section 3.2). Assuming
an average molecular weight of 16,000 for the soybean Lbs, the total
number of Lb molecules in the sample was calculated.
The percentage of Lb molecules ligated with NO was then calculated
to be 27'3. Thus, a considerable proportion of the total Lb was
present as the LbNO complex. A similar proportion of the crude lupin
Lb isolated by Melik-Sarkisyan et al. (1970) was in a slowly-oxygena-
ted form which is probably LbNO, as I have suggested earlier (section
7.6).
7.8 Possible origins of nitrosyl leghaemoglobin
LbNO was present in crude soybean Lb isolated from plants grown in
the glasshouse, controlled-environment cabinets and the field, indica-
ting that it is not unusual growth conditions which give rise to LbNO.
An important question is whether LbNO is present within the N2 fixing
root nodule, or merely an artifact of the extraction procedure. To
attempt to answer this, the effect of nitrate on the nodules must be
considered.
The soybeans grown in the field were exposed to a low concentration
of nitrate. Those grown in controlled-environment cabinets were not
supplied with nitrate, but the glasshouse plants were supplied with
tap water containing about 31 p.p.m. nitrate. However, traces of
nitrate will be continuously available to the cabinet and glasshouse-
grown plants from the microbial oxidation of nitrogenous compounds

204
derived from their roots (Evans & Russell, 1971).
Nitrate can enter the nodules via their vascular strands. It will
be reduced to nitrite by the bacteroids (Cheniae & Evans, 1960), which
do not, however, appear to be able to reduce nitrite (Daniel & Appleby,
1972). Hence a steady but low supply of nitrite may have been present
under the culture conditions I used.
Nitrite is a powerful inhibitor of acetylene reduction by isolated
soybean bacteroids (Rigaud et al., 1973). Furthermore, it could dif-
fuse out of the bacteroids and oxidize Lb02 to ferric Lb. Rigaud &
Puppo (1977) demonstrated the in vitro oxidation of Lb02 by nitrite,
and showed that Lb increased the acetylene reducing activity of
bacteroids incubated with nitrite, delaying the onset of complete
nitrite inhibition. They suggested that high concentrations of nitrite
could be responsible for the inhibition of N2 fixation observed when
nitrate is added to nodulated plants. Rigaud & Puppo also speculated
that in nodules containing low levels of nitrite, Lb could protect the
bacteroids' nitrogenase from inhibition. They did not discuss what
nitrite would be converted to on reacting with Lb02.
Although Daniel & Appleby (1972) were unable to detect nitrate or
nitrite in nodules or bacteroids from soybeans grown in a sand-vermicu-
lite mixture in a glasshouse and given a nitrogen-free culture solution,
this does not rule out nitrite production in nodules grown under
different culture conditions. Moreover, homogenizing the nodules to
assay for nitrite may have caused it to be consumed by reacting with
other compounds in the nodules.
Nitrite in the root nodule is the most likely origin of the LbNO in
crude Lb preparations. However, C.S. Yocum (unpublished work), quoted
by Tjepkema (1971) has suggested that Lb may combine with the CO and
NO which can occur in the soil, thus protecting the bacteroids' nitro-

205
genase from inhibition. It is not known whether any NO was generated
under the culture conditions I used, but it is a possibility.
In rats, an intravenous injection of NaNO2 solution produces HbNO
in the blood, as shown by the e.p.r. spectrum of a lyophilized blood
sample (Azhipa et al., 1966). When whole erythrocytes are incubated
for 2 min in isotonic NaNO2 solution and their e.p.r. spectrum then
recorded, it shows a relatively large signal at E = 2 (Peisach et al.,
1971 ), almost certainly from HbNO. By analogy, LbNO may form rela-
tively easily in N2-fixing legume root nodules which contain nitrite.
This presumably occurs under the influence of endogenous reducing
agents. For example, ascorbic acid, present in soybean root nodules
at a concentration of 160-260 ug/g fresh weight (2-3 times that found
in the roots — Virtanen & Jorma, 1945), can generate LbNO from ferric
Lb and nitrite (section 7.6.3). In fact, as early as 1947, Virtanen
et al. (1947 a) suggested that LbNO might be formed in root nodules
exposed to nitrate, and that this would interfere with the function of
Lb.
Interestingly, although bacteroids from nodules produced by strain
00705 on soybean have a much greater nitrate reductase activity than
those from OB1809 nodules (Rigaud et al., 1973), no pronounced differ-
ence in the magnitude of the LbNO signal per mg Lb was found for crude
Lb preparations from nodules produced by the two strains; see Table
7.1. However, if nitrate concentrations are low, substrate concentra-
tions rather than enzyme activities may determine the amount of NO2
produced in the nodule.
However, it is also possible that no LbNO is present in vivo, but
that it is generated on disrupting the nodules to extract the Lb. This
would occur by the mixing of components normally separated from each
other in the intact nodule. If LbNO is such an artifact, the mechani-

206
sm by which it is generated is worthy of further investigation.
If LbNO does occur in vivo, its presumably greater affinity for NO
than for 02 (section 7.5) will mean that it interferes with oxygen
transport by making less ferrous Lb available for facilitating 02
diffusion to the bacteroids.

207
Section 8
The effect of plant growth temperature and Rhizobium strain on nitrogen
fixation and Lb content of nodulated soybeans
8.1 Introduction
This investigation was performed in connection with a programme of
experiments on environmental effects on the Rhizobium symbiosis with
tropical grain legumes. The results from these experiments have been
reported (Dart et al., 1976). From some of the experiments, it was
known that the symbiotic performance of Rhizobium strain CC705 with
,soybeans (cv. Chippewa) grown at 33°C (day temperature) was poor com-
pared with that of plants grown at 27°C and plants nodulated with
strain CB1809 and grown at 27°C and 33°C. It was considered that this
difference might have been due to a lower Lb concentration in the CC705
nodules at 33°C, or:possibly to a difference in the nature of their Lb.
The symbiotic performances of strains CB1809 and CC705 with Chippewa
soybeans grown at 27°C and 33°C in Saxcil controlled-environment cabi-
nets (see 2.4), were therefore compared. The Lb content of the nodules
was also determined, and optical absorption spectra of isolated crude
Lb preparations recorded.
The nature of the optical spectrum of the NO derivative of a crude
ferrous soybean Lb preparation (see Fig. 7.6 and Table 7.2) helped to
explain the difference observed between the spectra of crude Lb prep-
arations from nodules produced by strains CB1809 and CC705 on plants
grown at 33°C. There appeared to be more LbNO in the crude CC705 Lb
than in the CB1809 Lb.
8.2 Methods
The nodulated roots of the plants were assayed for nitrogenase acti-
vityl and nodule fresh weight per plant and nodule Lb content then
determined (see 2.18 and 2.17) at 24, 38 and 52 days after sowing. Dry

208
weights and N contents of the plant tops and roots were then determined
(see 2.19), as was the N content of seeds similar to those planted.
Using estimated values for the N content of the nodules, the amount of
N fixed per plant was calculated as: total plant N (top + roots +
nodules) minus seed N.
Plants grown at 33°C were harvested at 27 and 53 days from sowing
and crude Lb isolated from their nodules (see 2.5). The extraction
medium contained sodium ascorbate and MgC12. Some of the crude Lb pre-
cipitate was then dissolved in 20 mM phosphate buffer, pH 7.0, and half
. the solution desalted at 4°C on a column of Sephadex G-25 (fine or med-
ium grade) equilibrated with the same buffer (designated 'untreated'
sample). The other half was converted to the Lb02 form on a similar
column (see 2.13). This was done because ferrous Lb and Lb02 are con-
sidered to be the physiologically active forms of Lb (Appleby, 1969b).
These samples were stored on ice and their optical spectra recorded as
soon as possible. It took about 8 h to isolate the Lb and record the
spectra. The remainder of the crude Lb precipitate was stored in
liquid N2. This procedure was repeated with plants grown at 27°C at
28 and 56 days from sowing.
8.3 Symbiotic performance (nitrogen fixation and Lb content) of
Chippewa soybean nodules formed by 1h izobium strains CB1809 and CC705
at 27°C and 33°C
The amount of N fixed for the four strain-temperature combinations
is shown in Fig. 8.1 and the amount of N fixed per gram fresh wt. of
nodules in Fig. 8.2. Most N was fixed by strain CB1809 at 27°C, fol-
lowed by CB1809 at 33°C and then CC705 at 27°C. As expected, strain
CC705 at 33°C formed the least efficient symbiosis, fixing only small
amounts of N.
Fig. 8.3 shows that the nitrogenase activity of both strains at 27°C

FIG. 8.1 Amount of nitrogen fixed per plant with respect to time. Soybeans
(cv. Chippewa) nodulated with Rhizobium strain CB1809 or CC705 were grown at
27°C or 33°C (day temperature) in Saxcil controlled-environment cabinets.

240
200
160
rn E
120 c 0
D 80 a) x 9- Z
0
40
Fig. 8.1 • CB1809,27°
15 20
30 40
50
Days from sowing
CBI809,33°
CC705,27°
CC705,33°

FIG. 8.2 Amount of nitrogen fixed per grain nodule fresh weight with respect
to time for the four strain-temperature combinations.

Fig. 8.2
CBI809,33°
CC705,27°
CC705,33°
20
150 —
CT)
.._: 10 0
L N a)
.4--a)
O 50
-o
C rn a) x
z 0 15 30 40
50
Days from sowing

211
reached a peak at around 38 days from sowing and then declined. In
contrast, at 33°C both strains showed a decline in nitrogenase activity
during the period of the assays (24-52 days from sowing). The slight
increase in the CC705 activity from 38-52 days may be due to contamina-
tion and nodulation of the plants with strain CB1809. Acetylene reduc-
tion data from another experiment suggests this (Dart et al., 1976).
Strain CC705 at 33°C had the lowest activity.
The amount of Lb per plant was lower for strain CC705 at 33°C than
for the other 3 combinations, which all had fairly similar values
. throughout the period from 24-52 days from sowing (Fig. 8.4). This was
because CC705 at 33°C had the lowest weight of nodules per. plant. The
Lb content of its nodules was, however, very similar to that for strain
CB1809 at 27°C and 33°C (see Fig. 8.5). At 27°C, the Lb content of the
nodules produced by strain CC705 increased from 24-52 days from sowing.
That for strain CB1809 was slightly lower at 24 days and increased at
a lower rate up to 38 days and then remained constant. The values for
strain CB1809 at 33°C closely paralleled those at 27°C,, but were
slightly lower. The value for strain CC705 at 33°C was higher than
that for CB1809 over the period 25-48 days from sowing. It decreased
from 38-52 days from sowing, but again this may be the result of nodu-
lation by strain CB1809.
These results clearly show that the nitrogenase activity of root
nodules can decrease while their Lb content remains constant or in-
creases slightly. Thus, the presence of appreciable amounts of Lb does
not necessarily mean that substantial nitrogen fixation will occur.
The poor symbiotic performance of strain CC705 at 33°C appears to
be due partly to a lower weight of nodules per plant and a lower nitro-
genase activity per gram nodule fresh wt. A comparison of the nitro-
genase activities and amounts of N fixed per gram nodule fresh wt. for

FIG. 8.3 Nitrogenase activity with respect to time for the four strain-
temperature combinations (Symbols for points as for Fig. 8.1)

W
01
O
C2H4
Pr
oduc
ed/g
nod
ule
fres
h w
t./h
(.m
o()
N N
W W
N
O
U
l O
01
O
(17
1 1
1 1
1 1
212

FIG. 8.4 Amount of Lb per plant with respect to time for the four strain-
temperature combinations. (Symbols as for Fig. 8.1)

18
15
3
0
Fig. 8.4
10 20 30
40
50
Days from sowing

FIG. 8.5 Amount of Lb per gram nodule fresh weight with respect to time for
the four strain—temperature combinations. (Symbols as for Fig. 8.1)

Fig. 8.5 0
0 0 a
11
10 0) E
_._. 9 3 s U) a 8 a) D ō 7 c rn
J 6
5 20
I
30 40 50
Days from sowing

215
strains CC705 and CB1809 at 33°C suggests that there is also some
inhibition of the N assimilation process in CC705 nodules after the
reduction of N2 to ammonia. This may be an inhibition of either the
synthesis of amino acids or the supply of carbon skeletons needed for
their synthesis. The maximum potential N2-fixing activity of the nitro-
genase in these nodules will therefore not be attained (Dart et al.,
1976). In relation to this inhibition, the differences between the
optical spectra of crude Lb isolated from CB1809 and CC705 nodules
grown at 33°C are noteworthy (see next section).
,8.4 Optical absorption spectra of crude Lb preparations
The wavelengths of the peaks in the optical spectra of the untreated
Lb and 'Lb02' samples prepared from the crude Lb isolated at the four
harvests are given in Table 8.1. Fig. 8.6 shows the spectra of the
'Lb02' samples from the two later harvests (53 and 56 days from sowing).
The spectrum of the CC705-33°C sample differs noticeably from the other
three spectra,which are all similar and also resemble the four 'Lb02'
spectra from the first two harvests (at 27 and 28 days from sowing).
The same pattern was observed in the spectra of the untreated Lb sam-
ples, the CC705-33°C spectrum differing from the others (see Fig. 8.7).
This can be explained as follows.
The crude Lb samples will contain some LbNO (sections 4.4 & 7.5 —
hence the quotation marks around Lb02). Thus, the 'Lb02' sample
immediately after its preparation will be a mixture of Lb02 and LbNO.
From the spectrum of purified Lbc02 published by Appleby (1969b) and
the spectrum of LbNO prepared from crude soybean Lb (see 7.6 and Fig.
7.6), such a mixture should have a spectrum with the oC and s peaks
having nearly equal absorbances. However, in all the 'Lb02' spectra
recorded, the 04. peak had a lower absorbance than the f3 peak. This
was because autoxidation of some of the Lb02 present had occurred

Table 8.1 Absorption maxima of the optical spectra of crude Lb preparations from Chippewa soybeans grown at
27 and 33°C
Age of Growth temp. plants and type of (days from Lb prepara- sowing) tion
Thizobium strain
CB1809 CC705
Band position (nm)
cL ō oc R
28
27
56
53
. 27°C
Untreated
Lb02'
33°C
Untreated
'Lb02'
27°C
Untreated
'Lb02'
33°C Untreated
'Lb02'
'
570 539 N.D. 570.5 539 N.D.
572 540 412.5 572 540 412.5
569.5 538 N.D. 568.5 539 N.D.
572 540 412.5 571.5 540 412.5
570 540 408.5 570 539 407.5
S72 541 412.5 572 541 412.5
570 539 407.5 567 539 407.5
571 540 412.5 571 541 412.5
N.D. Not determined

FIG. 8.6 Optical absorption spectra of crude soybean (cv. Chippewa)
Lb preparations isolated from plants from the four strain-tempera-
ture combinations and reduced with Na2S204 on a Sephadex column —
designated 'Lb02' samples.

CC705,27°
CC705,33°
L J
CB1809,27°
CB1809,33°
I I I I 1 I I 1 1 450 550 650 450 550 650
X (nm) X (nm)

FIG. 8.7 Optical absorption spectra of crude soybean (cv. Chippewa)
Lb preparations isolated from plants from the four strain-tempera-
ture combinations and desalted on a Sephadex column — designated
'untreated' Lb samples.

450 650 450 550 (nm)
t t I 550 650
`. (nm)
CB1809,27°
CB"809,33°
CC705,2 7°
CC705,33°
t_ J

219
before the spectra were recorded. Reference to the spectrum of acid-
met Lbc (Appleby, 1969b) shows that on conversion of part of an Lb02
sample to acid-metLb, the absorbance of the oC peak will decrease more
than that of the ,3 peak. Thus, the difference in absorbance between
the 01. and f peaks is a measure of the amount of autoxidation which
has occurred.
In the spectrum of LbNO the absorbance of the at. and /3 peaks is
not very much greater than that of the trough between them. However,
in the Lb02 spectrum, the absorbance of the oC and /3 peaks is consider-
. ably greater than that of the trough between them. Therefore, consider-. ing .the spectrum of a mixture of Lb02 and LbNO, the smaller the differ
ence between the absorbance of the peaks and that of the trough, the
more LbNO will be present.
Measurements of this difference were made for the spectra of the
'Lb02' and untreated Lb preparations shown in Figs. 8.6 and 8.7 (see
Table 8.2). They show that for the 'Lb02' samples from plants grown
at 33°C, both samples have undergone about the same amount of autoxida-
tion,and that the CC705 sample contains much more LbNO than the CB1809
sample. For plants grown at 27°C, both samples have again undergone
autoxidation to a similar extent and the CB1809 sample contains
slightly more LbNO than the CC705 sample. These measurements are of
course relative and also approximate, because the samples do not have
exactly the same Lb concentration. However, they do show that the
crude Lb isolated from the CC705 nodules grown at 33°C contains an
unusually large amount of LbNO. The data from the spectra of the un-
treated Lb samples also lead to this conclusion (Table 8.2). Moreover,
during the isolation of the crude Lb from nodules grown at 33°C, it
was noticed that, at the stage of 80% saturation with (NH4)2SO4, the
suspension of insoluble Lb was brown-red in the CB1809 extract and

Table 8.2 Comparison of the absorbances of the 01- and g peaks and the trough between them
for the spectra of 'Lb02' and untreated Lb samples
Height of peak above trough (absorbance units) Growth temp. and age of plants CB1809 CC705 at harvest (days from sowing) o4 p ck 13
'Lb02' samples.
33°C, 53 days
P — d-- 27°C, 56 days
p — ot.
Untreated samples
33°C, 53 days
— aC 27°C, 56 days
13 - oC
.130 .170 .060 .105
. 040 .045
.100 .125 .13.5 .155
.025 .020
.045 .140 .005 .100
.095 .095
.040 .100 .055 .115
.060 .060

221
bright-red in the CC705 extract. This again is consistent with the
presence of large amounts of the stable LbNO complex in the extract of
the CC705 nodules.
In agreement with the findings from e.p.r. spectroscopy, the details
of the optical spectra (Table 8.1) indicate the presence of LbNO in all
the 'Lb02' samples. For example, the wavelength of the Soret (Ō) peak
is greater than 412 nm in all the spectra. The wavelength of this peak
in the spectra of Lb02 and acid-metLb is 411 nm and 404 nm respectively
(Appleby, 1969b). However, the spectra of the NO derivatives of crude
ferrous soybean Lb and purified ferrous Lbc have a Soret peak with a
wavelength of 414 nm (see Table 7.2). Subsequent e.p.r. spectra of
CC705 Lb samples, isolated from plants grown at 27°C and harvested at 28
and 56 days from sowing, showed the large signal from LbNO at g a 2.
The sample from the later harvest contained 27±3% LbNO (see 7.7).
These e.p.r. spectra had no signal at E = 6, presumably because the
samples were frozen in liquid N2 immediately after being desalted on a
Sephadex column. This indicates that autoxidation of the Lb02, in all
the samples whose optical spectra were recorded, occurs relatively
rapidly during the storage of these samples on ice. This 'autoxida-
tion' is probably catalyzed by Cu2+; the reaction occuring only after
the dissociation of the 02 from Lb02 (Rifkind, 1974 — see also 5.5)•
This would then mean that very little of the ferrous Lb present as LbNO
would be oxidized to ferric Lb by Cu2+ (see 7.5).
8.5 Conclusion
Of the four ihizobium strain-temperature combinations studied,
strain CC7O5 at 33°C forms the least efficient symbiosis and produces
nodules which yield the crude Lb containing the most LbNO.
If LbNO actually occurs in vivo, the relatively low nitrogenase
activity of the CC705 nodules at 33°C can be explained by a decrease in

222
the transport of 02 to the nodule bacteroids (see 7.8).
However, LbNO may not occur in vivo (see 7.8), but the conditions
in the nodule which lead to its formation during nodule homogenization
may also be responsible for the low level of nitrogen fixation.
Identification of these conditions will give a fuller understanding
of the biochemical requirements for efficient nitrogen fixation in the
nodule. This may then lead to an improvement in the efficiency of cer-
tain symbioses by providing a basis for the selection of more suitable
plant varieties and Ithizobium strains.

223
Section 9
A preliminary investigation of leghaemoglobin from chickpea (Cicer
arietinuur) nodules
Chickpeas grew well in the field at Woburn, Bedfordshire. Seeds
inoculated with Fbizobium strain CB1189 produced large, vigorous
plants bearing numerous nodules, some of them very large. Unlike the
round nodules of soybean and cowpea, chickpea nodules are extensively
lobed and grow from a terminal meristem. Large, mature nodules have
a Lb-containing zone just behind the meristem, with the zone closer
to the root a green colour, presumably containing breakdown products
of Lb. Thus, various 'ages' of tissue are present in the nodule.
The Lb-containing region is a pale pink-red colour, suggesting that
it may have a lower concentration of Lb than the Lb-containing region
of a soybean nodule. Because of the tissue heterogeneity of the
nodule, the amount of Lb/g fresh weight of whole nodules is not a
very meaningful quantity. Chickpea belongs to a unique cross-inocula-
tion group and there is only one report of cross infection by chickpea
rhizobia of a species other than Cicer.
The nitrogenase activity (measured aspmole C2Hg dry wt./h) of
nodules of chickpeas less than 6 weeks old is very similar to that of
soybean nodules (Islam, 1975). It is therefore of interest to know
whether chickpea Lb differs from the soybean and cowpea Lbs.
9.1 Partial purification on DEAD-cellulose phosphate columns
Kabuli-type chickpea nodules were crushed by the usual method into
20 mM phosphate buffer, pH 7.2, containing Polyclar. Crude Lb was
precipitated between 55 and 80% (NH4)2SO4 saturation (section 2.5).
This fraction contained most of the nodules' Lb, since the precipitate
at 55% (NH4)2SO4 saturation, when dissolved in 20 mM phosphate buffer,
pH 7.2, gave an optical absorption spectrum with only a small peak

224
near 410 nm (possibly from a green breakdown product of Lb), indicat-
ing the absence of Lb. The supernatant from the 80% (NH4)2s04 satura-
tion step was pale yellow, again indicating the absence of Lb.
The crude Lb precipitate was pale-pink — less intensely coloured
than the precipitate of crude soybean and cowpea Lb. The quantity of
precipitate was much smaller than that obtained from the same weight
of soybean or cowpea nodules because of the restricted occurrence of
Lb in chickpea nodules. It dissolved easily in 20 Of phosphate buffer,
pH 7.0. On centrifuging this solution at 20000 g, a small fawn pellet
was obtained. However, desalting on a Sephadex G-25 column was slow,
as was concentration by ultrafiltration. During this process the
solution gelled. On suspending the gel in phosphate buffer, white
flakes could be seen floating in the solution indicating the presence
of polysaccharide in the crude Lb. This explains the slow gel filtra-
tion and ultrafiltration. The preparation was frozen, stored in
liquid N2 for three days and then thawed and dialysed overnight
against 5 mM phosphate buffer, pH 6.8. Centrifugation at 25000 g for
15 min gave a whitish pellet, presumably polysaccharide, containing a
pinkish-fawn area, presumably denatured Lb.
The polysaccharide was removed from the Lb supernatant by a. method
similar to that used by Broughton & Dilworth (1971) with snake bean
Lb preparations. The supernatant (about 50 ml) was loaded onto a col-
umn (2.2 x 10 cm) of DEAF-cellulose equilibrated with 5 mM phosphate
buffer, pH 6.8. The column was then eluted with 50 mM phosphate buf-
fer, pH 6.8. The Lb was rapidly eluted as a concentrated band. The
polysaccharide, being either neutral or less acidic than Lb, is eluted
from the column before the Lb. On the column the Lb band appeared to
have a red-brown front and a bright-red tail, indicative of the pres-
ence of ferric Lb and Lb02. A faint light-brown band remained on top

225
of the bed. The concentrated Lb solution was then equilibrated with
2 mM phosphate buffer, pH 8.0, on a Sephadex G-25 column, left ove r-
night on ice and centrifuged at 25000 g for 15 min. Only a small
pellet formed.
The Lb solution was then loaded onto a column (2.2 x 8.0 cm) of
DEAE-cellulose equilibrated with 2 mM phosphate buffer, pH 8.0.
Approximately 16.5 mg Lb (CMHb method) was loaded v and the column elu-
ted with starting buffer at a flow-rate of about 75 ml/h. After 200
ml of starting buffer had passed through the column, a red-brown band
about 5 an wide was visible about 1 cm from the top of the bed where
a brown band about 2-3 mm wide remained. The leading Lb band moved
only a few mm when 150 ml of 5 mM buffer, pH 8.0, was pumped through
the column. This band was eluted fairly rapidly with 10 mM buffer,
pH 8.0; the main part of it being compact (about 10 ma wide). How-
ever, it had a diffuse front, which began to come off the column when
the main part was only halfway down the bed. The main part of the
band was collected (volume about 80 ml) and concentrated.
During the elution of the leading Lb band the width of the brown
band on top of the bed increased. After the main part of the leading
band had been eluted, the brown band was about 15 mm wide, its leading
edge being slightly pink. This pink region (probably a minor Lb) was
eluted with 50 mM buffer, pH 8.0. The brown band remained on top of
the bed, looking more diffuse and lighter in colour. Further elution
at room temperature with 100 mM buffer, pH 8.0, containing 1.0 M NaC1
caused only a small proportion of this band to be eluted. The remain-
ing material is probably denatured Lb and haemin.
9.2 Investigation of the main part of the major Lb band
Optical absorption spectra
During the concentration of the main part of the major Lb band,

226
its optical spectrum was recorded. The spectrum (Fig. 9.1) was simi-
lar to that of soybean Lb02, having peaks at 539 and 570 nm. (The 01.
peak was lower than the p peak because of the presence of a small
amount of acid-metLb -- see 8.4). Bubbling CO through the solution
changed its spectrum to one which had peaks at 537 and 559 nm, with
the d peak slightly higher than the p peak (Fig. 9.1). This spectrum
is characteristic of soybean LbCO (Imamura et al., 1972), so the main
part of the major Lb band eluted from the pH 8.0 column is Lb02.
A small amount of LbNO could have been present in the Lb02 fraction.
However, no e. p. r. spectra of chickpea Lb preparations were recorded.
These would have shown definitely whether or not LbNO was present.
From the appearance of the Lb band on the pH 6.8 column, it was
expected that a ferric Lb band would be visible on the pH 8.0 column.
The diffuse front of the major Lb band may have been ferric Lb. Only
a small amount of Lb was loaded on to the column, relative to the soy-
bean and cowpea Lb separations, so any ferric Lb fraction would have
been small and difficult to see. However, if chickpea ferric Lb
denatures easily, this would explain the absence of a discrete ferric
Lb fraction on the column.
Since the spectra of chickpea Lb02 and LbCO are similar to those
of the corresponding soybean Lb derivatives — contrary to a report by
Thakkar & Vyas (1972) — chickpea Lb probably has the same haem group
and haem-environment as the soybean Lbs.
PAGE
PAGE of the major Lb02 fraction produced only one red Lb band
before staining. A faint purple band was also visible above the Lb
band. Gels stained with amido black (e.g. gel 3 of Fig. 9.2) showed
two major bands, the faster one corresponding to the Lb band, the
slower one possibly corresponding to the purple band and representing

0.8
0-6
0.4
0.2
227
450
500
550
600
a(nm)
FIG. 9.1 Optical absorption spectra of the 02 and CO complexes of
chickpea ferrous Lb. , Spectrum of the main part of the major
Lb band eluted from the DEAF-cellulose column at pH 8.0 (Lb02)._ _ _,
Spectrum of the same sample after bubbling CO through it (LbCO).

Fig. 9.2
•
228
1 2 3 4
Acrylamide gels of crude chickpea-CB1189 Lb applied to a DEAE-
cellulose phosphate column at pH 8.0,and the major Lb02 fraction
eluted from the column. Gels 1, 2 & 3 stained with amido black;
gel 4 stained for peroxidases. 1 & 2, crude Lb; 3 & 4, major
Lb02 frn. Gels 1 & 2, though faint, show that the contaminants
are present in large amounts, relative to the Lb (the fastest
band).

229
a major contaminant of this Lb preparation. Three other fainter con-
taminant bands were also present. One corresponded to the major con-
taminant band of the gel stained for peroxidase activity (gel 4 of
Fig. 9.2). This gel also contained two other faint bands, as well as
the distinct Lb band.
9.3 Conclusion
Chickpea nodules, like those of cowpea, appear to contain only one
major Lb. (The minor Lb visible on the pH 8.0 DEAF-cellulose column
(section 9.1) is probably analogous to that present in crude cowpea
Lb (section 5.4.2). All the ferrous (and presumed ferric) form of
this Lb was eluted from the pH 8.0 column by 10 mM phosphate buffer.
This is also the case for the major soybean and cowpea Lbs. However,
the presence of a substantial contaminant in the major Lb02 fraction
shows that a purification method suitable for crude soybean and cow-
pea Lb is not applicable to crude chickpea Lb. Removal of this con-
taminant from the Lb02 fraction would be necessary before further
investigations, such as amino acid analysis of the protein, could be
performed.
If chickpea ferric Lb denatures easily, the K3Fe(CN)6 oxidation
procedure (see 2.7.3) would have to be modified for purified chickpea
Lb02, so that a sample frozen in liquid N2 (ready for e. p. r. spectro-
scopy) could be rapidly obtained. If e.p.r. spectra of derivatives
of the ferric protein could be obtained, they would show whether or
not chickpea and soybean Lb are similar, as indicated by optical
spectroscopy.

230
Section 10
GENERAL DISCUSSION
The two-column purification procedure gave ferric Lb samples con-
taining only very small amounts of peroxidases. A large proportion of
the peroxidases and probably all the non-haem iron in crude Lb prepara-
tions were removed by the column at pH 8.0 (sections 5.4.1 and 5.4.2).
This purification at pH 8.0 gave soybean ferric Lbs (Lba and Lbc)
which were less contaminated with peroxidases than those obtained from
the single column at pH 7.0; the purification procedure initially used
(section 5.3). The second column, at pH 5.8, further decreased the
level of peroxidase contamination in the soybean and cowpea ferric Lbs.
Contaminating peroxidases appear to have been responsible for the
relatively large absorption at g = 2 in the e.p.r. spectra of soybean
acid-metLba and cowpea acid-metLb purified at pH 7.0, compared to the
corresponding absorption in the spectrum of acid-metHb. These peroxi-
dases will also contribute towards the absorption at g = 6 in the above
acid-metLb e. p. r. spectra and it was originally thought that they were
responsible for the relatively large width of this absorption in the
acid-metLb spectra of all the samples purified at pH 7.0. However, the
e. p. r. spectrum of a fraction containing a large proportion of the
peroxidases present in crude soybean Lb showed that this was not the
case (section 6.2.1).
The green protein contaminants in soybean Lba and Lbc and cowpea
ferric Lb purified by the two-column procedure are probably products of
Lb catabolism (section 5.6.3). They are purified with the ferric Lbs
(see 5.4.1); an observation consistent with the suggestion that they
have the same amino acid sequence as the Lb which they contaminate, but
a slightly different conformation (section 5.6.3). It will thus be
difficult to separate these green proteins from the ferric Lbs by

231
DEAF-cellulose chromatography. A lower pH than those used in this in-
vestigation would probably be required (see 5.3).
The green proteins did not appear to affect the e.p.r. spectra of
the acid-metLbs, since the spectra of soybean Merit-CC705 acid-metLba
and acid-metLbc were very similar (section 6.1.1), even though the Lba
sample contained much more green protein (section 5.4.1). Although
the green proteins may contain iron, they may be e.p.r.-silent. Or,
if they do give e.p.r. signals, these may be unobservable under the
conditions used to record the acid-metLb spectra. It would be interes-
ting to attempt to produce these proteins chemically from Lbs (see 1.3),
and then carefully search for possible absorptions in their e.p.r.
spectra.
The e.p.r. spectra of the acid-met derivatives of the two soybean
Lbs and cowpea Lb, purified by the two-column procedure, closely resem-
bled the spectrum of acid-metHb and differed from that of acid-metMb
only in having low-spin absorptions. However, they differed markedly
from the e.p.r. spectrum of acid-metLba, published by Appleby et al.
(1976) — section 6.1.2.
The very close similarity between the e.p.r. spectra and also bet-
ween the E values of the three ferric Lb fluoride derivatives and the
spectra and g values of the fluoride derivatives of ferric Mb and Hb
(section 6.3) indicates that the immediate environment of the iron
atom in Lb, Mb and Hb is similar. In these proteins a nitrogen atom
of the imidazole ring of a histidine residue (the proximal histidine)
occupies the 5th coordination position of the iron. E.p.r. spectra
and g values of the hydroxide, azide and cyanide derivatives of the
ferric Lbs also support this conclusion. These e.p.r. spectra and the
above conclusion are similar to the spectra and conclusion of Appleby
et al. (1976) for the derivatives of Lba. However, the LbaN3 spectrum

232
published by these authors showed an absorption at g = 2.05 (attribu-
ted by them to an impurity) which is not present in the LbN3 spectra
obtained in this study (section 6.5.1).
For soybean Lba the proximal histidine residue is almost certainly
histidine-92 of the protein's sequence, as suggested by Ellfolk (1972).
Ellfolk assumed that the only other histidine residue in the sequence
(at position 61) is the distal histidine of the haem iron. He noted
similarities between the sequence of Lba and those of the vertebrate
globins, speculating that the overall conformation of Lba would resem-
. ble that of the vertebrate globins. Further comparisons of the sequ-
ence of Lba with those of the Ō -chain of human Hb and other haemoglo-
bins and myoglobins have revealed a considerable degree of similarity
between these haemoproteins (Appleby, 1974). Moreover, the X-ray-
diffraction studies of Vainshtein et al. (1975) on lupin Lb indicate
that. it has a tertiary structure closely resembling that of myoglobin
and haemoglobin. All these similarities between Lb, Mb and Hb give
strong support to the conclusion that Lb's function is the transport
of 02 to the nodule bacteroids (see on).
The e.p.r. spectra of ferric Lb imidazole derivatives indicate that
a low-spin species present in the e.p.r. spectra of all the acid-metLb
samples is a dihistidyl haemichrome in which the distal histidine (for
Lba, histidine-61) occupies the 6th coordination position of the iron.
This is in agreement with the original suggestion of Ellfolk & Sievers
(1967). Like the soybean Lbs, cowpea Lb has only two histidine resi-
dues per molecule (Table 4.6), strongly suggesting that this haemi-
chrome has a similar structure in all three ferric Lbs. The e.p.r.
spectra of the derivitatives of cowpea Lb are very similar to those of
the corresponding derivatives of the soybean Lbs (section 6). This is
consistent with the observations that cowpea Lb is related to the soy-

233
bean Lbs on the basis of amino acid composition and almost certainly
has a similar overall tertiary structure to that of Lba (section 4.3).
Many of the differences between the acid-metLb e.p.r. spectra of
Lbs purified at pH 7.0 (section 4.4) and those purified by the two-col-
umn procedure are probably due to conformational differences. These
are thought to be caused by an unexpectedly high ionic strength in the
pH 7.0-purified samples, rather than to the presence of contaminants
(sections 6.2.1 and 6.2.2). Differences between the acid-metLba e.p.r.
spectrum published by Appleby et al. (1976) and the acid-metLb spectra
of samples purified by the two-column procedure are also thought to be
due to conformational differences. These may be caused by the acetate
buffer (at pH 5.2) used by Appleby et al. to purify their Lba (section
6.2.3).
The acid-metLb e.p.r. spectra discussed above illustrate the impor-
tance of considering factors which affect protein conformation when
isolating and purifying Lb and preparing derivatives for examination
by e.p.r. spectroscopy. This is particularly relevant in the case of
Lb, since it is a less stable molecule than Mb (section 6.2.3).
Recent investigations give a great deal of support to the proposal
that Lb's function is the transport of oxygen (section 1.6). Lb is
monomeric in solution (Behlke et al., 1971), and the values of the
kinetic constants for the 02 combination and dissociation reactions of
the ferrous protein indicate that it is well suited to facilitating 02
diffusion in an environment of very low mean 02 concentration (Witten-
berg et al., 1972). Addition of Lb02 to slowly shaken suspensions of
bacteroids (with 02 in the gas phase) increases the activity of their
nitrogenase (Bergersen et al., 1973). This appears to be due to Lb
facilitating the diffusion of 02 and thereby causing a rise in the con-
centration of free, dissolved 02 at the surface of the bacteroids

234
(Wittenberg et al., 1974). Lb may also have a role in stabilizing the
concentration of the 02 delivered to the bacteroids (Appleby, 1974).
The development of the two-column purification procedure showed
that signal R was associated only with the 'Lb02' fractions. This
helped in identifying LbNO as the species responsible (section 7.5).
The LbNO complex was present in all the crude soybean and cowpea Lb
samples examined by e.p.r. spectroscopy in the present work. Knowing
its identity is therefore useful, especially since other workers, from
the evidence of optical absorption spectra, have noted its presence
. without realizing its identity. For example, Appleby (1969c) detected
an unstable form of ferrous Lba, and Melik-Sarkisyan et al. (1970) ob-served in crude lupin Lb preparations a form of ferrous Lb which was
oxygenated only slowly (section 7.6). These latter investigations
illustrate how the presence of an unidentified complex in Lb prepara-
tions can lead to erroneous ideas about the nature and function of Lb
(c f. section 1.5).
The LbNO is most probably generated by nitrite, derived from nit-
rate. However, it may originate from NO in the rooting media. If
present in vivo, LbNO would decrease the amount of ferrous Lb avail-
able for transporting 02 to the bacteroids. However, the LbNO may
well be an artifact of the nodule extraction procedure. Whichever is
the case, the possible role of nitrite in generating this LbNO is wor-
thy of further investigation (section 7.8).
A knowledge of the origin of the LbNO may also have applications in
agriculture, since the experiments described in section 8 show that
the least efficient of the 4 Ph izobium strain-soybean growth-tempera-
ture combinations studied yielded the crude Lb containing the most LbNO
(section 8.5).
Although the two-column purification procedure developed for crude

235
soybean and cowpea Lb is not directly applicable to crude chickpea Lb
(section 9.3), it may be easy to remove the main contaminant from the
major chickpea Lb fraction. This fraction was in the Lb02 form, and
its optical absorption spectrum and that of its CO derivative are simi-
lar to those of the corresponding derivatives of soybean ferrous Lb
(section 9.2). In view of this similarity, and the differences between
chickpea and soybean nodules, it would be interesting to investigate
further a purer preparation of this fraction. Useful information could
be obtained from e.p.r. spectra, but caution would be necessary in pre-
paring and handling the ferric Lb because it may be unstable (section
9.3).

236 References
Abel, K. & Bauer, N. (1962) Isolation and autoxidation characteristics
of ferrolegoglobin. Arch. Biochem. Biophys. 99, 8-15
Aggarwal, S. J. & Riggs, A. (1970) Leghemoglobinssequence of amino
acids around the two histidyl residues — a correction. Acta Chem.
Scand. 24, 2234-2236
Alben, J. 0. & Caughey, W. S. (1968) An infrared study of bound carbon
monoxide in the human red blood cell, isolated hemoglobin, and heure
carbonyls. Biochemistry 7, 175--183
Andres, S. F. & Atassi, M. Z. (1970) Conformational studies on modified
proteins and peptides. Artificial myoglobins prepared with modified
and metalloporphyrins. Biochemistry 9, 2268-2275
Antonini, E. & Brunori, M. (1971) Haemoglobin and Myoglobin in their
Reactions with Ligands, p. 272, North-Holland, Amsterdam
Antonini, E., Brunori, M. & Wyman, J. (1965) Studies on the oxidation-
reduction potentials of heme proteins. IV. The kinetics of oxidation
of hemoglobin and myoglobin by ferricyanide. Biochemistry 4, 545-551
Appleby, C. A. (1962) The oxygen equilibrium of leghemoglobin. Biochim.
Biophys. Acta 60, 226-235
Appleby, C. A. (1969a) Electron transport systems of Rhizobium japoni-
cum II. Rhizobium haemoglobin, cytochromes and oxidases in free-
living (cultured) cells. Biochim. Biophys. Acta 172, 88-105
Appleby, C. A. (1969b) Properties of leghaemoglobin in vivo, and its
isolation as ferrous oxyleghaemoglobin. Biochim. Biophys. Acta 188,
222-229
Appleby, C. A. (1969c) The separation and properties of low-spin (haem-
ochrome) and native, high-spin forms of leghaemoglobin from soybean
nodule extracts. Biochim. Biophys. Acta 189, 267-279
Appleby, C. A. (1974) Leghemoglobin. InsThe Biology of Nitrogen Fixa-
tion (Quispel, A., ed.), pp. 521-554, North-Holland, Amsterdam

237
Appleby, C. A., Blumberg, W. E., Peisach, J., Wittenberg, B. A. &
Wittenberg, J. B. (1976) Leghemoglobin. An electron paramagnetic
resonance and optical spectral study of the free protein and its
complexes with nicotinate and acetate. J. Biol. Chem. 251, 6090-6096
Appleby, C. A., Nicola, N. A., Hurrell, J. G. R. & Leach, S. J. (1975)
Characterization and improved separation of soybean leghemoglobins.
Biochemistry 14, 4444-4450
Appleby, C. A., Wittenberg, B. A. & Wittenberg, J. B. (1973) Nicotinic
acid as a ligand affecting leghemoglobin structure and oxygen reac-
tivity. Proc. Nat. Acad. Sci. U. S. 70, 564-568
van Assendelft, 0. W. & Zijlstra, W. G. (1975) Extinction coefficients
for use in equations for the spectrophotometric analysis of haemo-
globin mixtures. Anal. Biochem. 69, 43-48
Azhipa, Ya. I., Kayushin, L. P. & Nikishkin, Ye. I. (1966) Electron
paramagnetic resonance of tissues of animals on exposure to certain
forms of tissue hypoxia. Biofizika (Eng. trans.) 11, 817-821
Banerjee, R., Alpert, Y., Letterrier, F. & Williams, R. J. P. (1969)
Visible absorption and electron spin resonance spectra of the isola-
ted chains of human hemoglobin. Discussion of chain-mediated heme-
heme interaction. Biochemistry 8, 2862-2867
Beauchamp,C. & Fridovich, I. (1971) Superoxide dismutase:improved as-
says and an assay applicable to acrylamide gels. Anal. Biochem. 41+,
276-287
Behlke, J., Sievers, G. & Ellfolk, N. (1971) Crystalline leghemoglobin
XIII. Sedimentation studies. Acta Chem. Scand. 25, 746-747
Bemski, G. & Nagel, R. L. (1968) Electron spin resonance of four human
hemoglobins. Biochim. Biophys. Acta 154, 592-595
Bennett, J. E., Gibson, J. F. & Ingram, D. J. E. (1957) Electron reso-
nance studies of haemoglobin derivatives I. Haem-plane orientation.

238
Proc. R. Soc. London Ser. A 240, 67-82
Bergersen, F. J. (1960) Biochemical pathways in legume root nodule
nitrogen fixation. Bacteriol. Rev. 24, 246-250
Bergersen, F. J. (1961) Haemoglobin content of legume root nodules.
Biochim. Biophys. Acta 50, 576-578
Bergersen, F. J. (1969) Nitrogen fixation in legume root nodules:bio-
chemical studies with soybean. Proc. R. Soc. London Ser. B 172, 401-
416
Bergersen, F. J. & Turner, G. L. (1967) Nitrogen fixation by the bac-
teroid fraction of breis of soybean root nodules. Biochim. Biophys.
Acta 141, 507-515
Blumberg, W. E. & Peisach, J. (1971a) A unified theory for low spin
forms of all ferric heure proteins as studied by EPR. In:Probes of
Structure and Function of Macromolecules and Membranes (Chance, B.,
Yonetani, T. & Mildvan, A. S., eds.), vol. 2, pp. 215-229, Academic
Press, London and New York
Blumberg, W. E. & Peisach, J. (1971b) Low spin compounds of heme pro-
teins. In:Bioinorganic Chemistry (Gould, R. F., ed.)., American Chem-
ical Society Advances in Chemistry Series 100, pp. 271-291, American
Chemical Society, Washington, D. C.
Blumberg, W. E., Peisach, J., Wittenberg, B. A. & Wittenberg, J. B.
(1968) An electron paramagnetic resonance and optical study of horse-
radish peroxidase and its derivatives. J. Biol. Chem. 243, 1854-1862
Broughton, W. J. & Dilworth, M. J. (1971) Control of leghaemoglobin syn-
thesis in snake beans. Biochem. J. 125, 1075-1080
Broughton, W. J. & Dilworth, M. J. (1973) Amino acid composition and
relationships of Lupin and Serradella leghaemoglobins. Biochim. Bio-
phys. Acta 317, 266-276
Brown, S. B. & King, R. F. G. J. (1976) The structure of haem in pyri-
dine/water mixtures and its implication in studies of haem catabol-

239
ism. Biochem. J. 153, 479-483
Cameron, B. F. (1965) Determination of iron in heure compounds II. Hemo-
globin and myoglobin. Anal. Biochem. 11, 164-169
Cann, J. R. (1971) Interaction of acetic acid with poly-L-glutamic acid
and serum albumin. Biochemistry 10, 3707-3712
Cartwright, B. & Hallsworth, E. G. (1970) Effects of copper deficiency
on root nodules of subterranean clover. Plant and Soil 33, 685-698
Cheniae, G. & Evans, H. J. (1960) Physiological studies on nodule-nit-
rate reductase. Plant Physiol. 35, 4544 4462
Cloonan, M. J. (1963) Black nodules on Dolichos. Aust. J. Sci. 26, 121
Cutting, J. A. & Schulman, H. M. (1968) Leghemoglobin — concerning the
sites of biosynthesis of its components. Federation Proc. 27, 768
Cutting, J. A. & Schulman, H. M. (1969) The site of heme synthesis in
soybean root nodules. Biochim. Biophys. Acta 192, 486-493
Cutting, J. A. & Schulman, H. M. (1971) The biogenesis of leghemoglobin.
The determinant in the Rhizobium-legume symbiosis for leghemoglobin
specificity. Biochim. Biophys. Acta 229, 58-62
Daniel, R. M. & Appleby, C. A. (1972) Anaerobic-nitrate, symbiotic and
aerobic growth of Rhizobium jnicum:effects on cytochrome P-450,
other haemoproteins, nitrate and nitrite reductases. Biochim. Bio-
phys. Acta 275, 347-354
Dart, P. J. (1968) Localisation of peroxidase activity in legume root
nodules. Proc. Fourth Ear. Reg. Conf. Electron Microscopy. Rome, pp.
69-70
Dart, P. J., Day, J. M. & Harris, D. (1972) Assay of nitrogenase activi-
ty by acetylene reduction. InsUse of Isotopes for Study of Fertili-
zer Utilization by Legume Crops, pp. 85-100, International Atomic
Energy Agency/Food and Agricultural Organisation, Vienna.
Dart, P. J., Day, J. M., Islam, R. & DSberein er, J. (1976) Symbiosis in

240
tropical grain legumes:some effects of temperature and the composi-
tion of the rooting medium. In:Symbiotic Nitrogen Fixation in Plants
(Nutman, P. S., ed.), pp. 361-384, Cambridge University Press
Dart, P. J. & Pate, J. S. (1959) Modulation studies in legumes III. The
effects of delaying inoculation on the seedling symbiosis of barrel
medic, Medicago tribuloides Desr..Aust. J. Biol. Sci. 12, 427-444
Davenport, H. E. (1960) Haemoglobin in the root nodules of Casuarina
cunninghamiana. Nature (London) 186, 653-654
Davis, B. J. (1964) Disc electrophoresis — II. Method and application
to human serum proteins. Ann. N. Y. Acad. Sci. 121, 404-427
Dawson, R. M. C., Elliott, D. C., Elliott, W. H. & Jones, K. M. (1969)
Data for Biochemical Research, 2nd edn., p. 487, Oxford University
Press
Dilworth, M. J. (1969) The plant as the genetic determinant of leg-
haemoglobin production in the legume root nodule. Biochim. Biophys.
Acta 184, 432-441
Dilworth, M. J. & Kidby, D. K. (1968) Localization of iron and leg-
haemoglobin in the legume root nodule by electron microscope auto-
radiography. Exptl. Cell Res. 49, 148-159
Dixon, H. B. F. & McIntosh, R. (1967) Reduction of methaemoglobin in
haemoglobin samples using gel filtration for continuous removal of
reaction products. Nature (London) 213, 399-400
Ehrenberg, A. (1962) Electron spin resonance absorption by some hemo-
proteins. Arkiv Kemi 19, 119-128
Ehrenberg, A. & F1lfolk, N. (1963) Crystalline leghemoglobin VII. Mag-
netic and spectrophotometric properties of leghemoglobin and its
derivatives. Acta Chem. Scand. 17, S343-S347
Ellfolk, N. (1960a) Crystalline leghemoglobin I. Purification procedure.
Acta Chem. Scand. 14, 609-616

241
Ellfolk, N. (1960b) Crystalline leghemoglobin II. The molecular weights
and shapes of the two main components. Acta Chem. Scand. 14, 1819-
1827
Ellfolk, N. (1961a) Crystalline leghemoglobin III. Amino acid composi-
tion of the two main components. Acta Chem. Scand. 15, 545-554
Ellfolk, N. (1961b) Crystalline leghemoglobin IV. Spectroscopic studies
of the two main metleghemoglobin components and some of their fatty
acid complexes. Acta Chem. Scand. 15, 975-984
Ellfolk, N. (1962) Crystalline leghemoglobin VI. The comparison of the
two main components by tryptic peptide pattern analysis. Acta Chem.
Scand. 16, 831-836
Ellfolk, N. (1972) Leghaemoglobin, a plant haemoglobin. Endeavour 31,
139-142
Ellfolk, N. & Sievers, G. (1965) Crystalline leghemoglobin VIII. The
heroin of the two main components. Acta Chem. Scand. 19, 268-269
Ellfolk, N. & Sievers, G. (1965) Crystalline leghemoglobin IX. Artifi-
cial leghemoglobins. Acta Chem. Scand. 19, 2409-2419
Ellfolk, N. & Sievers, G. (1967) Crystalline leghemoglobin X. The fer-
rihemochrome of leghemoglobin. Acta Chem. Scand. 21, 1457-1461
Ellfolk, N. & Sievers, G. (1969) Crystalline leghemoglobin XI. The
amino acid sequences of two histidine-containing tryptic peptides of
the slow component. Acta Chem. Scand. 23, 2994-3002
Ellfolk, N., Sievers, G. & Harmoinen, A. (1974) Crystalline leghemoglo-
bin XV. Effect of urea on the conformation of the slow component
(Lba). Acta Chem. Scand. Ser. B28, 1195-1199
Ellfolk, N. & Virtanen, A. I. (1950) Electrophoresis of leghemoglobin.
Acta Chem. Scand. 4, 1014-1019
Ellfolk, N. & Virtanen (1952) The molecular weight of leghemoglobin.
Acta Chem. Scand. 6, 411-420

242
Evans, H. J. & Russell, S. A. (1971) Physiological chemistry of symbio-
tic nitrogen fixation by legumes. InsThe Chemistry and Biochemistry
of Nitrogen Fixation (Postgate, J. R., ed.), pp. 191-244, Plenum
Press, London and New York
Falk, J. E. (1964) Porphyrins and Metalloporphyrins, pp. 45, 181 and
240, Elsevier Publishing Co., Amsterdam
Fridovich, I. (1975) Superoxide dismutases. Ann. Rev. Biochem. 44, 147-
159
Geyer, D. & Lemberg, R. (1971) The use of ferricyanide for the prepara-
tion of methaemoglobin. Biochem. Biophys. Acta 229, 284-285
Gibson, J. F. & Ingram, D. J. E. (1957) Electron resonance studies of
haemoglobin azide and hydroxide derivatives. Nature (London) 180,
29-30
Gibson, J. F., Ingram, D. J. E. & Schonland, D. (1958) Magnetic reso-
nance of different ferric complexes. Disc. Faraday Soc. 26, 72-80
Gomori, G. (1955) Preparation of buffers for use in enzyme studies. In
Methods in Enzymology (Colowick, S. P. & Kaplan, N. 0., eds.), vol.
1, pp. 143 and 145, Academic Press, New York
Graham, P. H. & Parker, C. A. (1961) Lethaemoglobin and symbiotic nit-
rogen fixation. Aust. J. Sci. 23, 231-232
Griffith, J. S. (1957) Theory of electron resonance in ferrihaemoglobin
azide. Nature (London) 180, 30-31
Gurd, F. R. N., Falk, K. E., Malmstrdm, B. G. & Vanngārd, T. (1967) A
magnetic resonance study of sperm whale ferrimyoglobin and its com-
plex with 1 cupric ion. J. Biol. Chem. 242, 5721-5730
Hanstein, W. G., Lett, J. B., McKenna, C. E. & Traylor, T. G. (1967)
Heme protein-diimide complexesspossible intermediates in biological
nitrogen fixation. Proc. Nat. Acad. Sci. U. S. 58, 1314-1316
Hardy, R. W. F. & Knight, Jr., E. (1967) ATP-dependent reduction of

243
azide and HCN by N2-fixing enzymes of Azotobacter vinelandli and
Clostridium pasteurianum. Biochim. Biophys. Acta 139, 69-90
Hedrick, J. L., Shaltiel, S. & Fischer, E. H. (1969) Conformational
changes and the mechanism of resolution of glyogen phosphorylase b.
Biochemistry 8, 2422-2429
Hedrick, J. L. & Smith, A. J. (1968) Size and charge isomer separation
and estimation of molecular weights of proteins by disc gel electro-
phoresis. Arch. Biochem. Biophys. 126, 155-164
Helckē, G. A., Ingram, D. J. E. & Slade, E. F. (1968) Electron reso-
nance studies of haemoglobin derivatives III. Line-width and L.-value
measurements of acid-met myoglobin and of met myoglobin azide deri-
vatives. Proc. R. Soc. London Ser. B 169, 272-288
Henderson, R. W. & Appleby, C. A. (1972) The redox potential of leg-
haemoglobin. Biochim. Biophys. Acta 283, 187-191
Henry, Y. & Banerjee, R. (1973) Electron paramagnetic studies of nitric
oxide haemoglobin derivatives:isolated subunits and nitric oxide hy-
brids. J. Mol. Biol. 73, 469-482
Hoffman, B. M. & Petering, D. H. (1970) Coboglobins:oxygen-carrying co-
balt-reconstituted hemoglobin and myoglobin. Proc. Nat. Acad. Sci.
U. S. 67, 637-643
Hori, H. (1971) Analysis of the principal $-tensors in single crystals
of ferrimyoglobin complexes. Biochim. Biophys. Acta 251, 227-235
Burrell, J. G. R., Nicola, N. A., Broughton, W. J., Dilworth, M. J.,
Minasian, E. & Leach, S. J. (1976) Comparative structural and immuno-
chemical properties of leghaemoglobins. Eur. J. Biochem. 66, 389-
399
Ibanez, V. S. & Herskovits, T. T. (1976) Effects of the aliphatic car-
boxylate series of salts on the conformation of proteins. Biochemi-
stry 15, 5708-5714

244
Iizuka, T. & Kotani, M. (1969) Analysis of thermal equilibrium between
high-spin and low-spin states in ferrimyoglobin complexes. Biochim.
Biophys. Acta 181, 275-286
Imamura, T., Riggs, A. & Gibson, Q. H. (1972) Equilibria and kinetics
of ligand binding by leghemoglobin from soybean root nodules. J.
Biol. Chem. 247, 521-526
Ingram, D. J. E. & Bennett, J. E. (1955) Paramagnetic resonance in
phthalocyanine, haemoglobin,and other organic derivatives. Disc.
Faraday Soc. 19, 140-146
.Islam, R. (1975) Some effects of the environment on the Rhizobium sym-
biosis of some tropical grain legumes. Ph. D. Thesis, University of
London
Jackson, E. K. & Evans, H. J. (1966) Propionate in heme biosynthesis in
soybean nodules. Plant Physiol. 41, 1673-1680
Jordan, D. C. & Garrard, E. H. (1951) Studies on the legume root nodule
bacteria. I. Detection of effective and ineffective strains. Can. J.
Bot. 29, 360-372
Keilin, D. & Hartree, E. F. (1937) Reaction of nitric oxide with haemo-
globin and methaemoglobin. Nature (London) 139, 548
Keilin, D. & Hartree, E. F. (1951) Purification of horse-radish peroxi-
dase and comparison of its properties with those of catalase and
methaemoglobin. Biochem. J. 49, 88-104
Keilin, D. & Smith, J. D. (1947) Haemoglobin and nitrogen fixation in
the root nodules of leguminous plants. Nature (London) 159, 692-694
Keilin, D. & Wang, Y. L. (1945) Haemoglobin in the root nodules of leg-
uminous plants. Nature (London) 155, 227-229
Koch, B., Evans, H. J. & Russell, S. (1967) Properties of the nitrogen-
ase system in cell-free extracts of bacteroids from soybean root
nodules. Proc. Nat. Acad. Sci. U. S. 58, 1343-1350

245
Kon, H. (1968) Paramagnetic resonance study of nitric oxide hemoglobin.
J. Biol. Chem. 243, 4350-4357
Kon, H. (1975) An interpretation of the three line EPR spectrum of nit-
ric oxide hemeproteins and related model systems:the effect of the
heme environment. Biochim. Biophys. Acta 379, 103-113
Kubo, H. (1939) Uber das H .moprotein aus den Wurzelkn011chen von Legu-
minosen. Acta Phytochim. (Japan), 11, 195-200
Kunkel, H. G. & Tiselius, A. (1951) Electrophoresis of proteins on fil-
ter paper. J. Gen. Physiol. 35, 89-118
- Lemberg, R., Legge, J. W. & Lockwood, W. H. (1938) A haemoglobin from
bile pigment. Nature (London) 142, 148-149
Lind, C. J. & Wilson, P. W. (1941) Mechanism of biological nitrogen
fixation VIII. Carbon monoxide as an inhibitor of nitrogen fixation
by red clover. J. Amer. Chem. Soc. 63, 3511-3514
Loomis, W. D. & Battaile, J. (1966) Plant phenolic compounds and the
isolation of plant enzymes. Phytochem. 5, 423-438
Maehly, A. C. (1954) The assay of catalases and peroxidases. Part I.
General assay methods. In:Methods of Biochemical Analysis (Glick,
D., ed.), vol. 1, p. 383, Interscience, New York ..
Magnusson, E. (1971) Steric aspects of ligand binding by haemoproteins.
In:Haemoglobin and Myoglobin in their Reactions with Ligands
(Antonini, E. & Brunori, M., eds.), pp. 85-95, North-Holland,
Amsterdam
Maxwell, J. C. & Caughey, W. S. (1976)An infrared study of NO bonding
to heure B and hemoglobin A. Evidence for inositol hexaphosphate in-
duced cleavage of proximal histidine to iron bonds. Biochemistry 15,
388-396
McArthur, J. M. & Miltimore, J. E. (1964) Extraction of alfalfa leaf
cytoplasmic protein with a modified Pirie disintegrator. Can. J.

246
Plant Sci. 44, 112-113
McCoy, S. & Caughey, W. S. (1970) Infrared studies of azido, cyano and
other derivatives of metmyoglobin, methemoglobin and hemins. Bio-
chemistry 9, 2387-2393
Melik-Sarkisyan, S. S., Yarovenko, V. V. & Kretovich, V. L. (1970) The
nature of legoglobin in lupin nodules. Biokhimiya 35, 1230-1237
Momenteau, M., Mispelter, J. & Lexa, D. (1973) The physical chemistry
of hemes II. Electron paramagnetic resonance study of the interac-
tion of some iron (III)-porphyrins with fluoride ion in dimethylfor-
mamide. Biochim. Biophys. Acta 320, 652-662
Moustafa, E. & Flux, D. (1966) Fractionation of leghaemoglobin and per-
oxidases from root nodules by gel filtration. New Zealand J. Sci. 9,
523-527
Nakano, N., Nakano, K. & Tasaki, A. (1971) A magnetic study of acidic
ferric hemoglobin. Biochim. Biophys. Acta 251, 303-313
Nicola, N. A., Minasian, E., Appleby, C. A. & Leach, S. J. (1975) Cir-
cular dichroism studies of myoglobin and leghemoglobin. Biochemistry
14, 5141-5149
Owen, J. A., Silberman, H. J. & Got, C. (1958) Detection of haemoglo-
bin, haemoglobin-haptoglobin complexes and other substances with
peroxidase activity after zone electrophoresis. Nature (London) 182,
1373
Paul, K. G., Theorell, H. & Ākeson, A. (1953) The molar light absorp-
tion of pyridine ferroprotoporphyrin (pyridine haemochromogen).
Acta Chem. Scand. 7, 1284-1287
Peisach, J. (1975) An interim report on electronic control of oxygena-
tion of heure proteins. Ann. N. Y. Acad. Sci. 244, 187-202
Peisach, J. & Blumberg, W. E. (1971) Departures from axial symmetry as
measured by EPR for high spin ferric heme proteins. In:Probes of

247
Structure and Function of Macromolecules and Membranes (Chance, B.,
Yonetani, T. & Mildvan, A. S., eds.), vol. 2, pp. 231-239, Academic
Press, London and New York
Peisach, J., Blumberg, W. E. & Adler, A. (1973) Electron paramagnetic
resonance studies of iron porphin and chlorin systems. Ann. N. Y.
Acad. Sci. 206, 310-327
Peisach, J., Blumberg, W. E., Ogawa, S., Rachmilewitz, E. A. & Oltzik,
R. (1971) The effects of protein conformation on the heme symmetry
in high spin ferric heme proteins as studied by electron paramagne-
tic resonance. J. Biol. Chem. 246, 3342-3355
Peisach, J., Blumberg, W. E. & Rachmilewitz, E. A. (1975) The demons-
tration of ferrihemochrome intermediates in Heinz body formation
following the reduction of oxyhemoglobin A by acetylphenylhydrazine.
Biochim. Biophys. Acta 393, 404-418
Peterson, E. A. (1970) Cellulosic ion exchangers. In:Laboratory Tech-
niques in Biochemistry and Molecular Biology (Work, T. S. & Work,
E., eds.), vol. 2, pp. 225-400, North-Holland, Amsterdam
Pirie, N. W. (1961) The disintegration of soft tissues in the absence
of air. J. Agric. flzg. Res. 6, 142-144
Rein, H., Ristau, 0. & Ruckpaul, K. (1975) Evidence for the existence
of a low-spin complex in acidic methemoglobin:its structure and for-
mation. Biochim. Biophys. Acta 393, 373-378
Richmond, J. E. & Salomon, K. (1955) Studies on the biosynthesis of
heroin in soybean nodules. Biochim. Biophys. Acta 17, 48-55
Rifkind, J. M. (1973) Hemoglobin and myoglobin. In:Inorganic Biochemis-
try (Eichhorn,G. L. ed.), vol. 2, pp. 832-901, Elsevier, Amsterdam
Rifkind, J. M. (1974) Copper and the autoxidation of hemoglobin. Bio-
chemistry 13, 2475-2481
Rigaud, J., Bergersen, F. J., Turner, G. L. & Daniel, R. M. (1973) Nit-

248
rate dependent anaerobic acetylene-reduction and nitrogen-fixation
by soybean bacteroids. J. Gen. Microbiol. 77, 137-144
Rigaud, J. & Puppo, A. (1977) Effect of nitrite upon leghemoglobin and
interaction with nitrogen fixation. Biochim. Biophys. Acta 497, 702-
706
Schiffmann, J. & Libel, R. (1970) Haemoglobin determination and its
value as an early indication of peanut Rhizobium efficiency. Plant
and Soil 33, 501-512
Scholander, P. F. (1960) Oxygen transport through hemoglobin solutions.
Science 131, 585-590
Seamonds, B., Blumberg, W. E. & Peisach, J. (1972) Electron paramagne-
tic resonance studies of monomeric ferric Glycera hemoglobin. Bio-
chim. Biophys. Acta 263, 507-514
Seevers, P. M., Daly, J. M. & Catedral, F. F. (1971) The role of perox-
idase isozymes in resistance to wheat stem rust disease. Plant Phy-
siol. 48, 353-360
Shannon, L. M., Kay, E. & Lew, J. Y. (1966) Peroxidase isozymes from
horseradish roots 1. Isolation and physical properties. J. Biol.
Chem. 241, 2166-2172
Sievers, G. & ELlfolk, N. (1970) Crystalline leghemoglobin XII. A spec-
trophotometric study of the slow component in the acid pH range.
Acta Chem. Scand. 24, 439-444
Smith, D. W. & Williams, R. J. P. (1970) The spectra of ferric haems
and haemoproteins. In:Structure and Bonding, vol. 7, pp. 1-45,
Springer-Verlag, Berlin and New York
Smith, J. D. (1949a) The concentration and distribution of haemoglobin
in the root nodules of leguminous plants. Biochem. J. 44, 585-591
Smith, J. D. (1949b) Haemoglobin and the oxygen uptake of leguminous
root nodules. Biochem. J. 44, 591-598

249
Sternberg, H. & Virtanen, A. I. (1952) Studies on the absorption spec-
trum of leghemoglobin, especially of leghemiglobin. Acta Chem.
Scand. 6, 1342-1352
Swaraj, K. & Garg, 0. P. (1970) The effect of ascorbic acid, when ap-
plied to the rooting medium,on nodulation and nitrogen fixation in
gram (Cicer arietinum). Physiol.Plant. 23, 889-897
Tamura, M., Asakura, T. & Yonetani, T. (1973) Heme modification studies
of myoglobin I. Purification and some optical and EPR characteris-
tics of synthesized myoglobins containing unnatural hemes. Biochim.
Biophys. Acta 295, 467-479
Tamura, M. & Hori, H. (1972) Optical and magnetic measurements of horse-
radish peroxidase. III Electron paramagnetic resonance studies at
liquid -hydrogen and -helium temperatures. Biochim. Biophys. Acta
284, 20-29
Thakkar, R. K. & Vyas, S. R. (1972) Absorption spectra and iron cont-
ents of leghaemoglobins from root nodules of some legumes. Indian J.
Agric. Sci. 42, 673-675
Thorogood, E. (1957) Oxygenated ferroheme proteins from soybean nodules.
Science 126, 1011-1012
Thorogood, E. (1963) A spectrophotometric study of the ionizations in
two ferrihaemoproteins from soya-bean nodules. Biochem. J. 87, 114-
123
Thorogood, E. & Hanania, G. I. H. (1963) Thermodynamic quantities for
the dissociation of three ferrihaemoproteins from soya-bean nodules.
Biochem. J. 87, 123-128
Tjepkema, J. D. (1971) Oxygen transport in the soybean nodule and the
function of leghemoglobin. Ph. D. Thesis, University of Michigan
Tjepkema, J. D. & Yocum, C. S. (1970) Leghemoglobin facilitated oxygen
diffusion in soybean nodule slices. Plant Physiol. 46, (Suppl.), 44

250
Uchida, H. & Klapper, M. H. (1970) Evidence for an irreversible reac-
tion between nitrite and human methemoglobin. Biochim. Biophys. Acta
221, 64o-643
Vainshtein, B. K., Harutyunyan, E. H., Kuranova, I. P., Borisov, V. V.,
Sosfenov, N. I., Pavlovsky, A. G., Grebenko, A. I. & Konareva, N. V.
(1975) Structure of leghaemoglobin from lupin root nodules at 5 A
resolution. Nature (London) 254, 163-164
Varley, J. A. (1966) Automatic methods for the determination of nitro-
gen, phosphorus and potassium in plant material. The Analyst 91,
119-126
Virtanen, A. I. (1945) Symbiotic nitrogen fixation. Nature (London)
155, 747-748
Virtanen, A. I. & Jorma, J. (1945) Changes in the ascorbic acid content
of green plants in the dark. Acta Chem. Fennica (B) 18, 50-52
Virtanen, A. I., Jorma, J., Linkola, H. & Linnasalmi, A. (1947a) On the
relation between nitrogen fixation and leghaemoglobin content of
leguminous root nodules. I. Acta Chem. Scand. 1, 90-111
Virtanen, A. I., Erkama, J. & Linkola, H. (1947b) On the relation bet-
ween nitrogen fixation and leghaemoglobin content of leguminous root
nodules. II. Acta Chem. Scand. 1, 861-870
Virtanen, A. I. &.Laine, T. (1946) Red, brown and green pigments in
leguminous root nodules. Nature (London) 157, 25-26
Virtanen, A. I. & Miettinen, J. K. (1949) Formation of biliverdin from
legcholeglobin, the green pigment in leguminous root nodules. Acta
Chem. Scand. 3, 17-21
Wang, J. H. (1961) Carbon monoxide-pyridine complexes with haems. In:
Haematin Ehzymes (Falk, J. E., Lemberg, R. & Morton, R. K., eds.)
I. U. B. Symposium Series, vol. 19, pp. 76-78, Pergamon Press, Oxford
and New York

251
Wever, R., Oudega, B. & Van Gelder, B. F. (1973) Generation of super-
oxide radicals during the autoxidation of mammalian oxyhemoglobin.
Biochim. Biophys. Acta 302, 475-478
Wilson, D. 0. & Reisenauer, H. M. (1963) Determination of leghemoglobin
in legume nodules. Anal. Biochem. 6, 27-30
Winter, M. R. C., Johnson, C. E., Lang, G. & Williams, R. J. P. (1972)
Mōssbauer spectroscopy of haemoglobin derivatives. Biochim. Biophys.
Acta 263, 515-534 Wittenberg, J. B., Appleby, C. A. & Wittenberg, B. A. (1972) The kine-
tics of the reactions of leghemoglobin with oxygen and carbon monox-
ide. J. Biol. Chem. 247, 527-531
Wittenberg, J. B., Bergersen, F. J. , Appleby, C. A. & Turner, G. L.
(1974) Facilitated oxygen diffusion. The role of leghemoglobin in
nitrogen fixation by bacteroids isolated from soybean root nodules.
J. Biol. Chem. 2149, 14-057-4066
Wittenberg, J. B., Noble, R. W., Wittenberg, B. A., Antonini, E.,
Brunori, M. & Wyman, J. (1972) Studies on the equilibria and kine-
tics of the reactions of peroxidase with ligands II. The reaction of
ferroperoxidase with oxygen. J. Biol. Chem. 242, 626-634
Woolum,J. C., Tiezzi, E. & Commoner, B. (1968) Electron spin resonance
of iron-nitric oxide complexes with amino acids peptides and pro-
teins. Biochim. Biophys. Acta 160, 311-320
Yocum, C. S. (1964) Recent studies of symbiotic nitrogen fixation. Sci-
ence 146, 432
Yonetani, T., Schleyer, H. & Ehrenberg, A. (1966) Studies on cytochrome
c peroxidase VII. Electron paramagnetic resonance absorptions of the
enzyme and complex ES in dissolved and crystalline forms. J. Biol.
Chem. 241, 3240-3243
Yonetani, T. & Yamamoto, H. (1973) Optical and electron paramagnetic

252
resonance properties of the nitric oxide compounds of cytochrome c
peroxidase and horseradish peroxidase. In:Oxidases and Related Redox
Systems (King, T. EL, Mason, H. S. & Morrison, M., eds.), vol. 1,
pp. 279-298, University Park Press, Baltimore
Yonetani, T., Yamamoto, H., Erman, J. EL, Leigh, Jr., J. S. & Reed, G.
H. (1972) Electromagnetic properties of hemoproteins V. Optical and
electron paramagnetic resonance characteristics of nitric oxide
derivatives of metalloporphyrin-apohemoprotein complexes. J. Biol.
Chem. 247, 2447-2155

Biocheni. J. (1977) 167, 435-445 435 Printed in Great Britain
Electron-Paramagnetic-Resonance Studies of Leghaemoglobins from Soya-Bean and Cowpea Root Nodules
IDENTIFICATION OF NITROSYL-LEGHAEMOGLOBIN IN CRUDE LEG HAEMOGLOBIN PREPARATIONS
By C. SIDNEY MASKALL,*§ JOHN F. GIBSON1-1 and PETER J. DART*II *Soil Microbiology Department, Rothamsted Experimental Station, Harpenden, Herts. AL5 2JQ, U.K.,
and tDepartment of Chemistry, Imperial College, London SW7 2A Y, U.K.
(Received 23 March 1977)
1. Leghaemoglobins from soya-bean (Glycine max) and cowpea (Vigna Unguiculata) root nodules were purified by chromatography on DEAE-cellulose phosphate columns at pH 8.0 and pH 5.8, to avoid the relatively low pH (5.2) commonly used to purify these proteins. 2. E.p.r. (electron-paramagnetic-resonance) spectra of the fluoride, azide, hydroxide and cyanide complexes of these ferric leghaemoglobins were very similar to the spectra of the corresponding myoglobin derivatives, indicating that the immediate environment of the iron in leghaemoglobin and myoglobin is similar, an imidazole moiety of histidine being the proximal ligand to the haem iron [cf. Appleby, Blumberg, Peisach, Wittenberg & Wittenberg (1976) J. Biol. Chem. 251, 6090-6096]. 3. E.p.r. spectra of the acid-metleghaemoglobins showed prominent high-spin features very near g = 6 and g = 2 and, unlike myoglobin, small low-spin absorptions near g = 2.26, 2.72 and 3.14. The width of the g = 6 absorption derivative at 10-20K was about 4-4.5mT, similar to the value for acid-methaemoglobin. In contrast, a recently published (Appleby et al., 1976) spectrum of acid-metleghaemoglobin a had less high-spin character and a much broader absorption derivative around g = 6. 4. E.p.r. spectra of ferric leg-haemoglobin nicotinate and imidazole complexes suggest that the low-spin absorption near g = 3.14 can be attributed to a trace of ferric leghaemoglobin nicotinate, and those near g = 2.26 and 2.72 are from an endogenous dihistidyl haemichrome. 5. A large e.p.r. signal at g = 2 in all samples of crude leghaemoglobin was shown to be from nitrosyl-leghaemoglobin. A soya-bean sample contained 27±3 % of the latter. A previously unidentified form of soya-bean ferrous leghaemoglobin a was shown to be its nitrosyl derivative. If this is not an artifact, and occurs in the root nodule, the nitrosyl radical may interfere with the function of leghaemoglobin.
Leghaemoglobin, the haemoglobin of legume root nodules, is an essential requirement for nitrogen fixa-tion in these structures. It does not, however, partici-pate directly in nitrogen fixation, but occurs in the nodule cells that contain the bacteroids, the actual site of nitrogen fixation. Recent evidence suggests that leghaemoglobin functions by facilitating the diffusion of 02 to the nodule bacteroids, free 02 being delivered to the bacteroids' surface at a stable low concentration (Bergersen et al., 1973; Wittenberg et al., 1974).
t To whom correspondence should be addressed. § Present address: Department of Biochemistry,
University College of Swansea, Swansea SA2 8PP, Wales, U.K.
II Present address: International Crops Research Insti-tute for the Semi-Arid Tropics, 1-I1-256, Begumpet, Hyderabad-500016, A.P., India.
Vol. 167
Crude leghaemoglobin from soya-bean root nod-ules can be fractionated into two major ferric com-ponents, leghaemoglobin a and leghaemoglobin c, by using a DEAE-cellulose acetate column at pH 5.2 (Ellfolk, 1960). This method, and minor variations of it, is most commonly used to purify leghaemo-globins. Appleby et al. (1975) have developed an improved separation of crude soya-bean (Glycine max) leghaemoglobin on DEAE-cellulose acetate columns at pH 5.2. Their method resolves leghaemo-globin c into two similar but distinct proteins, leghaemoglobins c1 and c2. The soya-bean leghaemo-globins have mol.wts. of approx. 15400 (a) and 16700 (unfractionated c) (Ellfolk, 1961). They contain one protohaem IX group per molecule (Ellfolk & Sievers, 1965) and appear to be monomeric in solu-tion (Bchlke et al., 1971). Cowpea leghaemoglobin also has protōhaem IX as its prosthetic group (Jack-

436 C. S. MASK ALL, J. F. GIBSON AND P. J. DART
son & Evans, 1966) and mol.wt. of 16000-17000 (C. S. Maskall, unpublished work). The leghaemo-globins thus resemble myoglobin. Leghaemoglobins a, c1 and c2 have two histidine residues per molecule and no sulphur-containing amino acids (Ellfolk, 1961; Appleby et al., 1975). The sequence of leg-haemoglobin a is known (Ellfolk, 1972), and com-parisons with the sequence of the y-chain from human haemoglobin and with other types of haemoglobin and myoglobin indicate a considerable similarity among leghaemoglobin, myoglobin and haemo-globin (Appleby, 1974). Circular-dichroism spectra of leghaemoglobin a show that it has an a-helix con-tent of 55 % (cf. 72.5 % for myoglobin) and that the association between the haem group and globin is weaker in this and other leghaemoglo bins than it is in myoglobin (Nicola et al., 1975). These findings are consistent with those of Ellfolk et al. (1974), who demonstrated by urea-denaturation studies that leghaemoglobin a is a less stable molecule than myoglobin.
The similarity between the optical spectra of leg-haemoglobin derivatives and those of the corres-ponding haemoglobin and myoglobin derivatives suggests that the immediate environment of the iron atom in the three proteins is similar (Appleby, 1974). X-ray-diffraction studies by Vainshtein et al. (1975) on lupin leghaemoglobin indicate that it has a tertiary structure closely resembling that of myoglobin and haemoglobin. The e.p.r. (electron-paramagnetic-resonance) investigation by Appleby et al. (1976) has shown that the fluoride and low-spin complexes of leghaemoglobin have very similar e.p.r. spectra to those of the corresponding myoglobin derivatives. However, these authors found that the e.p.r. spectrum of acid-metleghaemoglobin a (the ferric form of leghaemoglobin a with H2O attached) differed sig-nificantly from that of acid-metmyoglobin.
The aim of the present work was to purify leg-haemoglobins by using a procedure not involving prolonged exposure of the proteins to the relatively low pH (5.2) most commonly used, and then to com-pare by e.p.r. spectroscopy the immediate environ-ment of the iron atom in the soya-bean and cowpea leghaemoglobins with that in myoglobin and haemo-globin.
Experimental
Materials Reagents were of analytical grade unless otherwise
stated and were usually obtained from BDH Chemi-cals, Poole, Dorset, U.K. Nicotinic acid was from Sigma (London) Chemical Co., Kingston-upon-Thames, Surrey, U.K. Polyclar AT was a gift from GAF (G.B.) Limited, Manchester, U.K. DEAE-cellulose (DE52) was obtained from Whatman Pro-ducts, H. Reeve Angel, London E.C.4, U.K., and
Sephadex G-25 from Pharmacia (G.B.), London W.5, U.K. NO gas (minimum purity 99 %) was from Matheson Gas Products, Cambrian Chemicals, Croydon CR9 3QL, Surrey, U.K.
All solutions were made up in single-distilled water from an all-glass still. Phosphate buffers were made by mixing stock solutions (0.1 M) of Na2HPO4 and KH2PO4 to the stated pH (Gomori, 1955), and dilut-ing as required.
Growth of plants Seeds of soya bean (Glycine max), var. Merit,
Altona and Chippewa, and cowpea ( Vigna unguicu-lata), var. Poona, were surface-sterilized by rinsing quickly with 95 % (v/v) ethanol followed by immer-sion for 3 min in a 0.28 % solution of HgC12. The seeds were then rinsed six times with tap water and inocu-lated with the required Rhizobium strain by immersion in a broth culture of it for 2-3 min. (Cultures of Rhizobium were maintained on slants of agar con-taining mineral salts, yeast extract and mannitol. Flasks of broth containing these nutrients were inoculated either from a slant culture or with the contents of afreeze-dried ampoule and incubated with shaking at 25°C. Rhizobium strains used were CC705 and CB1809 for soya beans and CB756 and SU318 for cowpeas.) The seeds were then planted in boxes of Perlite (British Gypsum, Robertsbridge, Sussex, U.K.) which had been previously soaked in a nitrogen-free culture solution (Dart & Pate, 1959). Plants were grown in a glasshouse at about 27°C (day) and 24°C (night). They were watered with the above culture solution, diluted 1:4 (v/v) with tap water which contained 7p.p.m. of N as NO3-. Cowpeas were also grown in 15 cm (diam.) pots containing sand/grit (2:1, v/v) in controlled-environ-ment cabinets maintained at the same temperature as the glasshouse; day length 16h, illumination 250001x from warm-white fluorescent tubes. For more recent work, soya beans (var. Merit and Altona) were grown in the field in a light sandy soil, low in available N. Surface-sterilized seeds were inoculated just before planting with a broth culture of the required Rhizobium strain diluted with an equal volume of 20 % (w/v) sucrose solution.
Plants were harvested at flowering to early pod-fill stage, and the roots and nodules washed with tap water. Nodules were picked within a few hours of harvesting, immediately stored on ice and crushed on the same day.
Isolation and purification of leghaemoglobin Nodules were crushed in a Pirie (1961) press or a
press based on the modified Pirie press of McArthur & Miltimore (1964) into 20mM-phosphate buffer, pH 7.2, containing 10% (w/v) of an insoluble cross-linked polyvinylpyrrolidone, Polyclar AT. (In early soya-bean-nodule extractions and all the cow-
1977

ELECTRON PARAMAGNETIC RESONANCE OF LEGHAEMOGLOBINS 437
pea-nodule extractions, 0.2M-sodium ascorbate and 1 mm-MgCl2 were added to the medium; omitting them did not appear to cause any deterioration of the extracted soya-bean leghaemoglobin.) Nodules and ice-cold medium were loaded into the press, which had been cooled to 4°C (about 1 g fresh wt. of nodules/ml of medium). The annular gap was approxi-mately 9pm for the Pirie press and 10pm for the modified press. Oxygen-free nitrogen was flushed through the press for at least 5 min and the nodules were then crushed into the medium. Subsequent procedures were performed on ice or at 4°C. The homogenate was collected in a N2-flushed flask, filtered through two layers of bolting cloth to remove solid material and centrifuged for 10min at 12000g in gas-tight tubes previously flushed with N2. The supernatant was then fractionated with solid (NH4)2SO4 and the fraction precipitated between 55 and 80 % saturation (designated crude leghaemo-globin) was collected. The precipitate was dispersed in 60 %-satd. (NH4)2SO4 solution and stored in liquid N2.
Determination of leghaemoglobin Leghaemoglobin was measured either by the pyri-
dine haemochromogen method by using Em at 556nm as 34.6 (Paul et al., 1953) or by the cyano-methaemoglobin method (Wilson & Reisenauer, 1963).
Column chromatography on DEAE-cellulose Procedures were performed at 4°C unless other-
wise stated. Crude leghaemoglobin was dissolved in 20mr-sodium/potassium phosphate buffer, pH7.0, left on ice for 1 h and then centrifuged at 20000g for 10min to remove the small amount of insoluble protein present. The supernatant was desalted on a column (2cm x 28 cm) of Sephadex G-25 (fine or medium grade) and the leghaemoglobin fraction concentrated to a volume of less than 3.5 ml by ultra-filtration over an Amicon UM10 membrane (Amicon, High Wycombe, Bucks., U.K.). It was then passed through another column (1.2cm x 18 cm) of Sephadex G-25 (fine grade) to remove any remaining traces of salt, and then oxidized by incubation at 4°C for 2h with K3Fe(CN)6 (Geyer & Lemberg, 1971). Purified ferric leghaemoglobins were obtained by chromato-graphy on DEAE-cellulose. The oxidized crude leghaemoglobin was equilibrated on a column (2cm x 28 cm) of Sephadex G-25 (fine or medium grade) with 2 mM-phosphate buffer, nominally pH 8.0. (At this dilution the actual pH of the buffer was about 7.7.) The solution was left overnight on ice and then centrifuged at 29000g for 20 min to remove the small amount of insoluble protein present. About 60 mg of this leghaemoglobin was loaded on a column (2.2cmx 10cm) of DEAE-cellulose, equilib-rated with 2mM-phosphate buffer, nominally pH 8.0.
Starting buffer and stepwise elution were used at a rate of 80ml/h, and 1.5-3.0ml fractions were col-lected. Tubes containing ferric leghaemoglobin were pooled and concentrated by ultrafiltration over a UM10 membrane.
Two brown-red ferric leghaemoglobins (a and c) and, unexpectedly, two bright-red ferrous leghaemo-globins were eluted from the soya-bean column. For crude cowpea leghaemoglobin, one ferric and one ferrous leghaemoglobin were eluted. Approx. 80 mg of ferric leghaemoglobin, pooled from two pH 8.0 columns, was then equilibrated on a Sephadex G-25 column with 2mM-phosphate buffer, nominally p1-15.8, and loaded on a column (2.2 cm x 20 cm) of DEAE-cellulose that had been equilibrated with the same buffer. This column was developed by start-ing-buffer elution, followed by a linear gradient of 2 mm- to 20 mm-phosphate buffer, pH 5.8 (500g of each buffer). Further elution with 20 mm-phosphatebuffer, pH 5.8, was required to elute the second major soya-bean leghaemoglobin (c). The contents of tubes containing an individual ferric leghaemoglobin were pooled and concentrated by ultrafiltration to a volume of approx. 1.5 ml and then stored in liquid N2.
Polyacrylamide-gel electrophoresis Purity of the isolated ferric leghaemoglobins was
checked by polyacrylamide-gel electrophoresis: 7.5 (w/v) acrylamide gels were run at pH 8.9, the system being similar to that of Davis (1964). Electrophoresis was performed at 4°C for 60min at a voltage of 200 V and a current of 5 mA/gel. Gels were stained either for protein with Amido Black [1% (w/v) in 7 % (v/v) acetic acid] or for peroxidase activity by the method of Seevers et al. (1971).
Preparation of ferric leghaemoglobin derivatives for e.p.r. spectroscopy
All procedures were carried out at 0-4°C. Approx. 0.3-0.5 ml of purified ferric leghaemogolobin solu-tion (12-18 mg of leghaemoglobin) was passed down a column (1.2cmx18cm) of Sephadex G-25 (fine grade) equilibrated with 20mM-phosphate buffer, p17.0, to prepare the acid-metleghaemoglobin derivatives, and the same buffer containing the appropriate dissolved compound to prepare the F-, N3-, CN- and imidazole derivatives. Molar ratios of low-molecular-weight ligands to leghaemoglobin were: F- (NaF), 10:1 ; N3- (NaN3, Laboratory Reagent grade), 5:1 ; CN- (KCN), 3 :1 (pH of this solution was 7.4); imidazole (Laboratory Reagent grade), 10:1 (pH of solution adjusted to 7.0 with 0.3 M-H3PO4); and nicotinate, 3 :1 (nicotinic acid dis-solved in 20mM-phosphate buffer, pH6.8, and the pH adjusted to 6.9 with l M-NaOH). For leghaemo-globin hydroxides the column was equilibrated with glycine/NaOH buffer, pH9.6 [0.05M in glycine
Vol. 167

438 C. S. MASKALL, J. F. GIBSON AND P. J. DART
(chromatographically homogeneous)]. The solu-tions of leghaemoglobin derivatives were then con-centrated to a volume of about 0.3 ml (1-2mM-leg-haemoglobin) by using dry Sephadex G-25 (coarse grade), introduced into an e.p.r. tube, frozen and stored in liquid N2.
Preparation of ferrous nitrosyl-leghaemoglobin Soya-bean leghaemoglobin c, purified by DEAE-
cellulose phosphate chromatography at pH 8.0, was converted into oxyleghaemoglobin c by the method of Dixon & McIntosh (1967). This solution of oxyleghaemoglobin c was converted into nitrosyl-leghaemoglobin c* by the method of Henry & Banerjee (1973).
E.p.r. measurements E.p.r. spectra were recorded on a Varian E-12
e.p.r. spectrometer by using 100kHz magnetic-field modulation and operating at about 9.2 GHz. Samples run above 77K were cooled by using a Varian variable-temperature accessory. Samples run below 77K were cooled by He gas boiled directly from the liquid.
Results and Discussion
Chromatographic separation of soya-bean leghaemo-globin
The order of elution of the leghaemoglobin fractions from the pH 8.0 columns was: (i) leghaemo-globin a followed by `oxyleghaemoglobin a' (2mM-phosphate, nominal pH 8.0) (all `oxyleghaemoglobin' fractions contained nitrosyl-leghaemoglobin; see under `Presence of nitrosyl-leghaemoglobin in samples of crude leghaemoglobin'); (ii) leghaemo-globin c followed by `oxyleghaemoglobin c' (10mM-phosphate, pH 8.0). Two minor leghaemoglobin fractions were eluted with 20mM-phosphate buffer, pH8.0, and then 100mM-phosphate buffer, pH8.0, was used to elute a protein fraction that, when exam-ined by polyacrylamide-gel electrophoresis, showed six bands having peroxidase activity and no red leg-haemoglobin bands. It was therefore designated the `peroxidase fraction'. The two leghaemoglobin c components, c1 and c2, were not resolved by DEAE-cellulose phosphate chromatography at pH8.0 or pH 5.8, and polyacrylamide-gel electrophoresis of crude leghaemoglobin at pH 8.9 and pH 6.6 gave only one leghaemoglobin c band. These results are in agreement with those of Appleby et al. (1975).
The mobilities of the leghaemoglobins relative to
* The prefix `ferrous' is omitted from nitrosyl-leg-haemoglobin and nitrosylhaemoglobin because only the ferrous haemoprotein NO complexes are considered in the present paper. Also, in `oxyleghaemoglobin' the prefix `ferrous' or `ferric' is omitted because only the ferrous protein binds 02.
Bromophenol Blue (polyacrylamide-gel electro-phoresis at pH 8.9) were: leghaemoglobin a, 0.54; leghaemoglobin c, 0.74. The fractions 'oxyleg-haemoglobins' a and c had the same relative mo-bilities as their respective ferric forms. The elution profile of crude soya-bean leghaemoglobin (Appleby, et al., 1975) shows that the amounts of leghaemo-globin band d1+d2 (incompletely separated) are small relative to the amounts of leghaemoglobin a and c1+ c2. Thus these relatively minor components would not have been detectable in the column separation at pH8.0. They may have been present in the `oxyleg-haemoglobin' fractions. Chromatographic separation of cowpea leghaemoglobin
For crude cowpea leghaemoglobin the order of elution from the pH 8.0 columns was: (i) ferric leg-haemoglobin (2mM-phosphate, nominal pH8.0); (ii) `oxyleghaemoglobin' (10mM-phosphate, pH 8.0). One minor leghaemoglobin fraction remained on the column.
Polyacrylamide-gel electrophoresis at pH 8.9, of these leghaemoglobins showed that both had the same mobility relative to Bromophenol Blue, 0.64, indicating that cowpea has only one major leghaemo-globin. However, as with soya-bean leghaemoglobin, the amount of crude leghaemoglobin applied to the column was too small to reveal any minor fractions that might have been eluted with the two major fractions.
Purity of the isolated ferric leghaemoglobins Polyacrylamide-gel electrophoresis of the ferric
leghaemoglobins eluted from the pH5.8 columns showed that they were only slightly contaminated with peroxidases. One faint peroxidase band was visible in gels of leghaemoglobins a and c and cowpea leghaemoglobin, but no corresponding bands were visible in duplicate gels stained for protein. Com-parison of gels of ferric leghaemoglobins from the pH 8.0 and pH 5.8 columns showed that the second column had effected a further purification. Leghaemo-globin a and cowpea leghaemoglobin contained a major contaminant that had no peroxidase activity and probably accounted for less than 10 % of the total protein. Leghaemoglobin c contained much less of this contaminant, probably a product of leghaemo-globin catabolism. The e.p.r. spectra of acid-met-leghaemoglobins a and c were basically very similar (Figs. la and lb), indicating that although the con-taminant may contain iron, it gives no e.p.r. signal under these conditions.
High-spin ferric derivatives The three fluoride derivatives of leghaemoglobin
had almost identical e.p.r. spectra, closely resembling the e.p.r. spectrum of the fluoride derivative of myo-globin (Peisach et al., 1971), indicating that the fluo-ride derivative of leghaemoglobin is predominantly,
1977

ELECTRON PARAMAGNETIC RESONANCE OF LEGHAEMOGLOBINS 439
(a)
(b)
(c)
1.5 2.5 3 5 10-1 x Magnetic field (T)
Fig. 1. E.p.r. spectra of acid-met leghaemoglobin at pH7.0 Leghaemoglobin samples (1-2mM) were prepared and their e.p.r. spectra recorded as described in the Experimental section. Soya-bean leghaemoglobins were from Merit CC705 nodules; (see under `Growth of plants'). (a) Soya-bean leghaemoglobin a at 13K; (b) soya-bean leghaemoglobin c at 11 K; (c) cowpea leghaemoglobin at 20K. For all three samples the power was 2 mW. The broken line over each trace was drawn parallel to the grid line to accentuate the slight undulations in the trace. The spectra in the region of 0.1 T in (a) and (b) were similar to that shown in (c).
if not entirely, high-spin. The doublet at g=2 proves that the F- is ligated to the haem iron. The super-hyperfine splitting measured from this doublet was 4.3±0.2rnT for all three derivatives; cf. 4.4mT for the fluoride derivative of myoglobin (Peisach et al., 1971).
In agreement with the results of Appleby et al. (1976) for leghaemoglobin a, this demonstrates that the immediate environment of the iron atom in the fluoride derivatives of leghaemoglobin and myo-globin is similar, with a nitrogen atom of the imidazole ring of a histidine residue occupying the fifth co-ordination position of the iron and F- occupying the sixth position. For soya-bean leghaemoglobin a this histidine is almost certainly histidine-92 of the protein's sequence, as suggested by Ellfolk (1972).
The g values of the prominent high-spin features of the acid-metleghaemoglobins were very close to 6.0 (gx and g5 ) and 2.0 (gz). (Fig. 1 and Table 1.) The width between the derivative extrema of the absorp-tion derivative at g = 6 was approx. 4.5mT for leg-haemoglobins a and c and approx. 4.0 mT for cowpea leghaemoglobin (spectra recorded at 10-20K). This is compatible with the value of 4.1 mT measured for haemoglobin at 1.4K (Peisach et al., 1971), but con-trasts with the acid-metleghaemoglobin a value of
Table 1. Effective g values of high-spin ferric leghaemoglobin derivatives Derivatives were prepared and e.p.r. spectra recorded at 10-40K as described in the Experimental section. The soya-bean leghaemoglobins were from Merit CC705 nodules. The g values of the low-spin features in the acid-met-leghaemoglobin spectra were also measured.
Acid-metleghaemoglobin derivative
g values Superhyperfine splitting
(mT) gx gv gz
Soya-bean leghaemoglobin a at pH7.0 5.99 5.99 2.00 Soya-bean leghaemoglobin c at pH7.0 6.01 6.01 2.00 Cowpea leghaemoglobin, Poona CB756:
at pH 7.0 5.99 5.99 2.00 at pH 5.8 5.98 5.98 2.00
Cowpea leghaemoglobin, Poona SU318 at pH7.0* 5.97 5.97 1.99
Fluoride at pH7.0 Soya-bean leghaemoglobin a 6.04 6.04 2.00 4.3 ± 0.2 Soya-bean leghaemoglobin c 6.04 6.04 2.00 4.3 ± 0.2 Cowpea leghaemoglobin, Poona CB756 6.05 6.05 2.00 4.3 ± 0.2
g values of low-spin features in the acid-metleghaemoglobin spectra gx fi Soya-bean leghaemoglobin a
Soya-bean leghaemoglobin c Cowpea leghaemoglobin, Poona CB756 at pH7.0
gy g= g4 gy gz 2.26 2.72 t 3.14 2.28 2.73 1" 3.14 2.24 t 1' t 3.10
* Sample purified by one chromatographic separation at pH 8.0. t Unobservable. $ The printed symbols refer to a second low-spin species.
Vol. 167

440 C. S. MASKALL, J. F. GIBSON AND P. J. DART
Appleby et al. (1976); see the end of this section. Small low-spin absorptions were also present in the leghaemoglobin a and leghaemoglobin c spectra near g = 2.26, 2.72 and 3.14, those in the leghaemoglobin c spectrum being more pronounced. The spectrum of cowpea leghaemoglobin had an absorption near g = 2.26 which was smaller than the corresponding absorptions in the soya-bean leghaemoglobin spectra. It had no absorption near g= 2.7 but did have an absorption near g = 3.1 which was slightly larger than the absorption in the soya-bean leghaemo-globin spectra. [During the initial stages of this work a signal was observed near g = 2.7 in the e.p.r. spectrum of cowpea acid-metleghaemoglobin sam-ples isolated by DEAE-cellulose phosphate chro-matography at pH 7.0. In fact the e.p.r. spectra of all three leghaemoglobins purified at pH 7.0 had pro-nounced absorptions near g = 1.74, 2.26, 2.71 and 3.1. This was probably due to the different method of purification and concentration (C. S. Maskall, unpublished work)]. Leghaemoglobin, when pure as indicated by polyacrylamide-gel electrophoresis,
thus resembles haemoglobin. The e.p.r. spectrum of acid-methaemoglobin below 77K exhibits low-spin signals at g= 1.70, 2.20 and 2.80 (Nakano et al., 1971). Acid-metmyoglobin, however, is entirely high-spin at 77K (Iizuka & Kotani, 1969).
A comparison of the e.p.r. spectra of acid-met-leghaemoglobin and ferric leghaemoglobin acetate (essentially a pure high-spin complex) led to the suggestion that at 77K acid-metleghaemoglobin was approx. 35-50 % high-spin (Ehrenberg & Ellfolk, 1963). Our comparison of the e.p.r. spectra of acid-metleghaemoglobin c and LbcF-* at 86 K likewise indicated that about 20 % of the leghaemoglobin c was high-spin. Although the e.p.r. spectra and g values of the LbF- derivatives and low-spin leghaemo-globin derivatives (see the next section) obtained in the present study are very similar to those of Appleby et al. (1976) obtained with leghaemoglobin a, the three acid-metleghaemoglobin spectra (Fig. 1) differ significantly. The spectrum of acid-metleg-
* Abbreviations: Lb, Ieghaemoglobin; Mb, myoglobin.
Table 2. Effective g values of low-spin ferric leghaemoglobin derivatives, with g values of some myoglobin derivatives given for comparison
Details of methods are as for Table 1. Cowpea leghaemoglobin was from Poona CB756 nodules.
Derivative
Hydroxides, pH 9.6
g values
Reference gx gy g=
Leghaemoglobin a 1.86 2.19 2.51 Leghaemoglobin c 1.84 2.19 2.54 Cowpea leghaemoglobin 1.86 2.18 2.51 Myoglobin, pH 11.3 1.84 2.14 2.57 Gurd et al. (1967) Myoglobin, p1112.8 1.85 2.17 2.54 Gurd et al. (1967)
Azides, pH 7.0 Leghaemoglobin a 1.72 2.21 2.77 Leghaemoglobin c 1.72 2.21 2.79 Cowpea leghaemoglobin 1.72 2.20 2.79 Myoglobin* 1.71 2.19 2.82 Helcke et al. (1968) Myoglobin* 1.72 2.22 2.80 Hod (1971)
Imidazoles, pH7.0 Leghaemoglobin c 1.67 2.27 2.77t
1.49 2.27 2.93 Cowpea leghaemoglobin 1.68 2.27 2.77 Myoglobin* 1.53 2.26 2.91 Hod (1971) Haemoglobin* 1.43 2.29 2.93 Rein et a1. (1975)
Cyanide Cowpea leghaemoglobin, pH7.4 $ 1.93 3.33 Myoglobin* 0.93 1.89 3.45 Hod (1971)
Nicotinates, pH6.9 Leghaemoglobin a $ 2.17 3.07 Leghaemoglobin c 1.23 2.18 3.14 Cowpea leghaemoglobin $ 2.15 3.11
* pH not specified. $ An absorption at g= 1.99 was also present. $ Unobservable.
1977

(d)
(a)
(b)
(a)
(b)
\/ V~
ELECTRON PARAMAGNETIC RESONANCE OF LEGHAEMOGLOBINS 441
haemoglobin a obtained by Appleby et al. (1976) had less high-spin and more low-spin character than the spectra of Fig. 1, and a much broader absorption derivative at g = 6. These differences probably reflect differences in the conformation of the two leghaemo-globin a compounds in the region of the iron atom and presumably arise from the different methods used to extract and purify these leghaemoglobins.
Low-spin ferric derivatives The three LbOH- complexes gave similar e.p.r.
spectra and had similar sets of g values that most closely resembled the g values for ferric MbOH- at pH 12.8 (Gurd et al., 1967); see Table 2. The typically rhombic e.p.r. spectra for the three azide derivatives of leghaemoglobin were very similar and resembled closely those of myoglobin (Helcke et al., 1968 ; Hori, 1971). However, the absorption at g = 2.05 seen in the spectrum of LbaN3- (Appleby et al., 1976) was not present in these spectra (see Fig. 2 and Table 2). Also that of the azide of leghaemoglobin c had broader features at g = 1.72 and g = 2.79 than those of the other two azide derivatives (compare Figs. 2a, 2b and 2c); this is probably because leg-haemoglobin c consists of two distinct proteins, leghaemoglobins cl and c2.
The e.p.r. spectrum of the cyanide of cowpea leghaemoglobin had g values fairly close to those of the cyanide of myoglobin (Hori, 1971) (Table 2).
10 2.0 3 0 4.0 5 0
10' xMagnetic field (T)
Fig. 2. E.p.r. spectra of ferric azide derivatives of leghaemo-globin at pH7.0
Leghaemoglobin samples (1-2mM) were prepared and their e.p.r. spectra recorded as described in the Experimental section. (a) Soya-bean azide derivative of leghaemoglobin c at 37K and 20mW; (b) soya-bean azide derivative of leghaemoglobin a at 37K and 20mW; (c) cowpea azide derivative of leg-haemoglobin at 20K and 0.02mW.
The similarity between the e.p.r. spectra of these low-spin leghaemoglobin derivatives and those of the corresponding myoglobin derivatives again supports the view that the environment of the iron atom in the leghaemoglobins and myoglobin is similar. Like the soya-bean leghaemoglobins, cowpea leghaemoglobin has two histidine residues per molecule and no sul-phur-containing amino acids (C. S. Maskall, unpub-lished work). This finding is also consistent with the great similarity between these proteins.
Origin of the low-spin signals The probable origin of the low-spin signals in the
acid-metleghaemoglobin spectra is suggested by a consideration of the low-spin e.p.r. spectra of imid-azole and nicotinate complexes of ferric leghaemo-globin. Appleby et al. (1976) detected two low-spin species in the e.p.r. spectrum of soya-bean acid-met-leghaemoglobin a. They considered that both species were endogenous dihistidyl haemichromes, the imidazole group of the distal histidine (histidine-61) occupying the sixth co-ordination position of the haem iron. The major species had g values of 2.69, 2.24 and 1.72, very similar to the g values of bis-imidazole haem to which base has been added. The minor species had g values of 3.02, 2.24 and 1.34, similar to those of bis-imidazole haem (Peisach et al., 1973).
The low-spin absorptions at g = 2.26 and 2.72 of the acid-metleghaemoglobin spectra (Table 1) are similar to the gy and g, values of the three azide complexes of leghaemoglobin (Table 2). Cowpea
I 0 2.0 3.0 4.0 5 0
10—' xMagnetic field (T)
Fig. 3. E.p.r. spectra of ferric leghaemoglobin imidazole derivatives at pH7.0
Leghaemoglobin samples (1-2mM) were prepared and their e.p.r. spectra recorded as described in the Experimental section. (a) Soya-bean leghaemoglobin c imidazole at 32K; (b) cowpea leghaemoglobin imidazole at 40K. The power was 0.2mW.
Vol. 167

(a)
442 C. S. MASKALL, J. F. GIBSON AND P. J. DART
leghaemoglobin imidazole also had an e.p.r. spectrum very similar to that of cowpea azide of leghaemoglobin (cf. Figs. 3b and 2c), but different from those of myoglobin imidazole and haemoglobin imidazole (see Table 2). Presumably an absorption band near g = 1.7 (gx) is present in the acid-metleghaemo-globin spectra, but it is too small to be detected. Lbc imidazole gave a complex e.p.r. spectrum containing absorptions from two low-spin species (Fig. 3a and Table 2). One had very similar g values to those of cowpea leghaemoglobin imidazole, the other had g values very close to those of myoglobin imidazole and haemoglobin imidazole. As for the azides noted above, the different species may occur because leg-haemoglobin c consists of leghaemoglobins c1 and c2.
The two forms of azide derivative of myoglobin are attributed to the possibility of electron-pair donation from the distal histidine residue to azide (McCoy & Caughey, 1970). The two forms of Lbc imidazole likewise might arise from an interaction involving the distal histidine. In our case, however, the interaction is quite likely to be simple hydrogen-bonding be-tween the lone pair of the nitrogen atom of the distal histidine and the NH group of the iron-bound imid-azole; in the second form the hydrogen bond cannot be formed. Fluoride has also been thought to interact with an imidazole NH group in some bis-imidazole haem model complexes (Momenteau et al., 1973).
Of these two imidazole forms, one (and also the cowpea leghaemoglobin imidazole) is a suitable model compound for a low-spin complex present in all three acid-metleghaemoglobin preparations, suggesting that the latter is a dihistidyl haemichrome. In addition (see Table 2), this imidazole complex is clearly unlike the myoglobin and haemoglobin imi-dazole derivatives. This possibly arises because the haem pocket of leghaemoglobin has greater flexibility than that of myoglobin (Nicola et al., 1975).
The third low-spin absorption near g = 3.14 in all the acid-metleghaemoglobin spectra (see Table 2) is probably from a trace of ferric Lb nicotinate, be-cause during purification the nicotinate which might have been present (Appleby et al., 1975) was not removed. The nicotinate complexes of the three leghaemoglobins had very similar g values, with the major absorption near g = 3.1 (gz ) (Table 2). Appleby et al. (1976) found similar g values for Lba nicotinate and demonstrated that the nitrogen atom of nicotinate is ligated to the haem iron.
Presence of nitrosyl-leghaemoglobin in samples of crude leghaemoglobin
All samples of crude soya-bean and cowpea leg-haemoglobin examined by e.p.r. spectroscopy at temperatures above 77K showed a very large signal near g = 2 (Fig. 4a). This signal exhibited some struc-ture (see inset in Fig. 4a and expanded version of this in Fig. 4b) and its shape was almost the same at 10K.
05 (6)
3.03 3.13
(c)
0 5 1.5
10-1 xMagnetic field (T)
Fig. 4. E.p.r. spectra of crude soya-bean leghaemoglobin and the peroxidase fraction at pH7.0
(a) Crude Chippewa CC705 soya-bean Lb. Power 200mW, temperature 93 K, gain of main spectrum x1000 and of nitrosyl-leghaemoglobin signal at g = 2, x63. (b) Expanded spectrum of nitrosyl-leghaemoglobin signal from a similar crude Chippewa CC705 soya-bean leghaemoglobin preparation. Field sweep 40mT, power 200mW, temperature 86K, gain x40. (c) Peroxidase fraction isolated from crude Merit CC705 soya-bean Lb. Power 2mW, tem-perature approx. 30K, gain x5000.
Omitting sodium ascorbate or Polyclar from the nodule extraction medium did not affect the signal. During the development of the DEAE-cellulose phos-phate purification procedure, it was found that for soya-bean Altona CB1809 leghaemoglobin [not oxidized with K3Fe(CN)6] the large signal was not present in the ferric fractions, leghaemoglobins a and c, but was present in the corresponding bright-red ferrous fractions. The peroxidase fraction isolated from crude soya-bean leghaemoglobin did not show the large signal either (see Fig. 4c). The signal at g = 4.3 (also present in the spectrum of crude soya-
2.5 3.5 45
1 v i 3.23 3.33 3.43
,r 2.5 3.5 4.5
1977

ELECTRON PARAMAGNETIC RESONANCE OF LEGHAEMOGLOBINS
443
bean leghaemoglobin) is presumably from non-haem iron. The signals at g = 6 and near g = 2 are from the high-spin ferric peroxidases. It is noteworthy that the prominent feature at g = 6 is not broadened or split. This is in marked contrast with the e.p.r. spectra of the isoenzymes of horseradish peroxidase at 20K, which show a pronounced splitting of the signal in this region (Tamura & Hori, 1972).
Unexpectedly, crude leghaemoglobin treated with K3Fe(CN)6 still gave bright-red ferrous leghaemo-globin bands on DEAE-cellulose phosphate chro-matography. Again, only the ferrous fractions showed the large signal at g = 2. The stability towards K3Fe(CN)6 oxidation and the probable ferrous state of the species responsible for the large e.p.r. signal suggests that this species might be nitrosyl-leghaemo-globin. A comparison of the large signal with the e.p.r. signal of nitrosyl-haemoglobin (Kon, 1968) showed that the two spectra were very similar. Nitro-syl-leghaemoglobin c was prepared and its e.p.r. spectrum recorded at 90K and found to be almost identical with the large signal in the leghaemoglobin preparations (Maskall et al., 1974). Thus nitrosyl-leghaemoglobin is present in crude leghaemoglobin and, unless it is an artifact of extraction, in soya-bean and cowpea root nodules too.
Appleby (1974), referring to the work of Melik-Sarkisyan et al. (1970), has commented on the pos-sible presence in vivo of an as yet uncharacterized ligand of ferrous leghaemoglobin. He had previously noted that soya-bean oxyleghaemoglobin a prepara-tions occasionally gave an unusual optical spectrum when deoxygenated with Na2S2O4. (Appleby, 1969). This high-spin ferrous leghaemoglobin a had a com-plex spectrum (Soret peak at 418nm with a shoulder at 430nm, plus a peak at 560nm with a shoulder at 545nm). After storage for 5 days at 0°C, addition of Na2S2O4 to the same oxyleghaemoglobin a prepa-ration gave ferrous leghaemoglobin a with the con-ventional high-spin spectrum (single Soret peak at 427 nm plus a single peak at 555 nm). These observa-tions, coupled with the fact that our large nitrosyl-leghaemoglobin e.p.r. signal of crude soya-bean leg-haemoglobin decayed over a period of 4-5 days storage at 0°C, prompted an examination of the optical spectra of some Na2S2O4-treated leghaemoglobin samples possessing the large nitrosyl-leghaemoglobin signal. Crude soya-bean leghaemoglobin and a sample of a cowpea `oxyleghaemoglobin' fraction from a DEAE-cellulose phosphate column at pH 8.0 were deoxy-genated with Na2S2O4. Both samples gave similar optical spectra. That of crude soya-bean ferrous leghaemoglobin had a peak at 418 nm with a shoulder at 425nm, whereas that of cowpea ferrous leghaemo-globin showed a peak at 415nm with a shoulder at 426nm; see Fig. 5. Thus in this region the spectra resemble the unusual ferrous leghaemoglobin a spectrum. However, both spectra had only a single
413
1.25
1.00
0.75
0.50
350
400
450
.? (nm)
Fig. 5. Soret region of the optical spectra of purified cowpea ferrous leghaemoglobin and nitrosyl-leghaemoglobin , Spectrum of the `oxyleghaemoglobin' fraction from a DEAE-cellulose phosphate column at pH 8.0 deoxygenated with Na2S2O4. ----, Spectrum of the same sample after addition of a few crystals of NaNO2 to produce the nitrosyl-leghaemoglobin com-plex.
peak at 554nm, resembling that of high-spin ferrous leghaemoglobin. This may be because these leg-haemoglobin samples contain a lower concentration of the species responsible for the unusual spectrum. The cowpea ferric leghaemoglobin fraction from the same column as the `oxyleghaemoglobin' fraction gave the conventional high-spin ferrous leghaemo-globin spectrum on addition of Na2S2O4. Thus spectra like the unusual ferrous leghaemoglobin a spectrum appear to be connected with the presence of nitrosyl-leghaemoglobin. When Na2S2O4 and a few crystals
Vol. 167

444 C. S. MASKALL, J. F. GIBSON AND P. J. DART
of NaNO2 were added to the cowpea ferrous leg-haemoglobin sample above (a method used to pro-duce the NO complexes of ferrous haemoproteins; Yonetani et al., 1972), the peak at 415 nm shifted to 413 nm, increasing in intensity and losing its shoulder at 426nm (see Fig. 5). The peak at 554nm split into two peaks at 542nm and 568nm. These observations indicate that the peak at 415 nm in the spectrum of the cowpea ferrous leghaemoglobin sample is due to nitrosyl-leghaemoglobin and the shoulder at 426nm is due to high-spin ferrous leghaemoglobin. They also indicate that the shoulder at 545 nm in the unusual ferrous leghaemoglobin a spectrum is almost certainly due to nitrosyl-leghaemoglobin a. Thus the unstable form of ferrous leghaemoglobin a (Appleby, 1969) is almost certainly nitrosyl-leg-haemoglobin a.
Soya-bean nitrosyl-leghaemoglobin c, prepared by the same method as the cowpea nitrosyl-leghaemo-globin above, had absorption bands at 568nm, 545nm and 414nm. Melik-Sarkisyan et al. (1970) extracted leghaemoglobin from lupin nodules at pH7.0 in the presence of capron (like Polyclar, an adsorbent of phenolic compounds). Their isolated crude leghaemoglobin gave spectra having absorption bands at 566-572nm and 539-543nm and appeared to contain a form of ferrous leghaemoglobin (about 30 %) which was oxygenated only slowly. These observations suggest very strongly that the crude leghaemoglobin preparations of Melik-Sarkisyan et al. (1970) also contained nitrosyl-leghaemoglobin.
Nitrosyl-leghaemoglobin was present in crude leghaemoglobin extracted from nodules of plants grown in three different environments, including the field. This indicates that it is not unusual growth conditions which give rise to nitrosyl-leghaemoglobin. Quantitative e.p.r. spectroscopy, with a Cue+-EDTA standard for comparison, was used to deter-mine the amount of nitrosyl-leghaemoglobin in a sample of crude leghaemoglobin from nodules of 8-week-old Chippewa CC705 soya beans grown in controlled-environment cabinets under similar con-ditions to those used for cowpeas (see under `Growth of plants'). It contained 27±3 % nitrosyl-leghaemoglobin, a considerable fraction of the total leghaemoglobin.
If nitrosyl-leghaemoglobin is an artifact, the mechanism by which it is generated during the ex-traction of leghaemoglobin is nevertheless worthy of further investigation. If it is actually present in the root nodule, it may originate from NO in the soil. C. S. Yocum (unpublished work), quoted by Tjepkema (1971), has suggested that leghaemoglobin may protect the nodule bacteroids' nitrogenase by combining with the CO and NO that may occur in the soil. [Leghaemoglobin has a higher affinity for CO than for 02 (Imamura et al., 1972) and presumably it has a higher affinity for NO than for CO (Antonini
& Brunori, 1971)]. However, nitrosyl-leghaemo-globin may be produced by NO3- or NO2- entering the nodule and being reduced to NO. In fact, Virtanen et al. (1947) suggested that nitrosyl-leghaemoglobin might be formed in root nodules exposed to NO3-, and that this would interfere with the function of leghaemoglobin. This may well be the case, since the presence of the presumed stable nitrosyl-leghaemo-globin complex will decrease the amount of ferrous leghaemoglobin available for facilitating 02 diffusion to the nodule bacteroids.
We thank Dr. J. M. Day and Dr. J. M. Carpenter for their helpful suggestions. C. S. M. thanks the Ministry of Agriculture, Fisheries and Food for a Postgraduate Agricultural Studentship.
References
Antonini, E. & Brunori, M. (1971) Haemoglobin and Myoglobin in their Reactions with Ligands, p. 272, North-Holland, Amsterdam
Appleby, C. A. (1969) Biochim. Biophys. Acta 189, 267-279
Appleby, C. A. (1974) in The Biology of Nitrogen Fixation (Quispel, A., ed.), pp. 528,529 and 550, North-Holland, Amsterdam
Appleby, C. A., Nicola, N. A., Hurrell, J. G. R. & Leach, S. J. (1975) Biochemistry 14, 1111 1150
Appleby, C. A., Blumberg, W. E., Peisach, J., Wittenberg, B. A. & Wittenberg, J. B. (1976) J. Biol. Chem. 251, 6090-6096
Behlke, J., Sievers, G. & Ellfolk, N. (1971) Acta Chem. Scand. 25, 746-747
Bergersen, F. J., Turner, G. L. & Appleby, C. A. (1973) Biochim. Biophys. Acta 292, 271-282
Dart, P. J. & Pate, J. S. (1959) Aust. J. Biol. Sci. 12, 427-444
Davis, B. J. (1964) Ann. N.Y . Acad. Sci. 121, 404-427 Dixon, H. B. F. & McIntosh, R. (1967) Nature (London)
213, 399-400 Ehrenberg, A. & Ellfolk, N. (1963) Acta Chem. Scand. 17,
S343 Ellfolk, N. (1960) Acta Chem. Scand. 14, 609-616 Ellfolk, N. (1961) Acta Chem. Scand. 15, 545-554 Ellfolk, N. (1972) Endeavour 31, 139-142 Ellfolk, N. & Sievers, G. (1965) Acta Chem. Scand. 19,
268-269 Ellfolk: N., Sievers, G. & Harmoinen, A. (1974) Acta
Chem. Scand. Ser. B 28, 1195-1199 Geyer, D. & Lemberg, R. (1971) Biochim. Biophys. Acta
229,284-285 Gomori, G. (1955) Methods Enzymol. 1, 143 Gurd, F. R. N., Falk, K. E., Malmstrom, B. G. & Vann-
giird, T. (1967) J. Biol. Chem. 242, 5724-5730 Helcke, G. A., Ingram, D. J. E. & Slade, E. F. (1968)
Proc. R. Soc. London Ser. B 169, 275-288 Henry, Y. & Banerjee, R. (1973) J. Mol. Biol. 73, 469-482 Hori, H. (1971) Biochim. Biophys. Acta 251, 227-235 Iizuka, T. & Kotani, M. (1969) Biochim. Biophys. Acta 181,
275-286 Imamura, T., Riggs, A. & Gibson, Q. H. (1972) J. Biol.
Chem. 247, 521-526
1977

ELECTRON PARAMAGNETIC RESONANCE OF LEGHAEMOGLOBINS 445
Jackson, E. K. & Evans, H. J. (1966) Plant Physiol. 41, 1673-1680
Kon, H. (1968) J. Biol. Chem. 243, 4350-4357 Maskall, C. S., Dart, P. J. & Gibson, J. F. (1974) Annu.
Rep. Rothamsted Exp. Stn., Part 1, p. 248 McArthur, J. M. & Miltimore, J. E. (1964) Can. J. Plant
Sci. 44,112-113 McCoy, S. & Caughey, W. S. (1970) Biochemistry 9,
2387-2393 Melik-Sarkisyan, S. S., Yarovenko, V. V. & Kretovich,
V. L. (1970) Biokhimiya 35, 1230-1237 Momenteau, M., Mispelter, J. & Lexa, D. (1973) Biochim.
Biophys. Acta 320, 652-662 Nakano, N., Nakano, K. & Tasaki, A. (1971) Biochim.
Biophys. Acta 251, 303-313 Nicola, N. A., Minasian, E., Appleby, C. A. & Leach, S. J.
(1975) Biochemistry 14, 5141-5149 Paul, K. G., Theorell, H. & Akeson, A. (1953) Acta Chem.
Scand. 7, 1284-1287 Peisach, J., Blumberg, W. E., Ogawa, S., Rachmilewitz,
E. A. & Oltzik, R. (1971) J. Biol. Chem. 246, 3342-3355
Peisach, J., Blumberg, W. E. & Adler, A. (1973) Ann. N.Y. Acad. Sci. 206, 310-327
Pirie, N. W. (1961) J. Agric. Eng. Res. 6, 142-144 Rein, H., Ristau, O. & Ruckpaul, K. (1975) Biochim. Bio-
phys. Acta 393, 373-378 Seevers, P. M., Daly, J. M. & Catedral, F. F. (1971) Plant
Physiol. 48, 353-360 Tamura, M. & Hori, H. (1972) Biochim. Biophys. Acta 284,
20-29 Tjepkema, J. D. (1971) Ph.D. Thesis, University of Michi-
gan Vainshtein, B. K., Harutyunyan, E. IL, Kuranova, I. P.,
Borisov, V. V., Sosfenov, N. I., Pavlovsky, A. G., Grebenko, A. I. & Konareva, N. V. (1975) Nature (London) 254, 163-164
Virtanen, A. I., Jorma, J., Linkola, H. & Linnasalami, A. (1947) Acta Chem. Scand. 1, 90-111
Wilson, D. O. & Reisenauer, H. M. (1963) Anal. Biochem. 6, 27-30
Wittenberg, J. B., Bergersen, F. J., Appleby, C. A. & Turner, G. L. (1974) J. Biol. Chem. 249, 4057-4066
Yonetani, T., Yamamoto, H., Erman, J. E., Leigh, Jr., J. S. & Reed, G. H. (1972) J. Biol. Chem. 247, 2447-2455
Vol. 167