Embed Size (px)
Citation preview

1
Factors affecting intention to leave: In case of Customer Service
Representatives of the BPO Industry in Sri Lanka.
Research Project
By
D.G.L.R DE SILVA
BSC-UGC-MGT-1315-319
BSc in Business Management (Special) Degree
An Independent Research Report Submitted in partial fulfillment of the requirements
for the degree of BSc in Business Management (Special) Degree
National School of Business Management

2
DECLARATION
I declare that all materials included in this essay/ report/project/dissertation is the end
result of my own work and that due acknowledgement have been given in the
bibliography and references to ALL sources be they printed, electronic or personal.
Signature …………………………………. Date…………………….
D.G.L.R DE SILVA
BSC-UGC-MGT-1315-319
CERTIFICATION
This is to certify that the research report presented by D.G.L.R DE SILVA on Factors
affecting intention to leave: In case of Customer Service Representatives of the BPO
Industry in Sri Lanka can be accepted in partial fulfillment of the requirements of the
Bachelor of Science in Business Management (Special) Degree.
Signed: _______________________ Date: __________________
Research Supervisor
Dr. Prasadini Gamage

3
DEDICATION
I dedicate this work to my supervisor Dr. Prasadini Gamage and all the people who
contributed to the success of my research work.
Thank You.

4
ACKNOWLEDGEMENT
I would like to express my sincere gratitude to Dr. Prasadini Gamage, my Research
Supervisor for her guidance, support and motivation extended to me during the period
of completing the study.
I also extend an earnest thank you to Mr. D.M.A. Kulasooriya, the Dean Faculty for
Business Management of NSBM, the Course Director Ms. Thilini De Silva and as
well as the BSc academic panel for the continuous support given to me during my
period of study at the institute.
My loving appreciation goes out to my parents, without whose constant support and
encouragement, I would not have completed the study successfully.

5
ABSTRACTS
The ITES- BPO industry of Sri Lanka has immense growth potential and is currently
the fifth largest export earner for the country. However the BPO industry faces a
unique problem due to the high intention to leave among the customer service
representative category, which is identified as the “Factor’s affecting intention to
leave: of the customer service representatives of the BPO industry in Sri Lanka. This
is where the BPO industry experiences high intention rates as much as 30% within the
first 03 months of the tenure of an employee. Due to this phenomenon cost to the
company has sky rocketed to the point where the management has become oblivious
to this problem and learnt to go with the flow as they are tired of looking for a
solution. Therefore this study extensively investigates the impact on the cost to the
company due to the intention to leave among the customer service representatives in
the BPO industry. At the same time it fills a long standing gap by providing literature
on this problem area from a Sri Lankan context.
An extensive literature review was carried out with a view to understanding the
current knowledge available in the research areas and to establish the relevance of
them in developing the research question. The approach of this study is qualitative
research method, where the data collected via in-depth interviews was analyzed using
the content analysis method. Primary data was collected from a saturated sample of 34
respondents from 03 medium sized BPO companies in Sri Lanka. Findings were
derived from the analyses that lead to category formulation and modification of the
initial conceptual framework. More importantly implications were derived from these
findings and used to make recommendations to the corporate management, to the
corporate management to be implemented through the middle management and finally
the HR departments the of the BPO companies.
In conclusion, the senior management of the BPO companies needs to start facing the
harsh reality that if the recurring costs incurred due to the factors affecting intention to
leave: of the customer service representatives in the BPO industry are not controlled
there will be fast deterioration in the industry and Sri Lanka is in danger of losing its
creditability as a potential BPO hub among international outsourcing companies

6
TABLE OF CONTENTS
DECLARATION ........................................................................................................... 2
DEDICATION ............................................................................................................... 3
ACKNOWLEDGEMENT ............................................................................................. 4
ABSTRACTS ................................................................................................................ 5
TABLE OF CONTENTS ............................................................................................... 6
LIST OF FIGURES ....................................................................................................... 8
LIST OF TABLES ......................................................................................................... 9
CHAPTER 1: INTRODUCTION ............................................................................... 10
1.1 OVERVIEW....................................................................................................... 10
1.1.1 INTRODUCTION TO THE PROJECT ...................................................... 10
1.1.2 INTRODUCTION ....................................................................................... 10
1.2 RESEARCH PROBLEM ................................................................................... 11
1.3 RESEARCH QUESTIONS ................................................................................ 12
1.4 RESEARCH OBJECTIVES .............................................................................. 12
1.5 SIGNIFICANCE OF STUDY ............................................................................ 13
1.5.1 SIGNIFICANCE TO BPO INDUSTRY ..................................................... 13
1.5.2 SIGNIFICANCE TO INDIVIDUAL COMPANIES .................................. 13
1.5.3 SIGNIFICANCE OF THE ECONOMY ..................................................... 14
1.6 LIMITATIONS .................................................................................................. 15
1.7 CHAPTERIZATION ......................................................................................... 15
CHAPTER 2: LITERATURE REVIEW ..................................................................... 16
2.1 INTRODUCTION .............................................................................................. 16
2.2 WORK ENVIRONMENT OF BPO COMPANIES .......................................... 16
2.3 CULTURE OF BPO COMPANIES .................................................................. 17
2.4 ITES – BPO IN SRI LANKAN CONTEXT ...................................................... 18
2.5 INTENTION TO LEAVE .................................................................................. 19
2.5.1 INTENTION TO LEAVE IN BPO INDUSTRY ........................................ 19
2.5.2 FACTORS AFFECTING THE INTENTION TO LEAVE OF THE BPO
INDUSTRY .......................................................................................................... 20
CHAPTER 3: METHODOLOGY ............................................................................... 24
3.2 THE STUDY POPULATION AND SAMPLE ................................................. 24
3.2.1 POPULATION ............................................................................................ 24
3.2.2 SAMPLING ................................................................................................. 24
3.3 DATA COLLECTION ....................................................................................... 25

7
3.3.1 DATA COLLECTION INSTRUMENT ................................................... 25
3.3.2 PRIMARY DATA SOURCES .................................................................... 25
3.3.3 SECONDARY DATA SOURCES .............................................................. 25
3.3.4 DATA COLLECTION PLAN..................................................................... 25
3.4 CONCEPTUTAL FRAMEWORK .................................................................... 26
3.4. 1 INDEPENDENT VARIABLES ............................................................. 26
3.4.2 DEPENDENT VARIABLES ...................................................................... 27
3.5 DATA ANALYSIS ............................................................................................ 28
3.6 TIME FRAMEWORK ....................................................................................... 29
CHAPTER4: DATA PRESENTATION & ANALYSIS ............................................ 31
4.1 DATA PRESENTATION ............................................................................. 31
4.1.1 Data Presentation............................................................................................. 32
4.1.2 Questionnaire Analysis and Data Presentation ............................................... 32
4.1.3 Gender ............................................................................................................ 33
4.1.4 Age Category ................................................................................................... 33
4.1.5 Household Income .......................................................................................... 34
4.1.6 Educational qualification ................................................................................ 35
4.2 DATA ANALYSIS ............................................................................................... 40
4.2.1 CORRELATION BETWEEN PAY &INTENTION TO LEAVE ........ 40
4.2.2 CORRELATION BETWEEN STRESS & INTENTION TO LEAVE 41
4.2.3 CORRELATION BETWEEN WORKING CONDITION &
INTENTION TO LEAVE .................................................................................. 42
4.2.3 CORRELATION BETWEEN REWARDS & INTENTION TO
LEAVE ................................................................................................................ 43
5.1 INTRODUCTION .............................................................................................. 44
5.1.1 ACHIEVEMENT OF OBJECTIVES .......................................................... 44
5.2CONCLUSION ................................................................................................... 46
5.3 RECOMMENDATION ..................................................................................... 47
LIST OF REFERENCES & BIBLIOGRAPHY .......................................................... 49
APPENDIX .................................................................................................................. 50

8
LIST OF FIGURES
Figure1: Data Collection Plan……………………………………………………….25
Figure2: Conceptual Framework………………………………………………….…26
Figure 3: Data Presentation………………………………………………………….32
Figure: 4 Gender …………………………………………………………………….33
Figure 5: Age category………………………………………………………………33
Figure 6 Household Income…………………………………………………………34
Figure 7 Educational Qualification………………………………………………….35
Figure 8 Work Experience…………………………………………………………..36
Figure 9 Pay…………………………………………………………………………37
Figure 10 Stress……………………………………………………………………..38
Figure 11 Work Experience…………………………………………………………39
Figure 12 Rewards…………………………………………………………………..40
Figure 13 Scatter Diagram between Pay & Intention to Leave……………………..40
Figure 14 Scatter Diagram between Stress & Intention to Leave…………………...41
Figure 15 Scatter Diagram between Working Condition & Intention to Leave……42
Figure 16 Scatter Diagram between Rewards & Intention to Leave……………….43

9
LIST OF TABLES
Table 1: Summary of Literature Review…………………………….........................23
Table 2: List of Independent Variables and Measurement Criteria…………………27
Table 3: List of Dependent Variables and Measurement Criteria…………………..27
Table 4: Work Schedule……………………………………………………………..29
Table 5: Summary of Data collection……………………………………………….32
Table 6: Age Category………………………………………………………………33
Table 7: Household Income…………………………………………………………34
Table 8: Educational Qualification………………………………………………….35
Table 9: Work Experience…………………………………………………………..36
Table 10: Section 2 - Pay…………………………………………………………..36
Table 11: Stress……………………………………………………………………..37
Table 12: Working Condition ……………………………………………………...38
Table 13: Rewards………………………………………………………………….39

10
CHAPTER 1: INTRODUCTION
1.1 OVERVIEW
1.1.1 INTRODUCTION TO THE PROJECT
This project is mainly aimed at fulfilling the ultimate requirement to complete the
Research methodology module pertaining to our Degree program. This project is
based on research of the BPO industry problem. It is to be developed the solutions for
the problems in the work place of mine which I am engaged in.
This thesis is based on the industry research I have done and hope it will provide
sufficient insight as to what they will be dealing with. This research report contains all
the elements of a research design, and in addition presents, interprets, and evaluates
the findings of the research. It analyses the history of the industry and also contains a
situation analysis. I also found a need for research to be performed in order to identify
factors affecting intention to leave: in case of customer service representatives in the
BPO Industry. Therefore I came up with a literature search, calculating the
correlations coefficient of independent variables and finally solutions for the problems
were discussed in this report.
1.1.2 INTRODUCTION
One of the positives of globalization is the arrival of Information and Communication
Technology (ICT) and the growing success in ICT initiatives have brought the global
community closer. ICT in the Globalization context is all about global knowledge,
access, participation and governance in the information age. It has radically changed
the views about boundaries between and within organizations (Dhameja & Medury,
1997). ICT has changed the way business is done in the modern world drastically and
has helped to make “price” and “time” irrelevant. These developments have paved
way to Business Process Outsourcing (BPO). Industry has a continues work process
24/7, organizations outsource their non-core and less critical activities. But in the last
decade or so there has been a significant rise in complex activities been outsourced as
well. For instant the construction design industry has been outsourced. The service
industry benefits more from outsourcing due the non-physicality of its nature. The

11
new development to facilitate these processes in the ICT industry is called
Information Technology Enabled Services (ITES).
1.2 RESEARCH PROBLEM
Even though the employees in the BPO industry are supposed to have a work
environment that is conducive to their life styles and expectations, this industry has a
very high intention to leave, where the average tenure of a Customer Service
Representative (CSR) employee’s is 03 months. This phenomenon is called the “Case
of Intention to leave”.
The BPO industry has provisions for cost due to anticipated intention to leave. BPO’s
have an expected average intention to leave of about 12% in the initial months but in
reality they experience an intention to leave rate of up to 30%. There is no accurate
provisions for the aftermath due to this intention to leave phenomenon that could be
due to various obvious and hidden factors. On the other hand the intention to leave; in
case of CSR in the BPO industry is quite significant and has a negative impact on the
productivity and overall profitability. As an employee who has worked in the BPO
industry, the researcher has studied that there are two main areas of intention to leave;
in case of CSR’s.
1. Hard Cost: e.g. Salary, stress, working conditions, rewarding etc.
2. Soft costs: e.g. Efficiency loss, vendor credibility loss, loss of tacit knowledge
etc.
Soft costs are difficult to quantify and will never appear on a balance sheet or income
statement but have a huge effect on the BPO industry Bottom line. Efficiency loss is
the cost of decreasing productivity due to turnover. It takes an average 08 weeks to
recruit a replacement employee. Due to this, productivity gets affected adversely and
other employees will fill the gap until the replacement arrives. But even after the new
employee is hired they have to go through training and then a learning curve. There is
strict monitoring of key performance Indicators (KPI) by the client, unfortunately
when there is high intention to leave the BPO Company cannot deliver the agreed
service levels. Since key processes are been outsourced the loss of performance by the
vendor can even be penalized by the client company. At the same time if client loses
confidence they have the provision to stop the outsourced work. The probability is

12
that client will never work with the same vendor and negative word of mouth will
spread in the industry regarding the BPO industry. Also, a client can form close ties
with employees whom they trust and rely on them and not so much the BPO industry
as well. And if those employees leave the client will lose the ties they had with the
company. These contribute to the cost due to vendor credibility loss.
Therefore this research is focused on the factors affecting intention to leave in case of;
Customer Service Representatives in the BPO industry.
1.3 RESEARCH QUESTIONS
What is the relationship between pay and intention to leave?
What is the relationship between stress and intention to leave?
What is the relationship between working conditions and intention to leave?
What is the relationship between rewarding and intention to leave?
1.4 RESEARCH OBJECTIVES
To identify relationship between pay and intention to leave.
To identify factors affecting stress and intention to leave.
To identify satisfaction over working conditions and intention to leave.
To identify rewards to be presented to employees and intention to leave.

13
1.5 SIGNIFICANCE OF STUDY
1.5.1 SIGNIFICANCE TO BPO INDUSTRY
This study will be important to the BPO industry in Sri Lanka, as it will provide one
of the few literatures, if not the few in relation to the intention to leave phenomenon
currently existing in the BPO companies. Therefore it is crucial for Sri Lanka’s BPO’s
to minimize costs and maximize profitability to sustain in the globally competitive
BPO industry, where large Asian players such as India and China dominate. But the
heavy impact on Cost to the Company due to the intention to leave among the CSR’s
is dragging the growth of the industry. At the same time Sri Lankan BPO industry is
finding it difficult to attract profitable and viable outsourced projects from foreign
clients due to vendor credibility has caused by the intention to leave. The study
discusses how to avoid this situation by handling the intention to leave issue. It also
gives a clear message to the stakeholders of the BPO industry that they need to look
in-depth into the problem and start to rectify it by among themselves as well as
pushing the government body, ICTA to attain sustainable and practical solutions.
Even ICTA, the strategy formulating body for ICT in Sri Lanka can take note of this
study to develop more effective ICT policies in the future.
1.5.2 SIGNIFICANCE TO INDIVIDUAL COMPANIES
The study is significant to the individual BPO companies as the outcome provides
new insight to the real cost to the company due to the intention to leave problem.
Though the management is aware of the ongoing problem up to now they have not
studied the costs in detail, mainly the soft costs as it’s difficult to quantify and since
it’s a time consuming exercise. Therefore the study offers guidance to the
Management on how to start this process of ascertaining the actual costs incurred due
to the intention to leave of CSR’s. Another reason why this study should be done is
because it identifies in detail the outcome of the intention to leave. Somewhat
obvious, and more interestingly a lot of hidden reasons for the premature departure of
the CSR’s are uncovered and the management will be able to use these to look at the

14
shortcomings of the HRM and operation processes. The study will clearly help the
management in its future HR strategy formulation exercise as well.
1.5.3 SIGNIFICANCE OF THE ECONOMY
The BPO sector is one of the fast growing industries in Sri Lanka and its potential is
even more due to the stable political condition prevailing in the country after the end
of the civil war. To achieve anticipated growth more investment is required and more
focus is needed on the BPO companies’ core processes. ICTA anticipates a double
growth of the industry within the next 05 years and to support this jobs are expected
to grow equally. Unfortunately with the high turnover among CSR’s, this kind of high
growth in the industry can create chaos as the BPO companies cannot stop the
intention to leave phenomenon with the current strategies and processes. Therefore
the study offers important insight on the corrective measures that can be taken to
prevent the high intention to leave cases of CSR’s and in turn to make the industry
profitable and globally competitive. In other words the outcomes of the study will
tremendously assist the economy of Sri Lanka to grow where the BPO industry can
become one of the biggest export earners for Sri Lanka.
1.5.4 Contribution to knowledge
The study will be of importance to the researcher, who works closely with the BPO
industry and with call centers of local conglomerates on a consultancy basis. Future
researchers will also benefit from this study since it can be used as a guide or a base in
developing their own studies. Also the knowledge derived from the study can benefit
to enhance the knowledge of various interested groups including students, teachers,
employees of BPO companies and even management in other services industries that
faces intention to leave issues.

15
1.6 LIMITATIONS
Financial data of the industry can only be revealed up to a certain extent due to the
rules of the organizations. Time limitation will be exceedingly put pressure on the
researcher to complete the research in due time. When conducting interviews with the
03 BPO Companies, the information might not be accurate since they will be
defending their organization in the first place.
1.7 CHAPTERIZATION
In this report Chapter1 would be the introduction in which the background of the
study, research problem, research question, objective, significance and limitations are
discussed. The following Chapter, Chapter2; Literature Review will define and bring
clarity to the subject area of this research study. Furthermore, it will help to identify
the conceptual frame work of this study. The next Chapter, Chapter3, is the
conceptual framework, which will summarize the relationship between the
independent and dependent variables identified through the literature review of this
study. Chapter 4 will discuss the analysis and findings. The following chapter,
Chapter5 will be the discussion, conclusion & recommendation.
16
CHAPTER 2: LITERATURE REVIEW
2.1 INTRODUCTION
Literature that’s relevant to the research problem is discussed below, with a view to
understanding the current knowledge and to establish the relevance of them in
developing the research question.
2.2 WORK ENVIRONMENT OF BPO COMPANIES
Grebner et al . , (2003) says that BPOs represent a new form of work organizations,
which is often designed “from scratch” and adds that employees in these companies
carry out that are rather specialized and often simplified. Therefore Gebner et al . ,
(2003) concludes that simplified tasks do not require specialized personnel and it
requires effectively short period of training, and therefore the downside of such jobs
comes with routine work, low task complexity and consequential low utilization of
qualification. (Knowledge, skills and abilities).
Budtwar et al. , (2006), identifies two common features of the work environment of
BPO companies.
1. Highly monitored and controlled by Management; the work environment is
highly controlled and performance is closely monitored and strictly measured
against targets through employees are encouraged to take responsibility for
both their team and their own performance.
2. Consists of semi-professional empowered workers who work in a positive
environment.
Further literature states that outsourcing work environment leads to emotional
exhaustion ( Bakker et al., 2003), less affective commitment (Grebner et al . , 2003),
more resigned attitude towards the job and higher intention to quit (Messersmith
2007; Holman et al., 2002; Slaughter et al. , 2007).
Wickramasinghe & Kumara (2010), says that training in BPOs, it includes induction
and continuous regular training to provide quality service. All employees irrespective
of their gender, the level of education, marital status and tenure are subject to similar
training experience.
Despite the large number of people entering the labour force every year there is a
dissatisfaction with the supply of skilled personnel to the BPO industry, who are low

17
on quality and relevance. (LIRNEasia, 2006; Raman et al., 2007). Further, Raman et
al, (2007) states that, because of shortages, the hiring of new talent has become more
expensive, due to high attrition rates in the sector training and replacement is
becoming a critical problem.
A key problem in BPO organizations has been attracting and retaining high quality
employees. (Heskett et al., 2008). BPO industry faces issues such as increasing
employee intention to leave, stressful work environment and poor career
development. (Robinson & Morley, 2006).
2.3 CULTURE OF BPO COMPANIES
www.scribid.com (2008), says this glamorous industry involves a lot of hard work
and specialized skills to deal with all kind of customers and therefore the culture of a
BPO has the below elements:
i. Energetic setting: BPOs have a vibrant environment. Generally the
interiors are also done up in a way that it makes people feel nice and
energetic.
ii. 24X7 work environment: BPOs have a round the clock working culture
and people work in day and night shifts.
iii. Perfect amalgamation: The work culture is a blend of professionalism
and friendliness. BPOs create a friendly working atmosphere so that the
employees don’t feel suffocated.
iv. Rejuvenation channels: Entertaining events are organized at regular
intervals so that the employees are relived and invigorated to take the
challenges head on. They have gym, sports and café facilities as well.
But on the flip side, Kumar (2008) says, the fast and competitiveness BPO has led the
unconscious mind of youth to go for anything available in the market, be it the fast
food culture, west dress code, pop music or to say electronic goods in the hands. The
saving tendency has declined to so-called emerging middle class. This is primarily
because of the ‘floating money culture’, which says, “Enjoy the life at its fullest”.
18
2.4 ITES – BPO IN SRI LANKAN CONTEXT
The only available study to analyze the BPO industry of Sri Lanka is “ Baseline sector
analysis of the BPO industry in Sri Lanka”, conducted by LIRNEasia (2006) states, a
BPO receiver as the act of outsourcing to a third party the responsibility of running a
business process that would otherwise be conducted internally. The receiver of the
outsource process administers the process based on a defined and measurable
performance matrix.
Flexible employment contracts are extremely rare in the industry as there are enough
personnel available to work fulltime. (Wickramasinghe & Kumara, 2010). As per
LIRNEasia (2006) and ICTA (2007), employment prospects are opening in the sector,
there are difficulties in attracting and retaining suitable personnel.
LIRNEasia (2006), state that from a Sri Lankan context, employees quit jobs due to
working time and work-life balance-related issues. Many BPOs operate during
unconventional working hours to provide real time service to different time zones.
(LIRNEasia, 2006). Therefore this causes negative impact on the work-life balance of
CSRs.
As per Wickramasinghe & Kumara (2010), challenges faced by the employees in the
BPO industry of Sri Lanka are as follows.
1. Marital status has a significant effect on working hours. “Grave yard” shifts
are perceived unfavorable by spouses and families of employees.
2. The geographical location and therefore the vast time differences between Sri
Lanka and Western clients gives way to erratic working hours. This makes
normal socialization difficult, leading to alienation and identity crisis.
3. Tenure has a significant main effect to perceived task autonomy. Longer
service translates opportunities for independence and freedom doing their
work.
Wickramasinghe & Kumara (2009), states that job posting is rated as the most
frequently used method of recruitment followed by advertising. Selection interview

19
rates as the most frequently used method of selection and learning from feedback
given by superiors was rated as the most frequent method of training and development
in a BPO company.
2.5 INTENTION TO LEAVE
As per Mathis & Jackson (2003), employee intention to leave is the process in which
employees leave the organization and have to be replaced. Labour intention to leave is
the rotation of workers around the market; between firms, jobs and occupations; and
between the states of employment and unemployment (Abassi et al. , 2000). Shaw at
al. (1998), states that voluntary turnover reflects an employee’s decision to leave. This
could be categorized as functional intention to leave which is the situation when a
poorly performing employee leaves the organization (voluntarily or involuntarily)
(Abelsin & Baysinger, 1994). Phillis & Connell (2003), identifies most intention to
leave as controllable by the organization. High rates of attrition can destabilize an
organization and de-motivate those who attempt to maintain levels of service and
output. (CIPD, 2011)
2.5.1 INTENTION TO LEAVE IN BPO INDUSTRY
Industry sources claim that attrition levels in the BPOs are sky-high, and any given
firm could be looking at an entirely new set of employees every 03 to 10 months
(Sangameshwaran & Rai, 2005). From an ITES - BPO industry context, Barrick &
Zimmerman (2009), says that the people intensive nature of the industry also poses
challenges in retaining suitable personnel. At the same time Walsh and Deery (2006),
suggests that BPO companies generally lack organizational resources that underpin
the operation of an internal labor market and provision off sustainable long-term
employment relationships. Another finding is that Companies involved in outsourced
work engage in tighter forms of supervision and labor control control to maximize the
short-term output or targets to be achieved (Rees & Fielder, 1992; Walsh & Deery,
2006).
Employees in the call centers stay with their employers for only three months 9Batt,
et al . , 2005), while another say eight months (Taylor and Bain, 2005). Of course, an
average stay of three months is expensive because it is about the time workers become

20
proficient with their job. (Ofreno et al, 2007) Because of the high dropout rates, hiring
and job induction training have become continuous.
As per Sadhwat et al ., (2010), high turnover in the BPO industry can be divided into
02 categories: Push and Pull factors.
1. Push factors: Stressful work environment, monotonous work, long commutes,
lack of control at work, daily physical confinement, over-regimentation, odd
work hours and abusive clients.
2. Pull factors : A good job market, good pay, world class working conditions
and knowing someone who works in the industry.
2.5.2 FACTORS AFFECTING THE INTENTION TO LEAVE OF THE BPO
INDUSTRY
1. Pay
The management is of the view that they pay CSRs a basic salary in line with industry
norm. The basic salary that is given is the industry standard. It is between Rs.
12,000/= to Rs. 15000/=. Manager’s in the industry don’t underpay our CSRs as this
will be demoralizing to them”. The HR Managers and some CEOs are of the view that
the salary they get without any qualification is good enough. He said “For a CSR who
is usually a school leaver, the salary they earn is far better than if they join any other
industry as a beginner who doesn’t have full qualifications.
However CSRs are dissatisfied with their basic salary and therefore they contemplate
looking for other jobs. The basic salary is not enough since it is sufficient at least
cover the basic costs I incur. I should get paid more due to the erratic working hours
comparing to a job with normal working hours. Industry sources reveal that annual
salary increments are not significant at all, it is between Rs. 1000/= to Rs. 3000/= and
this is below par comparing to similar level jobs in other industries”. The basic salary
is not at all satisfactory and cannot save anything from it and the only reason we are
staying back is because of the studies we do during morning hours.
The perceived inadequacy of the basic salary pushes the CSRs to leave their jobs,
even though the management is of the opinion that they are paid sufficiently.

21
Target based incentives
The targets are set based on the service levels given to us by the end client. This is
what they expect the CSRs to achieve. Of course it is not easy but the target based
commission structure is quite effective. Once a CSR has completed the learning curve
it is easy to earn a good commission.
One inside source was quoted telling that these youngsters who want to everything in
cash. Therefore sometimes giving intangible rewards or even EPF/ETF (Contribution
to provident fund and trust fund for employees) is not important to them. We should
re-design the entire rewards package so most of the benefits will be paid out in “Hard
cash”. Can introduce attendance bonus, loyalty bonus, and referral allowances to keep
the CSRs motivated and these will be appealing to them and will be more effective”.
Contrary to the view of the management, CSRs do not perceive the TBIs as attractive
to retain them, primarily because one has to work 6-12 months to acquire expertise to
achieve these targets.
2. Stress
Mosadeghrad (2012), Finds that job stress is a serious threat to the quality of working
life(QWL) and can cause hostility, aggression, absenteeism, and intention to leave, as
well as reduced productivity. Mosadeghrad (2012), also states major sources of stress
to be inadequate pay, inequality at work, too much work, staff shortage, lack of
recognition and promotion prospects, time pressure, lack of job security and lack of
job security and lack of management support. Another factor that affects intention to
leave is stress that is the worker’s perceived tension regarding a specific job
9Goolsby, 1992). Stress has been found to have dysfunctional effects for both non-
sales employees (Fisher & Gitelson 1983) and salespeople (Comer & Dubinsky
1985). Further, Jones et al. (1996) says that research tends to confirm the association
between role conflict, role ambiguity, job anxiety and job satisfaction lending to
intention to leave.
3. Working Condition
Quality of work life is selected since literature reviewed (Mottaz, 1985; Kohli, 1985
Byrne, 2005) indicated its impact on the research question and from what the
researcher has come to know from own experience in the BPO industry. Also

22
preliminary inquiries helped to surface QWL as a possible cause. The erractic long
working hours with significant overtime has an adverse effect on the QWL of the
CSRs.
Extrinsic social rewards such as friendly and supportive relationships with co-workers
and supervisors emerge a fairly powerful predictor of job satisfaction and influences
intention to leave (Mottaz, 1985). Greater amount of consideration, feedback, closer
supervision (Comer et al, 1989) and contingent approving behavior (Kohli 1985) are
linked to job satisfaction.
Byrne (2005), stated that the search for work-life balance is a process in which people
seek to change things in accordance with changes in their own priorities, physical,
psychological or both, and these can be triggered in their turn by factors such as: age;
changes in working conditions; the demands of new technology; and poor
management. Employees benefit through: having a greater responsibility and a sense
of ownership; having better relations with management; avoiding bringing problems
at home to work, and vice versa; having the time to focus more on life outside work;
and having greater control of their working lives.
4. Rewards
Monetary and non-monetary rewards play a key role in the decision for a CSR to
leave the company. Therefore rewards is selected as it emerged as a cause that has a
major impact on the research question during the preliminary investigation by the
researcher as well as the importance that’s given to it in the relevant literature that
was reviewed (Hom & Griffeth, 1995; Leonard, 1987; Galizzi & Lang, 1998).
Similarly rewards, that includes salary, overtime pay, performance based monetary
and non-monetary rewards etc. plays a role in employees’ loyalty towards the
company and employee intention to leave. Hom & Griffeth (1995), says that superior
remuneration promotes intention to leave by increasing job satisfaction or reducing
intention to leave costs.

23
Table 1: Summary of Literature Review
INDEPENTDENT
VARIABLES
AUTHORS
1. Pay Pay Dissatisfaction and Intention to
Leave. Gerrit J. M. Treuren1,* and
Elizabeth Frankish2. 6 AUG 2014
2. Stress job stress, job satisfaction and intention
to leave
among new nurses, Jessica Zara
Peterson, 2009
3. Working Condition Impact of Organizational Culture on
Turnover Intentions in BPO Sector.
Dwivedi, Sulakshna; Kaushik, Sanjay;
Luxmi, Vol. 48, No. 4 , April 2013
4. Rewards A study on the Employee Turnover
intention in ITES/BPO sector,
K.R. Sreerekha
Dr. T.J.Kamalanabhan, ISSN: 2231 –
6779 / July – Dec 2012

24
CHAPTER 3: METHODOLOGY
3.1 INTRODUCTION
In this chapter the research methodology used in the study is described. The
geographical area where the study was conducted, the study design and the population
and sample are described. The instrument used to collect the data, including methods
implemented to maintain validity and reliability of the instrument are described.
3.2 THE STUDY POPULATION AND SAMPLE
3.2.1 POPULATION
Primary Data was collected from a saturated sample of 34 respondents from 03
medium sized BPO companies in Sri Lanka. This consists of 34 Customer Service
Representatives who have left the BPO industry under 09 months of joining the BPO
Company.
3.2.2 SAMPLING
Judgmental, purposive sampling will be used since it is necessary to obtain
information from a specific target group, who can provide the desired information.
Primary Data was collected from a saturated sample of 34 respondents from 03
medium sized BPO companies in Sri Lanka.

25
3.3 DATA COLLECTION
3.3.1 DATA COLLECTION INSTRUMENT
1. Structured Interview
3.3.2 PRIMARY DATA SOURCES
Primary Data was collected from a saturated sample of 34 respondents from 03
medium sized BPO companies in Sri Lanka. This consists of 34 Customer Service
Representatives who have left the BPO industry under 09 months of joining the BPO
Company.
3.3.3 SECONDARY DATA SOURCES
This refers to data which already exists. Therefore the researcher reviewed records
related to the study which enabled him to compile and analyses the data from internet,
newsletters, and journals.
The researcher has collected secondary data mainly from the internet.
3.3.4 DATA COLLECTION PLAN
Figure 1: Data Collection Plan
Interview with CSR
Internet & journals.
Interview with CSR Internet & journals.
Primary Data Secondary Data
Qualitative
Data
Quantitative
Data

26
3.4 CONCEPTUTAL FRAMEWORK
Independent variables (x) Dependent variable (y)
Figure 2: Conceptual Framework
To do my research I have selected these independent variables to analyze the
correlation and coefficient of the variables. Because I would be able to access data,
convince & availability of the data.
3.4.1 INDEPENDENT VARIABLES
Independent
Variables
Definition Measurement
Likert Scale
Pay Each CSR’s
monthly
earnings and
family
income
Value of the salary
scale by Assigning a Likert Scale
1 - < 30,000 2 – 30,0001.00 – 50,000.00 3 – 50,001.00 - 75,000.00 4 – 75,001.00 – 100,000 5 – 101,000.00 >
Stress Regarding
the workload
each CSR
has to face.
According to the
workload Assigning a Likert Scale
1 – SD 2 – DA 3 – Neutral 4 – Agree 5 – Strongly Agree
Pay
Stress
Working Conditions
Rewards
Intention to leave

27
Working
Condition
Regarding
hazardous
working
conditions
and general
environment.
According to the
satisfaction
Assigning a Likert
Scale
1 – SD
2 – DA 3 – Neutral 4 – Agree 5 – Strongly Agree
Rewards
Regarding
whether the
employees
are properly
taken care
of.
According to their
preference whether
the employees are
properly taken care of
Assigning a Likert Scale
1 – SD 2 – DA 3 – Neutral 4 – Agree 5 – Strongly Agree
Table 2: List of Independent Variables and Measurement Criteria
3.4.2 DEPENDENT VARIABLES
Dependent variable Definition Measurement
Intention to Leave
Employees deciding to change
work places.
Through an
questionnaire
determining where
these employees are
currently positioned at.
Table 3: List of Dependent Variables and Measurement Criteria

28
3.5 DATA ANALYSIS
After the data was collected it was organized and analyzed. For analysis of data
Microsoft excel 2010 was used to test the independent variables through finding
correlation between the dependent variable. To do this analysis the below mentioned
equation is used.
Equation
x = 1st score
y = 2nd score
∑xy = sum of the product of 1st and 2nd scores
∑x = sum of 1st scores
∑y = sum of 2nd scores
∑x² = sum of square 1st scores
∑y² = sum of square of 2nd scores
n = number of values or elements
Correlation Coefficient (r)
Measures the direction and the strength of a linear relationship between two
variables. Correlation is always between -1 and +1. Data was analyzed by using
descriptive statistics. Scatter Diagrams were drawn and from these the data was
presented.

29
3.6 TIME FRAMEWORK
ACTIVITY FEB
MAR
APRIL
MAY JUNE
JULY
AUG
SEPT
OCT
1 2 3 4 1 2 3 4 1 2 3 4 1 2 3 4 1 2 3 4 1 2 3 4 1 2 3 4 1 2 3 4 1 2 3 4
Selecting a
Research
Topic
Draft
Proposal is
Made
Getting the
Approval
Handover
the proposal
Supervisor
Allocated
Make
Relevant
Arrangemen
t With the
Supervisor
Relevant
Data
Collection
Will Be
Done
Meeting the
Supervisor
to Discuss
The
Outgoing
Status
Draft
Research is
Made

30
Table 4: Work Schedule
Mid
Presentation
Getting the
Approvals
Final
Presentation
Final
Research is
Made
&Submitted

31
CHAPTER4: DATA PRESENTATION & ANALYSIS
4.1 DATA PRESENTATION
All the data that was collected sourced mainly through primary sources where data
was collected from the company interviews, were conducted with CSRs to gather
certain information.
The data about pay, stress, working condition and rewards was collected as a record
for the year 2014. Information that was collected from the CSRs through an interview
required for this analysis. Those data are shown in table 5.
Questionnaire
Number
Independent Variables Dependent
Variable
Pay
X1
Stress
X2
Working
Conditions
X3
Rewards
X4
Intention
to leave
Y
1 1.2 2.6 2.6 2.6 2.25
2 0.6 3.6 2.4 2 2.15
3 2.4 1.8 1.6 1.6 1.85
4 2 1.4 1.2 2 1.65
5 2 1.6 1.6 1.8 1.75
6 2.2 2 1.6 2.2 2
7 2.2 1.6 1.4 2.2 1.85
8 2.4 2.4 2 2 2.2
9 2 2 2 2 2
10 1.8 1.6 1.4 2 1.7
11 3 3 1 3 2.5
12 2.2 1.4 1.4 2 1.75
13 3 3 2.2 3 2.8
14 1.8 2 1.6 1.6 1.75
15 2.6 2 1.6 1.6 1.95
16 1.8 2 1.8 2.2 1.95
17 1.8 2.2 1.8 1.8 1.9
18 2 1.8 1.6 2 1.85
19 2.6 1.8 1.4 2.4 2.05
20 2 1.8 1.2 2 1.75
21 1.4 2 2 1.6 1.75
22 1.6 2.2 1.8 1.8 1.85
23 2 1.4 2 2.2 1.9

32
24 0.8 2.8 2.2 2 1.95
25 2.6 1.6 1.2 1.8 1.8
26 0.6 2.2 1.4 2.2 1.6
27 1.8 2 1.2 2.2 1.8
28 2.4 2 1.8 1.8 2
29 2.2 2.4 2.2 2.4 2.3
30 2.2 1 1.6 2.2 1.75
31 2 1.2 1.2 2.2 1.65
32 1.6 2.4 1.4 1.8 1.8
33 1.2 2.2 2.4 1.8 1.9
34 2.4 2.8 2 1.8 2.25 Table5: Summary of Data Collection
4.1.1 Data Presentation
Figure 3 – Data Presentation
4.1.2 Questionnaire Analysis and Data Presentation
Questionnaire analysis consists of two sections. The first section consists of the
sample profile of the respondents where demographic variables are presented. The
second part consists of the quantitative analysis where the findings are analyzed using
various statistical tools and the analysis of the data gathered through open ended
questions using qualitative approaches.
Questionnaire…0
20
40
1 3 5 7 9 11 13 15 17 19 21 23 25 27 29 31 33
Questionnaire Number
Independent Variables PayX1
Independent Variables StressX2
Independent Variables Working ConditionsX3
Independent Variables RewardsX4

33
4.1.3 Gender
Figure 4 - Gender As depicted in the pie chart distribution, gender for the sample consists of 59% males
and 41% females which also indicate the equal representation of women in the
sector.
4.1.4 Age Category
Table 6 - Age Category
Figure 4 - Age category
59%41%
Male
Female
41%
47%
12%18 – 25
26-30
31-40
41-50
51-60
61-70
Age Category
18 – 25 14
26-30 16
31-40 4
41-50
51-60
61-70

34
The majority respondents are between 18-25, with a share of 47%. 41% of the
respondents are between 26-30, and only 12% respondents are between 31- 40.
4.1.5 Household Income
Table 7 - Household Income
Figure 6 - Household Income
The biggest slice of the pie chart represents the number of respondents with a
household income less than Rs. 30,000 which amounts to 46% of the total
respondents. This is closely followed by Rs. 30,000 to Rs. 50,000 income category
with a share of 31%. 17% of the respondents are in the Rs. 50,001 to Rs. 75, 000 and
below income category and only 6% in the Rs. 75,000 to Rs. 100,001 and above
income category.
46%
31%
17%6%
Less than Rs. 30,000
Rs. 30,001 to Rs.50,000
Rs. 50,001 to Rs.75,000
Rs. 75,001 to Rs.100,000
Above Rs. 100,001
Less than
Rs.
30,000
Rs. 30,001 to
Rs. 50,000
Rs. 50,001
to Rs.
75,000
Rs. 75,001 to
Rs. 100,000
Above
Rs.
100,001
16 11 6 2
35
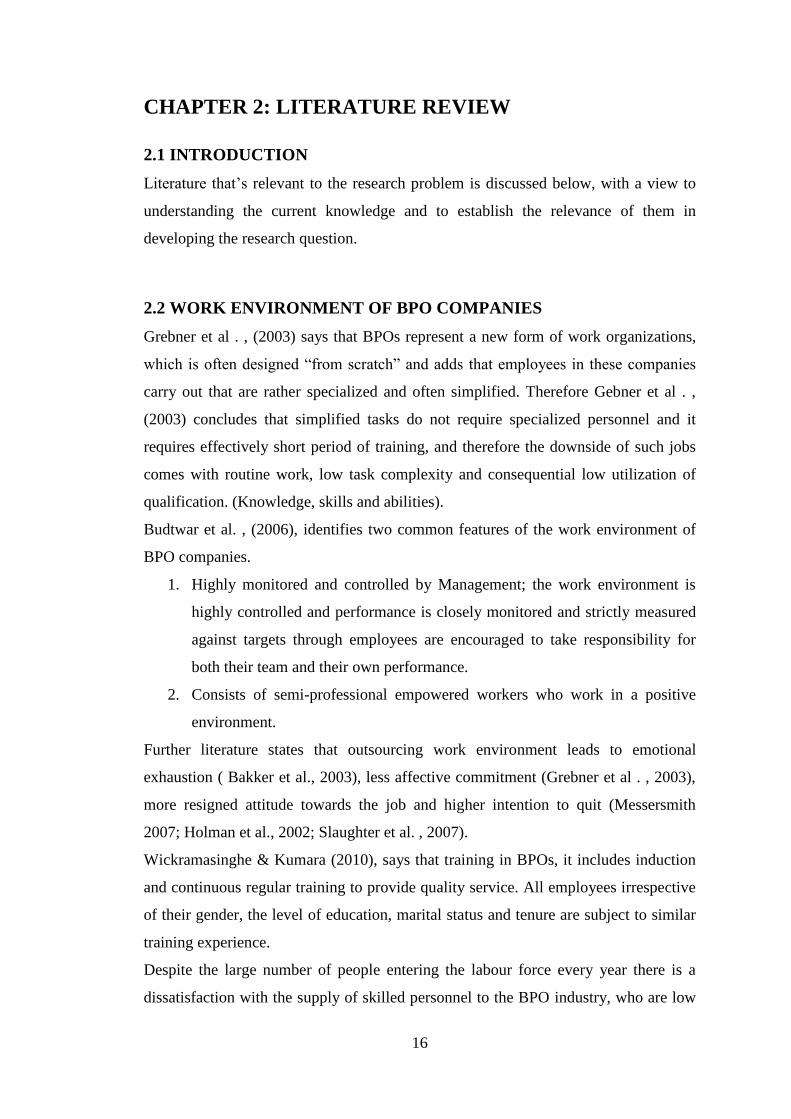
4.1.6 Educational qualification
Table 8 - Educational Level Figure 7 - Educational Level
Majority of the respondents are with degree qualifications with a share of 54%. 20%
of the respondents are with secondary educational qualifications. 17% and 9% are
respectively from Courses and Diploma’s.
4.1.7 Work Experience Table 9 -Work Experience
Less than 2
years 13
3-5 years 16
6 – 10 years 6
11 – 20 years
More than 20
years
9%17%
20%54%
Educational Level
O/L
A/L
Courses
Diploma
Higher Diploma
Degree
Qualification Status
O/L
A/L
Courses 3
Diploma 6
Higher
Diploma 7
Degree 19
MBA/MSc
36
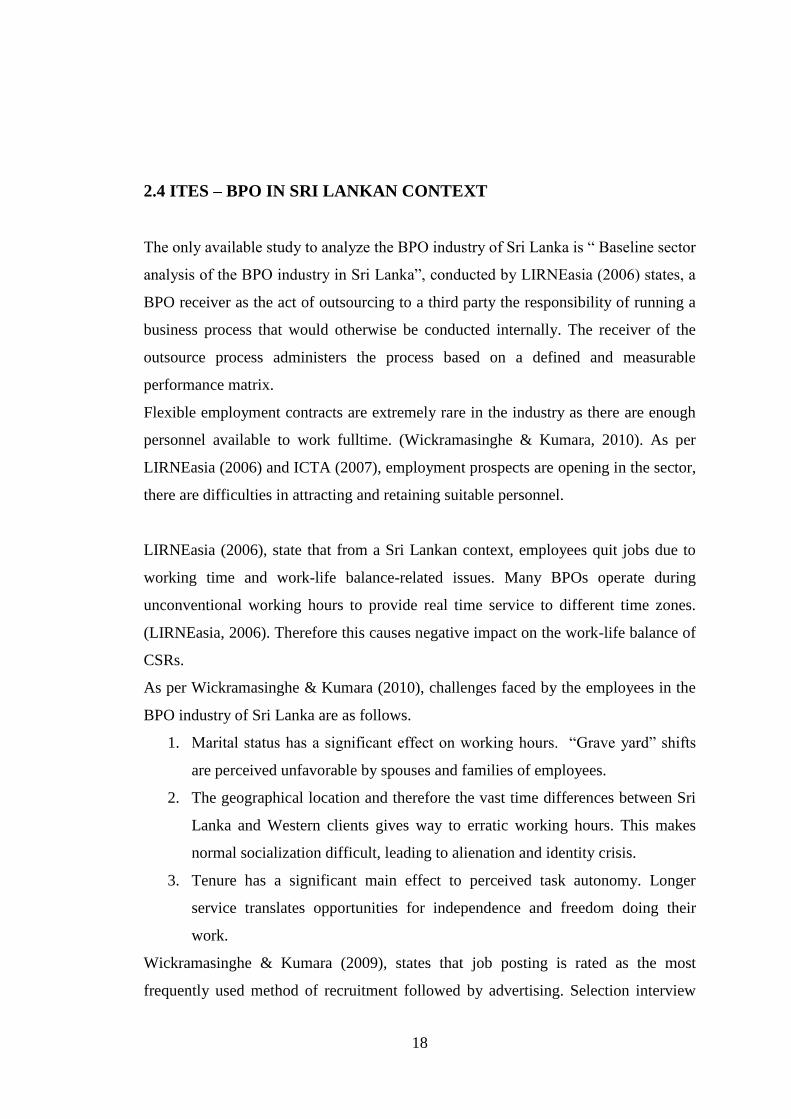
Figure 8 - Work Experience
Majority of the respondents have 3 to 5 years experience while less than 2 years
amount to 37% and 6 years to 10 years amount to 17%.
Section 2 - Table 10 – Pay in the Industry
Pay in the
industry
Strongly
Disagree Disagree Neutral Agree
Strongly
agree
6. The wage
rates that are
provided are
comparatively
high compared
to other
industries.
3 1 15 10 5
7. The level of
benefits
(bonuses/perks,
leisure holidays,)
are satisfactory
in the industry.
3 5 13 9 4
8. Many people
are aware of the
opportunities
provided by the
industry
5
5
4 16 4
37%
46%
17%
Less than 2years
3-5 years
6 – 10 years
11 – 20 years
More than 20years

37
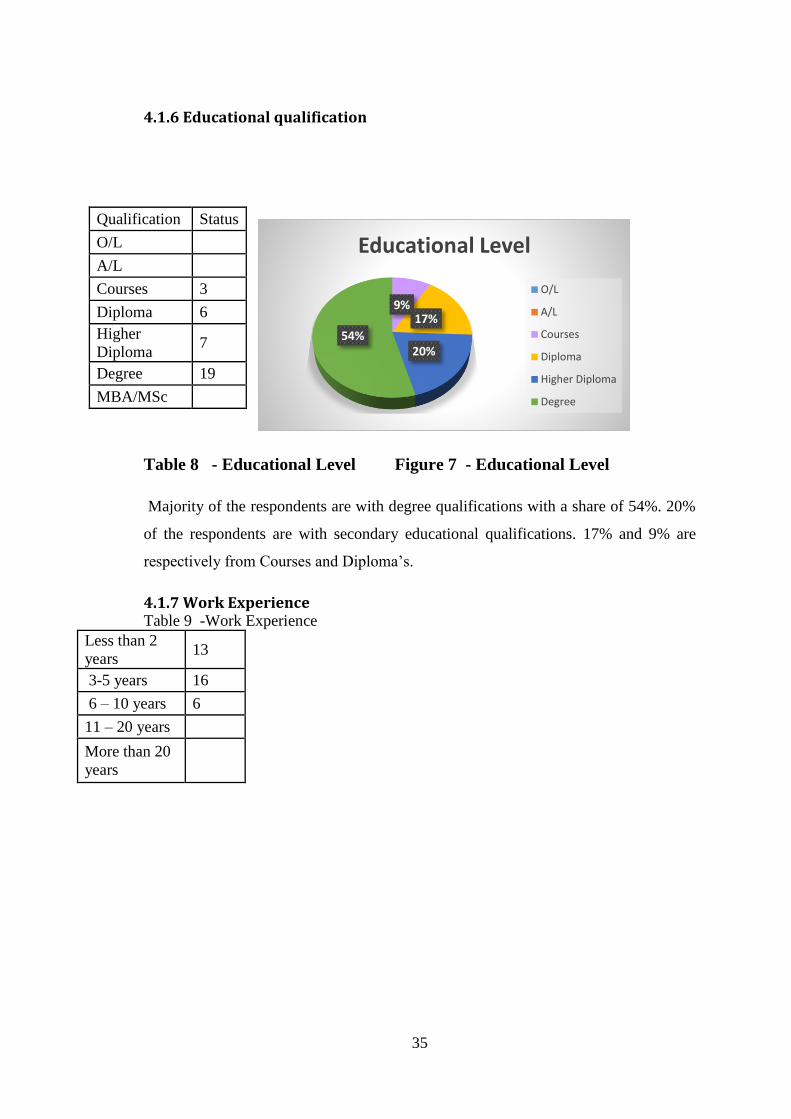
Figure 9- Pay in the Industry Table 11 - Stress
Stress Strongly
Disagree Disagree Neutral Agree
Strongly
agree
9. Service
positions do
not have a
positive image
and it could be
viewed as
demanding to
serve.
1 2 3 4 5
10. There are
stressful
working
conditions in
the industry.
2 2 7 19 4
11. For certain
positions there
is little or no
job security.
5 3 12 11 3
3
1
15
10
5
3
5
13
9
4
5 5
4
16
4
S T R O N G L Y D I S A G R E E
D I S A G R E E N E U T R A L A G R E E S T R O N G L Y A G R E E
PAY
6. The wage rates that are provided are comparatively high compared to other industries.
7. The level of benefits (bonuses/perks, leisure holidays,) are satisfactory in the industry.
8. Many people are aware of the opportunities provided by the industry

38
Figure 10 - Stress
Table 12 – Working Condition
Working
Conditions
Strongly
Disagree Disagree Neutral Agree
Strongly
agree
12. There are
favorable physical
working
environments in
the industry.
1 2 3 4 5
13. Facilities
provided are not
satisfactory
7 12 7 6 2
15. There is a
supportive culture
in the industry
where anyone
under any age
category can work
together.
1 11 12 10
1 2 3 4 5
2 2
7
19
45
3
12
11
3
S T R O N G L Y D I S A G R E E
D I S A G R E E N E U T R A L A G R E E S T R O N G L Y A G R E E
STRESS
9. Service positions do not have a positive image and it could be viewed asdemanding to serve.
10. There are stressful working conditions in the industry.
11. For certain positions there is little or no job security.

39
Figure 11 - Working Condition Table 13 - Rewards
Rewarding Strongly
Disagree Disagree Neutral Agree
Strongly
agree
24. Jobs
occupied by
local people are
at a lower level
of the hierarchy
while more
prestigious jobs
are given to
foreigners or
more urbanized
nationals.
6 13 11 4
25. The quality
of rewarding
programs are
satisfactory.
4 15 13 2
27. Rewarding
are tailored to
suit the careers
in the BPO
industry.
3 21 10
1
2
3
4
5
7
12
7
6
2
1
11 1
2
10
S T R O N G L Y D I S A G R E E
D I S A G R E E N E U T R A L A G R E E S T R O N G L Y A G R E E
WORKING CONDITION
12. There are favorable physical working environments in the industry.
13. Facilities provided are not satisfactory
15. There is a supportive culture in the industry where anyone under any age category canwork together.

40
Figure 12 - Rewards
4.2 DATA ANALYSIS
4.2.1 CORRELATION BETWEEN PAY &INTENTION TO LEAVE
Figure: 13 Scatter Diagram between Pay & Intention to Leave
CORRELATION 0.381834
There is a weak positive correlation relationship between pay (x1) and
intention to leave (y).
6
13
11
44
15
13
23
21
10
S T R O N G L Y D I S A G R E E
D I S A G R E E N E U T R A L A G R E E S T R O N G L Y A G R E E
REWARDS
24. Jobs occupied by local people are at a lower level of the hierarchy while more prestigiousjobs are given to foreigners or more urbanized nationals.
25. The quality of rewarding programs are satisfactory.
27. Rewarding are tailored to suit the careers in the BPO industry.
0
0.5
1
1.5
2
2.5
3
0 0.5 1 1.5 2 2.5 3 3.5
Inte
nti
on
to L
eave
-(Y
)
Pay - (X1)

41
As figure 3 illustrated above the correlation between the pay and intention to leave is
0.381834. There is a weak positive correlation relationship between the pay(X1) and
intention to leave (Y) which means when the pay decreases the intention to leave will
increase.
4.2.2 CORRELATION BETWEEN STRESS & INTENTION TO LEAVE
Figure: 14 Scatter Diagram between Stress & Intention to Leave
CORRELATION 0.724937
There is a strong positive correlation relationship between stress (x2) and intention to
leave (y).
As figure 4 illustrated above the correlation between the stress and intention to leave
is 0.724937. There is a strong positive correlation relationship between the stress (X2)
and intention to leave (Y) which means when the stress increases the intention to
leave will increase.
0
0.5
1
1.5
2
2.5
3
0 0.5 1 1.5 2 2.5 3 3.5 4
Inte
nti
on
to L
eave
-(Y
)
Stress - (X2)

42
4.2.3 CORRELATION BETWEEN WORKING CONDITION & INTENTION
TO LEAVE
Figure: 15 Scatter Diagram between Working Condition & Intention to Leave
There is a weak positive correlation relationship between working conditions (x3) and
intention to leave (y).
CORRELATION 0.402436
Figure 5 illustrated the working condition & intention to leave has 0.402 which shows
a positive but a moderate relationship. There is a positive relationship between
working condition and intention to leave which means when working conditions
decreases the intention to leave increases.
0
0.5
1
1.5
2
2.5
3
0 0.5 1 1.5 2 2.5 3
Inte
nti
on
to
Lea
ve
-(Y
)
Working Condition - (X3)

43
4.2.3 CORRELATION BETWEEN REWARDS & INTENTION TO LEAVE
Figure: 16 Scatter Diagram between Rewards & Intention to Leave
There is a moderate positive correlation relationship between rewards (x4) and
intention to leave (y).
CORRELATION 0.62094
Figure 6 illustrated the rewards & intention to leave has 0.620 which shows a positive
but a moderate relationship. There is a positive relationship between rewards and
intention to leave which means even though the rewards have increased the intention
to leave also has comparatively increased.
0
0.5
1
1.5
2
2.5
3
0 0.5 1 1.5 2 2.5 3 3.5
Inte
nti
on
to
L
eav
e -
(Y)
Rewards - (X4)

44
5.0 DISCUSSION, CONCLUSION AND RECOMMENDATION
5.1 INTRODUCTION
In this chapter, the researcher mainly focuses to discuss the findings of the analyzed
data and to evaluate the achievement of the research objectives. For that purpose,
firstly, the researcher has recapped the research objectives. Further, to solidify the
discussion, the researcher expects to relate the findings to the literature review.
Finally, the researcher attempts to revisit the conceptual framework of the research to
do any modification if necessary.
5.1.1 ACHIEVEMENT OF OBJECTIVES
The objective of this research are to:
Understand the current factor’s affecting intention to leave in the BPO sector
in Sri Lanka.
Analyze the factors affecting the intention to leave
Make recommendations to make sure the sustainable growth of the BPO
sector in Sri Lanka.
Objective 1 was achieved by gathering data from CSRs of 03 companies in Sri
Lanka. The data analyzed showed what they considered as factor’s affecting intention
to leave.
Objective 2 was achieved by further analysis of data which revealed four categories
the respondents considered having an impact on the factor’s incurred due to intention
to leave. When variable (X1) increases intention to leave relatively is low, but in some
instances though the pay is increased the employees could leave the organization for
various reasons. The relationship between variable x2 and intention to leave is that it
both coincidently increases. When variable (X3) increases intention to leave relatively
is low, but in some instances though the working conditions improve the employees
could leave the organization for various reasons. Moderate positive correlation
between rewards (x4) and intention to leave (y). This goes to show that rewards are
quintessential for an employee’s well being in the work place.

45
Objective 3 of making recommendations too is attained and presented.
There is a weak positive correlation (0.38) affect between pay and intention to leave,
there is a strong Positive correlation (0.72) relationship between stress (x2) and
intention to leave (y) and there is a weak positive correlation (0.40) relationship
between working conditions (x3) and intention to leave (y). And there is a moderate
positive correlation (0.62) relationship between rewards (x4) and intention to leave (y)
as well. Relative data were collected through industry documents, internet and
through in depth interviews. Then analyzed using the Correlation analysis method.
The objectives stated are achieved successfully; which are identifying the causes for
the intention to leave and that necessary step should be taken to make sure that the
BPO Industry has a long term growth.

46
5.2CONCLUSION
There is a weak positive correlation (0.38) affect between pay(X1) and intention to
leave, There is a strong Positive correlation (0.72) relationship between stress (x2)
and intention to leave (y) and there is a weak positive correlation (0.40) relationship
between working conditions (x3) and intention to leave (y).And there is a moderate
positive correlation (0.62) relationship between rewards (x4) and intention to leave (y)
as well. Relative data were collected through industry documents, internet and
through in depth interviews. Then analyzed using the Correlation analysis method.
The objectives stated are achieved successfully; which are identifying the causes for
the intention to leave and that necessary step should be taken to make sure that the
BPO Industry has a long term growth.
Intention to leave among the CSRs in the BPO industry is unavoidable due to the
nature of the industry. But the intention to leave or the exceptionally high intention to
leave experienced with in the first 03 months of CSRs tenure is abnormal and causes
disruption in the way forward to sustain the business for BPO companies. The senior
management needs to wake up and face the reality of this deterioration in the industry
as the productivity and credibility are both declining quickly due to this. They need to
stop been complacent and oblivious to the ineffective processes and strategies that has
already been implemented. They need to get together with ICTA and promote Sri
Lanka internationally as a potential BPO hub in an aggressive manner. The BPO
industry in Sri Lanka can become one of the biggest earner of foreign exchange and a
large export earner. Therefore all responsible parties should relook at the micro and
macro level issues and save an industry if ignored may not exist in the by the next
decade.

47
5.3 RECOMMENDATION
There are mainly three implications if we can get them right then at least we can be
rest assured that the necessary steps have been taken to ensure the sustainability of the
industry. Firstly the corporate management having the responsibility for strategy
formulation and deriving a HR policy that suits the organization has not made much
effort to look into recruiting young people as CSRs and the probable ill effects of it.
With the first implication there are couple of recommendations we could give, there
are firstly to understand the factors affecting the high intention to leave and remedy
them fulfilling the expectations of the CSRs currently in operations. Secondly study
factors affecting those who work beyond one year and continue with the organization
and select only that type of people with similar expectations, value and competency.
Thirdly move out from upper middle class youngsters who are brought up in posh and
comfortable environments and always spoon fed by the family and unable to take up
challenges of work life. Replace them over period of time with prospective employees
from mid-range of middle class or lower middle class and have required
characteristics, capacity to be engaged in hard work and potential to develop their
language proficiency.
Get the participation of HR managers and operation managers in developing the
selected policy and get them to work out the implementation processes. It is important
that they recognize the ills of intention to leave and make plans accordingly.
Particular attention should be paid to effectiveness of selection and training,
evaluation, target setting etc. For instance, even if a new comer may not be able to
achieve the current level of targets, it is worthwhile to have some in-between
evaluations of lesser of targets, it is worthwhile to have some in-between evaluations
of lesser rigor that allows a person to earn sum recognition just to make the CSRs feel
and look forward to a future.
Implication 2: the operation managers and the team leaders don’t have time to support
CSRs since they are engaged in their own work and they have to handle the work load
of the CSRs who have left with very little notice.

48
My second recommendation is to corporate management to be implemented through
middle level managers and supervisor. The direct receives of the outcome of intention
to leave of CSRs as well as the lack of productivity of current CSRs are the middle
level managers, specifically those who are in charge of operations and also the team
leaders who has to face the consequences of low performance of CSRs if any.
The CSRs require some sort of mentoring during their initial three months. If they
have had a short initial training there is a lot to learn to perform well. The only person
they could turn to is the team leader. However, he too is loaded with his work as well
as others. Therefore, it is recommended to identify a deputy team leader, whose one
responsibility is to assist the CSRs with less than 3 months’ s service. The task is to
guide them and not to do their work. He also could provide a report at the end of each
month on the competency level of each new comer so that the team leader could
identify those who need more attention and training. Having someone to fall back is a
great support from the view point of the newly recruited CSRs. With the adjustment
even the evaluations by the team leader may be considered less often as favoritism.
Implications 3 CSRs accuse HR department for giving false information and also false
expectations about career path. This practice generates a sense of being misled. It
leads to frustration eventually.
Recommendation 3 HR department
Those who attend the interview panels should be educated to be truthful during the
interviews when giving information and hopes to prospective CSRs. This should be
recognized as a practice by the HR and it should be the responsibility of the HR
department to insist on this practice by all the panel members. Bitter truth is always
better than honey coated lies. An honest and straight interview board will be always
remembered by the interviewees even if they decide not to join the company.
These recommendations are easy to implement, yet it is the role of the management to
ensure that they implement effectively and CSRs would begin to look at their jobs and
the companied they work for.

49
LIST OF REFERENCES & BIBLIOGRAPHY
Abassi, S.M., & Hollman, K.W., (2000), “Turnover: The Real Bottom Line” ,
Public Personnel Management Journal, Vol.2(No.3), p.333-342
Brown S.P., & Swartz, T.A., (1989), “A gap analysis of professional Service
Quality”, Journal of Marketing, Vol. 53(No.2), pp.92-98.
Batt, R., (1999), “Work organization, technology and performance in customer
service and sales”, Industrial and Labor Relations Review, Vol.52(No.4),
pp.539-564.
Capelli, P. (2001). A market-driven approach to retaining talent. Harvard
Business Review on finding and keeping the best peope(pp.27-50). Boston:
Harvard Business School Press.
Butler, T . en Waldroop, J. (2001). Job sculpting: The art of retainin your best
people. Harvard Business Review on findin and keeing the best people
(pp.179-203). Boston: Harvard Business School Press.
Branch, (1998)
Rahman,A. Raza Naqavi, S.M.M. & Ramay, M.I. (2008). Measuring Turnover
Intention: A study of IT Professionals in Pakistan, International Review of
Business Research Papers, 4(3), 45-55.
Samarakoon, J.L. (2002). Job Satisfaction of Knowledge Workers and
Retention Strategies in the Software Development Industry of Sri Lanka, Sri
Lankan Journal of Management, 7,1-26.
Ton, Z. & Huckman, R. (2008). Managing the impact of Employee Turnover
on Performance: The Role of Process Conformance, Organization Science, 19,
56-68.

50
APPENDIX
Questionnaire
Factors affecting intention to leave; In case of Customer Service
Representatives of the BPO Industry in Sri Lanka.
Section 1
1.0 Details of respondents Please indicate your view points in the following tables. Specify your opinion for each
statement by ticking in the relevant column.
1.1 Gender
1.2 Age Category
18 – 25
26-30
31-40
41-50
51-60
61-70
Male
Female
Thank you very much for devoting your precious time to complete this questionnaire.
Your valuable feedback would be used for a research conducted as a part of the
dissertation which is compulsory for my BSc in Business Management (Special)
Degree Programme – UGC. I assure you that your responses would be treated with
absolute confidentiality and professionalism.

51
1.3 Please indicate to which category you belong (monthly income)?
(This may be the family income)
Less than
Rs. 30,000
(1)
Rs. 30,000 to
Rs. 50,000
(2)
Rs. 50,000 to
Rs. 75,000
(3)
Rs. 75,000 to
Rs. 100,000
(4)
Above Rs. 100,001
(5)
1.4 Educational Qualifications
Qualification Status
O/L
A/L
Courses
Diploma
Higher Diploma
Degree
MBA/MSc
For how long have you been working in this industry?
1.5 Work Experience
Less than 2 years
3-5 years
6 – 10 years
11 – 20 years
More than 20
years

52
Section 2
Please indicate your view points on the following statements. Specify your opinion for each
statement by ticking in the relevant column. The scale indicates 5 point Likert scale which is
as follows.
Pay in the industry Strongly
Disagree
(1)
Disagree
(2)
Neutral
(3)
Agree
(4)
Strongly
agree
(5)
Dependent
variable
6. The wage rates that are
provided are comparatively
high compared to other
industries.
7. The level of benefits
(bonuses/perks, leisure
holidays,) are satisfactory in the
industry.
8. Many people are aware of the
opportunities provided by the
industry
Stress
9. Service positions do not have
a positive image and it could be
viewed as demanding to serve.
10. There are stressful working
conditions in the industry.
11. For certain positions there is
little or no job security.
Working Conditions
12. There are favorable physical
working environments in the
industry.
13. Facilities provided are not
satisfactory
14. There are high risk of work
accidents in the BPO Industry
15. There is a supportive culture

53
in the industry where anyone
under any age category can
work together.
16. There is employee respect
for each other
17. There are good HRM
practices in the industry
18. There is fair treatment for
employees
19. There are unsocial working
hours involved in the BPO
industry
20. BPO Industry jobs are
repetitive (Call center).
21. There is support for work
life balance.
22. BPO industry jobs are
interesting and challenging.
23. There are satisfactory
promotional opportunities in the
BPO Industry.
Rewarding
24. Jobs occupied by local
people are at a lower level of
the hierarchy while more
prestigious jobs are given to
foreigners or more urbanized
nationals.
25. The quality of rewarding
programs are satisfactory.
26. Initiative have been taken to
upgrade the current programs.
27. Rewarding are tailored to
suit the careers in the BPO
industry.

54


![THESIS TITLE A THESIS SUBMITTED TO THE MIDDLE EAST ...ii.metu.edu.tr/system/files/documents/thesis... · [SAMPLE 1] Approval of the thesis: THESIS TITLE Submitted by STUDENT NAME](https://img.dokumen.tips/doc/110x75/6019035f39977162fc4f0b03/thesis-title-a-thesis-submitted-to-the-middle-east-iimetuedutrsystemfilesdocumentsthesis.jpg)