Embed Size (px)
Citation preview
Int. J. Electrochem. Sci., 7 (2012) 2596 - 2615
International Journal of
ELECTROCHEMICAL SCIENCE
www.electrochemsci.org
Thermolysis and Conductivity Studies of Poly(Ethylene Oxide)
(PEO) Based Polymer Electrolytes Doped with Carbon
Nanotube
Suriani Ibrahim*, Mohd Rafie Johan
Advanced Materials Research Laboratory, Department of Mechanical Engineering, University of
Malaya, 50603 Kuala Lumpur, Malaysia *E-mail: [email protected]
Received: 15 October 2011 / Accepted: 27 January 2012 / Published: 1 March 2012
In this research, solution-casting technique was employed for the preparation of solid polymer
electrolytes poly(ethylene oxide) (PEO) films were characterized via differential scanning calorimetry
(DSC), impedance spectroscopy (IS) and Thermogravimetric (TGA). With addition of varies of
lithium hexaflurote (LiPF6), ethylene carbonate (EC) and amorphous
C. The conductivity values for PEO complexes
increased continuously and reached a maximum of 10-3
Scm-1
w 5w % w
PEO complexes. Thermogravimetric analysis (TGA) results showed that the amount of LiPF6, EC and
has a significant effect on the thermal stability of polymer complexes. The TGA curves also
indicated that the thermal behaviour of composites polymer electrolytes differs significantly between
w > 00 ° g 200 ° g .
Keywords: polymer electrolyte; thermal stability; decomposition; thermolysis; phase transitions
1. INTRODUCTION
Polymer electrolytes have gained much interest due to their potential applications such as
lithium rechargeable batteries and fuel cell [1,2]. Polymer electrolytes are flexible and possess the
ability to transform into desired shapes. Moreover, the flexible polymers can accommodate the shape
changes during charge-discharge cycle. The development of polymeric systems with high ionic
conductivity is one of the main objectives in polymer research, due to their potential application in
electronics such as solid state rechargeable lithium batteries, electrochromic windows, etc [3,4]. The
discovery of ionic conductivity in polyether-based hosts complexed with alkali metal salts by Fenton et

Int. J. Electrochem. Sci., Vol. 7, 2012
2597
al. [5] and Wright [6] has generated research activities leading to significant advances in the
characteristics and structure of these polymer-salt complexes.
Poly(ethylene oxide) has been a popular choice of polymer matrix for lithium ion conductors
[7]. LiPF6 is the most common lithium salt employed in lithium-ion batteries as it offers good
electrolyte conductivity and film forming. Studies have proved that in PEO based polymer electrolytes
systems, conductivity will increase as the salts concentrations increases [8-12]. Solid polymeric
electrolytes consist of salt dissolved in a polymer matrix forming an ion-conducting solid solution [13].
However, for this application, the polymer has to possess certain properties, such as amorphous
character, oxygen molecules in its structure, low glass transition temperature, electrochemical and
dimensional stability, mechanical resistance and the possibility of forming relatively thin films or
pellets [13]. By investigating the thermal behaviour of polymers as a function of weight loss with heat,
it is possible to obtain information about their stability.
’ w g on has been paid on the compatibility and
thermal stability studies of PEO polymer electrolytes. Also, the salts commonly used in lithium battery
electrolytes such as LiPF6, LiAsF6 and LiBF4 have poor thermal stability and may have toxic by-
products. Hence, the objective of this research is to investigate the thermal behaviour of salted
polymer. Among the salts commonly used, an attempt has been made to choose the best salt for lithium
batteries in terms of thermal, electrochemical and compatibility view point. Thermogravimetric
analysis (TGA) can be used as a way to measure the thermal stability of a polymer and the thermal
degradation of polymer due to the simplicity of the weight loss method [14]. The neural network
model has been developed and it was successful to predict the role of salt, plasticizer and filler for the
ionic conductivity enhancement in the nanocomposites polymer electrolyte system [15, 16].
In this work, differential scanning calorimetry (DSC), impedance spectroscopy (IS) and
Thermogravimetric analysis were used to analyze the phase transition, conductivity and thermal
behavior in a series of PEO complexes. This work is aimed to examine the thermal properties
associated with the conductivity of novel nanocomposite solid polymer electrolytes.
2. EXPERIMENTAL
Polymer electrolytes were prepared by standard solution-casting techniques. PEO (MW =
600,000, Acros Organics) was used as host polymer matrix, lithium hexaflurosphosphate (LiPF6)
(Aldrich) as the salt for complexation and ethylene carbonate (EC) (Alfa Aesar) as plasticizer.
A CNT) was prepared by chemical route at low temperature [17] . Prior
to use, PEO was dried at 50 oC for 48 hours. Appropriate quantities of PEO, LiPF6 E
were dissolved separately in acetonitrile (Fisher) and stirred well for 24h at room temperature to form
a homogeneous solution. All samples were stored under dry conditions. An electronic digital caliper
was used for measuring films thickness and average thickness for films is 0.76mm. The ionic
conductivities of the samples were measured at temperature ranging from 298 to 373 K using HIOKI
3531 LCR Hi-Tester with frequency range of 50 Hz to 5 MHz.
Differential Scanning calorimeter (DSC) thermographs were generated using DSC 820 fitted with 56

Int. J. Electrochem. Sci., Vol. 7, 2012
2598
thermocouples. Thermogravimetric analysis (TGA) data for the polymer composite were collected
using TGA/SDTA 851 Mettler Toledo.
3. RESULTS & DISCUSSION
3.1. Conductivities studies
3.1.1. Various LiPF6 salt concentrations
Fig. 1 shows the plot of conductivity dependence temperature at various weight percent of
LiPF6. The temperature dependence of the ionic conductivity is not linear and obeys the VTF (Vogel-
Tamman-Fulcher) relationship. The conductivity of salted polymer electrolytes is found to increase
with temperature, from 303 to 373K. At higher temperature, the thermal movement of polymer chain
segments and the dissociation of salts were enhanced the ionic conductivity [18].
Figure 1. Conductivity dependence temperature of polymer electrolytes at various wt% of LiPF6 (a) 5 ;
(b) 10 ; (c) 15 ; (d) 20.
3.1.2. Various EC plasticizer concentrations
Fig. 2 shows the plot of ionic conductivity temperature dependence at various wt% of EC. The
temperature dependence of the ionic conductivity is not linear and obeys the VTF relationship.

Int. J. Electrochem. Sci., Vol. 7, 2012
2599
Figure 2. Conductivity dependence temperature of complexes at various wt% of EC (a) 5 ; (b) 10 ; (c)
15.
The conductivity increases with increasing temperature upon the addition of 5 and 10wt% of
EC, as shown in Fig. 2. It is evident that the ionic conductivity increases with an increase in plasticizer
content and temperature. This can be explained in terms of two factors, first: an increase in the degree
of interconnection between the plasticizer-rich phases due to an increase in the volume fraction of
these phases; and second, increase in the free volume of the plasticizer rich phase due to an increase in
the relative amount of the plasticizer compared with that of PEO. At higher concentrations of
plasticizer, the transport of ions may be expected to take place along the plasticizer-rich phase.
Although the improvement in conductivity in certain electrolyte systems has been interpreted in
terms of plasticization of the polymer structure [19] or an alteration in the ion transport mechanism
[20], other effects related to the viscosity of the ionic environment may also contribute. As the amount
of plasticizer is increased, an optimum composition is reached whereby ion interactions between the
solubilizing polymer and the plasticizer are such that ion mobility is maximized. A further increase in
plasticizer content may eventually cause displacement of the host polymer by plasticizer molecules
within the salt complexes and a decrease in ionic mobility.
3.1.3. Various CNTs filler concentrations
Fig. 3 shows the temperature dependence of conductivity for polymer electrolytes between 298
373K. I v v w w % .
When the organic filler was added to the polymer electrolytes, new interfaces were connected with the
/ w v v

Int. J. Electrochem. Sci., Vol. 7, 2012
2600
the migration of the conductivity ions [21]. M v z NTs improve the conduction of
the mobile ions due to their extremely high surface energy [21-26]. This, prevents local PEO chain
reorganization with the result of freezing at ambient temperature and a high degree of disorder, which
in turn favours fast ionic transport. As the s, the conductivity also
increases due to more mobile ions which can be transported in nanocomposite polymer electrolytes.
v v w % 2.2 х 0-4
Scm-1
and increases to
.3 х 10-3
Scm-1
w 5w % w x s. The conductivity value
increases by an order of magnitude w . However, there is a
possibility of v w entrations. It is well known that
v g [27 28] v
. I gg g CNT surface due to the
specific action of the polar surface groups of the organic filler act as Lewis acid-base interaction
centers with the electrolyte ionic species [27]. Thus, it is expected that lowering ionic coupling
promotes salt dissociation via a sort of ion-filler complex formation.
Figure 3. Temperature dependence conductivity for w %
(a) 1 and (b) 5.
3.1.4. Optimum concentrations of nanocomposite polymer electrolytes
Fig. 4 shows the temperature dependence of conductivity for various electrolytes between 298
and 373K. It is evident that the room temperature conductivity increases with different chemical
composition. The conductivity increases by 5 orders of magnitude with the addition of LiPF6, 4 orders

Int. J. Electrochem. Sci., Vol. 7, 2012
2601
g w E 3 g w CNTs. The
sudden increase of conductivities is due to the role of lithium ions in the PEO, the increase in
x E g v
polymer electrolytes.
There is a sudden increase in conductivity for pure PEO electrolyte at 313 – 323K (Fig. 4(a)).
However, the ionic conductivity increases linearly beyond 323K. With the addition of LiPF6, EC and
v F g. 4 – (d), which show a slight increase in
conductivity in a wide temperature range. When EC was added into the system, more salts are
dissociated into ions, which have low viscosity and therefore increases ionic mobility. The addition of
v g recrystallization of the PEO chains and providing Li+
conducting pathway at the filler surface through Lewis acid base interaction among different species in
the electrolytes [29]. A transportation lithium ion within the polymer matrix requires low energy and
hence increases the conductivity. This is possibly due to size of the filler and plasticizer molecule
compared to the polymer molecule, which can penetrate easily into the polymer matrix [30]. The
sample, which consists of LiPF6 E w w v g
temperature (298K ~ 373K). A transportation lithium ion within the polymer matrix requires low
energy and hence increases the conductivity. This is possibly due to size of the filler and plasticizer
molecule compared to the polymer molecule, which can penetrate easily into the polymer matrix [30].
Figure 4. Conductivity dependence temperature of nanocomposite polymer electrolytes at optimum
compositions (a) PEO; (b) PEO -20 wt% LiPF6; (c) PEO -20 wt % LiPF6 - 15 wt % EC (d)
PEO -20 wt% LiPF6 - 15 wt% EC -5 w % .

Int. J. Electrochem. Sci., Vol. 7, 2012
2602
3.2 DSC studies
3.2.1 Differential scanning calorimetry (DSC) analysis of polymer electrolytes at
various wt% of LiPF6
Fig. 5 shows the DSC curves of polymer electrolytes at various weight percent of LiPF6
Figure 5. DSC curves of polymer electrolyte at various wt% of LiPF6 (a) 0 ; (b) 5 ; (c) 10 ; (d) 15 ; (e)
20.
v ° g
temperature (Tm) of pure PEO (Fig. 5(a)). The endothermic peak for pure PEO shows a the transition
from 69 to 67°C upon the addition of 5wt% of salt. The Tm value continues to decrease as more wt% of
salt is added. This observation shows the reduction in Tm value by the addition of salt. The
endothermic curves also indicate a reduction in PEO crystallinity. The relative percentage of
crystallinity Xc of PEO has been calculated using Equation (1).
%100xH
Ho
m
m
c
(1)
where mH is the melting enthalpy estimated experimentally and o
mH used as referenced is
the melting enthalpy for 100% crystalline PEO (213.7 Jg-1
) used as reference [31]. The calculated
values of Xc are summarized in Table 1. The crystallinity degree of the electrolyte decreases with the
wt% of the salt, which causes an increase in the amorphous phase. The polymeric chain in the
amorphous phase is more flexible, which results in the enhancement of segmental motion of the

Int. J. Electrochem. Sci., Vol. 7, 2012
2603
polymer. The reduction of Tm and Xc suggests that the interaction between the polymer host backbone
and LiPF6 affects the main chain dynamics of the polymer. This is due to the coordination bonds
between ether units of PEO and Li+ ions where Li
+ and PF6
¯ ions interrupt the packing of PEO
molecules and decrease the degree of crystallinity.
Table 1. Thermal properties of salted polymer electrolytes
____________________________________________________________
Sample Tg (oC) Tm (
oC) ΔHm(Wg
-1) Xc(%)
____________________________________________________________ Pure PEO -66 68.8 181.37 84.87
PEO-5wt% LiPF6 -68 67.4 144.93 67.82
PEO-10wt% LiPF6 -68 65.1 124.94 58.46
PEO-15wt% LiPF6 -70 64.4 117.59 55.03
PEO-20wt% LiPF6 -72 63.5 101.56 47.52
_______________________________________________________________
This will promote the amorphous phase which is expected to favour ion transport, thus
g ’ v . The glass transition temperature (Tg) involves the freezing of
large-scale molecular motion without a change in structure at which a glassy phase of the sample
becomes a rubbery amorphous phase on heating. Tg of a polymer concerns with the mobility of the
polymer chain. Lower Tg usually leads to easier chain relaxation, In PEO-based polymeric electrolytes,
lithium ion conduction is promoted by such segmental motion in the amorphous phase. This shows that
Tg is lowered when LiPF6 is added which suggests that the segmental mobility of PEO in this region
increases upon the addition of LiPF6. An electrolyte with low Tg always implies fast ion conduction.
3.2.2. DSC Analysis of salted polymer electrolytes at various wt% of EC plasticizer
Figure 6. DSC curves of salted polymer electrolytes at various wt% of EC (a) 5 ; (b) 10 ; (c) 15

Int. J. Electrochem. Sci., Vol. 7, 2012
2604
Fig. 6 shows the DSC curves of PEO:LiPF6 with various wt% of EC over the temperature range
of -100 to 100 oC. In the case of PEO-LiPF6-EC mixture, the sizes of crystallinity peaks are smaller
and Tm and Tg are lower than pure PEO. As the ratio of EC increases in the mixture, the relative
crystallinity, Xc, Tm and Tg tend to decrease. These results seem to be caused by the addition of EC,
which increases the interfacial area by phase separation, which results in the fall of crystallinity. The
results obtained from the reheating cycle are summarized in Table 2. The presence of EC favours the
entropy configuration of the polymer to provide more free volume, in which the ions move easily in
the bulk through the plasticizer rich phase [32].
It is evident from Table 2 that there is a marked decrease in Tg, Tm and Xc during heating as a
result of EC addition. The high conductivity of the samples is due to the increase of amorphous phase
in the polymer with the presence of the plasticizer. It can be inferred that the amorphous phase of the
polymer electrolytes facilitates fast Li-ion motion in the polymer network, which further provides a
larger free volume upon temperature increase [33]. Since lithium-ion conduction in PEO-based
polymer electrolytes mainly takes place in the amorphous phase, low crystallinity should be favourable
for ion conduction at low temperatures.
Table 2. Thermal properties of plasticized polymer electrolytes
____________________________________________________________
Sample Tg (oC) Tm (
oC) ΔHm(Wg
-1) Xc(%)
____________________________________________________________
PEO-20wt% LiPF6-5wt% EC -72 63.2 127.08 59.47
PEO-20wt% LiPF6-10wt% EC -74 63.1 109.55 51.27
PEO-20wt% LiPF6-15wt% EC -76 62.9 101.19 47.35
________________________________________________________________
3.2.3. DSC analysis of salted plasticized polymer electrolytes at various wt.% of αCNTs filler
Figure 7. DS v v w % 5.

Int. J. Electrochem. Sci., Vol. 7, 2012
2605
Fig. 7 shows the DSC curves of PEO:LiPF6:E w v w % v
temperature range of -100 to 100 oC. The results obtained are summarized in Table 3. The sharp
endothermic peak corresponds to the crystalline melting temperature (Tm) and shows a slight transition
2 ° 5w % .
reduction in PEO crystallinity. The relative percentage of crystallinity (Xc) for the electrolyte decreases
w w % w ses an increase in the amorphous phase. The polymeric chain in the
amorphous phase is more flexible, which results in the enhancement of segmental motion of the
polymer. The position of Tg for PEO-LiPF6-E w w % g ted
towards lower temperature. This suggests that the segmental mobility of PEO-LiPF6-EC in this region
g g . filler effect such as
z w PEO matrix to suppress the crystallization of PEO,
leading to an increase in ionic conductivity, especially at temperature lower than its melting point [34].
A similar behaviour was also observed in the PEO polymer electrolyte containing fillers such as SiO2
and TiO2 [34, 35]. A contribution to the conductivity enhancement comes from the structural
modifications associated with the polymer host caused by the filler especially at temperatures below Tg
and Tm should possibly be due to this effect. The samples clearly point towards the existence of a
second conductivity enhancement mechanism, other than that involving the polymer host directly [34].
This conductivity enhancement at temperatures above as well as below Tg and Tm, should therefore be
caused by a different mechanism directly associated with the surface groups in the filler [35].
Table 3. Thermal characteristics of nanocomposite polymer electrolytes
____________________________________________________________
Sample Tg (oC) Tm (
oC) ΔHm(Wg
-1) Xc(%)
____________________________________________________________
PEO-20wt% LiPF6-15wt% EC -78 62 98.75 46.21
-1wt% CNT
PEO-20wt% LiPF6-15wt% EC -80 61 57.95 27.12
-5wt% CNT
________________________________________________________________
3.2.4. DSC analysis of nanocomposite polymer electrolytes at optimum wt% of LiPF6, EC and αCNTs
Fig. 8 shows the DSC curves for various polymer electrolytes with optimum wt% of LiPF6, EC
v g -100 to 100oC. The results obtained are summarized in Table
4. All polymer electrolytes exhibit endothermic peaks between 50 and 70 oC, which suggest the
presence of a crystallization phase, based on the melting point for PEO (60 – 75 oC). The curves show
that the addition of salt, plasticizer and filler will influence the relative degree of crystallinity (Xc), the
glass transition temperature (Tg) and melting temperature (Tm) of polymer electrolytes. A sharp
endothermic peak is observed near 65 oC during the heating process for the melting of pure PEO, as
Int. J. Electrochem. Sci., Vol. 7, 2012
2606
shown in Fig. 8(a). The addition of LiPF6 salt causes a change in the shape of the endothermic peak,
and the peak shifts towards lower temperature.
Figure 8. DSC curves of (a) PEO (b) PEO-20 wt% LiPF6 (c) PEO-20 wt% LiPF6-15 wt% EC (d)
PEO-20 wt% LiPF6-15 wt% EC-5 w % .
This also indicates the complexation process between LiPF6 and PEO. The Tg and Tm continues
to decrease with the addition of plasticizer (EC). The addition of filler causes peak
broadening.
Table 4. Thermal characteristics of nanocomposite polymer electrolytes
____________________________________________________________
Sample Tg (oC) Tm (
oC) ΔHm(Wg
-1) Xc(%)
____________________________________________________________
Pure PEO -66 68.8 181.37 84.87
PEO-20wt% LiPF6 -72 63.5 101.56 47.52
PEO-20wt% LiPF6-15wt% EC -76 62.9 101.19 47.35
PEO-20wt% LiPF6-15wt% EC -80 61.0 57.95 27.12
-5wt% CNT
________________________________________________________________
The peak slightly shifted toward lower temperature. These observations clearly suggest that a
major contribution of conductivity enhancement comes from structural modifications associated with
the polymer host caused by the salt, plasticizer and filler [36]. The reorganization of polymer chain
may be hindered by the cross-linking centres formed by the interaction of Lewis acid groups of filler
Int. J. Electrochem. Sci., Vol. 7, 2012
2607
with the polar groups of polymer [37]. Consequently, the degree of crystallization of the polymer
matrix decreases with the addition of filler [37].
It is evident that there is a marked decrease in Tg, Tm and Xc during heating upon the addition
of salt, plasticizer and filler. Therefore, a significant contribution to the observed conductivity
enhancement in the salt, plasticized and filler-added electrolyte, PEO + 20 wt% LiPF6+15 wt% EC+5
w % CNTs, having the lowest Tg and Tm values, evidently comes from the increased segmental
flexibility and the increased amorphous nature of the host polymer caused by the salt, plasticizer and
the filler [36]. Since lithium-ion conduction in PEO-based polymer electrolytes mainly takes place in
amorphous phase, low crystallinity should be favourable for ion conduction at low temperatures.
3.3. TGA studies
3.3.1. Thermogravimetric (TGA) analysis of polymer electrolytes of various wt% of LiPF6 Salt
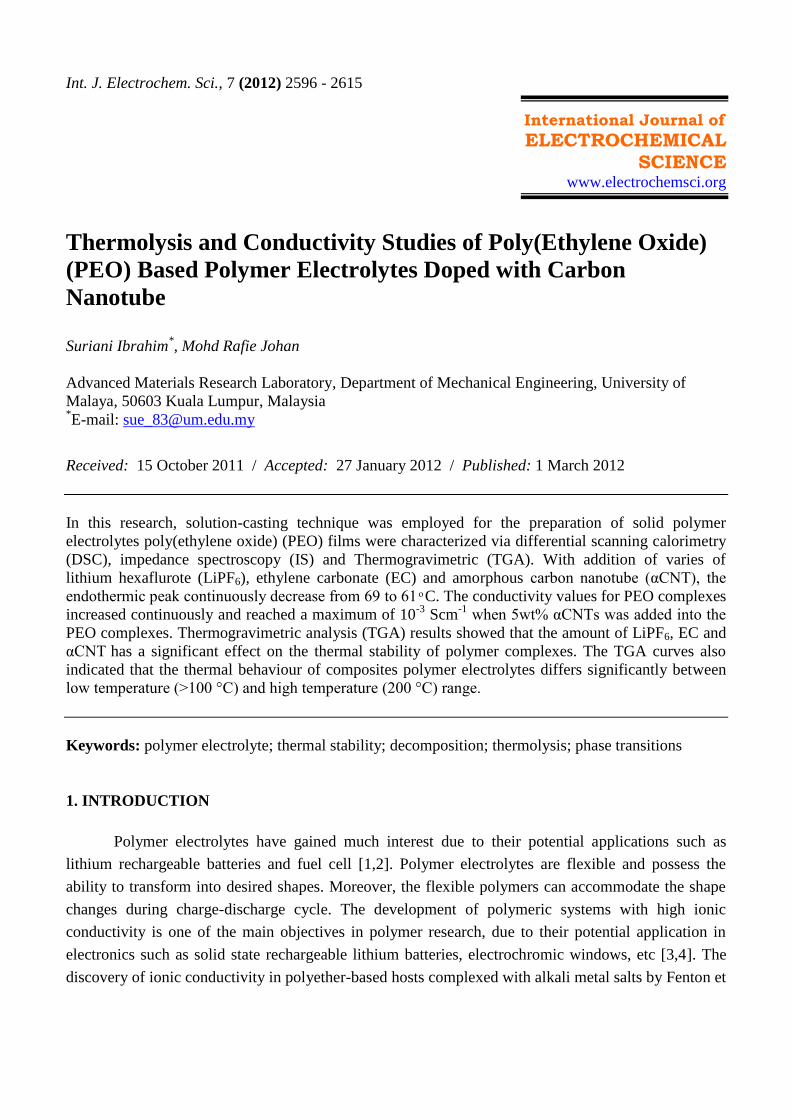
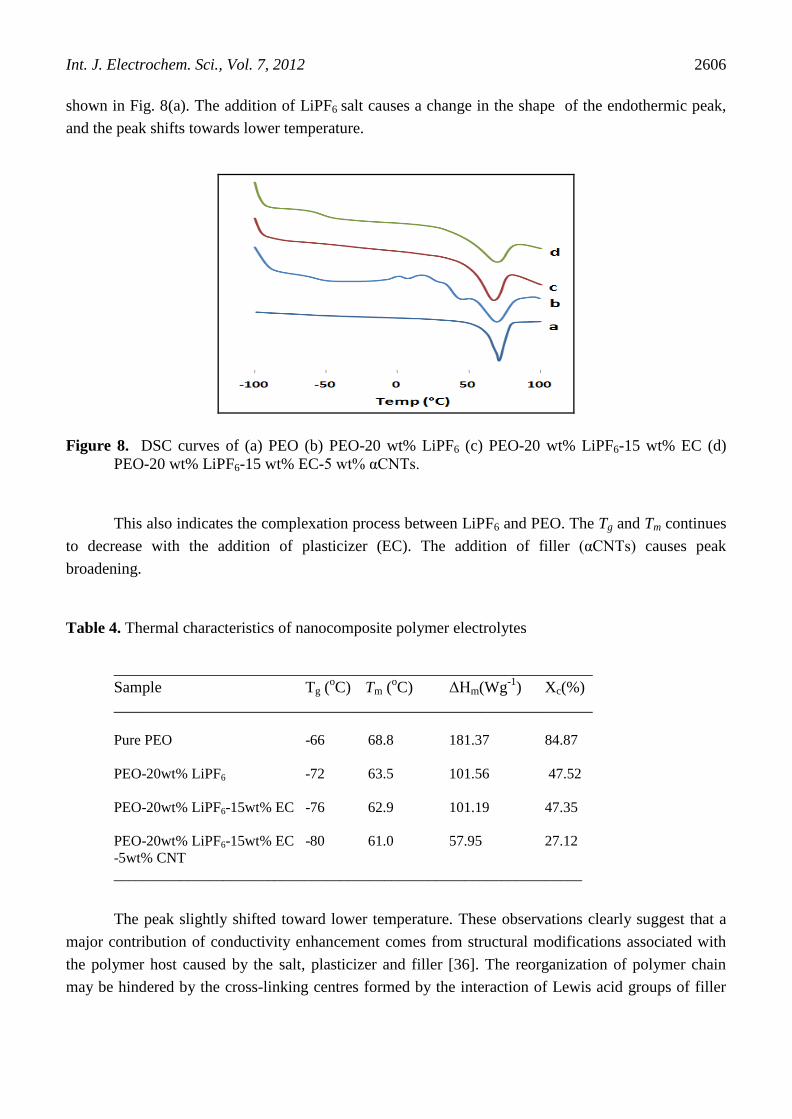
Fig. 9 shows the TGA and DTG curves of the polymer electrolytes with various wt% of LiPF6.

Int. J. Electrochem. Sci., Vol. 7, 2012
2608
Figure 9. TG-DTG curves of polymer electrolytes at various wt% of LiPF6 (a) 5; (b) 10; (c) 15; (d)
20.
Table 5. Initial and decomposition temperatures and percentage of total weight loss for various PEO-
LiPF6 samples
Sample Initial Weight
Loss
Temperature
Weight
Loss
Decomposition
Temperature
Weight
Loss
Total
Weight
Loss
° (%) ° (%) (%)
PEO+5wt%
salt
48 8 230 88.45 96.45
PEO+10wt%
salt
70 9 250 84.84 93.84
PEO+15wt%
salt
80 8 230 87.00 95.00
PEO+20wt%
salt
85 20 280 68.00 88.00

Int. J. Electrochem. Sci., Vol. 7, 2012
2609
The TGA and DTG curves of the PEO-salt films reveal two main weight loss regions, which
appear as two peaks in the DTG curves. The first region at a temperature of 40- 00°
evaporation of physically weak and chemically strong H2O bonding. The second transition region of
around 230-280° PEO-salt membrane. It can be clearly seen that all
samples exhibit minimal weight loss until the samples 200 º , at which an endothermic peak
appears. This indicates that the PEO-LiPF6 200 º ition. At 200oC, the
LiPF6 starts to melt and the system is no longer stable. The results of weight-loss ratios for all samples
accelerating between 200 and 400 oC are summarized in Table 5.
3.3.2. Thermogravimetric (TGA) analysis of salted polymer electrolytes at various wt% EC plasticizer
Fig. 10 shows the TGA and DTG curves of the polymer electrolytes with different wt% of EC.

Int. J. Electrochem. Sci., Vol. 7, 2012
2610
Figure 10. TG-DTG curves of salted polymer electrolytes at various wt% of EC (a) 5; (b) 10; (c) 15.
The DTG curves display two main inflection regions. The first region at lower temperatures
< 00° g w v w g g
200° w PEO.
As seen from DTG curves, the maximum temperatures of weight loss (Tm) of polymer
355 3 37 ° v . I x
w g 00 º w k appears. The
results of weight-loss ratios for all samples accelerating between 100 and 400 oC are summarized in
Table 6.
From the table, it can be stated that an increase in the amount of plasticized content in the
samples promotes a slight increase in weight loss.
Table 6. Initial and decomposition temperatures and percentage of total weight loss for various PEO-
LiPF6-EC samples
Sample Initial
Weight Loss
Weight
Loss
Decomposition
Temperature
Weight
Loss
Total
Weight
Temperature
°
(%) ° (%) Loss
(%)
PEO+20wt%
salt+5w% EC
82 8 200 80.46 88.46
PEO+20wt%
salt+10wt% EC
90 10 205 80.00 90.00
PEO+20wt%
salt+15wt% EC
91 9 210 81.00 90.00

Int. J. Electrochem. Sci., Vol. 7, 2012
2611
3.3.3. Thermogravimetric (TGA) Analysis of Salted Plasticized Polymer Electrolytes at various wt%
of αCNTs Filler
F g. w GA D G v w w % .
Figure 11. TG-D G v v w % ; 5.

Int. J. Electrochem. Sci., Vol. 7, 2012
2612
The results of weight-loss ratios for all samples accelerating between 100 and 400 oC are
z 7. I F g. g w g w .%
0% 3% w 5w % PEO . A g
nanoparticle increases, the w g w v
reduce the thermal stability of nanocomposite polymer electrolytes. Nevertheless, after subtraction of
the filler mass, the thermal degradation behaviour of polymer electrolytes is only slightly affected by
.
Table 7. Initial decomposition temperatures and percentage of total weight loss for various
nanocomposite polymer electrolytes
Sample Initial Weight
Loss
Weight
Loss
Decomposition
Temperature
Weight
Loss
Total
Weight
Loss
Temperature
°
(%) ° (%) (%)
PEO+20wt%
salt+15wt% EC+1wt%
CNT
97 5.2 198 84.88 90
PEO+20wt%
salt+15wt% EC+5wt%
CNT
198 17.0 210 76.00 93
3.3.4. Thermogravimetric (TGA) analysis of nanocomposite polymer electrolytes at optimum
wt% of LiPF6, EC and αCNTs
Fig. 12 shows the TGA and DTG curves weight loss of composites polymer electrolytes.

Int. J. Electrochem. Sci., Vol. 7, 2012
2613
Figure 12. TG-DTG curves of nanocomposite polymer electrolytes (a) PEO; (b) PEO+LiPF6; (c)
PEO+LiPF6+EC; (d) PEO+LiPF6+E +

Int. J. Electrochem. Sci., Vol. 7, 2012
2614
The sample shows the lost weight at around 25- 00° w 200-280° .
This decomposition temperature is considerably higher than those of the liquid electrolytes currently
used in lithium batteries [38]. The weight loss process of the solid polymer electrolytes is gradual
rather abrupt, as in the case for liquid electrolytes. For this reason, solid polymer electrolytes are more
thermally stable than liquid electrolytes for applications in lithium ion batteries. Table 8 summarizes
the results for optimum concentrations of solid polymer electrolytes.
Table 8. First and second decomposition temperatures and percentage of total weight loss for various
nanocomposites polymer electrolytes
Sample Initial Weight
Loss
Weight
Loss
Intermediate
Weight Loss
Weight
Loss
Total
Weight
Temperature
°
(%) Temperature
°
(%) Loss (%)
PEO 75 0.22 200 88.74 88.96
PEO+20wt% salt 85 20 280 68.00 88.00
PEO+20wt% salt+15wt%
EC
91 10 210 81.00 90.00
PEO+20wt% salt+ 15wt%
EC+ 5wt% CNT
100 10.83 220 76.00 86.53
4. CONCLUSION
Novel composite solid polymer electrolytes were synthesized sucessfully via solution-casting
technique. DSC thermographs exhibit a decrease in Tm, Tg and Xc values, which leads to increased
conductivity for composite polymer electrolytes at 298K. It is found that the amount of LiPF6, EC and
CNTs could affect significantly the thermal stabilities of polymer. The addition of LiPF6, EC and
CNTs could reduce the thermal stability of polymer-lithium composites in the lower temperature
g > 00 ° . M v g D G has been observed.
ACKNOWLEDGEMENTS
The authors are grateful to the support from University of Malaya under UMRG Grant (NO.
RG038/09AET). Suriani Ibrahim would like to acknowledge the financial support provided by
U v M ’ PPP G PS083/200 B.
References
1. B. Scrosati. Application of Electroactive Polymers, Chapman and Hall, London, 1993
2. F.M. Gray. Polymer Electrolytes, The Royal Society of Chemistry, HN, Letchworth, 1997.
3. B. Scrosati. Applications of Electroactive Polymers (Chapman and Hall, London, 1993).
4. F.M. Gray. in: Solid Polymer Electrolytes; Fundamentals and Technological Applications (VCH
Publishers, New York, NY, 1991) p. 35.

Int. J. Electrochem. Sci., Vol. 7, 2012
2615
5. B.E. Fenton, J.M. Parker, P.V. Wright. Polymer 14 (1973) 589.
6. P.V. Wright, Br. Polymer 7 (1975) 319.
7. G.B. Appetecchi, M. Montanino, A. Balducci, F.L. Simon, M. Winterb, S. Passerini. J. Power
Sources 192 (2009) 599
8. M.R. Johan, S.H. Oon, S. Ibrahim, S.M.M Yassin, Y.H. Tay. Solid State Ionics 196 (2011) 41
9. S. Ibrahim, S.M.M Yassin, R. Ahmad, M.R. Johan. Ionics. 17 (2011) 399
10. T.S. Min, M.R. Johan. Ionics. 17 (2011) 485
11. M.R. Johan, L.B. Fen. Ionics. 16 (2010) 335
12. M.R. Johan, S.A. Jimson, N. Ghazali, N.A.M. Zahari, N.F. Redha. Inter. Nat. Mater. Reas. 102
(2011) 4
13. G. O. Machado, R. E. P ’ A. Pawlicka. e-Polymers 3 (2007) 115.
14. Y. S. Lee, W.K. Lee, S.G. Cho, II Kim, C.S. Ha. J. Anal. Appl. Pyrolysis 78 (2007) 85
15. M.R. Johan, S. Ibrahim. Communications in Nonlinear Science and Numerical Simulation 17
(2012) 329
16. M.R. Johan, S. Ibrahim. Ionics. DOI.1007/s11981-011-0549-z.
17. M.N. Ng, M.R. Johan, Extended abstracts, IEEE International NanoElectornics Conference 2010
(INEC 2010). Vols 1 & 2. pg 392.
18. S. Rajendran, P. Sivakumar, R.B. Shanker. Journal of Power Sources. 164 (2007) 815
19. G.G. Cameron, M.D. Ingram, K. Sarmouk. Polymer. 26 (1990) 1097
20. F. Croce, S.D. Brown, S. Greenbaum, S.M. Slane, M. Salomon. Chemistry. Materials. 5 (1993)
1268
21. J. Przluski, M. Siekierski, W. Wieczorek. Electrochimica Acta. 40 (1995) 2101
22. F. Capuano, F. Croce, B. Scrosati. Journal of Electrochemical Society. 138 (1991) 1918
23. M.C. Borghini, M. Mastrogostino, S. Passerini, B. Scrosati. Journal of Electrochemical Society.
142 (1995) 2118
24. Z.Y. Wen, T. Itoh, N. Hirata, M. Ikeda, M. Kubo, O. Yamamoto. Journal of Power Sources. 90
(2000) 20
25. Y.W. Kim, W. Lee, B.K. Choi. Electrochimica Acta. 45 (2000) 1473
26. B. Kumar, L.G. Scanlon. Solid State Ionics. 124 (1999) 239
27. M.P. Anantram, F. Leonard. Reports on Progress in Physics. 69 (2006) 507
28. B.E. Kilbride, J.N. Coleman, J. Fraysse, P. Fournet, M. Cadek, A. Drury. Journal of Applied
Physics. 92 (2002) 4024
29. J. Ulanski, P. Polanowski, A. Traiez, M. Hofmann, E. Dormann, E. Laukhina. Synthetic Metals. 94
(1998) 23
30. D.K. Pradhan, B.K. Samantaray, R.N.P. Choudhary, A.K. Thakur. Ionics. 11 (2005) 95
31. A.M.M.A. Ali, R.H.Y. Subban, H. Bahron, T. Winnie, F. Latif, M.Z.A. Yahya. Ionics, 14 (2008)
491
32. S.A. Agnihotry, S.S. Pradeep, Sekhon. Electrochimica Acta 44 (1999) 3121
33. M.Z.A. Yahya, A.K. Arof A.K. European. Polymer Journal. 38 (2002) 1191
34. G.B. Appeteechi, F. Crose , L. Persi, F. Ronci, B. Scrosati. Electrochimica Acta 45 (2001) 1481
35. S.H. Liao, C.Y. Yena, C.C. Wenga, Y.F. Lina, C.C. Maa, C.H. Yang, M.C. Tsai, M.Y. Yena, M.
C. Hsiao, S.J. Leed, X. F. Xiee, Y. H. Hsiao. Journal of Power Sources. 185 (2008) 1225
36. Taner Ozel, Anshu Gaur, J. A. Rogers, Moonsub Shim. Nano Letters. 5 (2005) 905
37. A. Change, M. Carreb, P. Willmann. Journal of Power Sources. 109 (2002) 203
38. Y. Kong,, J.N. Hay. Polymer. 43 (2002) 3873
© 20 2 by ESG (www.electrochemsci.org)