Embed Size (px)
Citation preview
November 23, 2010
1
Thermodynamica 2 Thermodynamic relations of systems in equilibrium
Thijs J.H. Vlugt
Engineering ThermodynamicsProcess and Energy Department
Lecture 5

November 23, 2010 2
Today:• Equation of state 11.1• Departure functies 11.7
• Homework: Moran&Shapiro 11.68, 11.69, 11.70 • Homework: extra opgaven 3 en 9
• Next lecture: I will answer your questions. Please let me know by email which questions you would like me to answer

November 23, 2010 3
Pure component behavior – pVT diagrams

November 23, 2010 4
Phase behavior of pure substances
sublimation pressure curve
p
T
critical point
triplepoint
vapo
r pressu
recu
rvemel
ting
curv
e
p
v
critical point
triple point
TcTtr
solid liquid
vaporsolid
liquid
vapor
pc
ptr
2 phase LV
2 phase SLLS
isotherm
November 23, 2010 5
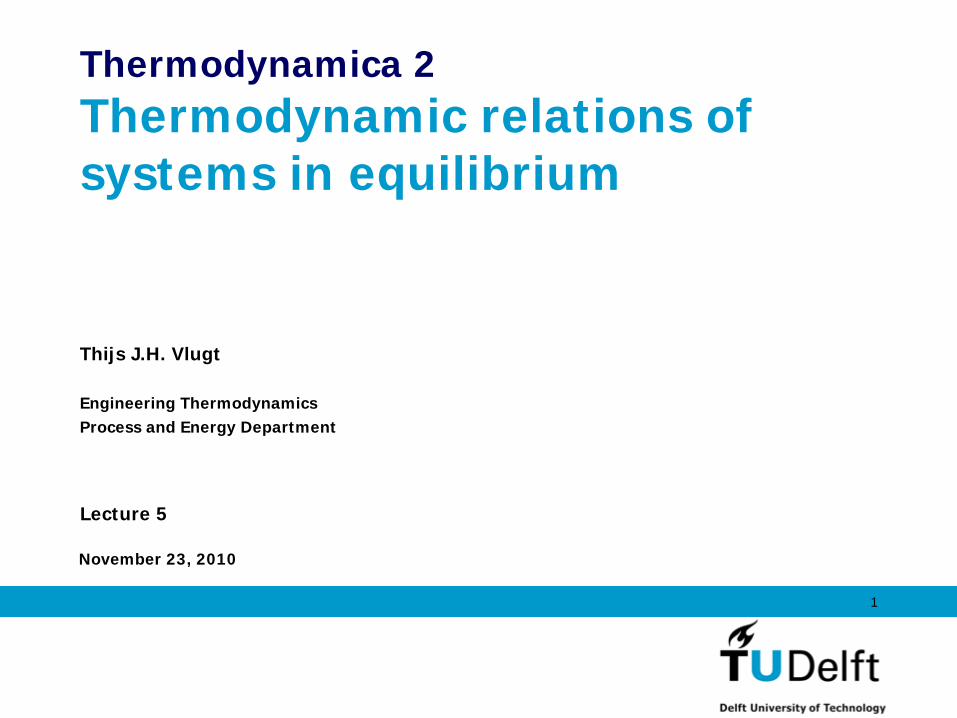
Examples of equations of state•Ideal gas equation of state
•Virial equation of state (for non-ideal gasses)
•Van der Waals equation of state (for non-ideal gasses)
2 31 ( ) ( ) ( ) ........pVZ B T p C T p D T pnRT
V 1pZnRT
2
2
n ap V nb nRTV

November 23, 2010 6
The Van der Waals equation of state
The first EOS able to describe vapor and liquids was proposed 1873 by Johannes Diderik van der Waals (Nobel price 1910)
2
RT apv b v
(a 2-parameter EOS: a,b)
the volume accessible to molecules is reduced by b, the volume occupied by molecules
pressure of a real fluid is reduced by the attraction of molecules among each other
free volume =
volume occupied per mole = b
v b
pressure attraction
• Parameter a and b can be determined by fitting the EOS to exp. data, or, more commonly, from critical point data (Tc , pc )
• The VdW EOS self is not accurate and is merely of historical interest
November 23, 2010 7
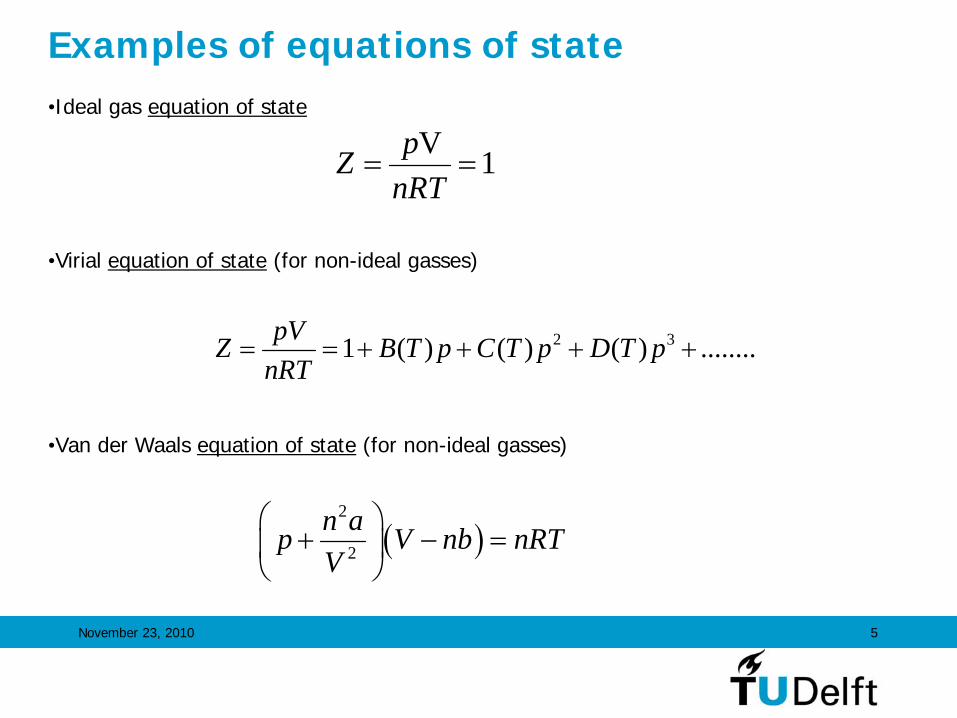
Van der Waals isotherms
p
v
2
RT apv b v
November 23, 2010 8
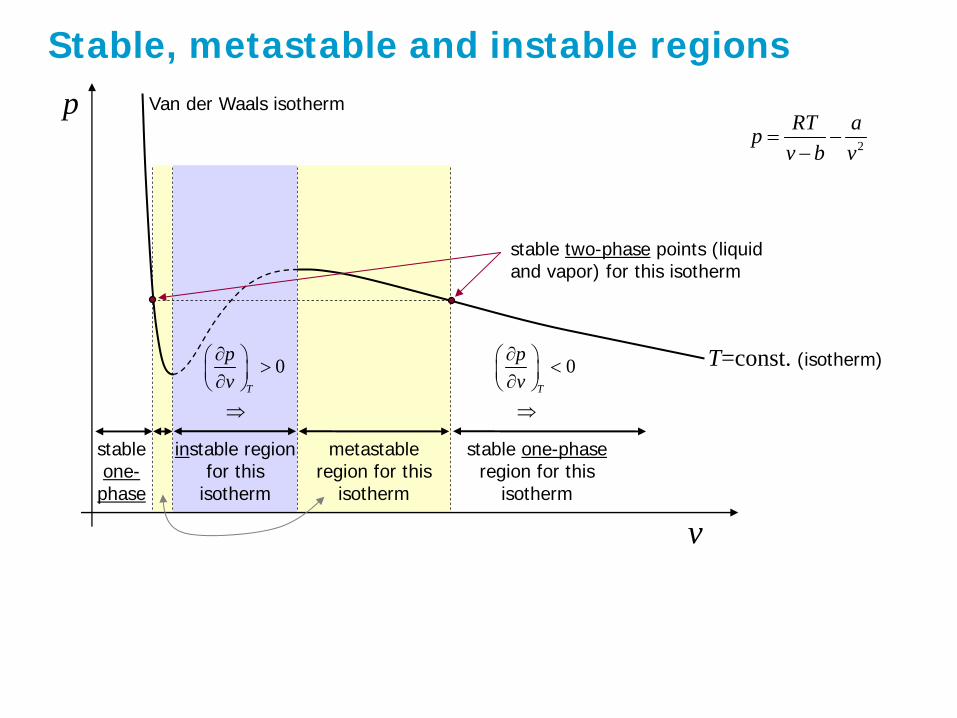
Stable, metastable and instable regionsp
v
T=const. (isotherm)
instable region for this
isotherm
metastable region for this
isotherm
stable one-phase region for this
isotherm
stableone-phase
0T
pv
stable two-phase points (liquid and vapor) for this isotherm
0T
pv
Van der Waals isotherm
2
RT apv b v

November 23, 2010 9
The principle of corresponding statesVan der Waals parameter a and b can be determined from critical point data (Tc , pc )
Starting from the conditions for the critical point
2
2
0
0
T
T
pv
pv
2 3
2
32 4
20
2 60
T cc
cT c
p RT av vv b
p RT av vv b
2
RT apv b v
with
2 2276418
c
c
c
c
R Tap
RTbp
The 2 parameters a and b are then defined in terms of (Tc , pc )
2''
64/278/1
RR
RR
vvTp
where reduced variables are defined ascR TTT
'R c cv p v RT
cR ppp
A generalized from of the VdW EOS can then be formulated
November 23, 2010 10
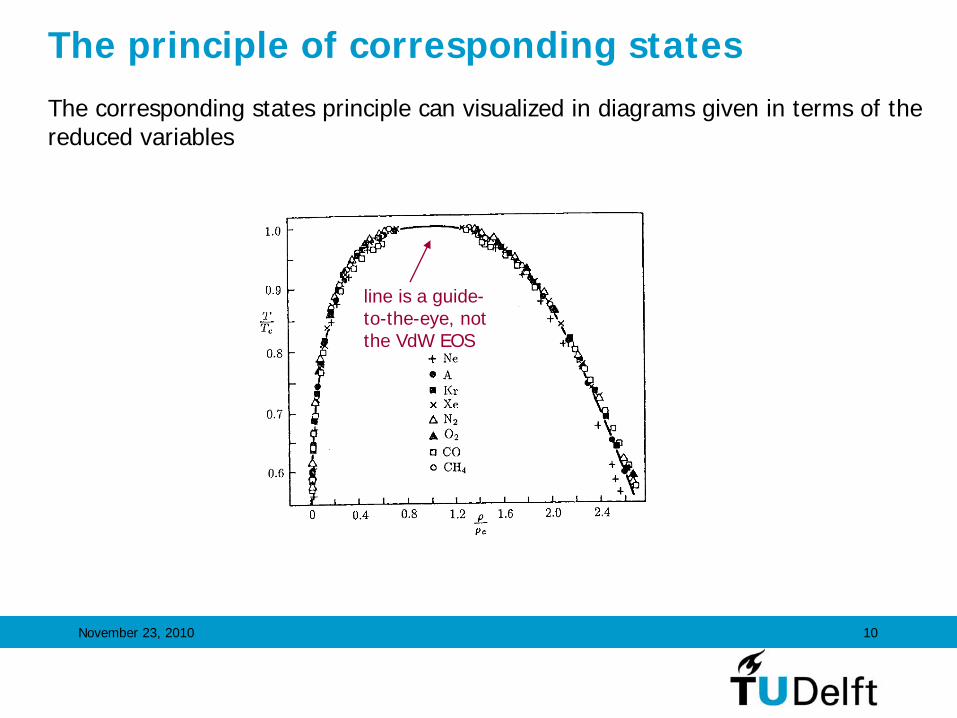
The principle of corresponding statesThe corresponding states principle can visualized in diagrams given in terms of the reduced variables
line is a guide- to-the-eye, not the VdW EOS

November 23, 2010 11
Redlich-Kwong EOS• The Redlich-Kwong EOS is an empirical modification of the VdW EOS• It improves the description of real components• It is also a 2-parameter EOS (with parameters a and b)
• a and b of real substances follow from the critical point data (Tc , pc )
RT ap
v b v v b T
2 5 2
0.42748 c
c
R Tap
0.08664 c
c
RTbp
November 23, 2010 12
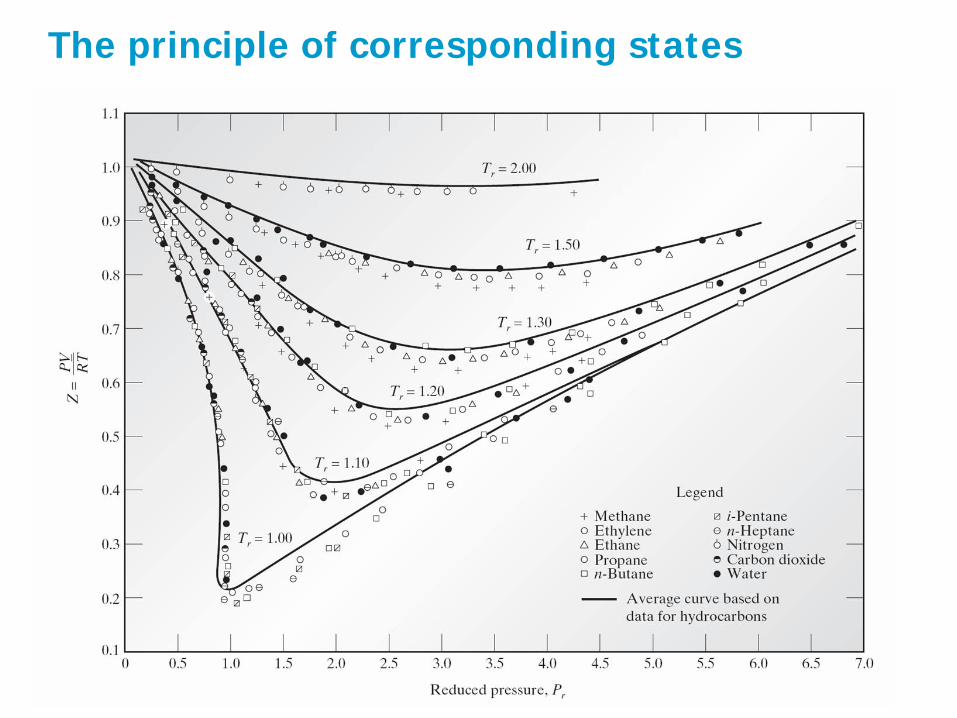
The principle of corresponding states

November 23, 2010 13
Corresponding states
November 23, 2010 14
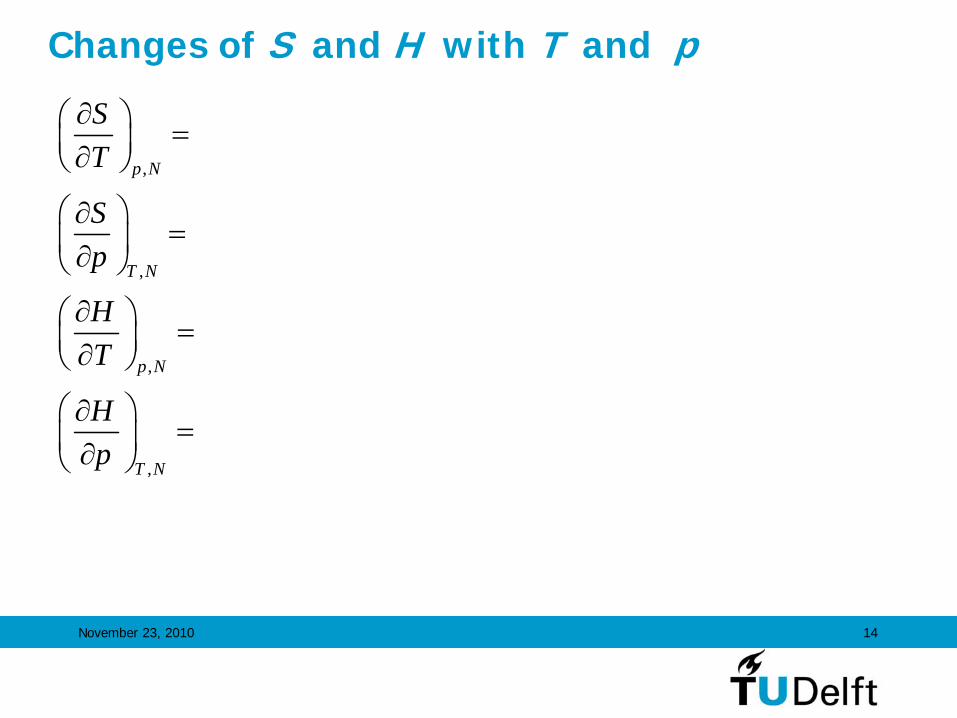
Changes of S and H with T and p
,
,
,
,
p N
T N
p N
T N
ST
Sp
HT
Hp

November 23, 2010 15
Changes of S and H with T and p
,
,,
,
,,
p
p N
p NT N
pp N
p NT N
CST T
S Vp T
H CT
H VV Tp T
De afleiding van de onderste formule
zie de laatste slide

November 23, 2010 16
Enthalpy departure
,,
,
,0
voor een ideaal gas: 0
dus: ( , ) ( )
( ) is de enthalpie die het systeem zou hebben als het een ideaal gas zou zijn
p NT N
T N
pIG
p N
IG
h vv Tp T
hp
vh T p h T v T dpT
h T
dus ( ) hangt dus NIET van de druk af !!!IGh T
November 23, 2010 17
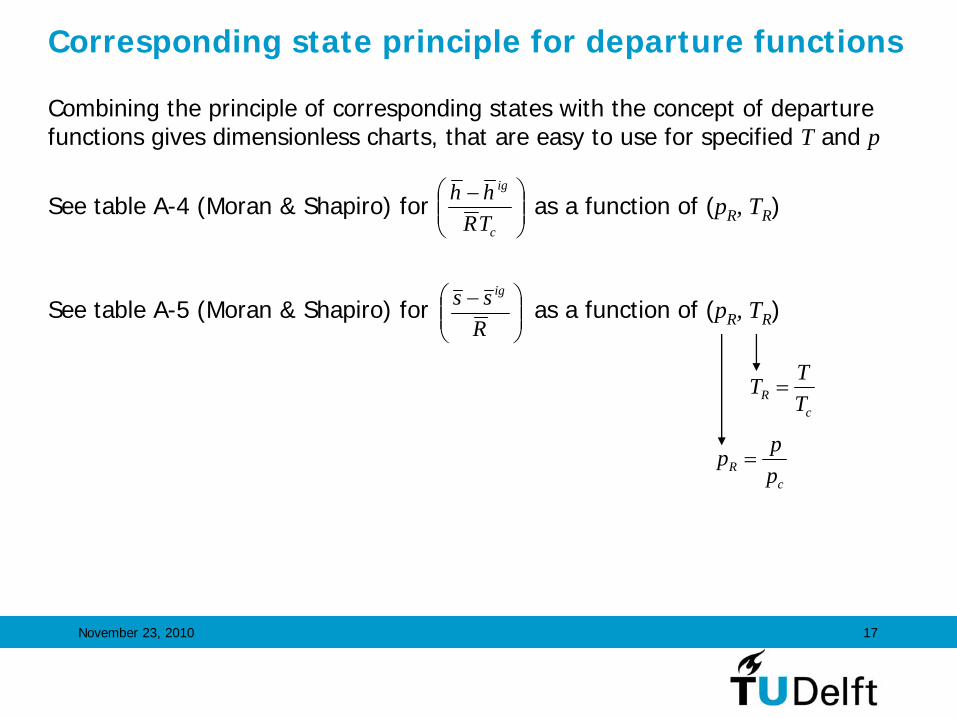
Corresponding state principle for departure functions
Combining the principle of corresponding states with the concept of departure functions gives dimensionless charts, that are easy to use for specified T and p
See table A-4 (Moran & Shapiro) for as a function of (pR , TR )
See table A-5 (Moran & Shapiro) for as a function of (pR , TR )
c
ig
TRhh
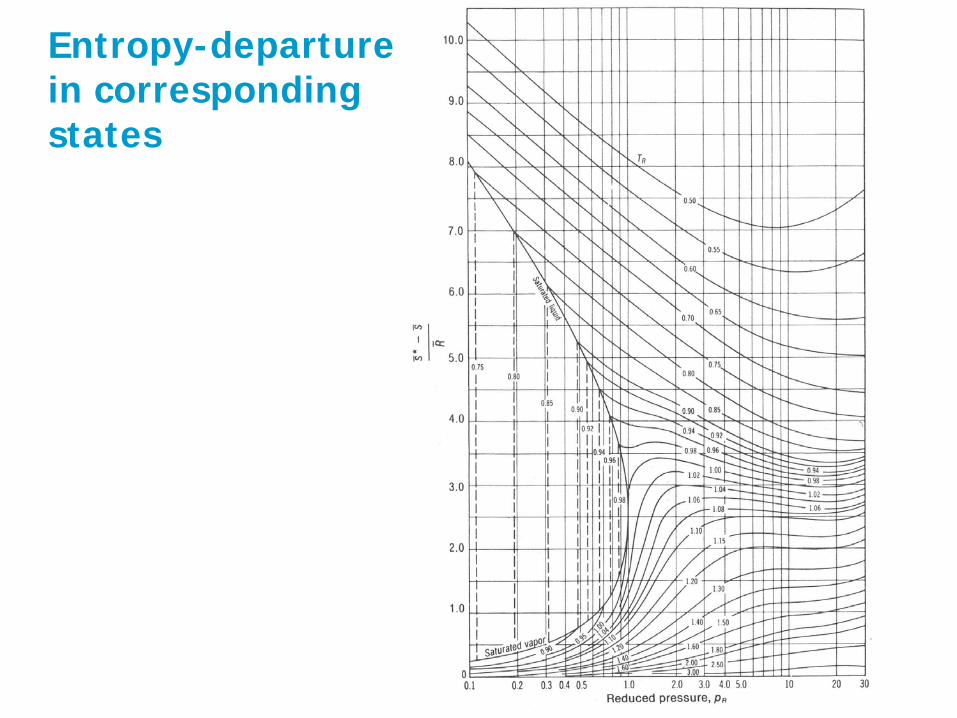
Rss ig
cR T
TT
cR p
pp

November 23, 2010 18
Enthalpy departure in corresponding states
c
ig
TRhh
caution
is equal to minus the values from this table
asterisk * (just as ig) is for ideal gas
November 23, 2010 19
Entropy-departure in corresponding states
November 23, 2010 20
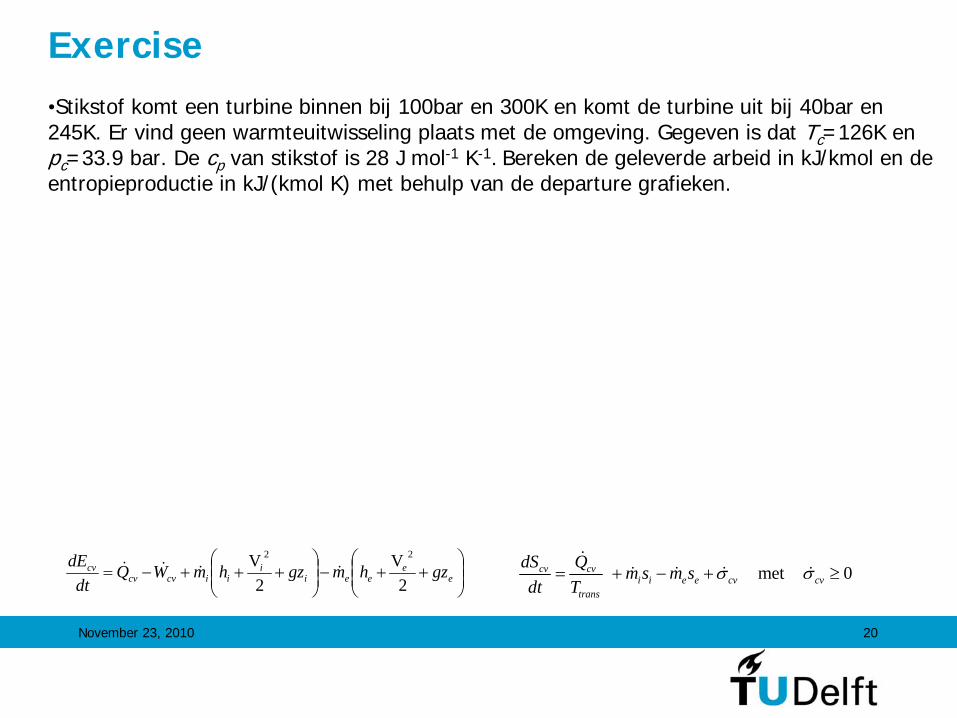
Exercise•Stikstof komt een turbine binnen bij 100bar en 300K en komt de turbine uit bij 40bar en 245K. Er vind geen warmteuitwisseling plaats met de omgeving. Gegeven is dat Tc =126K en pc =33.9 bar. De cp van stikstof is 28 J mol-1 K-1. Bereken de geleverde arbeid in kJ/kmol en de entropieproductie in kJ/(kmol K) met behulp van de departure grafieken.
e
eeei
iiicvcv
cv gzhmgzhmWQdt
dE2
V2
V 22
met 0cv cvi i e e cv cv
trans
dS Q m s m sdt T

November 23, 2010 21

November 23, 2010 22
2 2
1 1
1 2 2 1
1 2,
1 1 2 1
en
28*(300 245) J/mol 1540 J/mol
300 100 245 402.38 2.95 1.94 1.18126 33.9 126 33.9
met behulp van de tabell
CV CV
T TIG IG
pp NT T
R R R R
W h h s sm m
hh h dT c dTT
T p T p
2
1
1 2
1 2
IG2 1
,
en: 0.5 0.31
en 0.21 0.14
J J Jdus 1540 8.31 126K 0.5 0.31 1341 mol mol K mol
s
IG IG
c c
IG IG
CV
TIG
p NT
h h h hRT RT
s s s sR R
Wm
S Ss dTT p
2 2 2
1 1 1
2 2
1 1, ,
245 40 J Jln ln 28ln 8.31ln 1.94300 100 mol K mol K
J J Jdus 1.94 8.31 (0.14 0.21) 2.5mol K mol K mol K
p T pp
pp T pT N p N
CV
c T pVdp dT dp c RT T T p
m
November 23, 2010 23
2 2
1 1
2 2
1 1
2 2 2 1 1 1, ,
,
2
1
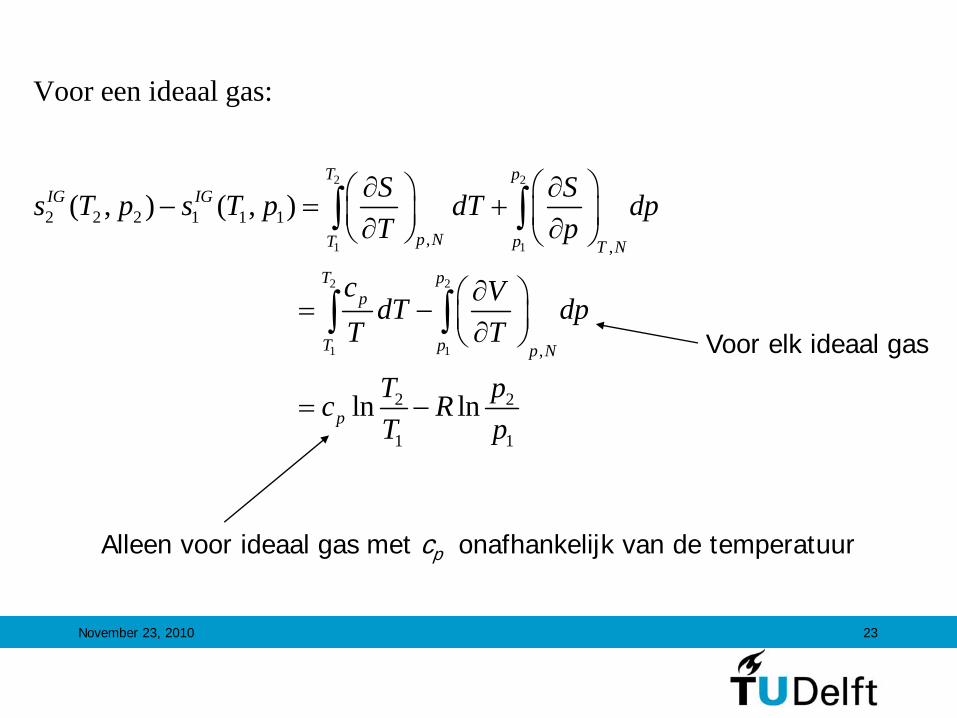
Voor een ideaal gas:
( , ) ( , )
ln ln
T pIG IG
p NT p T N
T pp
T p p N
p
S Ss T p s T p dT dpT p
c VdT dpT T
Tc RT
2
1
pp
Voor elk ideaal gas
Alleen voor ideaal gas met cp onafhankelijk van de temperatuur

November 23, 2010 24
Verandering van H met p
, , ,
,,
,,
T N T N T N
p NT N
p NT N
G U TS pV H TS
G H STp p p
H VV Tp T
H VV Tp T