Embed Size (px)
Citation preview

J. Basic. Appl. Sci. Res., 2(11)11239-11253, 2012
© 2012, TextRoad Publication
ISSN 2090-4304 Journal of Basic and Applied
Scientific Research www.textroad.com
Corresponding Author: Admin Kazemi, Department of Mechanical, Babol University of Technology, Babol, 484, Islamic Republic of Iran.
Thermodynamic Study of Turbofan Engine in Off-Design Conditions
Mofid Gorji, Admin Kazemi, Davood Domiri Ganji
Department of Mechanical, Babol University of Technology, Babol, 484, Islamic Republic of Iran.
ABSTRACT
In this paper Turbofan engine performance graphs including thrust, thrust specific fuel consumption and
thermal, propulsive and the overall efficiencies, also the graphs of turbofan components such as the high pressure and low pressure compressor pressure ratio, exit temperature pressure from high pressure compressor, combustor inlet temperature, corrected inlet mass flow rate of compressor and fan and bypass ratio, that is controlled by the engine control system were drawn based on inlet Mach number and various flight heights. Graphs have been analyzed and the effect of each of the aforementioned parameters was observed on performance graphs. Also, in order to yield more accurate solutions, the method of generating performance graphs has been modified. KEYWORDS: Turbofan, Off-Design ,Mach number.
1. INTRODUCTION
Motor thermodynamic analysis includes assessing changes in thermodynamics of operating fluid passing into engine. This study can be divided into two entirely distinct groups: On-design analysis (Parametric Cycle Analysis) and Off-Design Analysis (engine Performance Analysis). In On-Design Analysis, the geometry of engine is not considered and in studying the performance diagram related to this analysis, each point represents a different engine. It is said that On-Design Analysis examines a Rubber Engine (1). To estimate engine performance in different air conditions, a modeling approach is needed that is capable of describing the behavior of engine components in the absence of On-Design conditions. In the late sixties, it was found sufficient to optimize the engine in a specific working point. But today, mainly for economic reasons, existence of an off-design model is necessary in early stages of design. (2). When a gas turbine engine is designed and built, its degree of freedom depends on available technology, the demands of designer and the engine's main applications (3). When the engine is installed on an aircraft, its efficiency changes with throttle setting and flying conditions and is limited by engine control system (4). The goal of all Off-Design models is to calculate fluid state in different locations of main stream in engine. Using these results, thrust, fuel consumption and all major parameters of engine components can be derived. Cohen and et al in (5) explain that performance properties of individual components of the engine can be obtained from actual test. When engine components are assembled, the performance range of each component is reduced in engine. When the engine is operating in steady speed or equilibrium, depending on the type of gas turbine, equilibrium running zone can be drawn for a range of different speeds on the compressor characteristic curve until equilibrium running line or zone is obtained. When the running condition is determined, running curves of thrust or specific fuel consumption can be achieved. Oates in (4) Explains that Off-Design Analysis can be done in two ways. The first considered case is that efficiencies of components are unknown; therefore they must be estimated as a function of Performance conditions. This method is used to calculate the primary estimate of the engine's performance. In the second case, components of engine have been built and tested; therefore performance characteristics of the engine components are available. Thus, combination performance of compressor, combustion chamber and turbine are predictable. These combined characteristics, called pumping characteristics, can be used to predict the overall performance of engine. Thus, methods of combining each of the components characteristics in order to obtain pumping characteristics are provided.Once this phase has been completed, operating characteristics will be obtained. For simplicity, the example of a turbojet engine is presented. First, simple gas generator equation is obtained and after having been connected to nuzzle, final equations are generated. Also Walsh acquires performance graphs by using β Lines and Referred Performance Charts (3). Mattingly in (6) and (1) analyzes engine performance by replacing constant values obtained in function of engine pressure ratio and temperature ratio, in a state of Off-Design, with values of same function at design point. As will be explained further in this study, recent analysis will be used for analysis of turbofan engines in a state of Off-Design. Suggestions for improving the results are also presented. Zero-dimensional model is used in this analysis. These models, with regard to their simplicity and self-explanatory nature which is independent of the exact geometry of the engine, are among the most commonly used models in the world of turbo-machinery (2).
11239

Gorji et al., 2012
2. Solving Methods and Hypotheses Describing and predicting the engine performance in different flight conditions and throttle settings is done using relationships which are based on the application of mass, energy, momentum and entropy consideration to the steady flow of perfect gas, in a steady state operating point of engine. Also if the relationship between temperature ratio and pressure ratio, in a steady state operating point, is equal to constant value, the constant value can be evaluated at a reference (design) condition that is expressed by the subtitles R. Thus:
)1( RRfctef ,, This method that is based on the replacement of constant values of pressure ratio and temperature ratio
functions in a state of an off-design, with the same function in condition of design point, is alternatively used in problem analysis. Sea-Level Static conditions are considered as design point conditions for values of the gas turbine engine variables (6) and (1). In turbofan engines the considered case is that high-pressure and low-pressure turbine inlet will choke as sonic stream in inlet guide vanes in turbine will be supersonic in the first stage of the rotor and this leads to a more productive power in the turbine. Furthermore, we assume the throat areas where choking in high pressure and low-pressure turbine entrance nozzle occures are constant. this turbines is called Fixed-area Turbine (FAT). These hypotheses are valid in a wide operating range for modern gas turbine engines (6). As well, based on Reference hypotheses (6), pressure ratio of combustion chamber (πb) , main exit nozzle (πn) and bypass exit nozzle (πfn) and efficiency of components towards design point values do not change. Turbine cooling and the leakage effects are ignored and no power is removed from turbine to drive accessories. Gas in upstream and downstream of the combustion chamber is considered calorically perfect. 3. Off-design equations of turbofan
Figure 1 shows a turbofan engine. Turbine and compressor are divided into two parts of low pressure and high pressure. High-pressure turbine drives the high-pressure compressor through High Pressure Spool.also Low-pressure turbine drives fan and low pressure compressor through Low Pressure Spool.
Figure 1) turbofan engine (6)
Mass flow passing through the engine core and fan are Cm and Fm respectively. The ratio of passing mass flow from the fan to passing mass flow from the core is introduced as Bypass Ratio and is shown with α thus:
)2( C
F
mm
The mass flow parameter is a function of Mach number and is defined as follows:
T
PRgM
RTgP
RTgV
RTPVV
Am
APTm
MFP cc
ct
t
,
)3( t
tc
TTPP
RgMMMFP
Also Mass flow ratio of air to fuel in the combustion chamber is defined as follows:
)4( air
fuel
mm
f
Since the exhaust nozzles have fixed areas, this gas turbine has four independent variables including T0,M0,Tt4,P0. Also 11 dependent variables are obtained as follows: High pressure Turbine - inlet mass flow rate of low pressure turbine and high pressure is equal to each other. Therefore:
11240

J. Basic. Appl. Sci. Res., 2(11)11239-11253, 2012
5.45.45.4
5.45.444
4
44 MMFPA
TPmMMFPA
TPm
t
t
t
t
Assuming constant area and choking in these sections cause 4m and 5.4m to have constant values:
cteTT
PP
tH
tH
t
t
t
t
5.4
4
4
5.4
Also, according to the constant value of tH ، tH and tH will have fix values. Low-pressure turbine - inlet mass flow rate of low-pressure turbine is equal to outlet mass flow rate of the exit nozzle:
)()( 999
995.45.4
5.4
5.45.4 MMFPA
TPmMMFPA
TPm
t
t
t
t
)()( 5.49
5.49
9
5
5
5.4
5.4
5
5
9 MMFPAAMMFP
TT
TT
PP
PP
t
t
t
t
t
t
t
t
According to the constant value of9
5
t
t
PP
and 9
5.4
AA
, choking in the low pressure turbine inlet, and
equity 59 tt TT , the above equation with respect to what was expressed in equation 1, can be simplified into the following equations:
)()()()( 995.49
5.4
9
59 R
tLR
tLR
tL
tL
t
t
tL
tL MMFPMMFPcteMMFPA
APPMMFP
)5( )()(
9
9
MMFPMMFP R
tLR
tLtLRtL
)6(
t
t
tLtLtL
1
11
High pressure compressor - according to power balance between turbine and the high-pressure compressor:
11 5.245.2
45.235.25.444 cHtpctHtptmHttpcttptmH TcTc
mmTTcmTTcm
0000
0
0
2
2
5.25.2
5.25.2
5.2
5.2
4 1,11 TTTTT
TT
TTTf
mm
mmm
mm
frrft
t
t
t
tt
ff
RcHRt
RfRrR
pc
pttHmHcH
tfr T
Tctecc
fTT 1)1)(1(1
4
0
4
0
)7( RcHfr
Rfr
Rt
tcH TT
TT )1()(
)/(/1
04
04
Also
)8( 111 cc
cHcHcH
Low pressure compressors – because the low pressure compressor and fan are on a spool, increasing low-pressure compressor enthalpy is proportional with increasing fan enthalpy therefore:
11
111121925.2
fR
cLR
f
cLfcLtttt KKTTKTT
And ratios of temperature and pressure of the low pressure compressor are obtained:
11241

Gorji et al., 2012
)9( 1111
fR
cLRfcL
)10( 111 cc
cLcLcL
From the power balance between the low-pressure turbine, the fan and low pressure compressor we have:
)()()( 55.45.425.2219 ttptmLttpcCttpcF TTcmTTcmTTcm
000
4
4
5.45.4025.4 ,,,1 TT
TT
TTTTTmmfmmmm tH
t
t
ttttCCCFC
)1(1)1()1(5.4
50
2
5.22
2
192
t
ttHptmL
t
ttpc
t
ttpc T
TfTcTTTc
TTTc
)1(1)1()1(
5.4
5
0
2
5.2
2
192
t
t
pc
pttHmL
t
t
t
tt
TTf
cc
TTT
TTT
RtLR
RcLfrR
pc
pttHmL
tL
cLfr ctefcc
)1()1()1(
1)1(
)1()1(
)11(
)1(1)1(1
)/(/
)1(1)1(1
fRcLR
fRRcLR
Rr
r
RtL
tLfRf
and also:
)12( 111 cc
fff
Bypass ratio - in engine core, according to occurrence of choking in high-pressure turbine enterance, fixed inlet area of turbine and constante value of fuel to air ratio, and replacing a constant value with reference values, we have:
Rt
RtCR
t
tC
t
tfC P
Tmcte
fMMFPA
PTm
fMMFP
TAP
fmmmm
4
444
4
44
4
4444 1
)(1
)(1
)13( 4
4
4
4
t
Rt
Rt
t
CR
C
TT
PP
mm
Similarly for passing flow from bypass duct we have:
)(
1)(
)(1919
19
191919
1919
19
1919
RRt
RtFR
t
tF
t
tF MMFPP
Tmcte
AMMFPPTm
MMFPT
APm
)14( )()(
19
19
19
19
19
19
Rt
Rt
Rt
t
FR
F
MMFPMMFP
TT
PP
mm
By replacing relations 2-16 and 2-17 both in relation related to bypass ratio:
)()(
19
19
19
4
4
19
19
4
4
19
Rt
t
Rt
Rt
Rt
Rt
t
t
CR
FR
C
F
MMFPMMFP
TT
TT
PP
PP
mm
mm
According to:
222
5.2
5.2
3
3
4422
2
1919 , tcLcHbt
t
t
t
t
t
tttffnt
t
tt PP
PP
PP
PPPPP
PPP
cLcHb
ffn
t
t
PP
4
19
11242

J. Basic. Appl. Sci. Res., 2(11)11239-11253, 2012
Also consider that 5.219 tt TT
frfrtt
t
t
t
t
t
TT
TT
TT
TT
TT
111
19
5.2
5.2
0
0
0
0
4
19
4
)()(
19
19
4
19
19
4
RfrRt
Rt
Rt
Rt
cLcHb
ffnR MMFP
MMFPTT
PP
R
fr
RfR
cLRcHRR
RRt
Rt
Rt
Rt
b
fnR
fr
f
cLcH
MMFPcte
MMFPTT
PP
MMFP
)()(1
)( 19194
19
19
4
19
)15( )()(
)]/([)/(
19
19
RRfr
fr
f
cLcH
fR
cLRcHR
R MMFPMMFP
Mass flow rate of the engine:
fMMFP
TAP
fMMFP
TAP
PP
PP
PP
PP
PP
fMMFPA
TPmm
trdcLcHb
t
t
t
t
t
t
t
t
t
t
t
tC
1)()1(
1)()1(
1)()1()1(
4
4
40
4
4
40
0
0
0
2
2
5.2
5.2
3
3
4
44
4
40
RrdcLcHR
RtRb
rdcLcH
t
PTm
ctef
MMFPAP
Tm)()1(1
)()1( 0
4044
0
40
)16( 4
4
0
000 )(1
1
t
Rt
RcHcLdr
cHcLdr
RR T
TPPmm
the outlet mach number at the main channel:
)17(
11
2/)1(
9
929
tt
PPM t
If the outlet of the main channel is not choking0
9
9
9
PP
PP tt otherwise
1
9
9
21
t
t
tt
PP
ntLtHbcHfdrt
PP
0
9
exit Mach number in bypass channel:
)18(
11
2/)1(
19
19219
cc
PPM t
If the outlet of the main channel is not choking 0
19
19
19
PP
PP tt Otherwise
1
19
19
21
t
t
tt
PP
fnfdrt
PP
0
19
11243
Gorji et al., 2012
According to above obtained equations, 199 ,,,,,,,,,, MMffcHcHcLcLtLtL are the dependent variables of turbofan engine, which constitute a system consisting of 11 equations. These equations should be solved by Iterative approach to obtain values.
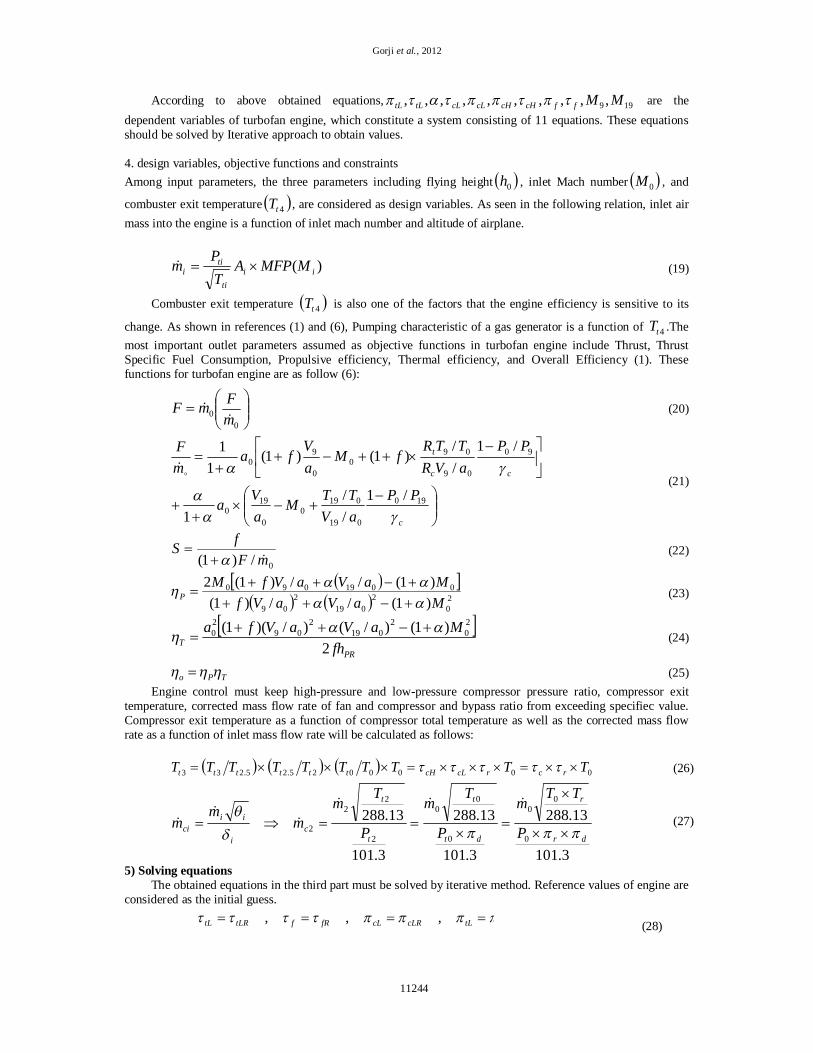
4. design variables, objective functions and constraints Among input parameters, the three parameters including flying height 0h , inlet Mach number 0M , and
combuster exit temperature 4tT , are considered as design variables. As seen in the following relation, inlet air mass into the engine is a function of inlet mach number and altitude of airplane.
)19( )( iiti
tii MMFPA
TPm
Combuster exit temperature 4tT is also one of the factors that the engine efficiency is sensitive to its
change. As shown in references (1) and (6), Pumping characteristic of a gas generator is a function of 4tT .The most important outlet parameters assumed as objective functions in turbofan engine include Thrust, Thrust Specific Fuel Consumption, Propulsive efficiency, Thermal efficiency, and Overall Efficiency (1). These functions for turbofan engine are as follow (6):
)20(
00 m
FmF
)21(
c
cc
t
PPaVTTM
aVa
PPaVRTTR
fMaV
famF
190
019
0190
0
190
90
09
090
0
90
/1//
1
/1//
)1()1(1
1
)22( 0/)1( mF
fS
)23(
20
2019
209
0019090
)1(//)1()1(//)1(2MaVaVfMaVaVfM
P
)24(
PRT fh
MaVaVfa2
)1()/()/)(1( 20
2019
209
20
)25( TPo Engine control must keep high-pressure and low-pressure compressor pressure ratio, compressor exit
temperature, corrected mass flow rate of fan and compressor and bypass ratio from exceeding specifiec value. Compressor exit temperature as a function of compressor total temperature as well as the corrected mass flow rate as a function of inlet mass flow rate will be calculated as follows:
)26( 0000025.25.233 TTTTTTTTTT rcrcLcHtttttt
)27(
3.101
13.288
3.101
13.288
3.101
13.2880
00
0
00
2
22
2dr
r
dt
t
t
t
ci
iici P
TTm
P
Tm
P
Tm
mm
m
5) Solving equations
The obtained equations in the third part must be solved by iterative method. Reference values of engine are considered as the initial guess.
)28( tLcLRcLfRftLRtL ,,,
11244

J. Basic. Appl. Sci. Res., 2(11)11239-11253, 2012
With this assumption, functions of the number (7) to (18) are calculated, this process is repeated until the difference between the values obtained from bypass ratio , low pressure turbine temperature ratio tL , high
pressure compressor temperature ratio cH , low pressure temperature ratio cL and fan temperature
ratio f , are less than 0.0001 from the corresponding values of Previous step. If the mentioned condition is established, solutions obtained as converged solutions are used to calculate the values of performance in relations (20) to (25) . above methods can be used for drawing off-design performance graphs .On the other hand, the engine control system controls the various components performance of gas turbine so that the combuster exit temperature 4tT , high-pressure and low-pressure compressor ratio cLcH , , fan pressure ratio f , the
compressor exit temperature 3tT , corrected mass flow rate of compressor 2cm and bypass ratio do not exceed from permissible values. Some of these limitations including exit temperature of combuster and exit temperature of the compressor are due to limited temperature tolerance of the parts.It also controls mass flow rate in compressor and compressor pressure ratio of low and high pressure compressor to prevent the occurrence of surge and stall in the engine.Controlling the above-Mentioned parameters within the desired range is done by reducing 4tT .Figure 2 shows the flowchart of drawing performance charts of turbofan engine.
Figure 2) Flowchart of drawing performance diagrams of turbofan engine
6. Performance charts
In this part, performance charts of a turbofan engine in off-design condition are obtained. Referred values of engine (design point) in sea level and zero Mach number are as follow:
Reference values of motor (design point)
Initial guess for the values of temperature ratio and pressure ratio of low pressure turbine, temperature ratio of fan and low pressure compressor according to Equation 28
Solving equations 7 to 18
Replacement values obtained from ratio of temperature ratio and pressure ratio of low pressure turbine, temperature ratio of fan and low pressure compressor with previous values.
Difference between the values obtained from
fcLcHtL ,,,, are less than 0.0001 from the corresponding values of previous step.
Are constraints in permissible range?
No
No
Yes
Yes
Calculation of performance functions
Reduction Tt4
11245

Gorji et al., 2012
99.096.099.0997.09915.08815.08512.09636.0
7262.09625.07580.0239.1004.13.14.142800sec76018908428
max
04
dfnnb
bmLmHfcLcHtL
tLtHtHptpctc
PRtcHcLf
CCkgkJhkgmKT
The compressor pressure ratio is limited to 32. Also maximum exit temperature of the combuster and
compressor are 1890 and 890 Kelvin respectively. In this case, bypass ratio, fan and the compressor pressure ratio, combuster and compressor exit temperatures and corrected mass flow rate of compressor and the fan are controlled by engine controller. Turbofan engine performance charts based on variables of flight speed, at different altitude are drawn and presented. In figure 3 changes in the thrust is drawn versus mach number at various flight heights. As can be seen, as altitude increases, flight speed change has less effect on the thrust. As in 12h thrust is almost constant. Also in 0h and 5.1h an increase in flight speed led to a significant decrease in the thrust force. For a closer look, three heights of 0h , 3h and 9h are being investigated. Investigation in kmh 0 In Figures 9 and 10 corrected mass flow of the compressor and fan are drawn respectively. cCm (figure 9)
will reduce from Design amount sec3.85 kg in zero mach number to sec77.57 kg in mach number one.
Similary cFm (figure 10) will reduce from Design amount sec38.682 kg to sec93.564 kg . In both charts of
Figures 9 and 10 it can be seen that the amount of cCm and cFm are below the critical values.
In Figure 8, with
an increase in flight Mach number, 0m increases from amount designed in zero Mach number sec760 kg , to
amount sec1060 kg . Figure12 shows changes of fan pressure ratio based on Mach number. Fan pressure ratio decreased from a value of 2 in zero Mach number to value 1.598 in Mach number one. Figure 15 shows the Compressor pressure ratio decreases with increasing Mach number. In figures 13 and 14, these changes are presented separately for the low-pressure compressor and high pressure compressor. In Figure 15, with increasing Mach number from zero to one, compressor pressure ratio decrease at the rate of 57% from the amount of 32. Similarly this decreasing in the low-pressure compressor and in high pressure compressor is 87% and 66% (figure 13 and 14). The incremental change of Bypass ratio from its design point in zero Mach number to 10.31 in Mach number one is shown in Figure 11. Also Incremental Changes of compressor exit temperature 3tT versus increases in flight speed is shown in Figure 16. These changes start from K884 in Zero Mach number and continue to Mach number 44.0 . From Mach number 44.0 to Mach number one, the maximum increase in temperature would be controlled at K890 . This control is done by reducing the exit temperature of the Combustor 4tT .Therefore, as seen in Figure 17 ,in Mach number range between 0 and 0.44, 4tT remains
in design amount of K1890 and then is reduced to maintain 3tT at its maximum value and this continues until
Mach number one. At this point 4tT reaches K1817 .In Figure 18 the core ratio of inlet pressure to exit
pressure 90 PP , from value of 0.91 in zero Mach number reaches to 8353.0 in Mach number one . This graph
has break in a flight Mach number of 44.0 , which is due to control 3tT . In figure 19, bypass inlet to exit pressure
190 PP changes rates, increases by increasing the Mach number. Also this function decrease from value of 966.0 in zero Mach number to value of 639.0 in Mach number one.
Investigation in kmh 3 As it can be seen in figure 3, the chart has a breakpoint in flight Mach number 6.0 . Also, it is seen that
thrust decreases with an increase in Mach number. The breakpoint is due to the fact that all of constraints functions in figure 9 to 14 have reached their design value in Mach number 6.0 , thus, by decreasing 4tT (Figure
17) they are maintained at their design value. As seen in Figure 17, 4tT in Flight Mach numbers less than 0.6 is
less than its design value. Also, in Mach numbers higher than 0.76 the value of 4tT decrease from its maximum
value. This is due to the fact that in this range, function of 3tT (Figure 16) has reached its maximum value. As
11246

J. Basic. Appl. Sci. Res., 2(11)11239-11253, 2012
can be seen in figure 16, 3tT increases with increase in flight Mach number. The mentioned figure has two
breakpoints, in flight mach 0.6, due to a decrease in the amount of 4tT in order to control constraints and in
flight Mach number 0.76, as 3tT has reached its maximum value. As can be seen in Figures 18 and 19, two
functions 90 PP and 190 PP decrease with increase in Mach number values and have break points in Mach number 0.6. Investigation in kmh 9
As can be seen in Figure 3, in all Mach number values, thrust is nearly constant. There is no break in the curve. This is due to the fact that all constraints have reached the values of design extrema (figures 9-14) and have been controlled as 4tT decreases from value 1890K (Figure 17). Therefore, in Figure 17, the 4tT graph for all values of flight Mach numbers is less than 1890K and It is evident that it increases as Flight Mach number increases. As seen in Figure 16, values of 3tT for all flight Mach number range is less than the maximum values and the changes trend is rising with increasing flight Mach number.
Know we'll examine other objective functions. Figure 4 shows changes of specific fuel consumption in terms of the Mach number. As can be seen, specific fuel consumption will be increased with constant rate with increasing of Mach number. Figure 5 shows the change of thermal efficiency with flight mach Number at various heights. It is seen that thermal efficiency decreases when Mach number increases. Also, in range of flight Mach values 0 to 0.2 thermal efficiency remains constant in all flight heights. Figure 6 shows increasing change of thrust efficiency by flight Mach number. As it is seen, in flight mach values 0 to 0.35 thrust efficiency doesn’t change in various heights. This difference reaches its maximum amount in Mach number one. Figure 7 shows changes graph of overall efficiency in terms of Mach number values. As can be seen, in zero kilometers height, the overall efficiency increases as Mach number increases and reaches its maximum(0.2283) in Mach number 63.0 and then decreases. Also in the range of flight mach values 0 to 0.2, thrust efficiency is not affected by change of height.
11247

Gorji et al., 2012
8
10
12
14
16
18
20
22
0 0.2 0.4 0.6 0.8 1
Mach number
Thru
st sp
ecifi
c fu
el c
onsu
mpt
ion
[(m
g/se
c)/N
]
h=0,1.5,3,4.5,6,7.5km
h=11,12 km
Figure 4) Thrust Specific Fuel Consumption based on flight
Mach number at various heights
0
50000
100000
150000
200000
250000
300000
0 0.2 0.4 0.6 0.8 1
Mach number
Thru
st (N
)
1.5
3
4.5
h=0 km
6 7.5
911
12
Figure 3) thrust based on flight Mach number at various
heights
0
0.1
0.2
0.3
0.4
0.5
0.6
0.7
0.8
0.9
0 0.2 0.4 0.6 0.8 1
Mach number
Prop
ulsi
ve e
ffici
ency
h=0,1.5,3,4.5k
h=6,7.5,9,11,12k
Figure 6) propulsive efficiency based on flight Mach
number at various heights
0.1
0.15
0.2
0.25
0.3
0.35
0.4
0.45
0 0.2 0.4 0.6 0.8 1
Mach number
Ther
mal
effi
cien
cy
h=0,1.5,3,4.5km
h=6,7.5,9,11,12km
Figure 5) Thermal efficiency based on flight Mach number at
various heights
0
200
400
600
800
1000
1200
0 0.2 0.4 0.6 0.8 1
Mach number
Mas
s flo
w ra
te (k
g/se
c)
1.5
3 4.5
h=0 km
6 7.5
911
12
Figure 8) mass flow rate based on flight Mach number at
various heights
0
0.05
0.1
0.15
0.2
0.25
0 0.2 0.4 0.6 0.8 1
Mach number
Ove
ral e
ffici
ency
h=0,1.5,3,4.5k m
h=6,7.5,9,11,12km
Figure 7) overall efficiency based on flight Mach number at
various heights
11248

J. Basic. Appl. Sci. Res., 2(11)11239-11253, 2012
550
570
590
610
630
650
670
690
710
0 0.2 0.4 0.6 0.8 1
Mach number
Corr
ecte
d m
ass f
low
rate
of F
an (k
g/se
c) 1.5
3 4.5
h=0 km
6
h=7.5,9,11,12km
Figure 10) corrected mass flow rate of fan based on flight
Mach number at various heights
50
55
60
65
70
75
80
85
90
0 0.2 0.4 0.6 0.8 1
Mach number
Corr
ecte
d m
ass f
low
rate
of C
ompr
esso
r(k
g/se
c)
1.5
3 4.5
h=0 km
6
h=7.5,9,11,12km
Figure 9) corrected mass flow rate of compressor based on
flight Mach number at various heights
1.5
1.6
1.7
1.8
1.9
2
2.1
0 0.2 0.4 0.6 0.8 1
Mach number
Fan
pre
ssur
e ra
tio
h=7.5,9,11,12km
1.5
3 4.5
h=0 km
6
Figure 12) fan pressure ratio based on flight Mach number
at various heights
7.5
8
8.5
9
9.5
10
10.5
0 0.2 0.4 0.6 0.8 1
Mach number
Bypa
ss ra
tio
1.5
3
4.5
h=0 km
6
h=7.5,9,11,12km
Figure 11) bypass ratio based on flight Mach number at various
heights
2.6
2.8
3
3.2
3.4
3.6
3.8
4
4.2
0 0.2 0.4 0.6 0.8 1
Mach number
Low
pres
sure
com
pres
or p
ress
ure
ratio
1.5
3 4.5
h=0 km
6
h=7.5,9,11,12km
Figure 14) Low pressure compressor pressure based on
flight Mach number at various heights
6.8
7.2
7.6
8
0 0.2 0.4 0.6 0.8 1
Mach number
high
pre
ssur
e co
mpr
esso
r pre
ssur
e ra
tio
1.5
3 4.5
h=0 km
6
h=7.5,9,11,12km
Figure 13) high pressure compressor pressure ratio based on
flight Mach number at various heights
11249

Gorji et al., 2012
650
700
750
800
850
900
0 0.2 0.4 0.6 0.8 1
Mach number
Com
pres
sor e
xit t
empa
ratu
re-T
t3 (K
)
1.5
3
4.5
h=0 km
6
7.5
9
11,12
Figure 16) Compressor exit temperature based on flight
Mach number at various heights
18
20
22
24
26
28
30
32
34
0 0.2 0.4 0.6 0.8 1
Mach number
Com
pres
sor p
ress
ure
ratio
h=7.5,9,11,12km
1.5
3 4.5
h=0 km
6
Figure 15) Compressor pressure ratio based on flight Mach
number at various heights
0.4
0.5
0.6
0.7
0.8
0.9
1
0 0.2 0.4 0.6 0.8 1
Mach number
Inle
t pre
ssur
e/E
xit p
resu
rre
of c
ore
stre
am-P
0/P 9
h=0 km
1.5
3
4.5
6
h=7.5,9,11,12km
Figure 18) Inlet to exit pressure of core stream based on
flight Mach number at various heights
1400
1500
1600
1700
1800
1900
0 0.2 0.4 0.6 0.8 1
Mach number
Com
bust
er e
xit t
empe
ratu
re(T
hrot
tle se
tting
)-T t
4 (K)
h=0 k m
1.5
3
4.5
6
7.5
9
11,12
Figure 17) Combuster exit temperature (throttle setting) based
on flight Mach number at various heights
0.5
0.55
0.6
0.65
0.7
0.75
0.8
0.85
0.9
0.95
1
0 0.2 0.4 0.6 0.8 1
Mach number
Inle
t pre
ssur
e/E
xit p
resu
rre o
f byp
ass
strea
m-P
0/P 1
9
h=0,1.5,3,4.5,6km
h=7.5,9,11,12km
Figure 19) Inlet to exit pressure of bypass stream based on flight Mach number at various heights
11250

J. Basic. Appl. Sci. Res., 2(11)11239-11253, 2012
7) Corrective suggestion As illustrated in part 4, to obtain the performance graph in various flight conditions, equations set 7 to 18
should be solved respectively for turbofan engines by iterative method. As suggested In reference (6), this repetition continues until the difference between the temperature ratio of the low pressure turbine, in two consecutive steps is less than 0.0001. However, as can be seen in table 1, temperature ratio and pressure ratio values of fan obtained from this method are not applicable to relation (12). Because as seen in relation (5), when 199 RMM , the new value of pressure ratio will not change to its previous state and when is substituted in the relation (6), the same values will be produced for temperature ratio and the circle will stop. Therefore, according to part 5 and the flowchart in figure 2, in this study repetition continues until the difference between values of bypass ratio , low pressure turbine temperature ratio
tL , high pressure compressor
temperature ratio cH , the low pressure compressor temperature ratio cL and fan temperature ratio f , from corresponding values of the previous step will be less than 0.0001. Fan pressure and temperature ratio values obtained from two methods are shown in Table (1). The values obtained from the modified method are applicable to relation (12). In this section, engine referred values (design point) in sea level and zero Mach number are as follow:
97.098.096.0995.099.0
8898.08791.0914.07436.0906.08901.0239.1004.13.14.14.42798
sec3597.45778.17775425
max
04
dfnnbbmLmH
fcLcHtLtLtH
tHptpctcPR
tcHcLf
CCkgkJhkgmKT
Table 1: various values of fan temperature and pressure ratio ff , obtained from research and referred
proposed method (6), at various flight Mach KTkmh t 778.1777,0 4 M=0 M=0.2 M=0.4 M=0.6 M=0.8 M=1
f Results of the present study: 1.2461 1.2429 1.2334 1.2189 1.201 1.1813
f Results of the present study: 2 1.9833 1.9357 1.8645 1.7787 1.6877
f Results of relation (2-23) based on obtained f from
the present study.
2 1.9833 1.9357 1.8644 1.7787 1.6877
f Results of referred proposed method (6): 1.2461 1.2429 1.2337 1.2195 1.2019 1.1826
f Results of referred proposed method (6): 2 1.9857 1.9449 1.8835 1.8094 1.7301
f Results of relation (2-23) based on obtained f from
referred proposed method (6):
2 1.9836 1.937 1.8672 1.7831 1.6938
In Continue ,present results will be compared with the results obtained from PERF* software uploaded by
Jack Mattingly- the writer of (6) and the (1) - on his personal website (7). This program calculates thrust and fuel specific consumption for turbofan engine.In figures 20 to 24, the results obtained from the PERF software and this study are compared.As it can be seen, Slight differences in terms of flight Mach variable are seen in higher mach numbers, which are resulted by method of solving equations which is examined in this section.
* Performance Analysis of Gas Turbine Engines-Version 3.11
11251

Gorji et al., 2012
15
17
19
21
23
25
27
29
0 0.2 0.4 0.6 0.8 1
Mach number
Thru
st sp
ecifi
c fu
el c
onsu
mpt
ion
[(m
g/se
c)/N
]
Perf This Research
Figure 21) Specific Fuel Consumption based on Mach
number: Comparison of results obtained of this research and the results obtained of. Perf software
10000
11000
12000
13000
14000
15000
16000
17000
18000
19000
0 0.2 0.4 0.6 0.8 1
Mach number
Thru
st(N
)
Perf This Research
Figure 20) Thrust based on Mach number: Comparison of
results obtained of this research and the results obtained of. Perf software
1.65
1.7
1.75
1.8
1.85
1.9
1.95
2
2.05
0 0.2 0.4 0.6 0.8 1
Mach number
Fan
pre
ssur
e ra
tio
Perf This Research
Figure 23)Fan pressure ratio based on Mach number:
Comparison of results obtained of this research and the results obtained of. Perf software
10
11
12
13
14
15
16
17
0 0.2 0.4 0.6 0.8 1
Mach number
Com
pres
sor p
ress
ure r
atio
Perf This Research
Figure 24) Compressor Pressure ratio based on Mach number: Comparison of results obtained of this research and the results
obtained of. Perf software
4.9
5.1
5.3
5.5
5.7
5.9
6.1
0 0.2 0.4 0.6 0.8 1
Mach number
Byp
ass r
atio
Perf This Research
Figure 24) bypass ratio based on Mach number: Comparison of results obtained of this research and the results obtained of.
Perf software
11252

J. Basic. Appl. Sci. Res., 2(11)11239-11253, 2012
8. RESULT Various methods examined to check off-design performance of turbofan engine,that have been generally
addressed in various references. By investigating these methods to obtain performance graphs of turbofan engines, the method presented in references (1) and the (6) were used and also solution algorithm for more accurate solutions obtained were corrected. Turbofan engine performance graphs as well as the constraints functions that are controlled by the controller based on flight Mach number and in various heights were accurately drawn and discussed.
REFERENCES
1. Mattingly, J D; Heiser, W H; Pratt, D T;. Aircraft Engine Design. 2nd. Reston : AIAA Education Series,
2002. ISBN-10:1563475383.
2. NATO technical report. Performance Prediction and Simulation of Gas Turbine Engine Operation. Hull : St. joseph corporation company, 2002. RTO-TR-044 AC/323(AVT-018)TP/29.
3. Walsh, Ph and Fletcher, P. Gas Turbine Performance. 2nd. Derby : WileyBlackwell, 2004. ISBN-10:063206434X.
4. Oates, G C. Aerothermodynamics of Gas Turbine and Rocket Propulsion. 3rd. Reston : AIAA Education Series, 1997. ISBN-10: 1563472414.
5. Cohen, H, Rogers, G and Saravanamuttoo, H. Gas turbine theory. 5th Edition. New Jersey : Prentice Hall, 2001. ISBN:013015847X.
6. Mattingly, J D. Elements of Gas Turbine Propultion. Virginia : AIAA Education series, 2006. ISBN:1-56347-779-3.
7. Mattingly, Jack. http://www.jsmatt.com/custom1.html. [Online]
11253